1. Introduction
Since the development of a centimeter-level accuracy positioning techniques in real-time, based on the integer ambiguity resolution of the Global Navigation Satellite System (GNSS) measurements, there have been great advances in real-time kinematic (RTK) applications. Under the conventional RTK, raw measurements for the reference station are transmitted to the rover for the integer ambiguity resolution and final coordinate estimation [
1]. Therefore, most common errors can be cancelled out by differential techniques. However, single-base RTK baseline length should not exceed 20 km in practice [
2] due to distance-dependent biases, such as ionospheric and tropospheric delays. New approaches, such as Virtual Reference Stations (VRS), Flächen Korrektur Parameter (FKP), and/or Master-Auxiliary corrections (MAX) were introduced in mid-1990s. These new approaches are known as network RTK (NRTK or RTN), and were successfully used for more than a decade in many applications, especially navigation and surveying.
The aim of RTN is to minimize the influence of the distance-dependent errors from a network of permanent GNSS receivers [
3] on estimated coordinates at the rover. Precise models of the error sources derived from the whole reference network are interpolated at the rover’s position [
4]. The typical RTN procedure consists of (1) network ambiguity resolution at the master control, based on the known coordinates of the reference stations; (2) estimation of distance-dependent correction model coefficients; and (3) transmission of the coefficients to the user (or rover). Real-time modeling of a reference network and reliable instantaneous ambiguity resolution are required in a short period of time [
5,
6,
7,
8]. Due to the different temporal variations of the dispersive and non-dispersive errors, the update rate of the coefficients should be adequately selected (for example, every 10 s for ionospheric delay and 60 s for orbit and tropospheric errors). Several interpolation methods, such as linear interpolation and least-squares collocation (LSC), have been analyzed in detail [
3,
9]. All methods can significantly reduce the distance-dependent biases in the measurements with a similar performance or comparable accuracy levels. The state-space modeling to better represent the error characteristics (or physical error sources) was suggested by [
10], where all error components can be consistently modeled with high accuracy.
The performance analysis, including quality assurance, of RTN was evaluated by many researchers, mostly focusing on the accuracy of the interpolated corrections, positioning accuracy, and initialization time required for precise positioning [
11]. Most RTN methods currently used in the industry, such as VRS, FKP, and MAX, provide comparable performance in terms of accuracy and precision of the final solution [
3,
12], while some differences exist with regards to the processing load, the application of the interpolation algorithm, and the bandwidth of the correction information [
13]. It is worthy of notice that the addition of GLONASS observables does not necessarily mean a significant improvement in the RTN results [
14]. It is also known that the Radio Technical Commission for Maritime Services (RTCM) version (2 or 3) and/or new proprietary format for the transmission of the corrections have no immediate relationship with the accuracy of the real-time solutions [
9,
15].
National Geodetic Survey (NGS) guidelines for establishing GNSS-derived ellipsoidal (NGS-58) and orthometric (NGS-59) heights were published in 1997 and 2008, respectively [
16,
17]. Since then, there have been tremendous advancements in GNSS, particularly in receiver/antenna technology, as well as data processing algorithms and software. In addition, GNSS modernization, including new signals, is underway, and new constellations of GNSS with better satellite orbits are also available. The vertical reference frame, the North American Vertical Datum of 1988 (NAVD 88), was realized based on a nationwide passive network determined using differential geodetic leveling. With recent advances, such as precise hybrid geoids (for example, GEOID12A), the costly, time-consuming leveling process can be replaced by GNSS-derived heights, though the extent depends on the specific application.
Given the recent advancement in real-time technology, new specifications and guidelines are needed for reliable determination of GNSS-derived heights, including consideration of data collection methods and other factors. While most of the studies on the performance of RTK/RTN deal with the accuracy and/or precision of the final coordinates in a controlled environment [
2,
3,
7], we tested the applicability of RTN for height determination using Continuously Operating Reference Station (CORS) networks under realistic field conditions. Since the performance of the RTN is related to many factors, we also focused on the effect of different types of antennas, baseline lengths, solution types, and data collection method of RTN.
2. Data Collection
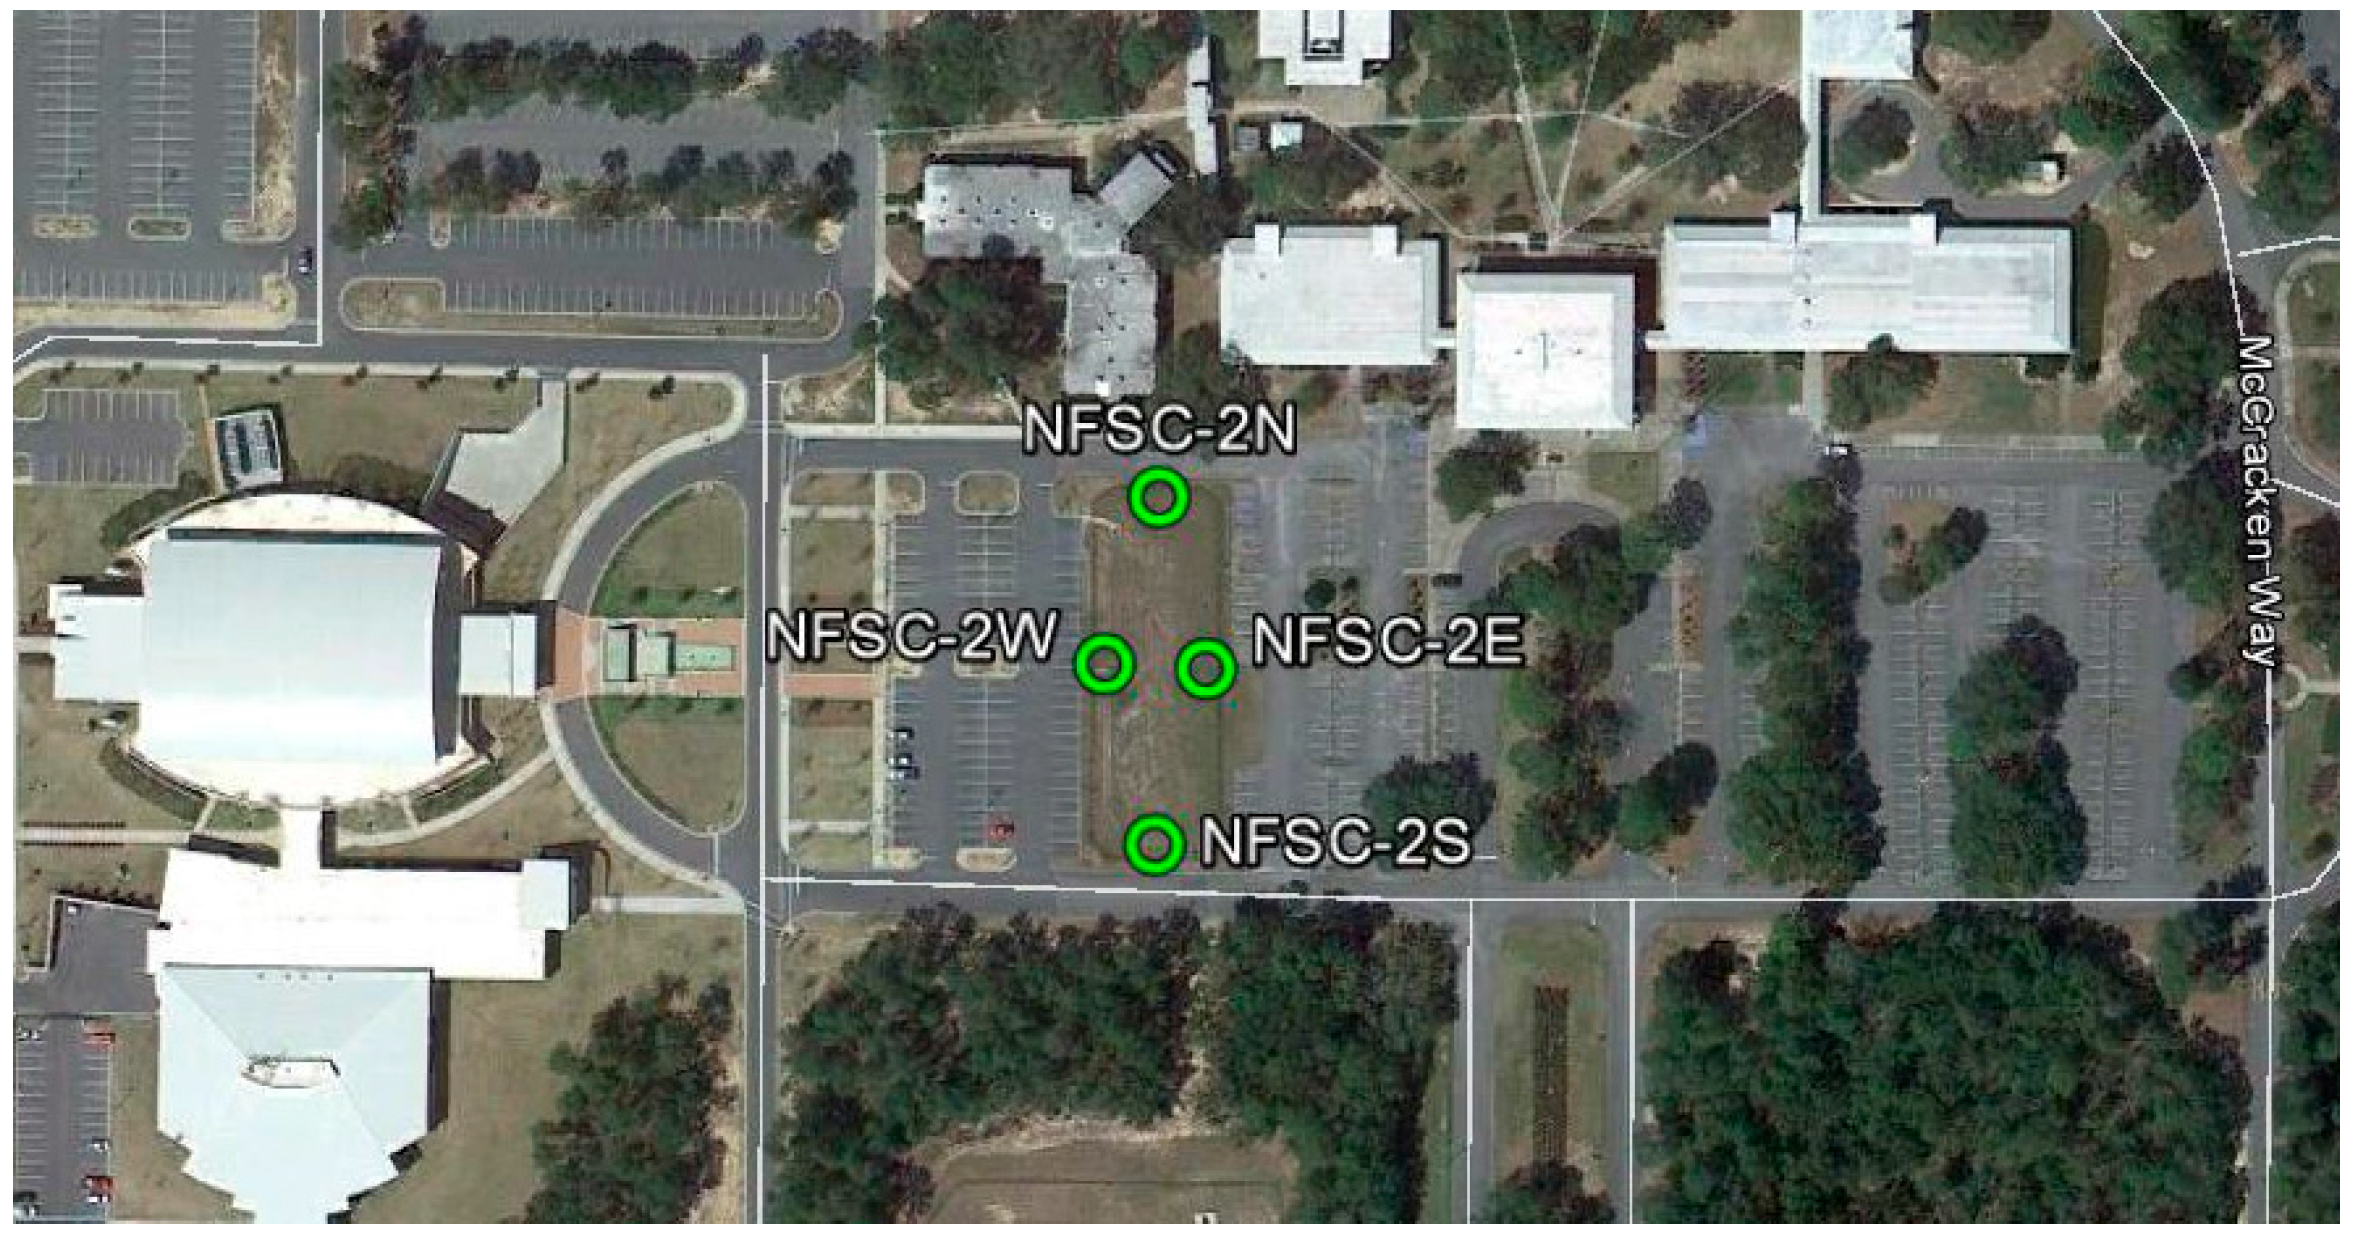
In this research, two types of experiments were conducted in late 2013 [
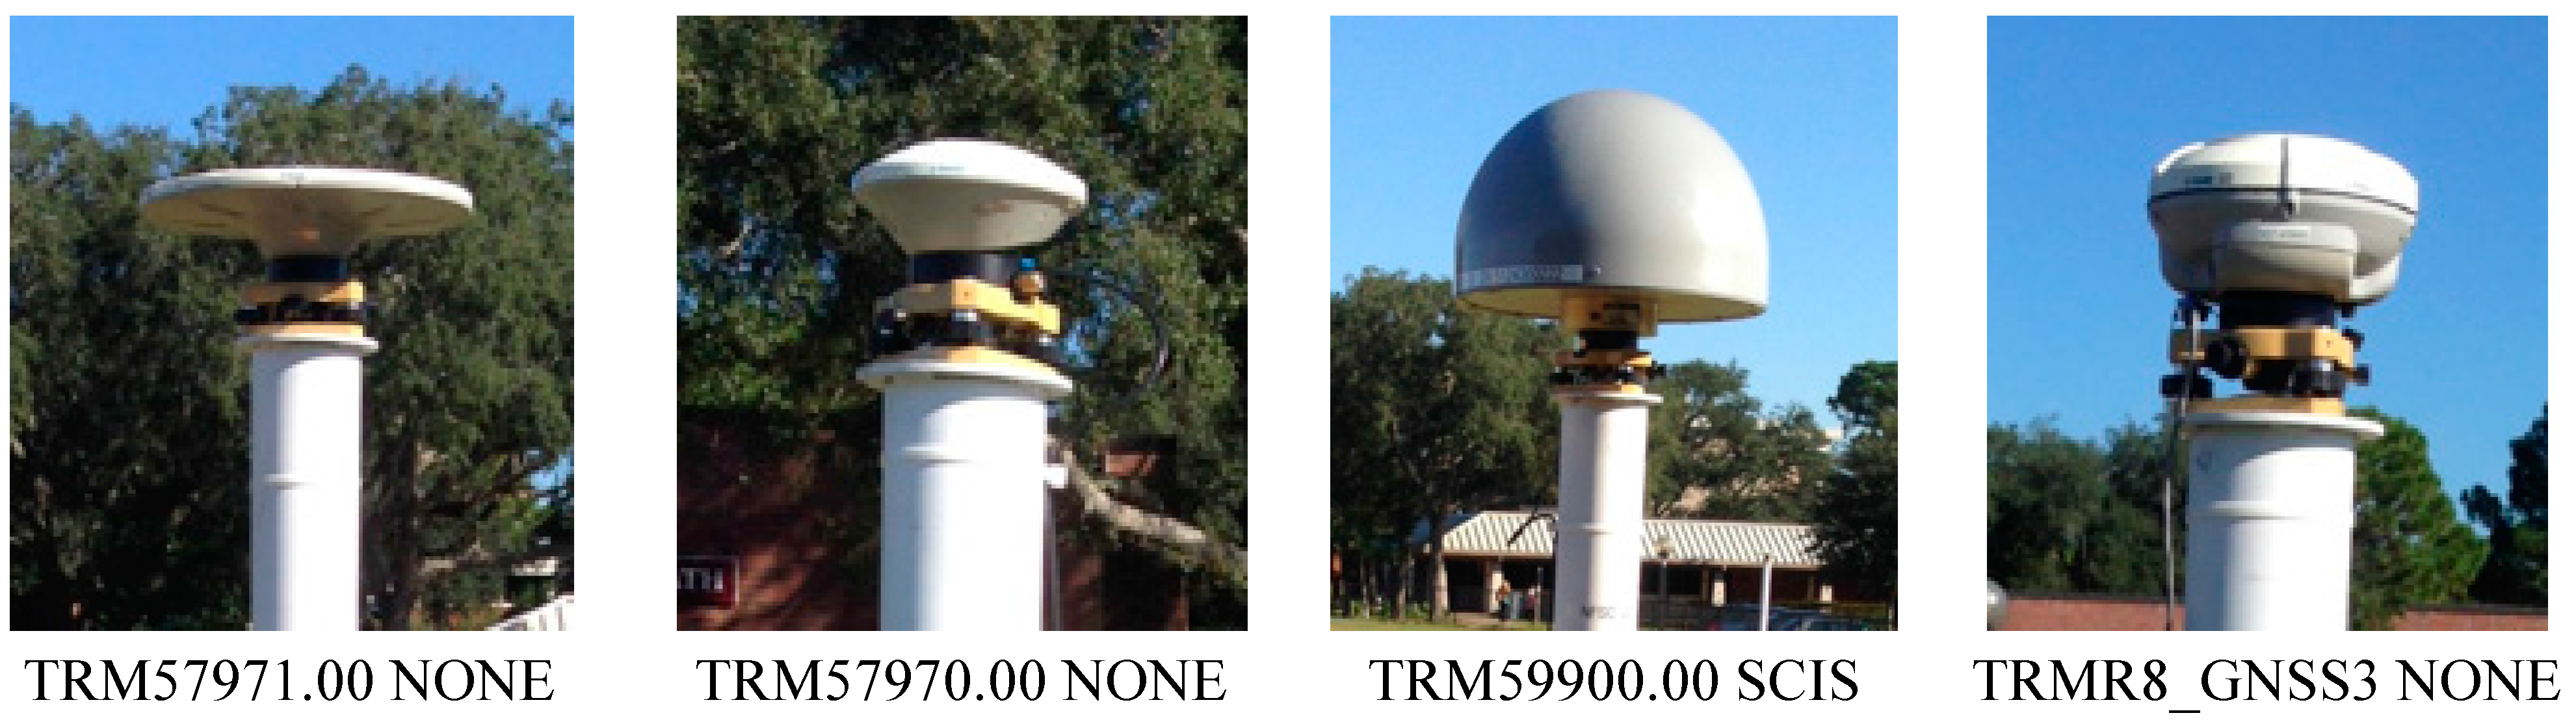
18]: Vertical Precision phase (Phase 1) and Height Modernization GPS Benchmarks (GPSBMs) phase (Phase 2). During Phase 1, the effect of different receiver/antenna combinations and the repeatability of the solutions were investigated using both static and RT solutions. Four new marks were set up in Niceville, Florida within a diamond shape, separated by about 25 m (from EAST to WEST) and 70 m (from NORTH to SOUTH). As can be seen in
Figure 1, these four marks have different multipath conditions, that is, some obstructions in the north and south and a slight possibility of multipath by trees on the east. The final leveled heights are summarized for reference, which denotes the relative heights with respect to the lowest station on the east (
Table 1).
Figure 1.
Plan view of new marks in Phase 1 [
18].
Figure 1.
Plan view of new marks in Phase 1 [
18].
Table 1.
Leveled heights of study site monuments (Phase 1) with respect to the lowest station (NFSC-2E) [
18].
Table 1.
Leveled heights of study site monuments (Phase 1) with respect to the lowest station (NFSC-2E) [18].
| Station | Height Differences (m) | Ellipsoid Minus Leveled Ht Diff (m) | Geoid Heights (m) |
|---|
| Leveled | Ellipsoid | GEOID12A | USGG2012 |
|---|
| NFSC-2E | 0.0000 | 0.0000 | 0.0000 | −27.348 | −28.528 |
| NFSC-2N | +0.0032 | +0.0041 | +0.0009 | −27.347 | −28.527 |
| NFSC-2S | +0.0180 | +0.0199 | +0.0019 | −27.348 | −28.528 |
| NFSC-2W | +0.4387 | +0.4407 | +0.0020 | −27.348 | −28.527 |
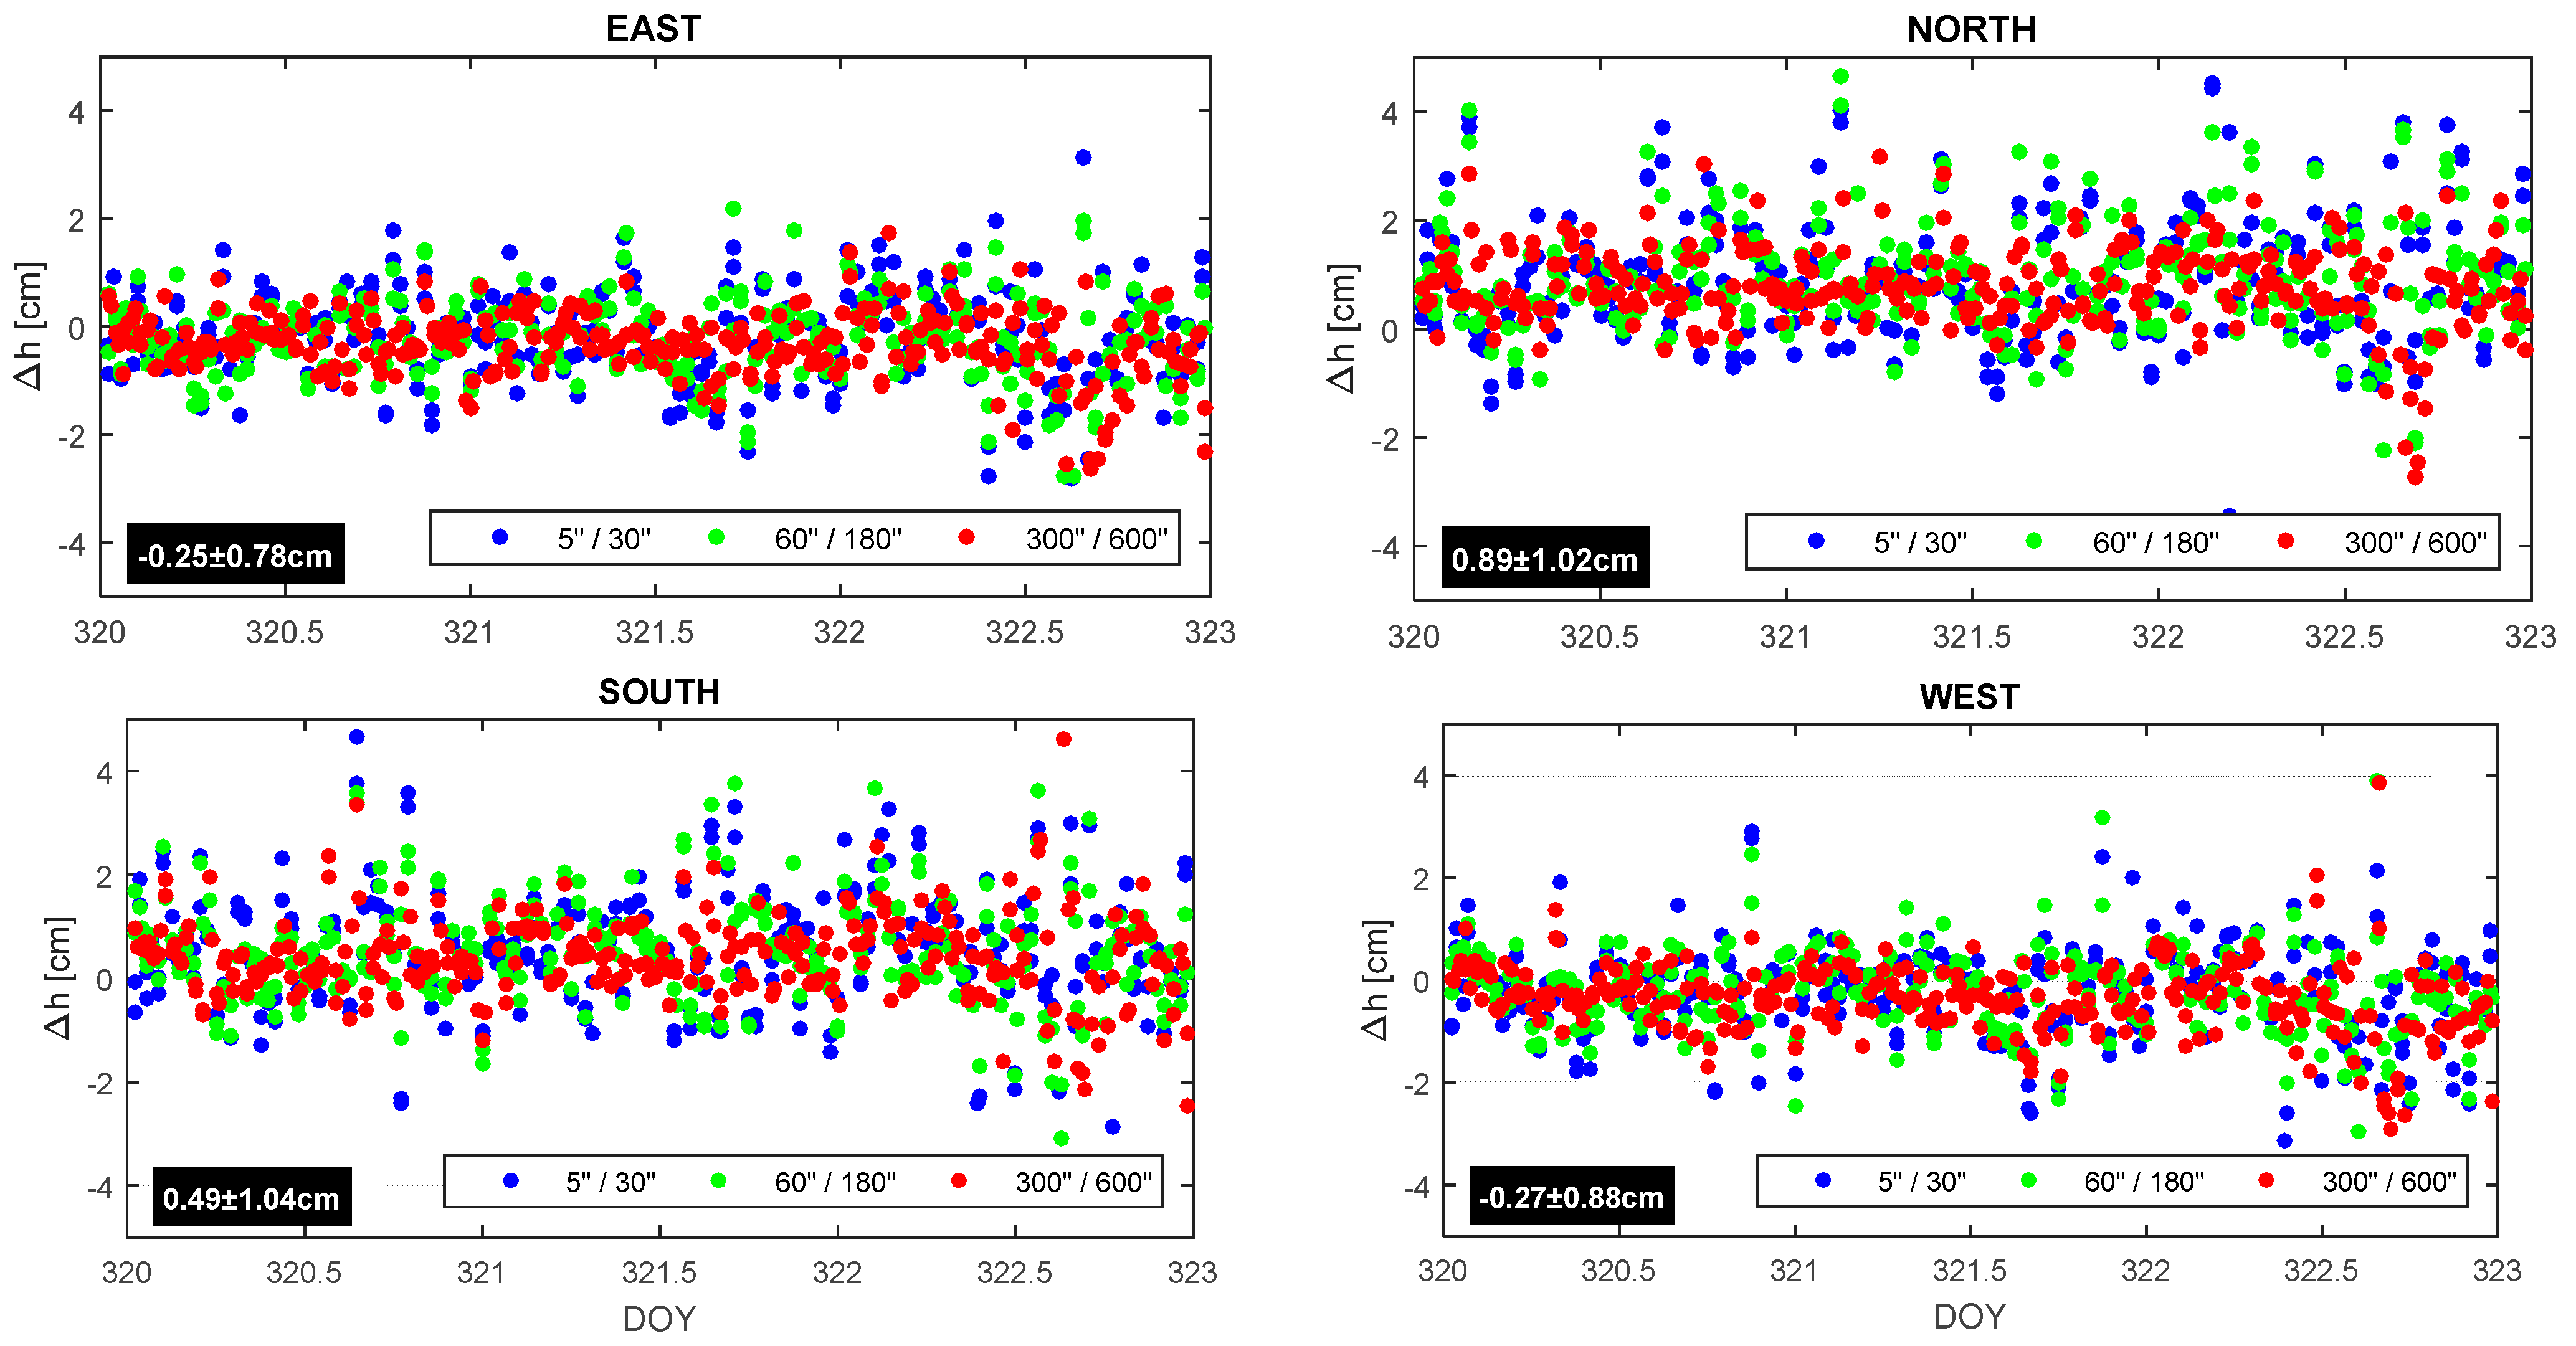
The RTN involves multiple reference stations, either the CORS stations or a temporary network established for a specific purpose. The RT data can be categorized into three groups in this study: multiple-epoch single-base RT (RTK), multiple-epoch network RT (mRTN), and single-epoch network RT (sRTN). The RTN solutions were obtained by either GPS only or GNSS (GPS+GLONASS) with different occupation times, but only the GNSS case is considered in this study. For the reference coordinates of the static survey, each site was continuously occupied for 72 h (three days), followed by the antenna swap for the next session (see
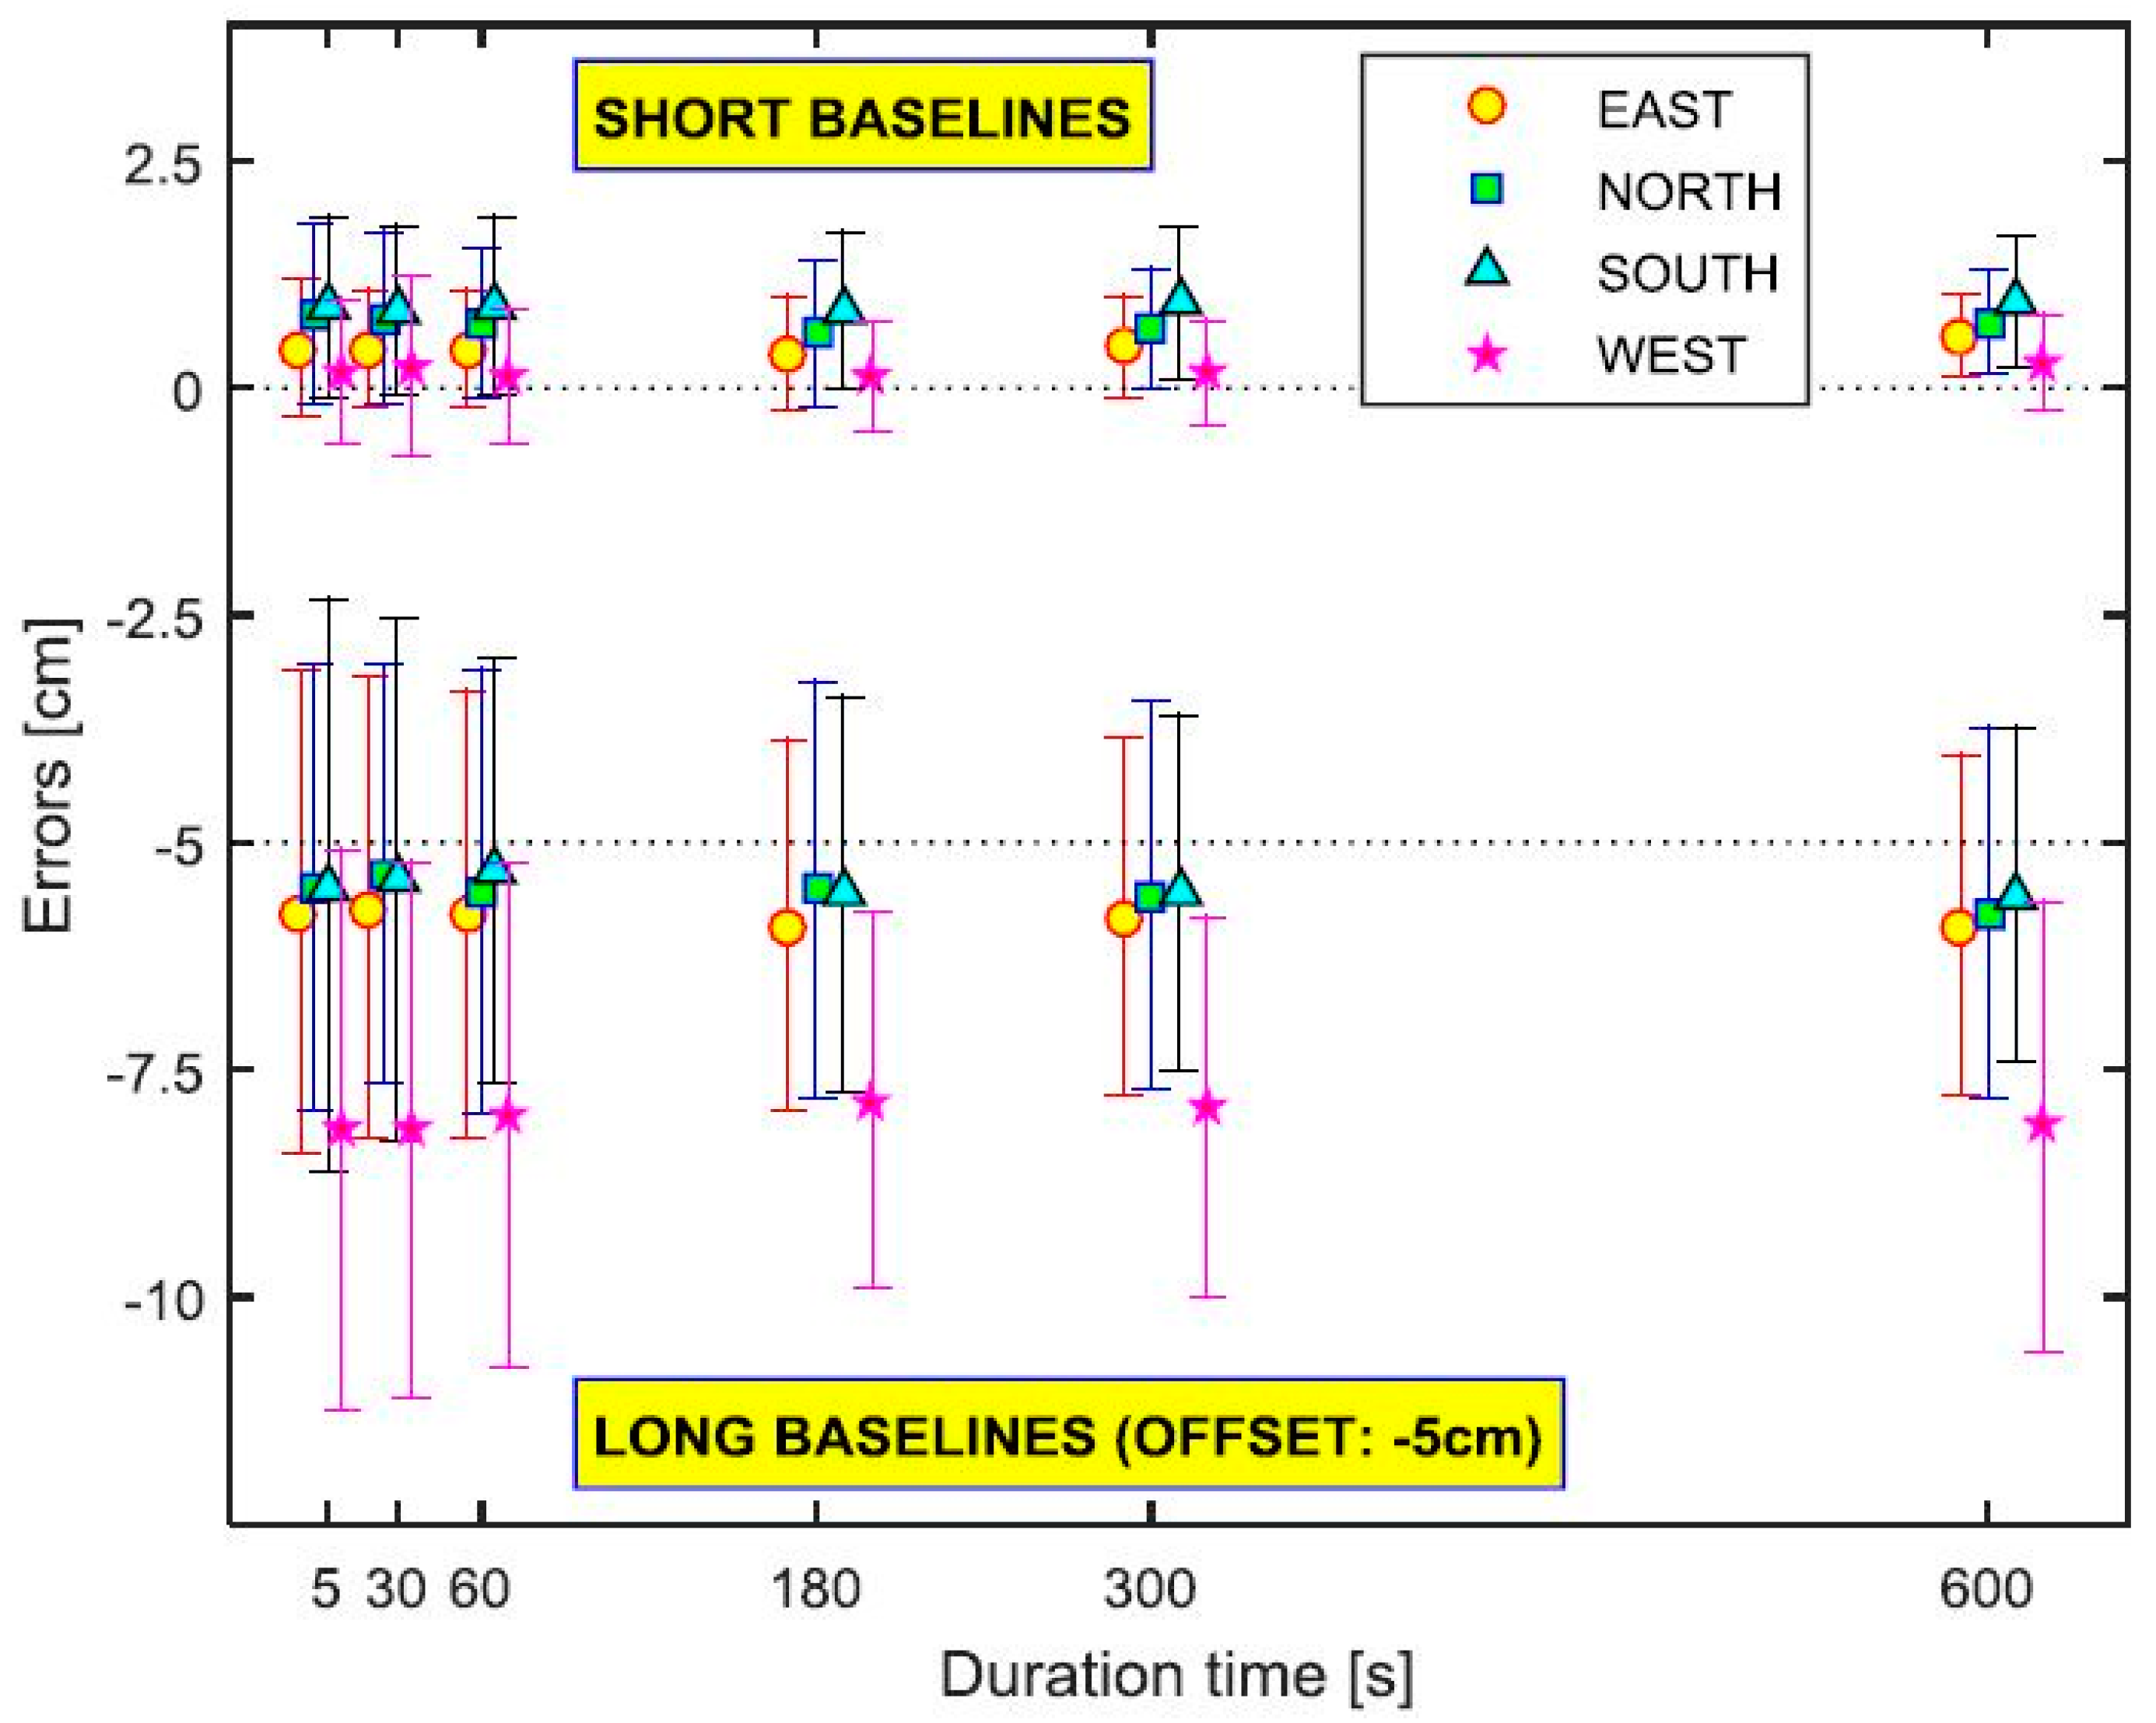
Table 2). Note that the same receiver/antenna combination is used for all RT solutions of Phase 1. Data collection interval is 1 Hz for both post-processing and real-time (RT) solutions. The mRTN solutions consist of a series of six positions with different durations of five, 30, 60, 180, 300, and 600 s, respectively.
Table 2.
Receiver and antenna information for static surveying.
Table 2.
Receiver and antenna information for static surveying.
| | EAST | NORTH | SOUTH | WEST | Note |
|---|
| Set 1 | Zephyr Geodetic 2 RoHS | Zephyr-Model 2 RoHS | GNSS-Ti Choke SCIS | R8 GNSS/SPS88x Internal | |
| TRM57971.00 NONE | TRM57970.00 NONE | TRM59900.00 SCIS | TRMR8_GNSS3 NONE | IGS model |
| R7 GNSS | R7 GNSS | R7 GNSS | R8 Model 3 | Receiver |
| Sets 2–4 | Receiver/antenna combination moves in the following order:
NORTH ➔ EAST ➔ SOUTH ➔ WEST ➔ NORTH |
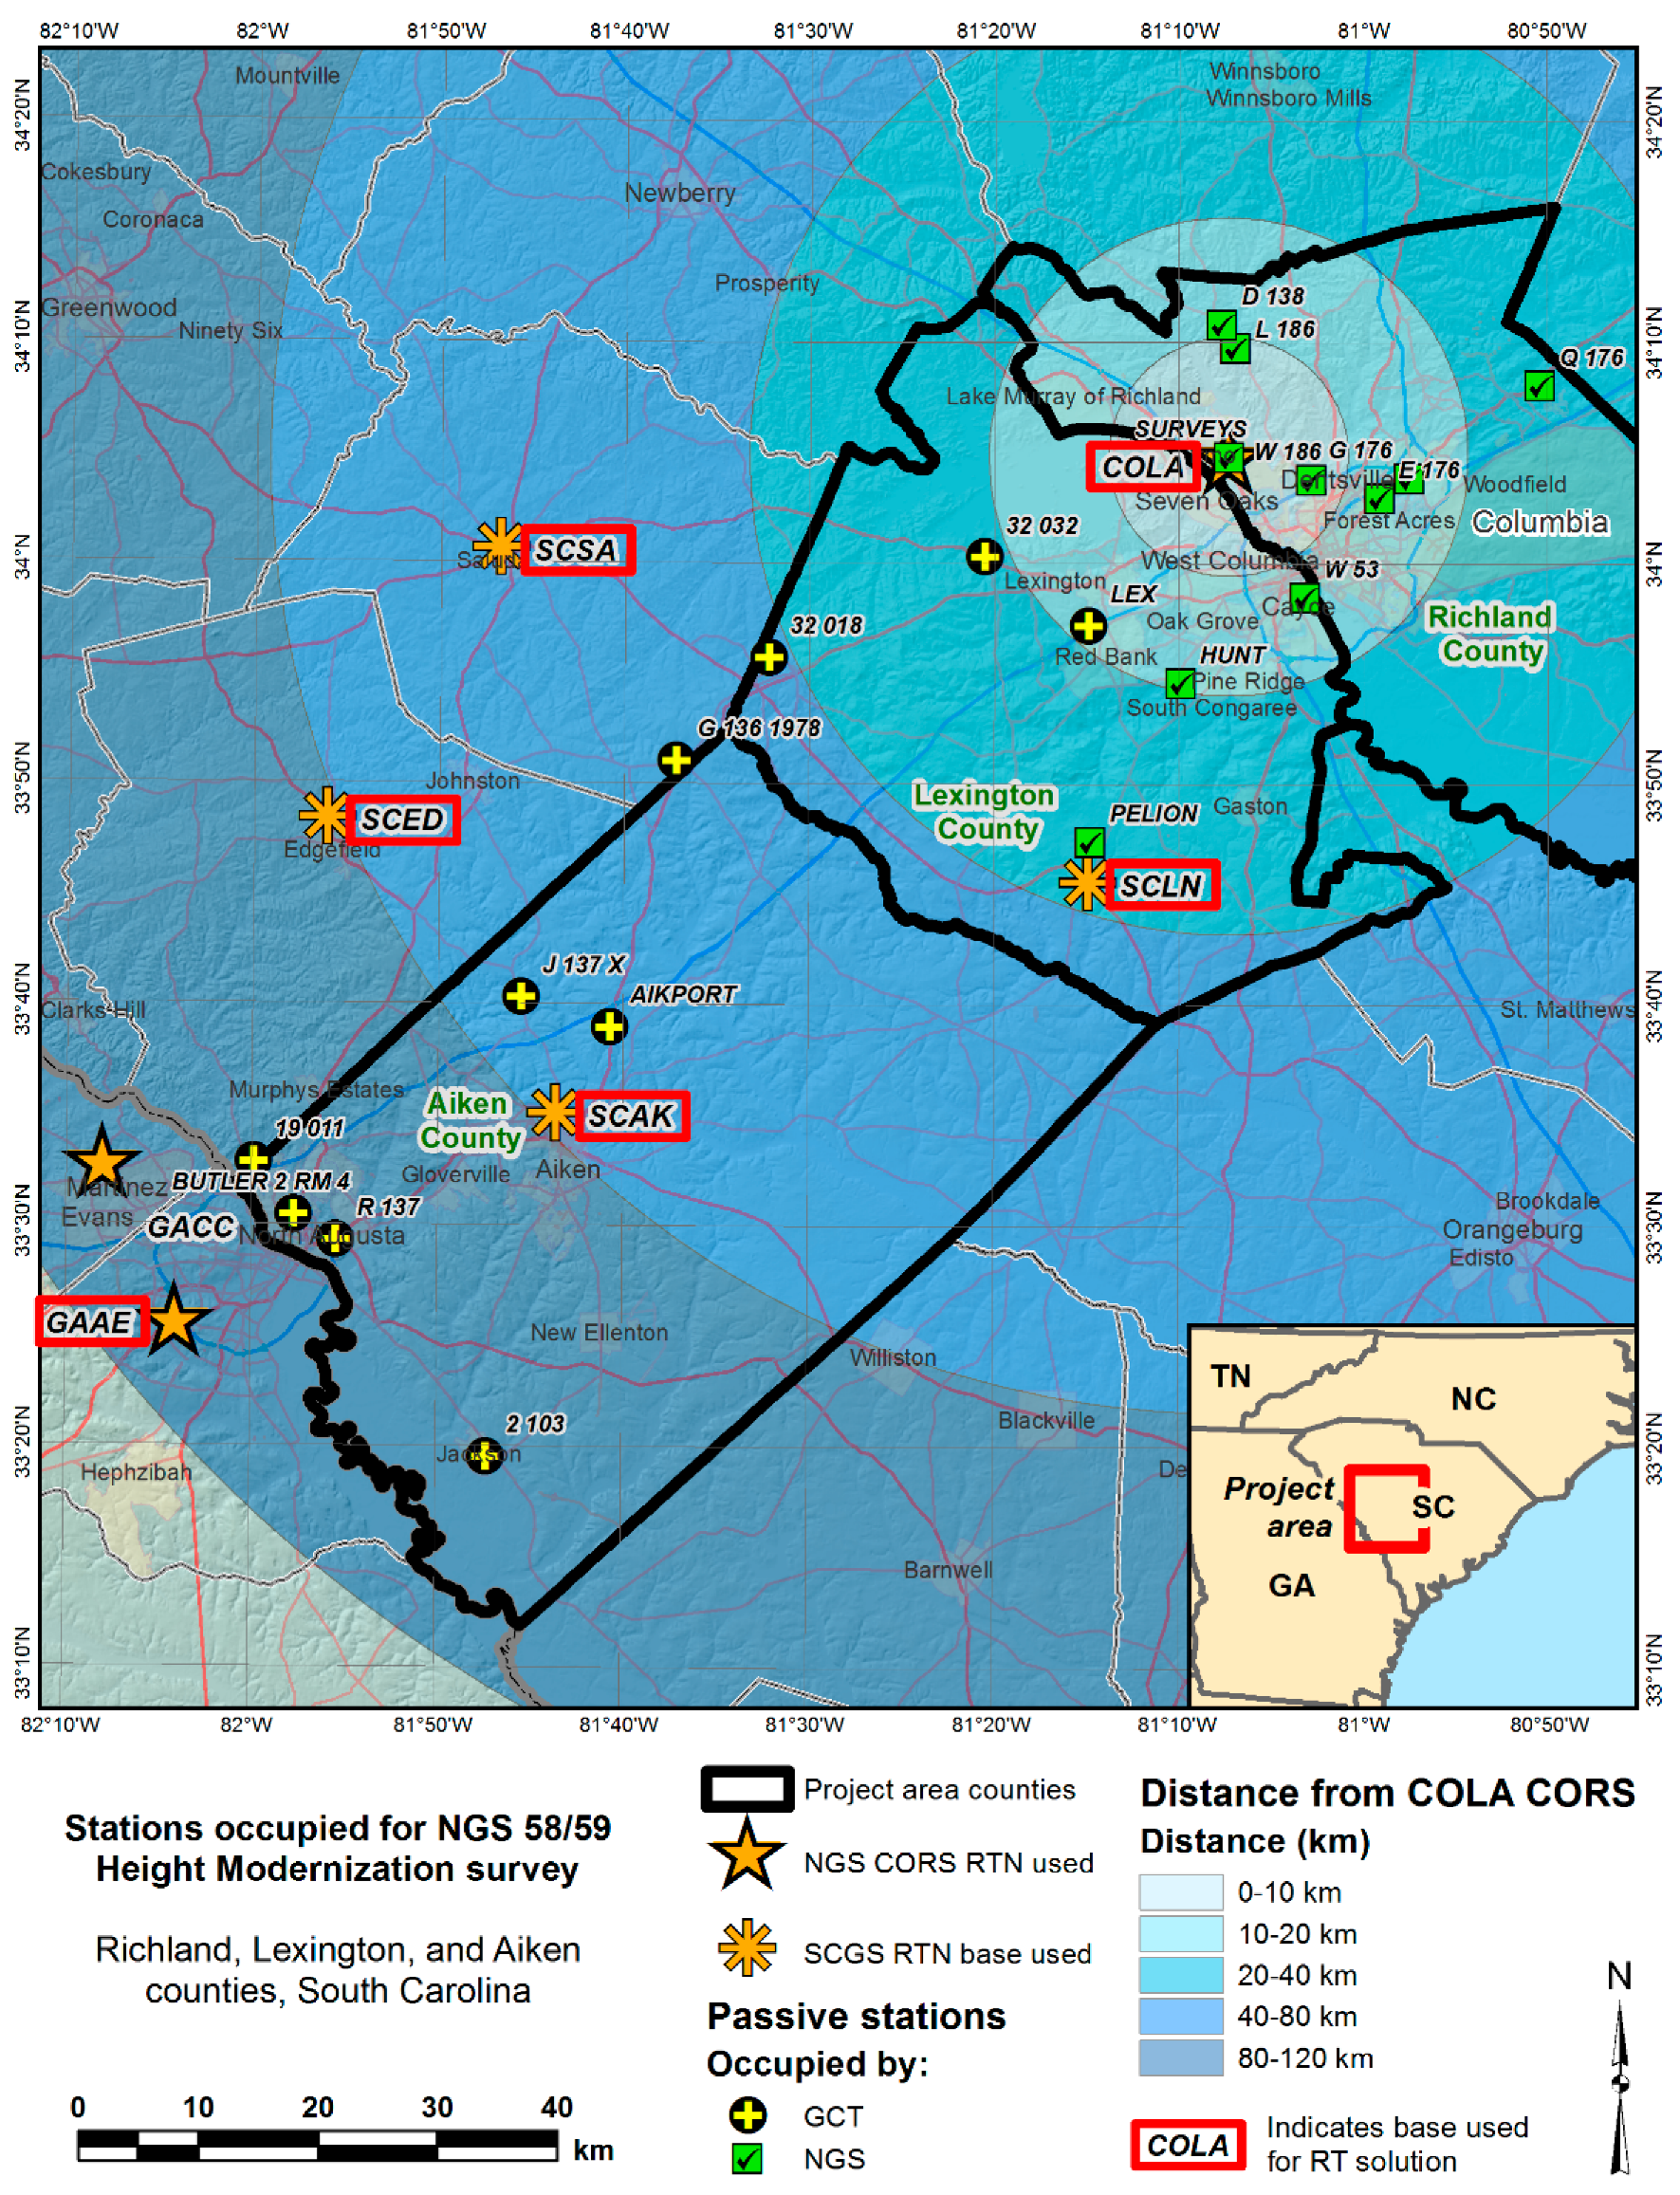
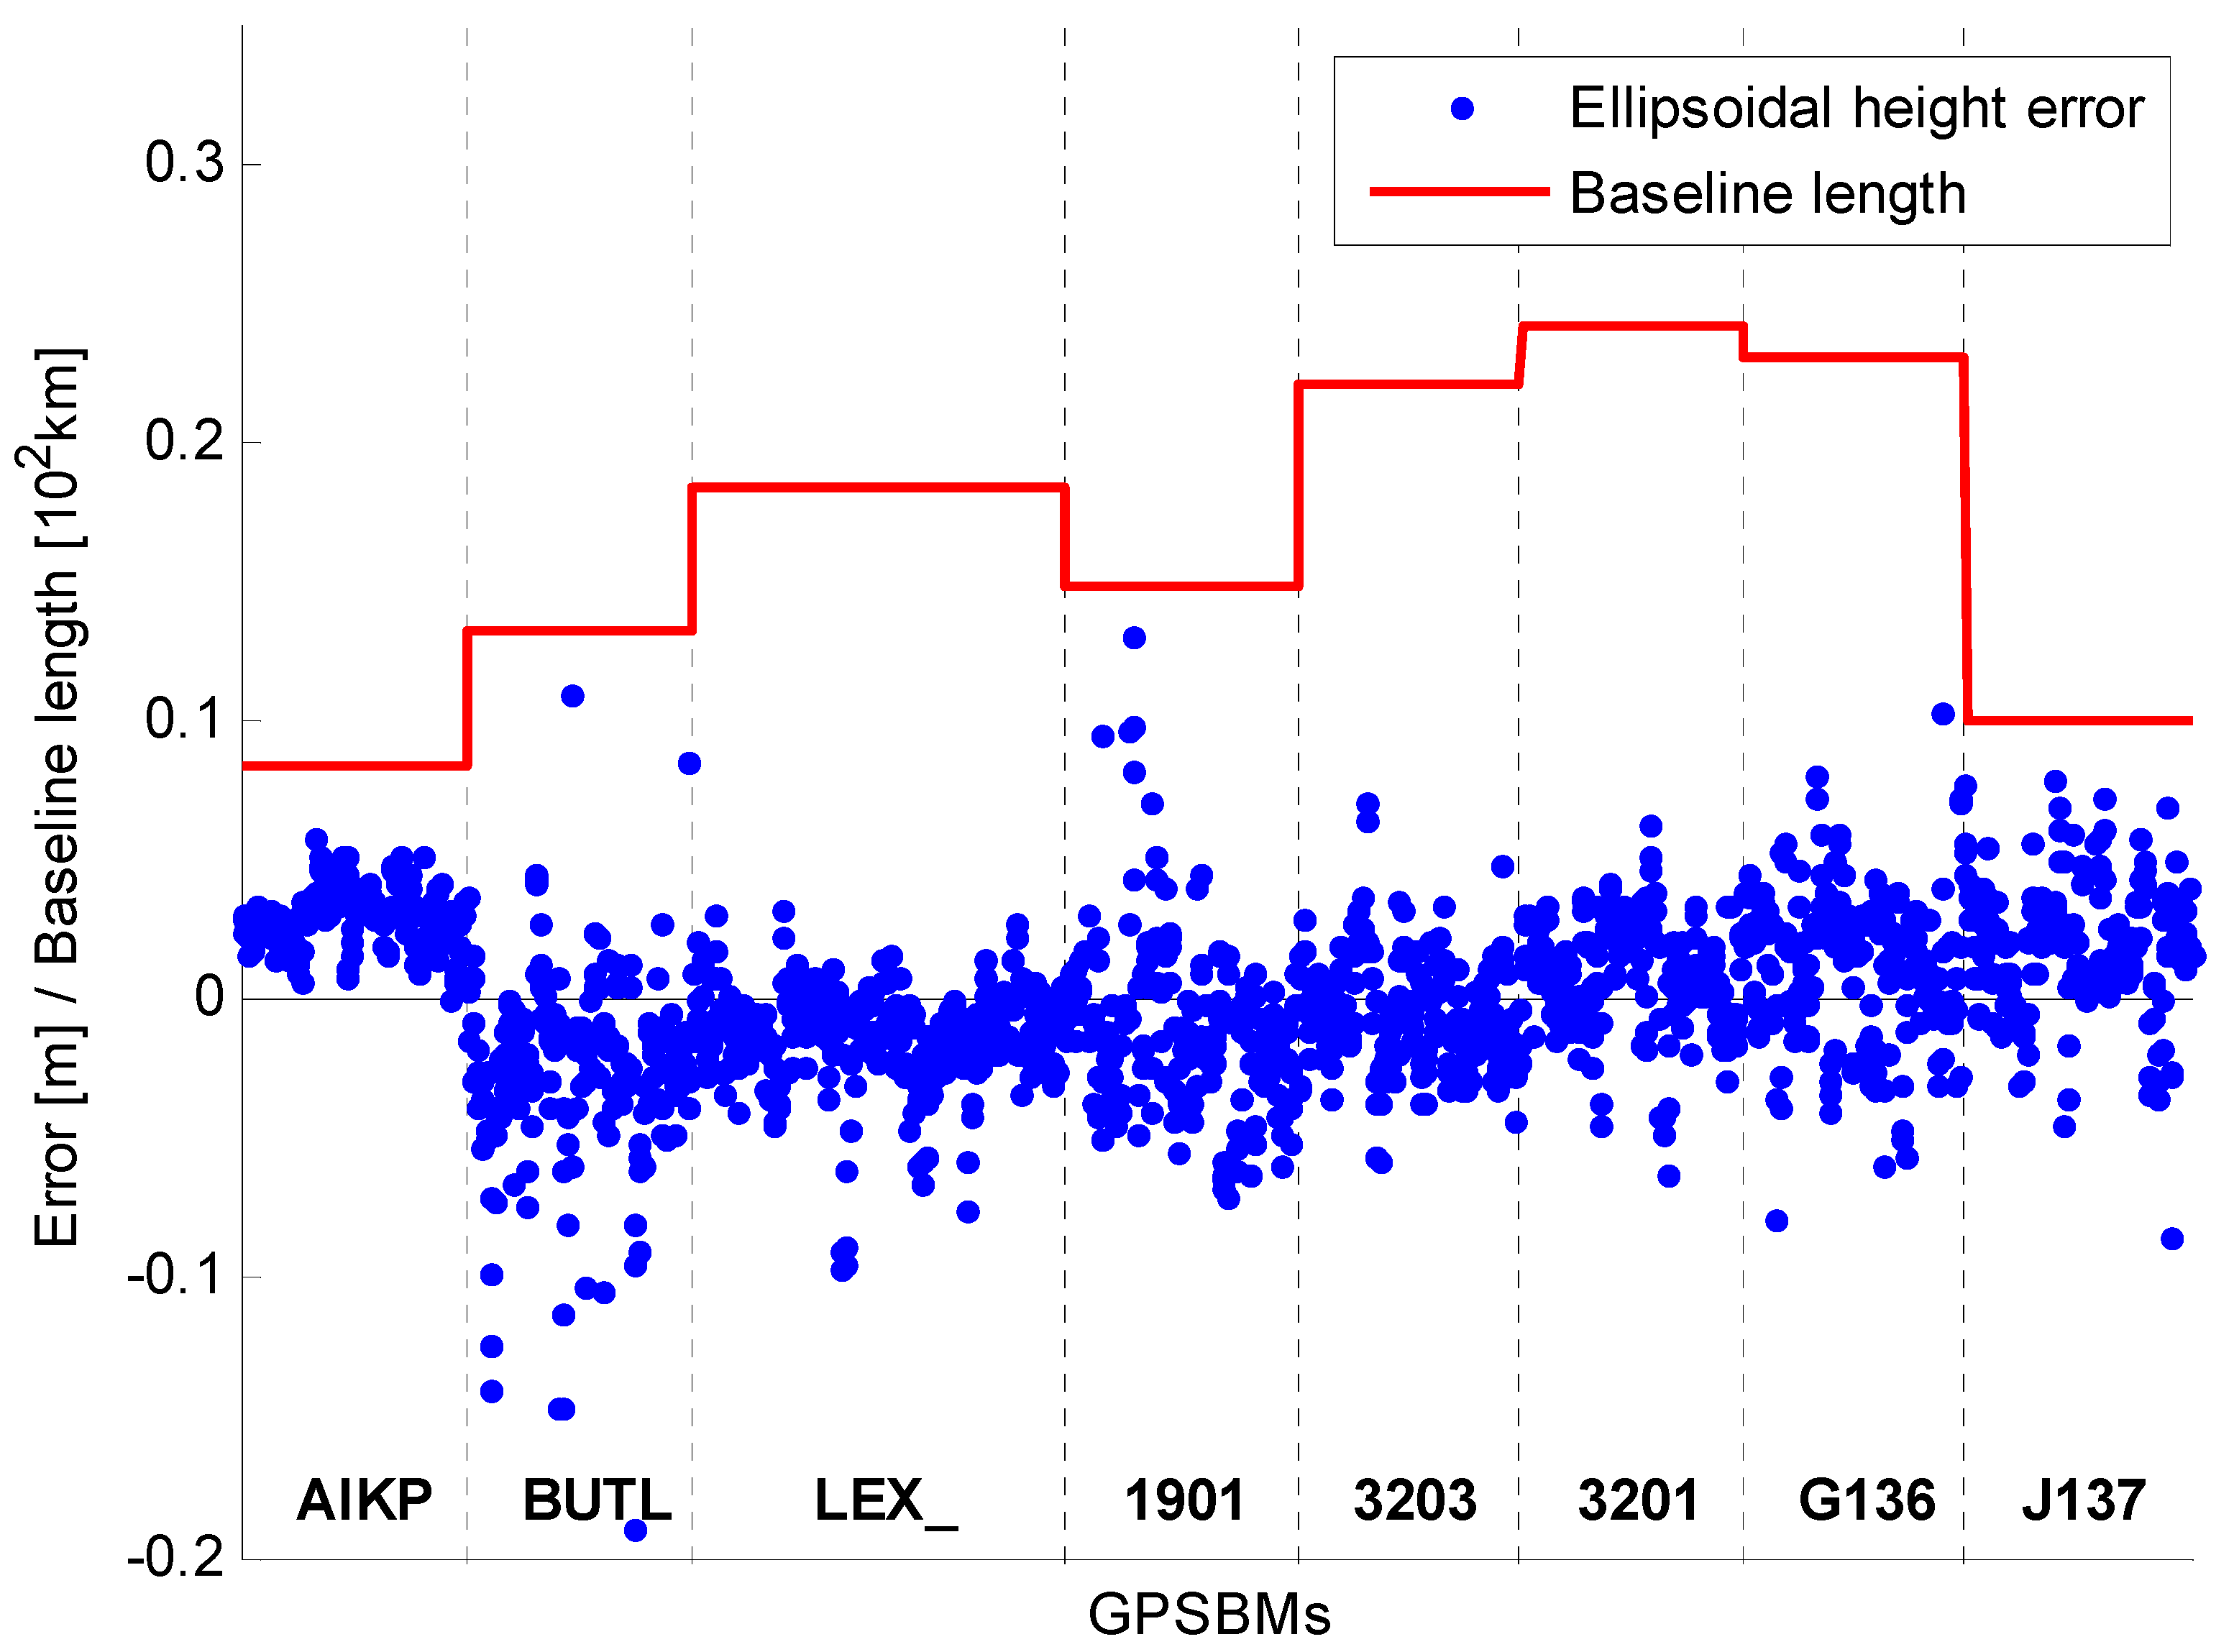
In Phase 2, the currently operating CORS network (approximately 35 × 130 km), in the vicinity of Columbia, South Carolina (
Figure 2), was used to investigate the effect of the baseline lengths from the same reference station as well as RT types on height information. All GPSBM stations have leveled North American Vertical Datum of 1988 (NAVD 88) orthometric heights stored in the NGS Integrated Data Base (NGSIDB). The data were also collected at a one second interval. A total of 12 permanent bases (seven NGS CORS and five base stations from South Carolina RTN) were used in the surveying (some of stations that were not directly referred to were excluded in
Figure 2).
Figure 2.
Study area for Phase 2 [
18].
Figure 2.
Study area for Phase 2 [
18].
2.1 Static Surveying
Four sets of static surveys were performed to validate the effect of antenna type on the final coordinates (Phase 1). In addition, the result of static surveying was used as a reference in the following analysis of RT solutions in Phase 1. All static data processing was performed using NGS Online Positioning User Service (OPUS)-Projects, a set of GPS management and processing tools for projects involving multiple sites and occupations [
19]. Users can access the system easily via web for data uploading and (limited) customization of the processing strategy. It uses the PAGES software suite [
20] for data processing, and visualization and management aids are also provided. Although all static surveying data were collected at 1 Hz rate in this project, a 30 s resampling was performed for the purpose of this study (and is the only sample rate used by OPUS-Projects). The receiver/antenna combination changed for every session, as summarized in
Table 2. The static observations for the new marks, down-sampled at 30 s, were uploaded to and processed by the OPUS-Projects server. The static solutions were used as a basis of comparison reference for the RT solutions. Only one station closest to the project site was selected as a hub station and constrained tightly, while two other CORS stations (about 1000 km away from the hub and located in different directions from it) were also included to decorrelate the tropospheric delay. The tropospheric delay was estimated every two hours in a piecewise linear mode, and the elevation cutoff angle was set to 15°.
2.2 RT Surveying
RT solutions were obtained from both Phase 1 and Phase 2. The RT solutions in Phase 1 were performed for newly installed marks to test various factors, such as occupation times, baseline lengths, number of reference stations, number of epochs etc. During the RT session of Phase 1, independent of the static session, the receiver/antenna combinations remained the same to preserve the surveying conditions.
On the other hand, in Phase 2, existing GPSBMs with various baseline lengths from seven reference stations were used to verify the relevance of using GLONASS constellation, baseline length, improvement by averaging window, and the effect of the multiple reference stations on the RT solutions.
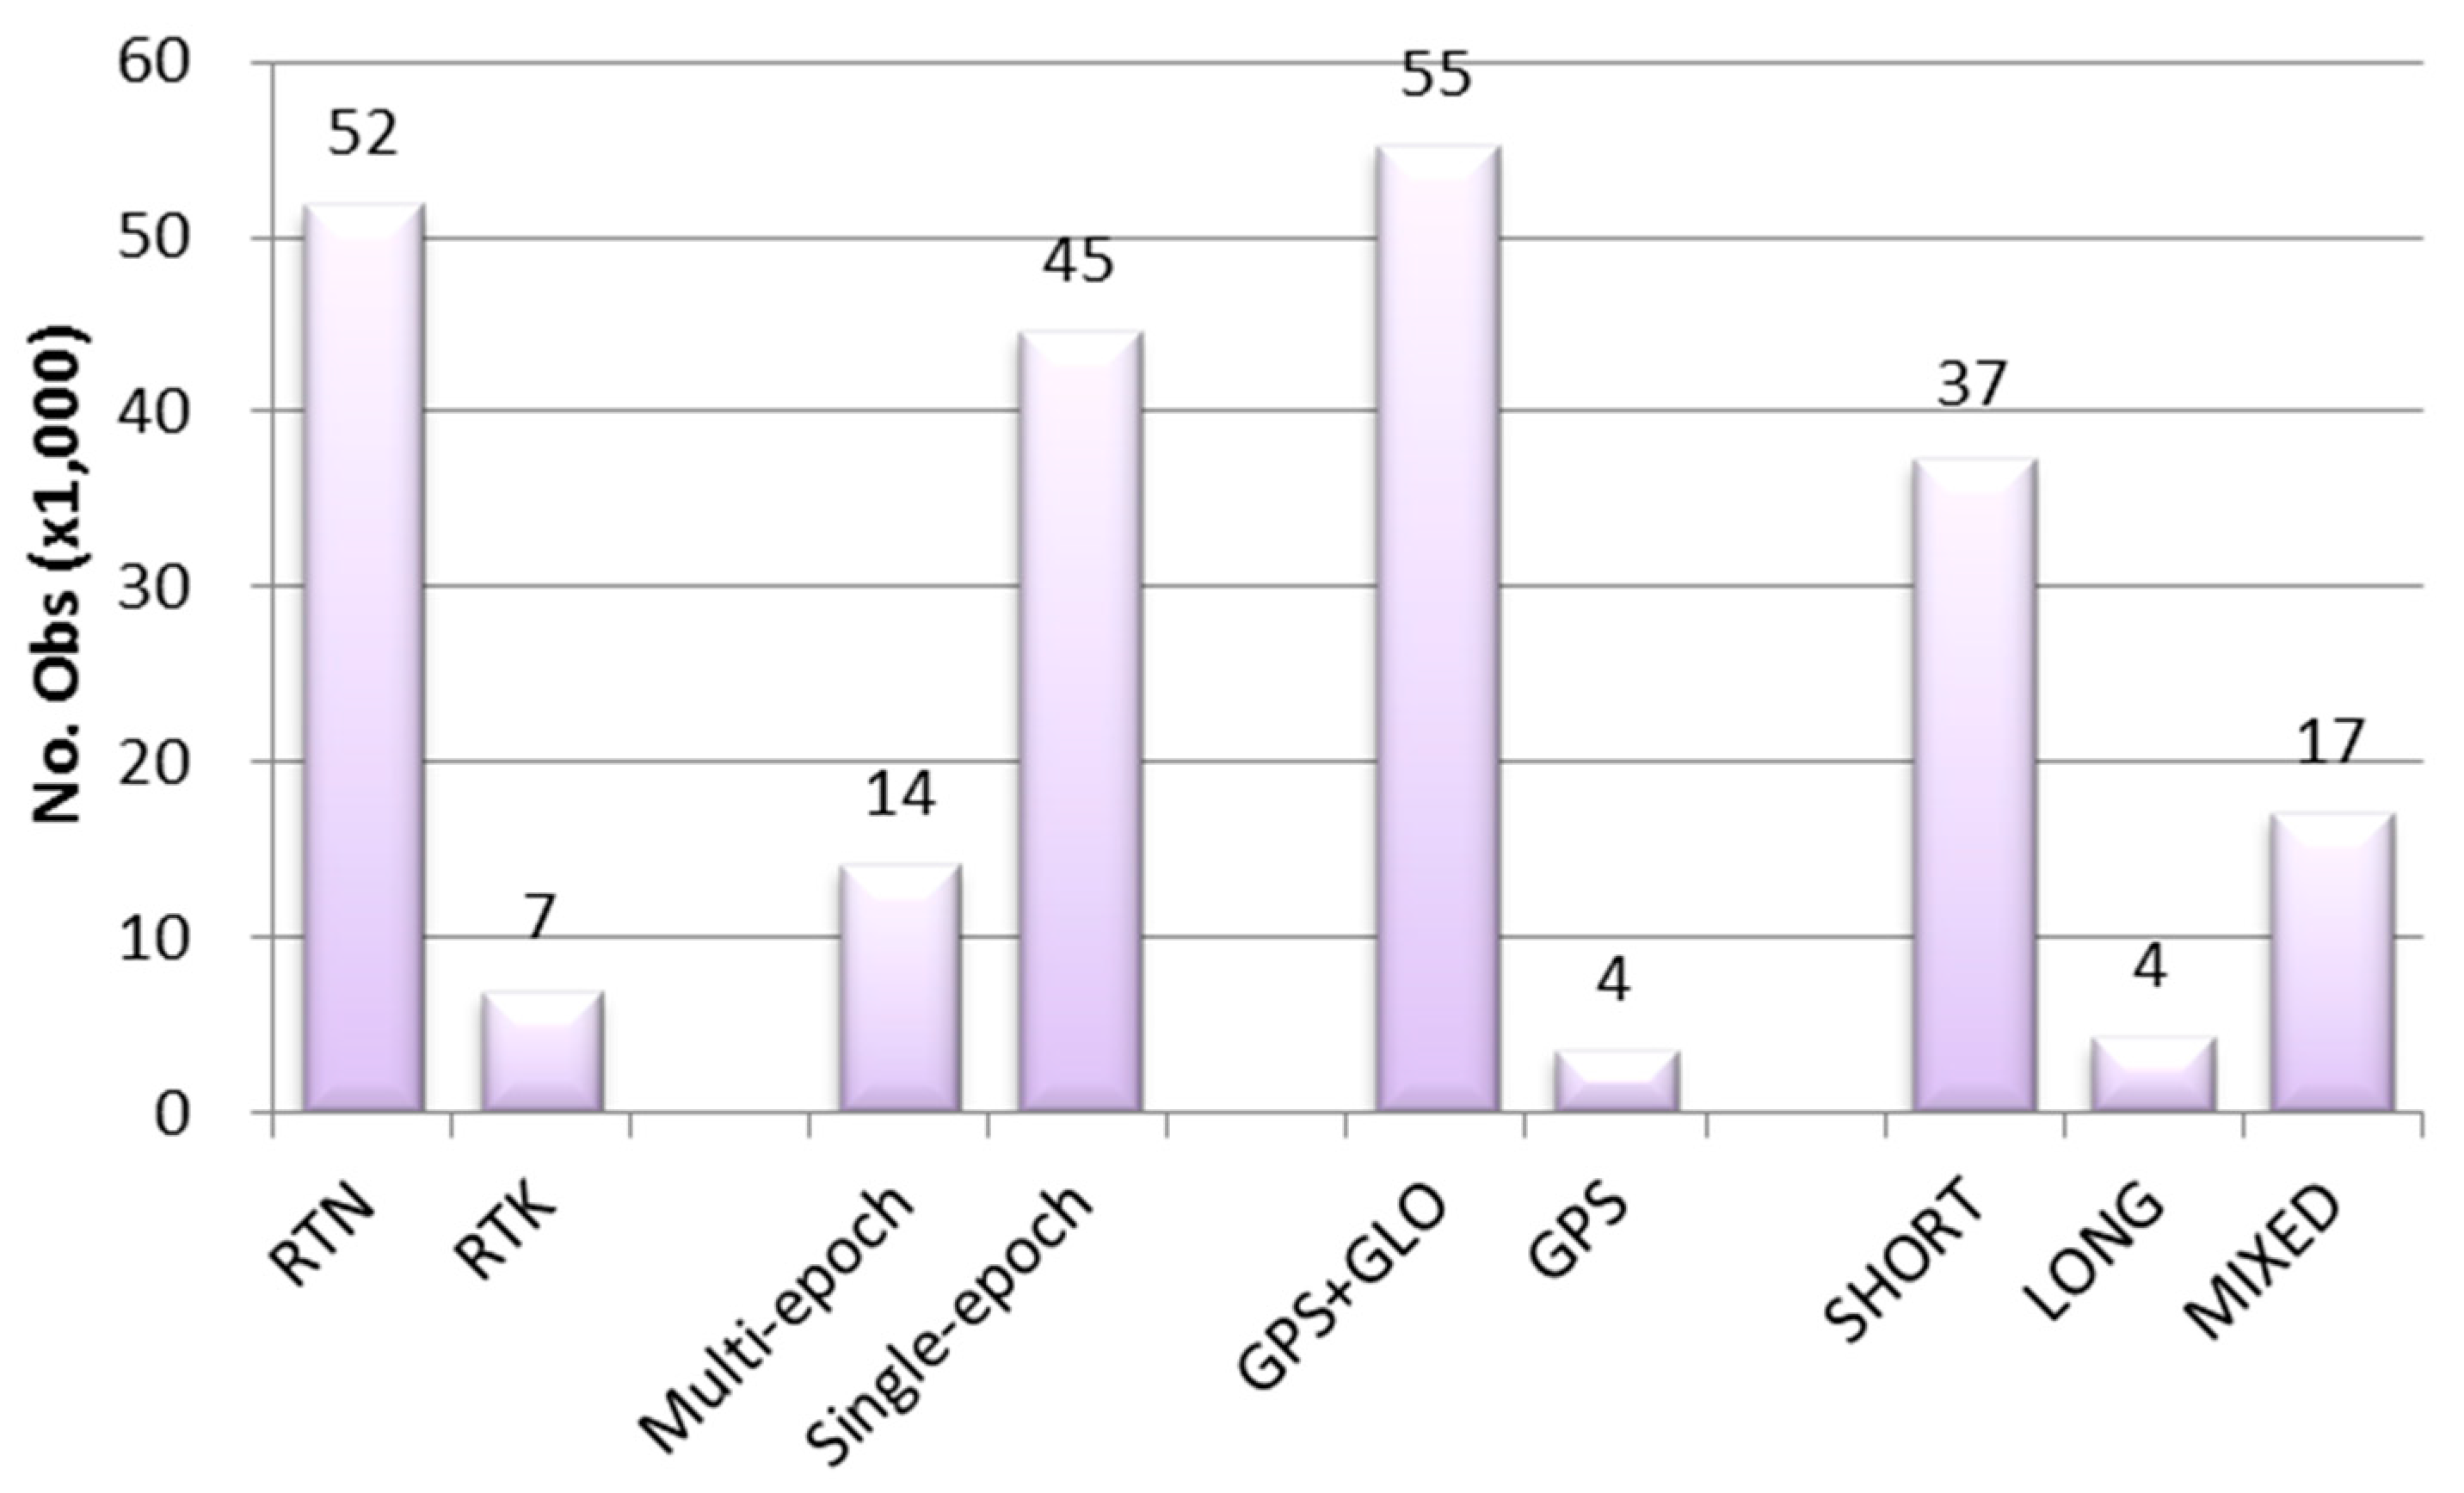
Figure 3 shows the number of observations for each RT type used in this study. RTK solutions were obtained from both Phase 1 and Phase 2. Most of the solutions were based on GNSS, and some GPS-only solutions were obtained in Phase 2. The number of long baseline (~30 km) solutions is very limited, as compared to the count of short baselines (~2 km), and various lengths of baselines were analyzed as well. Unless stated otherwise, all comparisons were accomplished for the ellipsoidal heights in this study.
Figure 3.
Number of observations by RT types (Phases 1 and 2). SHORT/LONG/MIXED refer to baseline lengths.
Figure 3.
Number of observations by RT types (Phases 1 and 2). SHORT/LONG/MIXED refer to baseline lengths.
3. Effects of Antenna Types on Static Positioning
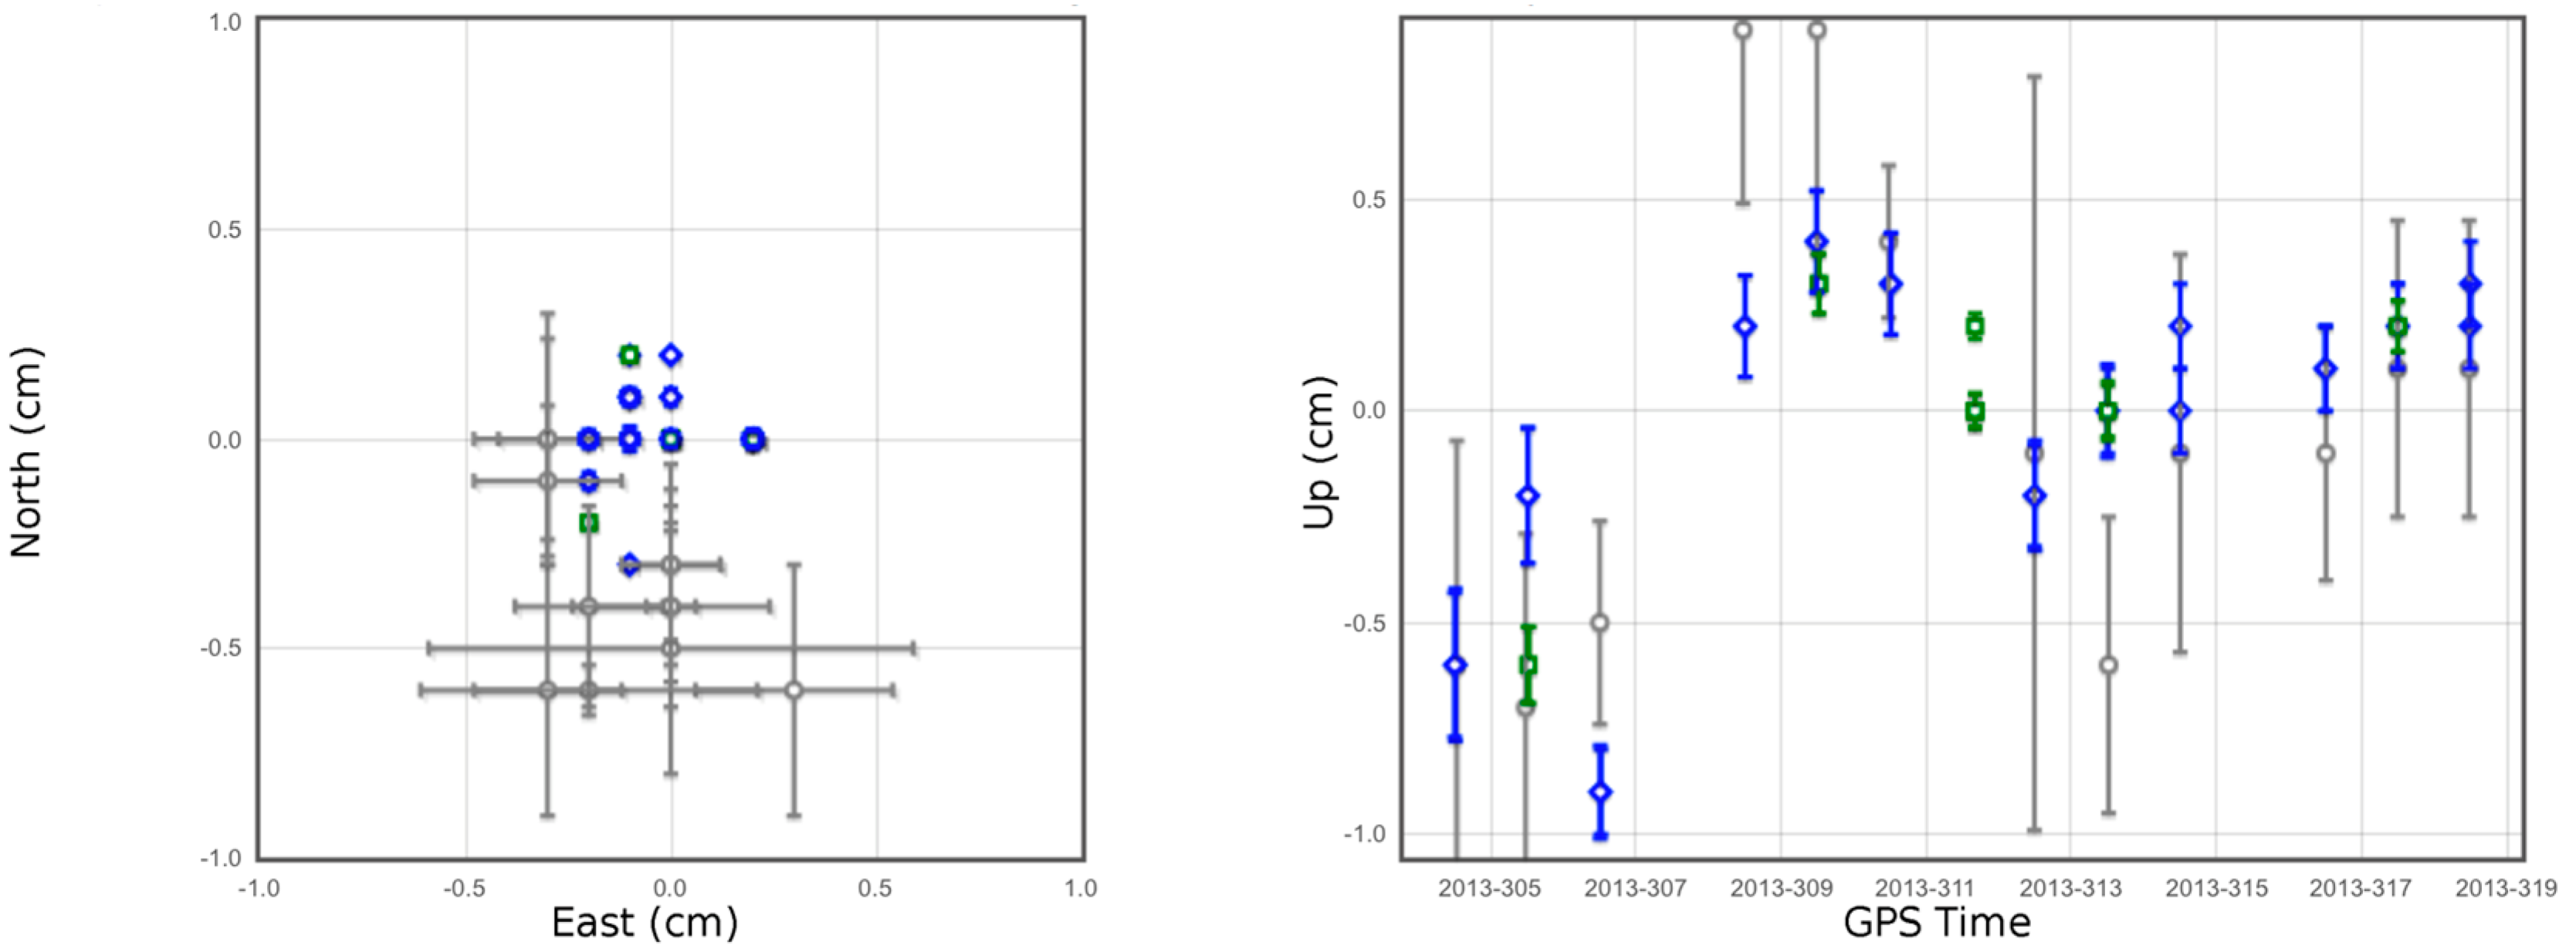
Figure 4 shows the horizontal and vertical plots representing the daily solution as an independent site (gray), the daily solution that all sites were processed simultaneously (blue), and the solution for each set as well as the overall estimates (green). While the horizontal components were estimated at a precision (repeatability) of a few millimeters, the vertical one shows a significant variation between sets (up to 1 cm). It should be mentioned here that the estimated final coordinates of each site are based on the most recent reference frame (IGb08) at the mean epoch of data collection (2013.85), and therefore it is necessary to transform the resulting coordinates into NAD83(2011) epoch 2010.00 because all RT solutions in this study were provided in that frame. The transformation between reference frames was accomplished using HTDP (Horizontal Time-Dependent Positioning) by NGS (version 3.2.3).
Figure 4.
OPUS-Projects processing results for station EAST; horizontal (left); and vertical (right).
Figure 4.
OPUS-Projects processing results for station EAST; horizontal (left); and vertical (right).
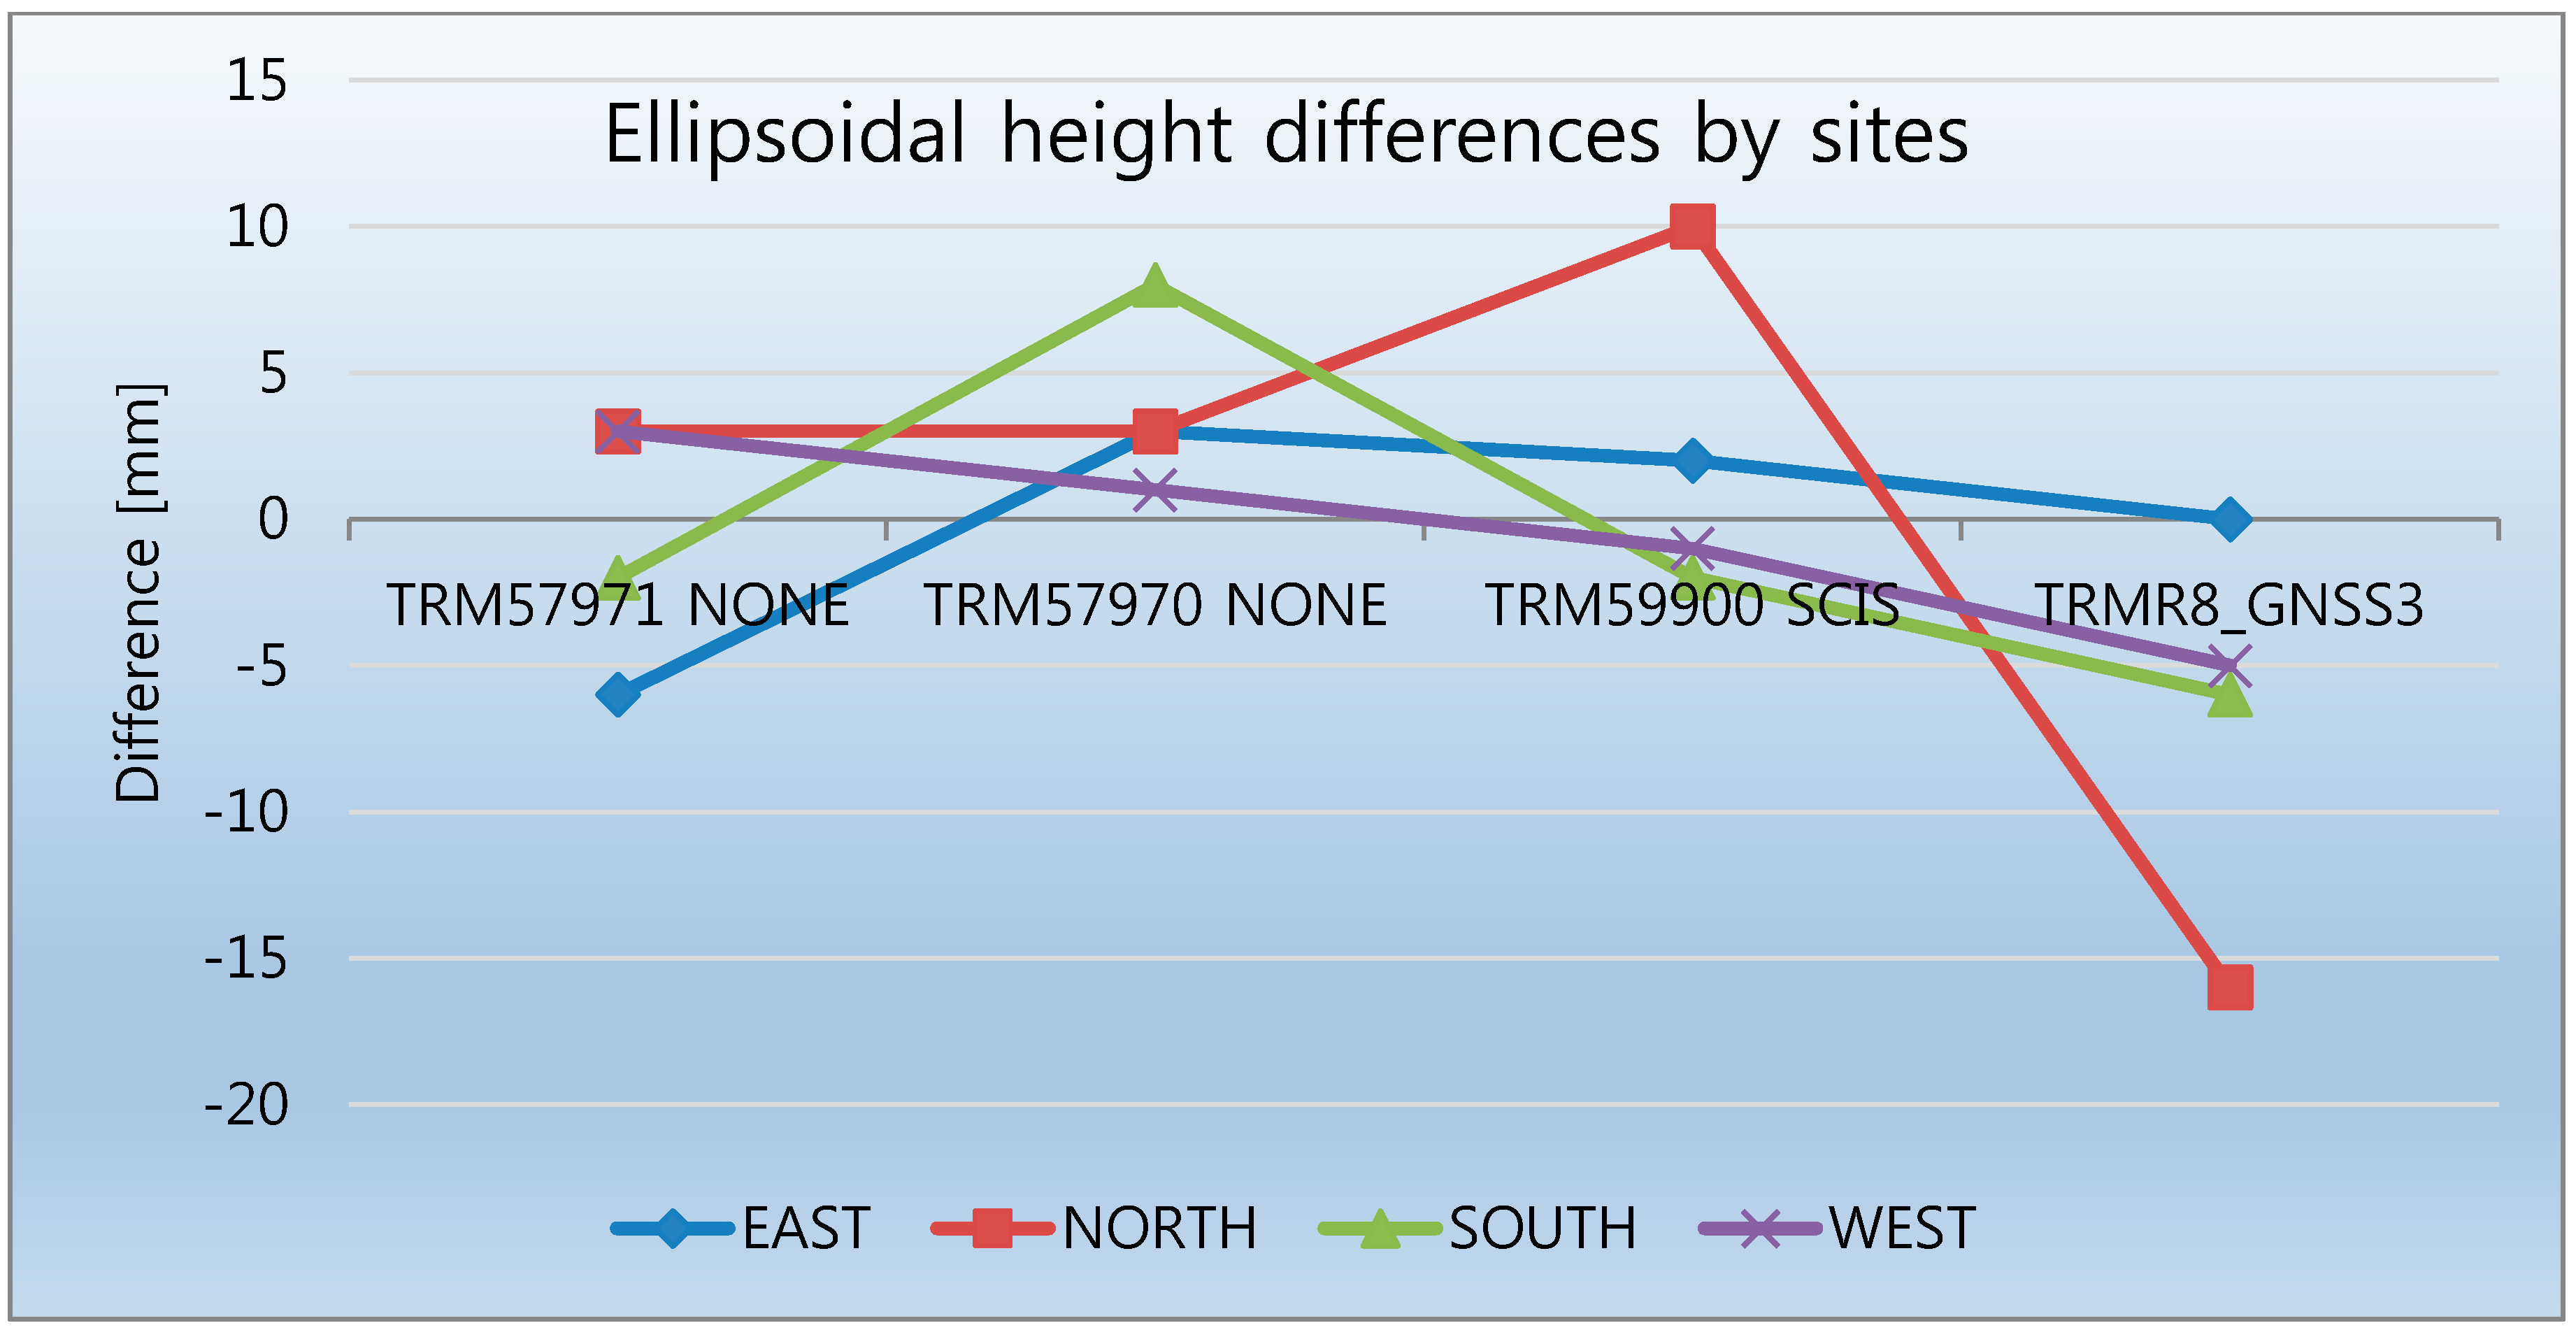
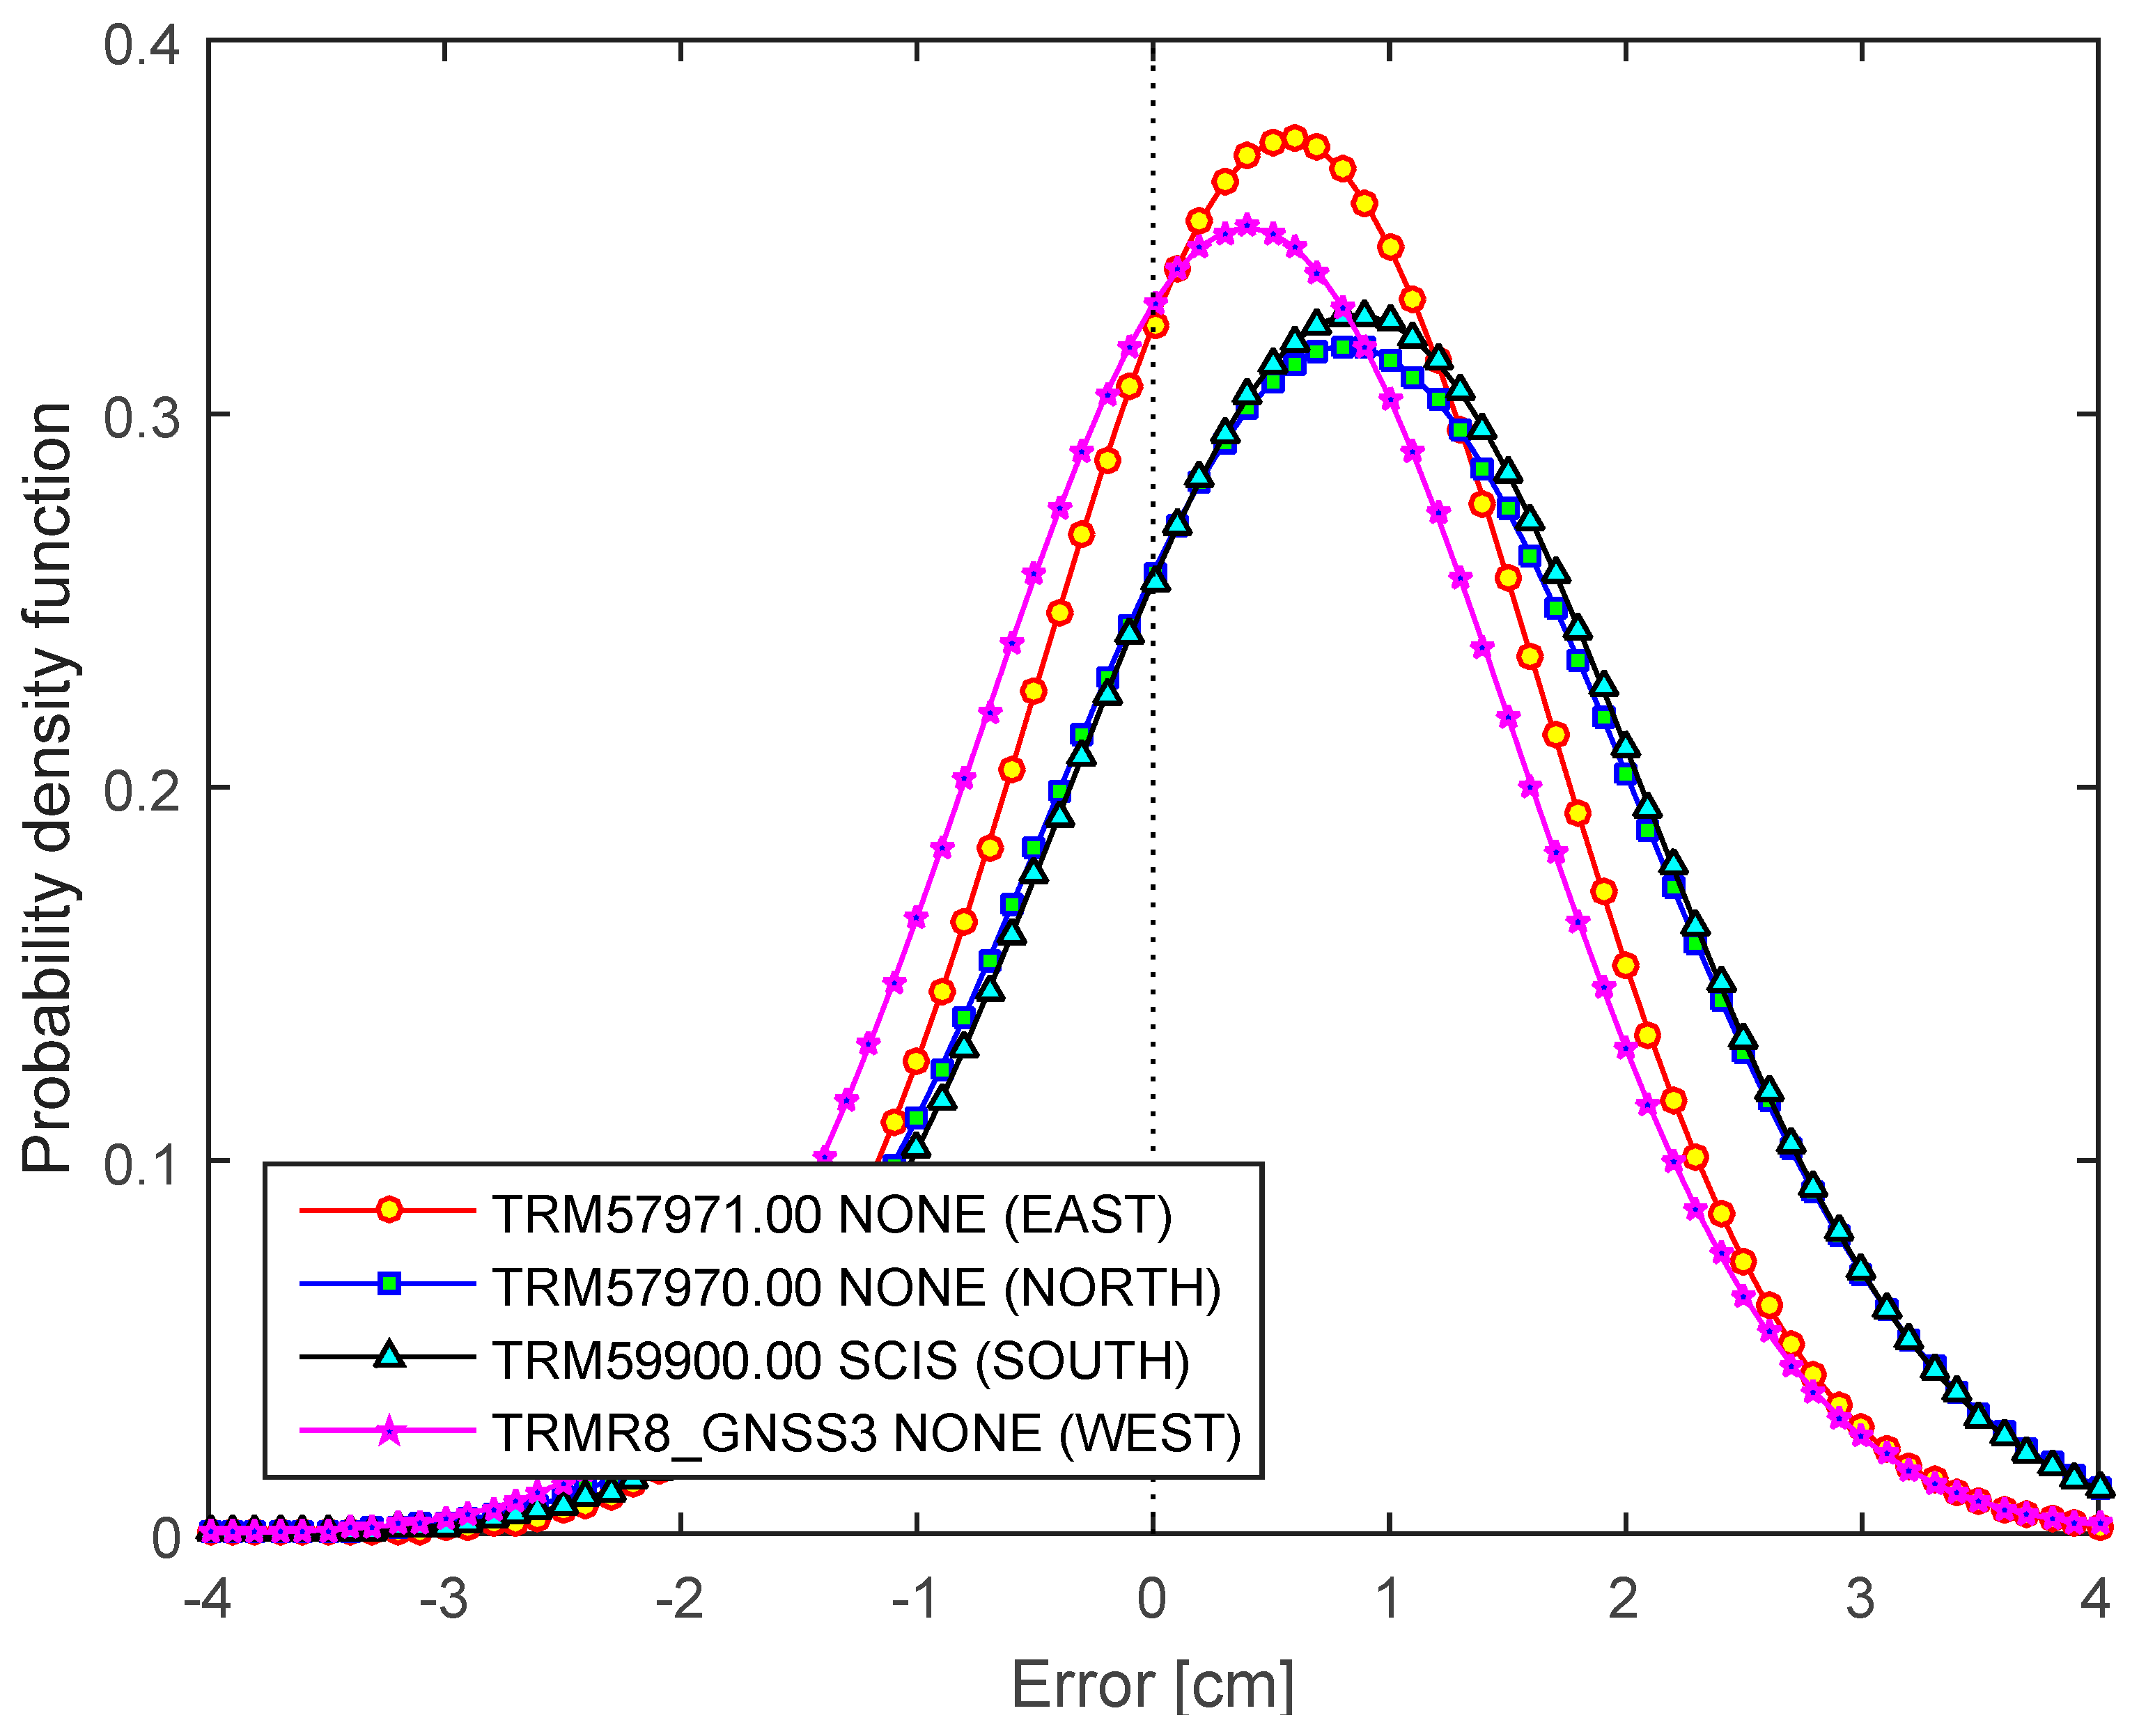
Figure 5 shows the antenna types used in Phase 1. The UP component from the same antenna type behaves similarly at two sites, whereas the other two present positive and negative differences, indicating that a similar behavior of the antenna type at each site (positive or negative) cannot be always expected. That is, the TRM57970.00 NONE antenna is positively biased for all sites, and the TRMR8_GNSS3 antenna is offset downward (
Figure 6). The difference between the antenna types in the estimated ellipsoidal heights with respect to the mean OPUS-Projects solution reaches up to two centimeters, even though the phase center variation of each antenna type was modeled in the processing software using IGS absolute antenna models.
Figure 5.
Antennas used in Phase 1 [
18].
Figure 5.
Antennas used in Phase 1 [
18].
Figure 6.
Differences in ellipsoidal heights by site (Phase 1) with respect to the mean OPUS-Projects solution.
Figure 6.
Differences in ellipsoidal heights by site (Phase 1) with respect to the mean OPUS-Projects solution.
5. Conclusions
While the advanced technologies in GNSS, including ongoing modernization with new signals, have been introduced into positioning applications, there are no guidelines and specifications for GNSS-derived heights from real-time solutions. Two phases of GNSS RT solutions were intensively analyzed in this study to investigate the possibility of applying network RT solutions for GNSS-derived heights. The RT solutions with four different types of antennas were collected for short baselines in Florida. The performance is generally comparable, but the RT solutions can be biased by up to 9 mm by the surrounding environment. The accuracy of RT solutions is generally dependent on the baseline lengths. However, there seems to be no clear relationship between the baseline lengths and the mRTN solutions in case of GPSBMs, and the built-in antenna is worse than others even for a favorable surrounding environment. For the RTN solution, there is no explicit bias for a baseline up to 30 km (both mRTN and sRTN), and the precision indicator by the receiver is generally overly optimistic, as already pointed out by [
2]. The duration of occupations for RTN solutions of up to 600 s shows no obvious difference in the mean values, but the variance of the solutions is inversely proportional to the duration time due to the smoothing effect.
Three different RT solutions of GPSBMs with various baseline lengths were investigated in order to analyze the characteristics of each method. The single-epoch network RTK (sRTN) solution is comparable to the multiple-epoch solutions, which should be investigated further in the future. Possible degradation of quality during transition between different duration times as well as changing the reference station should also be investigated. Since the individually-calibrated antenna phase center variation can deviate up to 1 cm in the up component [
21], it may be necessary to consider calibrating the individual antenna for better positioning accuracy of height.


