Chemoresistive Gas Sensors for the Detection of Colorectal Cancer Biomarkers

 ,
, 

 ,
,
Abstract
: Numerous medical studies show that tumor growth is accompanied by protein changes that may lead to the peroxidation of the cell membrane with consequent emission of volatile organic compounds (VOCs) by breath or intestinal gases that should be seen as biomarkers for colorectal cancer (CRC). The analysis of VOCs represents a non-invasive and potentially inexpensive preliminary screening technique. An array of chemoresistive gas sensors based on screen-printed metal oxide semiconducting films has been selected to discriminate gases of oncological interest, e.g., 1-iodononane and benzene, widely assumed to be biomarkers of colorectal cancer, from those of interference in the gut, such as methane and nitric oxide.1. Introduction
Nanotechnology represents a promising means for detection, staging and treatment of cancer [1,2]. Colorectal cancer (CRC) is the third most diffused form of cancer in the world, with nearly 1.4 million new cases diagnosed in 2012. The American Cancer Society [3] estimates that in 2011, about 141,210 people in the USA will be diagnosed with CRC and about 49,380 people will die because of it. If diagnosed early, CRC is also one of the most curable types of cancer, with cure rates as high as 90%. It is more common in developed countries and mainly affects people older than 50 years. Current screening techniques, such as colonoscopy, are invasive, traumatic and unpleasant for already debilitated patients [4]. The combination of nanotechnology with the need of medicine to find a non-invasive method to detect and prevent cancer is a rapidly evolving field. It is known that VOC emissions are linked to tumor growth, which is accompanied by gene and/or protein changes that may lead to these volatile emissions [5,6]. VOCs can be considered as biomarkers for the different types of cancers, and their analysis is a new frontier in medical diagnostics, because it is non-invasive and potentially inexpensive [7–9]. Tumor VOCs can be detected directly from the headspace of cancer cells or through exhaled breath; in fact, changes in the blood chemistry lead to measurable modifications in the breath by exchanges through the lung, e.g., in the range between 20 and 100 ppb for several VOCs [10]. The aim of this work is to study the detection of VOCs as indicators of CRC, identifying the most selective sensors of these compounds. The application goal of this study is to establish a method to analyze flatulence and intestinal gases, in which it is reasonable to think that these biomarkers should be conveyed.
Concentrations of tumor VOCs in flatus are not specified in literature, so we assume that they are of the same order of magnitude of the concentrations in breath (tenths of ppb).
The most relevant VOCs that may indicate CRC are benzene compounds [10,11] and the molecule, 1-iodo-nonane (C9H19I) [10], while the most significant interfering gases are H2, N2 and NOx, CO2, CH4 and a small quantity of sulfur compounds, principally produced by the fermentation and digestion processes [12–15].
In this study, the idea is to find the most selective chemoresistive sensors to benzene and 1-iodo-nonane, analyzing their responses (relative conductance ratios) to these markers and to some of the principal interfering gases in the gut (as H2, CH4). In our work, we have named as “principal” interferers those gases that can reach a 10% or more of total gaseous composition inside the intestine. NO is also tested, because it is produced in the gut by intrinsic intestinal tissues, resident and/or infiltrating leukocytes, reduction of luminal gastric nitrate and denitrification by commensal anaerobes [16].
2. Experimental Section
A set of twelve metal-oxide semiconducting films has been selected for the purpose. The materials chosen are five solid solutions of SnO2 and TiO2 (ST20 650, ST25 650, ST25 + Au1%, ST30 650, ST50 650), a solid solution of WO3 and SnO2 (WS30), a solution of TiO2, Ta2O5 and vanadium oxide (TiTaV) and, finally, a solution of SnO2, TiO2 and Nb2TiO7 (STN). For a better understanding, the metal oxide composition of sensors is reported in Table 1.
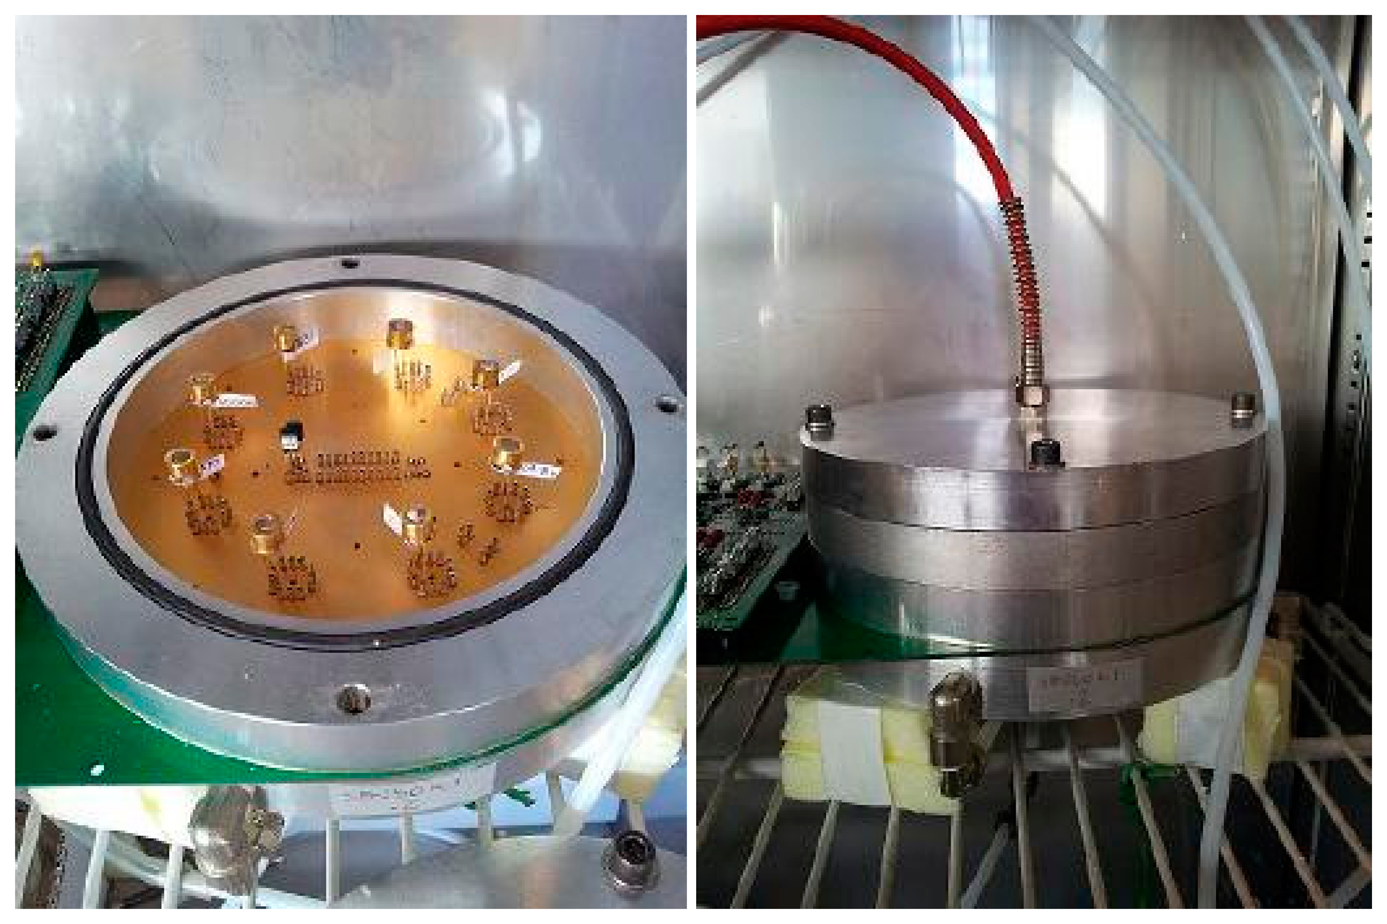
Generally, the presence of SnO2 makes the active material sensitive to a wide range of gases, so the addition of other oxides is fundamental to refine the selectivity of the sensors. Functional materials were prepared by the sol-gel technique [17], then fired at the temperatures indicated at the end of their names and used to screen-print sensing layers onto miniaturized alumina substrates [18]. Afterwards, they were characterized with the X-ray diffraction technique (XRD), thermo-gravimetry/differential thermal analysis (TG/DTA) and scanning electron microscopy (SEM). Details about the synthesis of these materials and the deposition technique have been reported in previous works of our group [19–22]. Sensors were positioned inside a sealed test chamber (Figure 1), and conductance measurements were performed with the so-called “flow-through technique” [23,24]. The flow-rate is measured in sccm (standard cubic centimeters per minute), and it affects the rate of the surface reactions between the gas and the surface of the sensitive material.
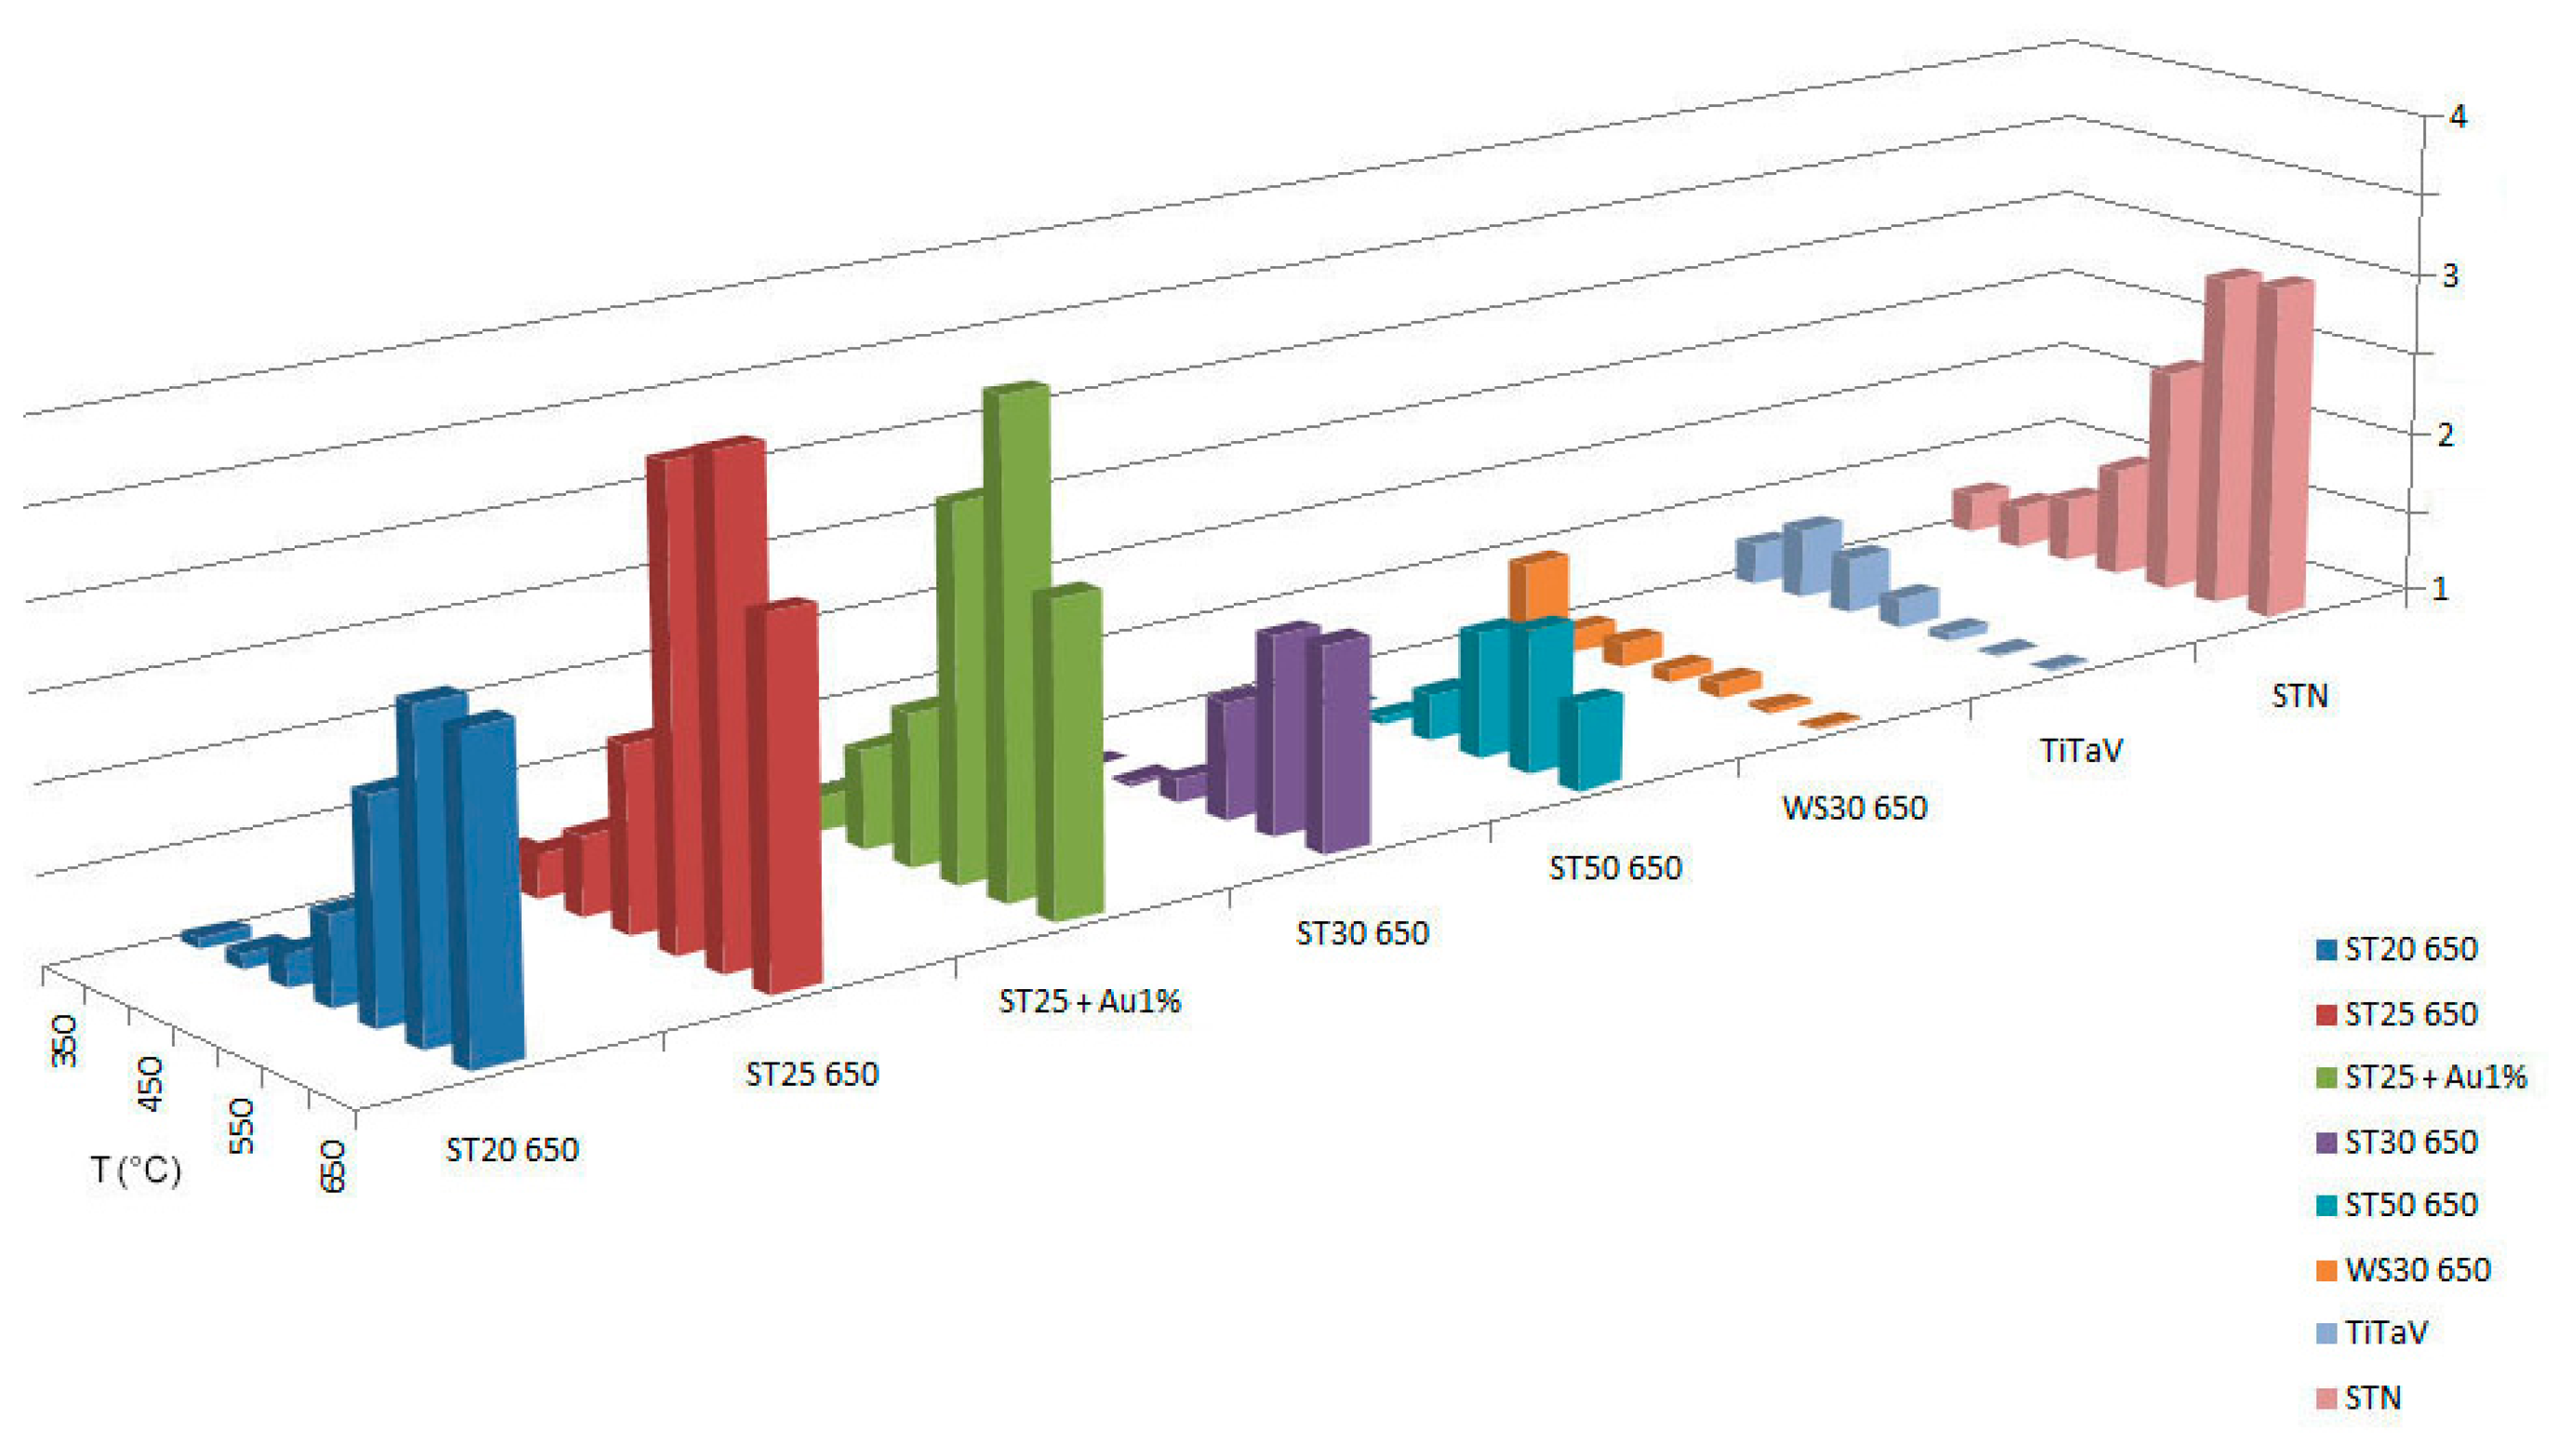
To identify the best detecting temperature for each type of sensing material, we tested the response at several working temperatures (300 °C, 350 °C, 400 °C, 450 °C, 500 °C, 550 °C, 600 °C, 650°C). Temperatures lower than 300°C are not taken into account, because, at low temperatures, the metal-oxide sensors used in this work do not show a stable response. The working temperatures are set by applying an external voltage Vh to the heating circuit of each sensor, whose resistance is indicated here with Rh. Therefore, it is possible to control and directly modify Rh, which determines the sensor's temperature. The temperature of the chamber (36–37°C) is directly influenced by the sensors working temperatures and remains almost constant. We performed this temperature analysis in dry conditions (synthetic dry air with 20% of O2 and 80% of N2) with the following target gases: C6H6 (2 ppm), CH4 (50 ppm), NO (5 ppm), and we made some interfering tests also with H2 (60 ppm) and humidity. CO2 is not considered, because it is well known that it is hardly detected by chemoresistive sensors [19]. For methane T=300°C was not considered, because is too low for sensors to generate a response. Dry conditions were chosen to show the absolute response to the gases of interest; in fact, even if humidity is present in our intestine, generally diminishing the sensors response, it does not conspicuously change the response ratios between benzene and its interferers. Measurements in wet conditions are in progress and not presented here. The results are summarized in Figures 2, 3 and 4.
The concentrations chosen for interferers are based on the fact that we want to be able to detect benzene even in the unfortunate case that the gut is filled with fermentation products. Therefore, CH4 and NO are tested with a greater concentration than that of benzene. On the other hand, when a gastrointestinal exam occurs, normally, the patient has to take a particular diet some days before the test, in order to reduce the amount of disturbing gaseous compounds inside the intestine. Then, some interference tests were made. We tested C6H6 + CH4 at the best temperature for benzene, derived from the previous analysis.
After selecting the most sensitive materials for benzene, we tested them in dry conditions with C6H6 + H2 (2, 60 ppm) C6H6 + H2 + CH4 (2, 60, 10 ppm) and C6H6 + H2 + CH4 (2, 60, 10 ppm) using humidity as an interferer (RH = 37%).
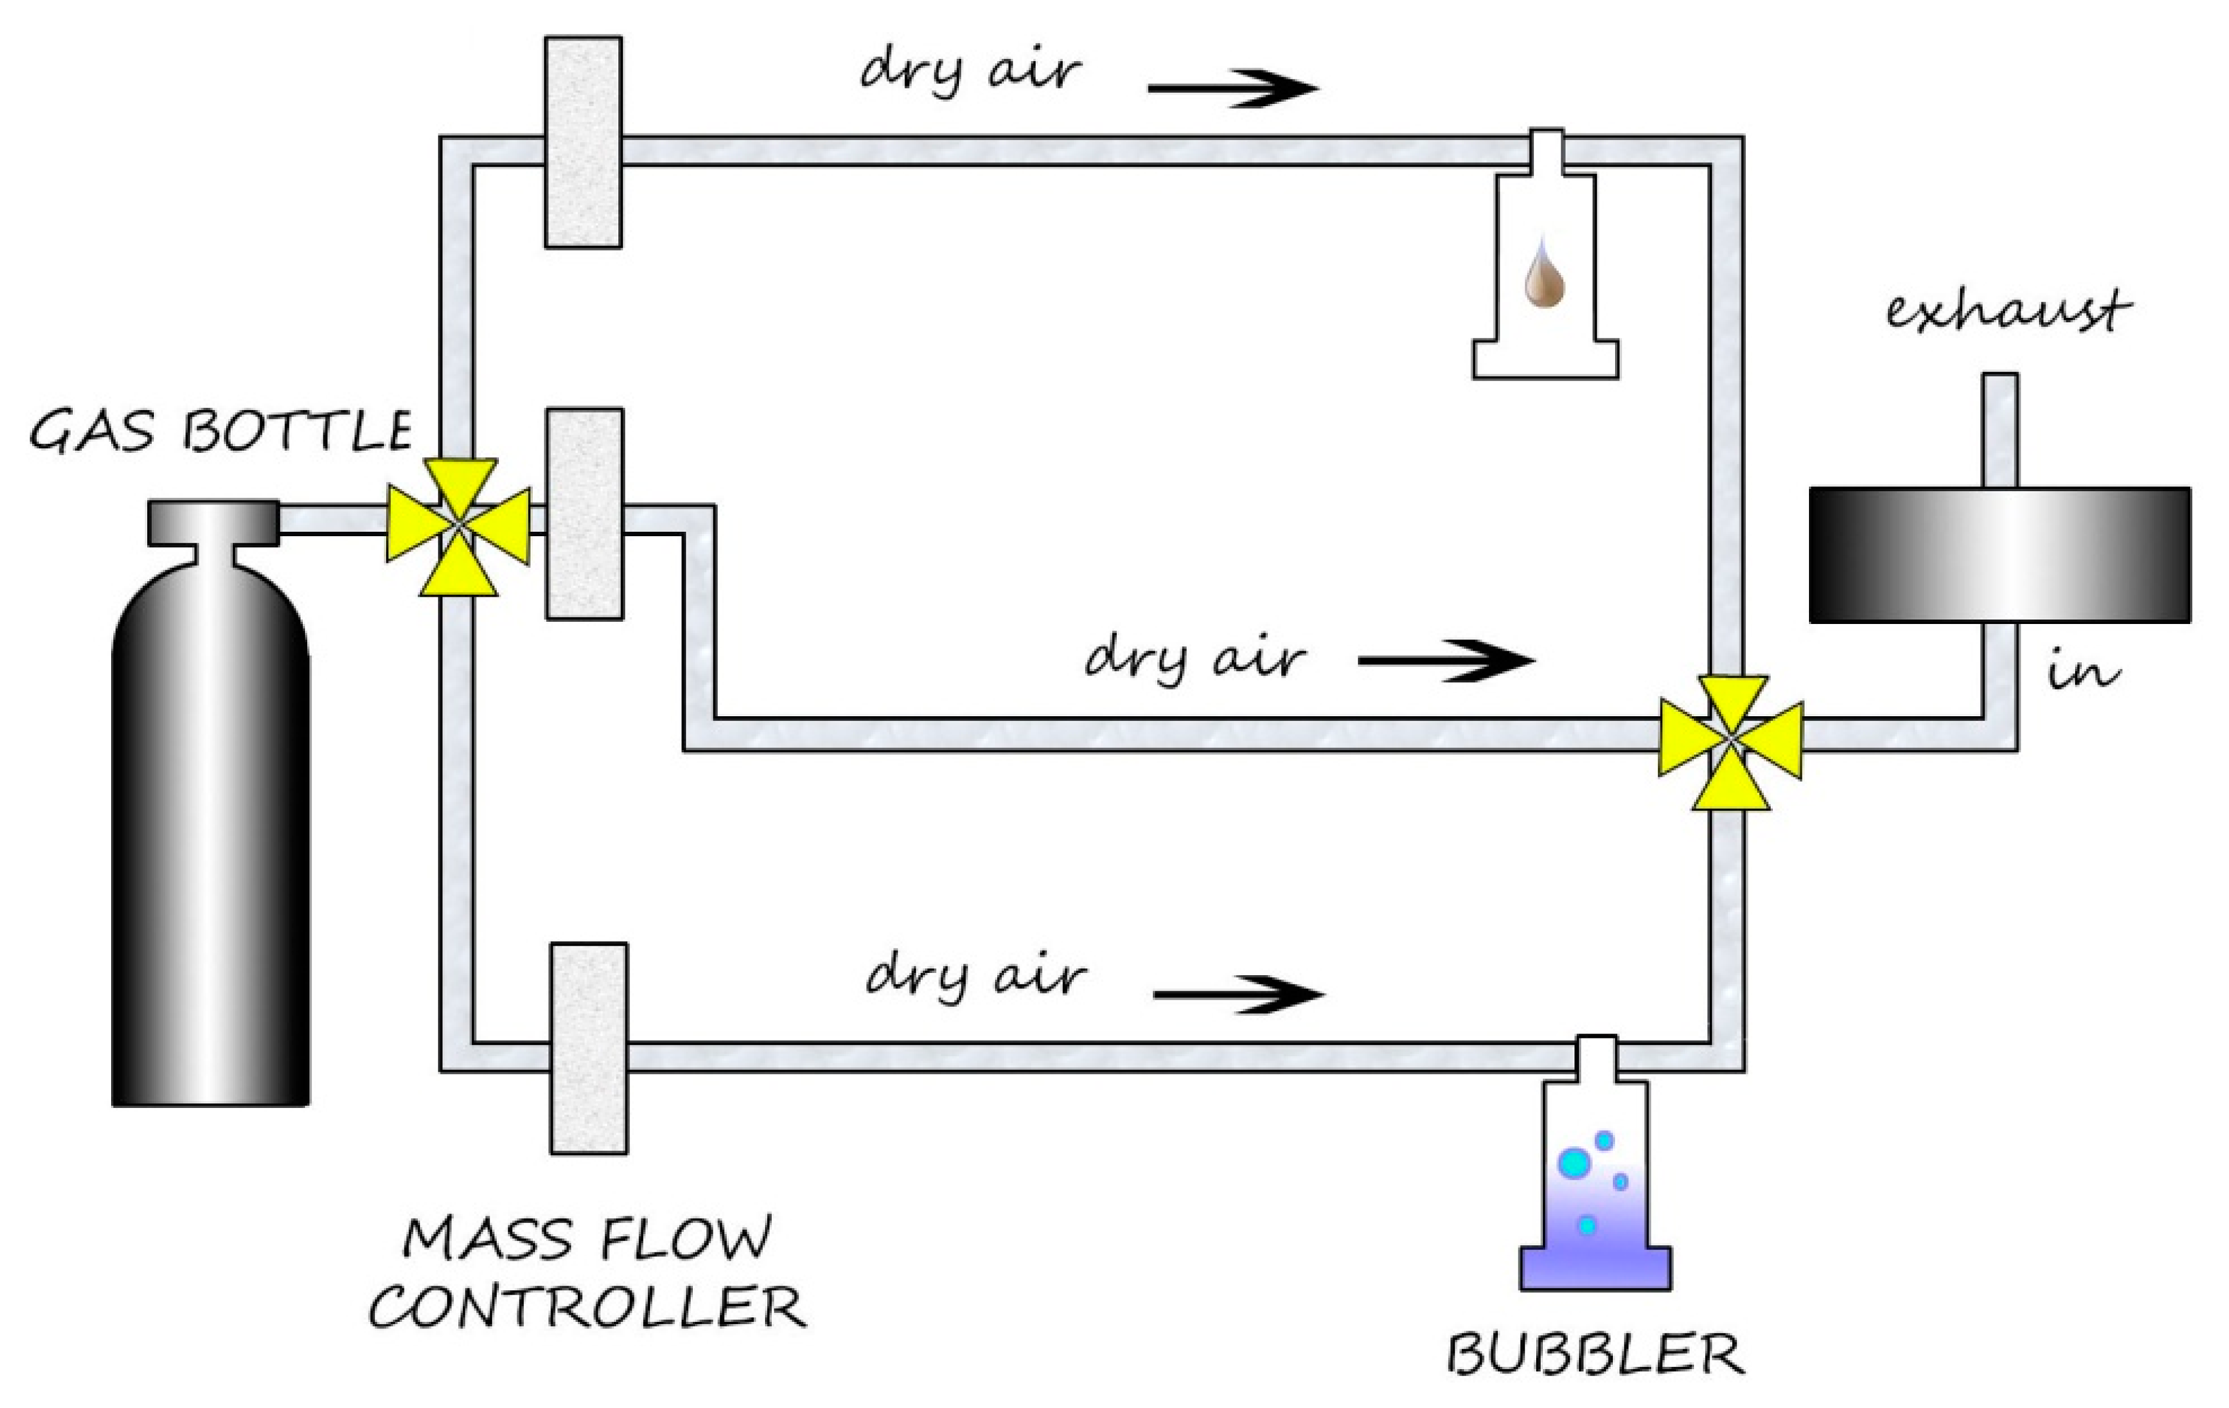
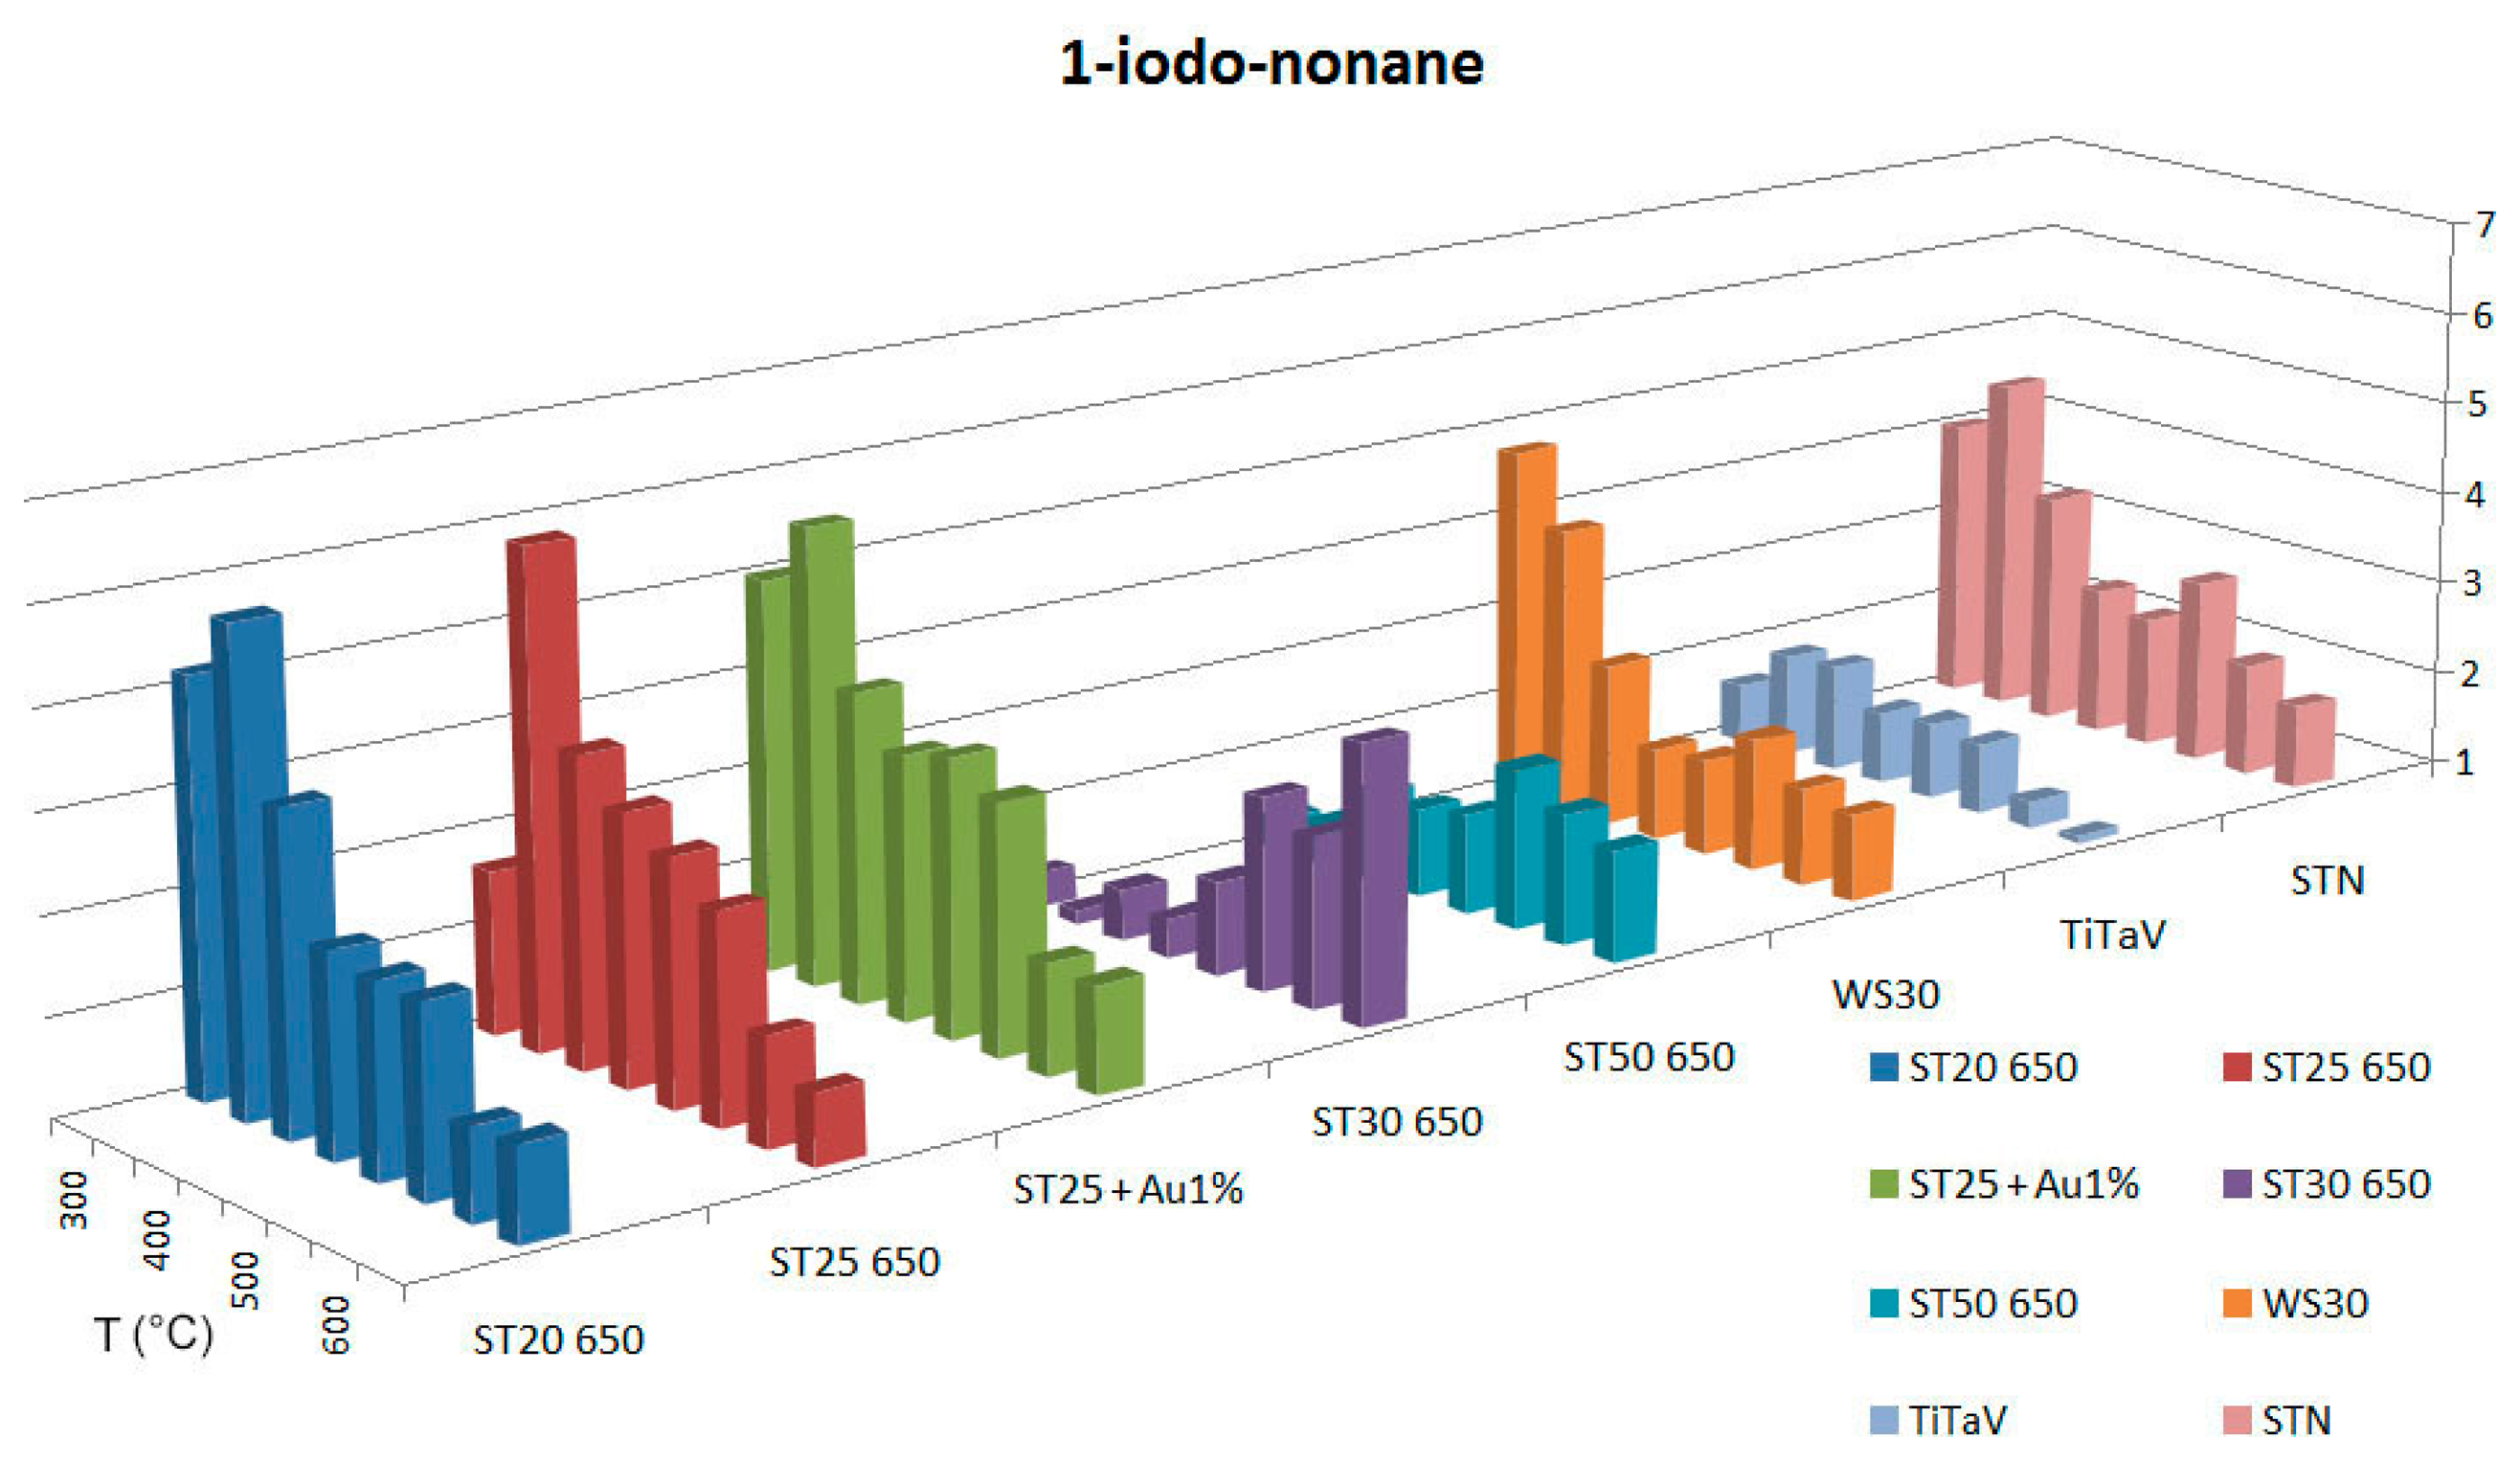
In the second part, the same analysis is performed with the VOC, 1-iodo-nonane (chemical formula: C9H19I [25]), with the apparatus shown in Figure 5. We obtained the responses as a function of the temperature shown in Figure 6.
Tests were done in wet conditions (with a constant relative humidity (RH) ∼18% inside the volume of the chamber) to reproduce the intestinal environment. A fixed fraction of the total flux came from the gas bubbler filled with distilled water, while the remaining fraction was composed of two lines, one of synthetic dry air and the other passing through a second gas bubbler in which there were some drops of 1-iodononane. After the stabilization of sensors in wet air, a drop of 1-iodo-nonane is put inside the gas bubbler after being weighed with a precision balance (accuracy of 10−5g). After the measurement, the concentration has been calculated, dividing the quantity of 1-iodo-nonane, just measured before, by the evaporation time, taking into account also the volume of 1-iodo-nonane in the chamber and the volume of the chamber itself. The characteristics of 1-iodo-nonane used for the tests are listed in Table 2.
3. Results and Discussion
From the experimental data presented in the section above, it can be observed that the sensors that are most sensitive to benzene are, in order of decreasing response, R (defined as the ratio of the conductance in gas and the conductance in air): TiTaV (peak of 7.43 at 400°C), ST25 650 (peak of 6.22 at 500°C), ST25 + Au1% (peak of 5.28 at 500°C), STN (peak of 5.04 at 500°C, 4.95 at 550°C and 4.91 at 600°C) and ST20 650 (peak of 3.93 at 600°C). For methane, the most sensitive sensors are: ST25 650 (peak of 3.85 at 600°C), ST25 + Au1% (peak of 3.85 at 600°C) and STN (peak of 3.06 at 650°C and of 3.04 at 600°C). We determined from these observations that the best sensors to detect benzene tend to be the same as those to detect methane. However, it is possible to choose, for each sensor, a specific temperature at which it is more selective to benzene than to methane (Tbest): These temperatures are listed in Table 3.
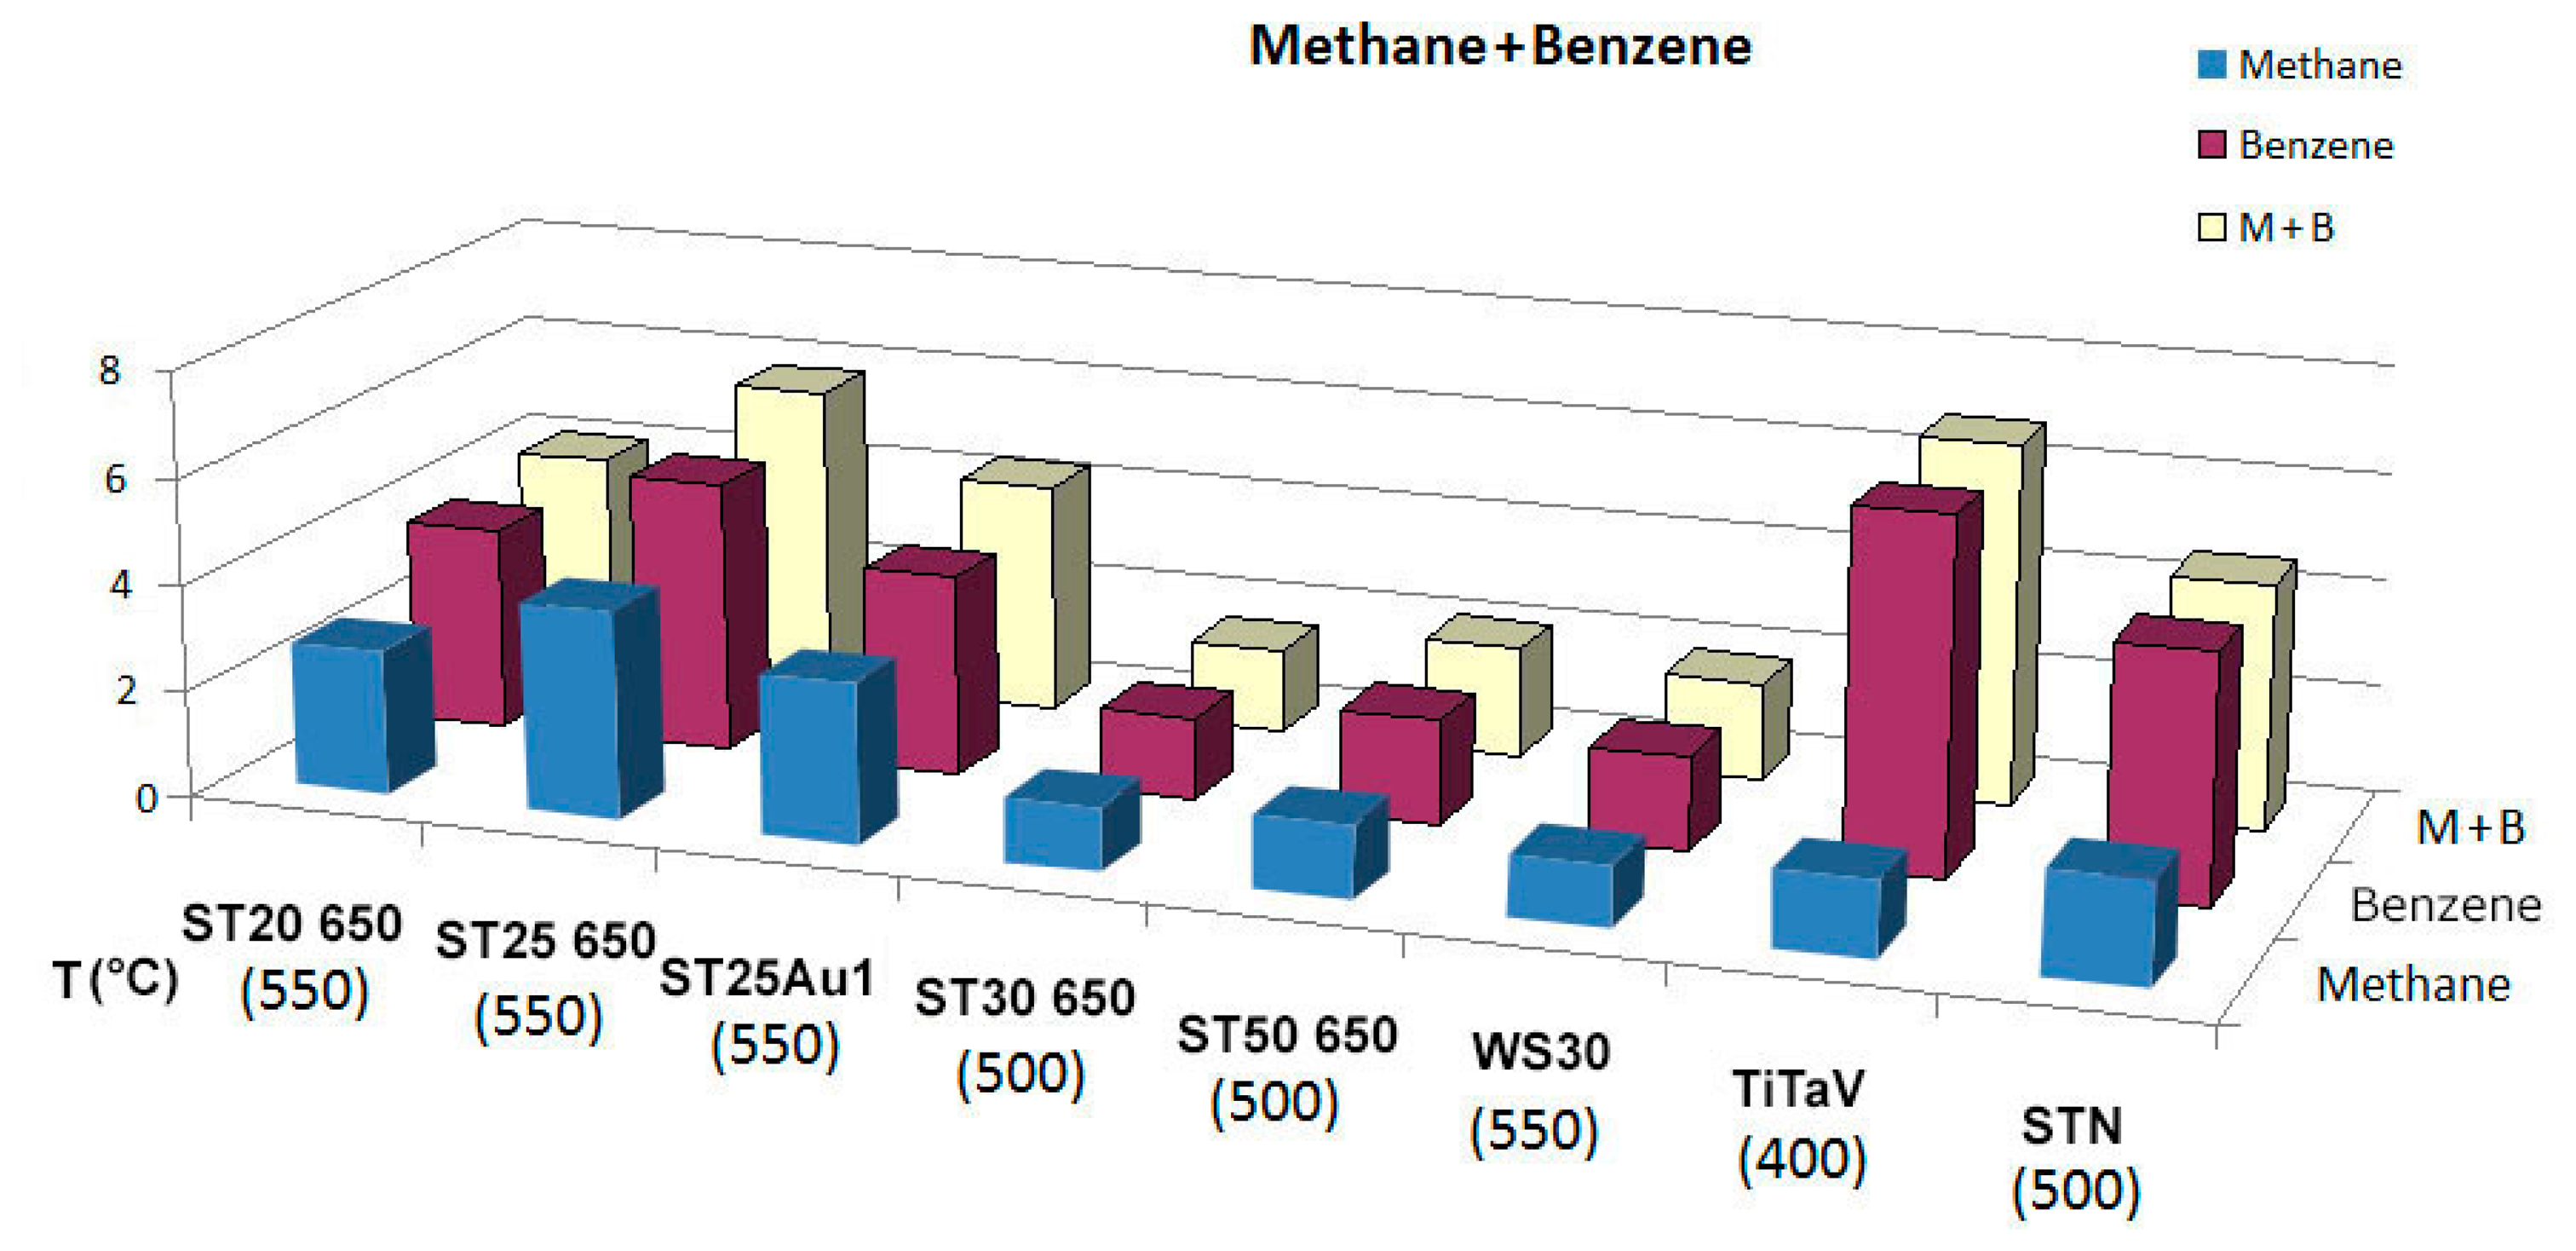
In order to test the interference of methane in the detection of benzene, the two gases were injected together into the test chamber. In Figure 7 the response of the sensors to the two gases, injected separately and in combination, are reported. In particular, the response of TiTaV to C6H6 is 4.76-times higher than that to CH4, and the response of STN to C6H6 is 1.31-times higher than that to CH4, at these concentrations.
The NO tests resulted in a relatively peaked temperature dependence; therefore, it is possible to tune the temperature to avoid the effects of the undesired compound. As we can see from the experimental data, the most selective sensors for benzene with respect to NO are ST25 650 at 500°C (ratio 3.91), and STN at 500°C (ratio 3.88).
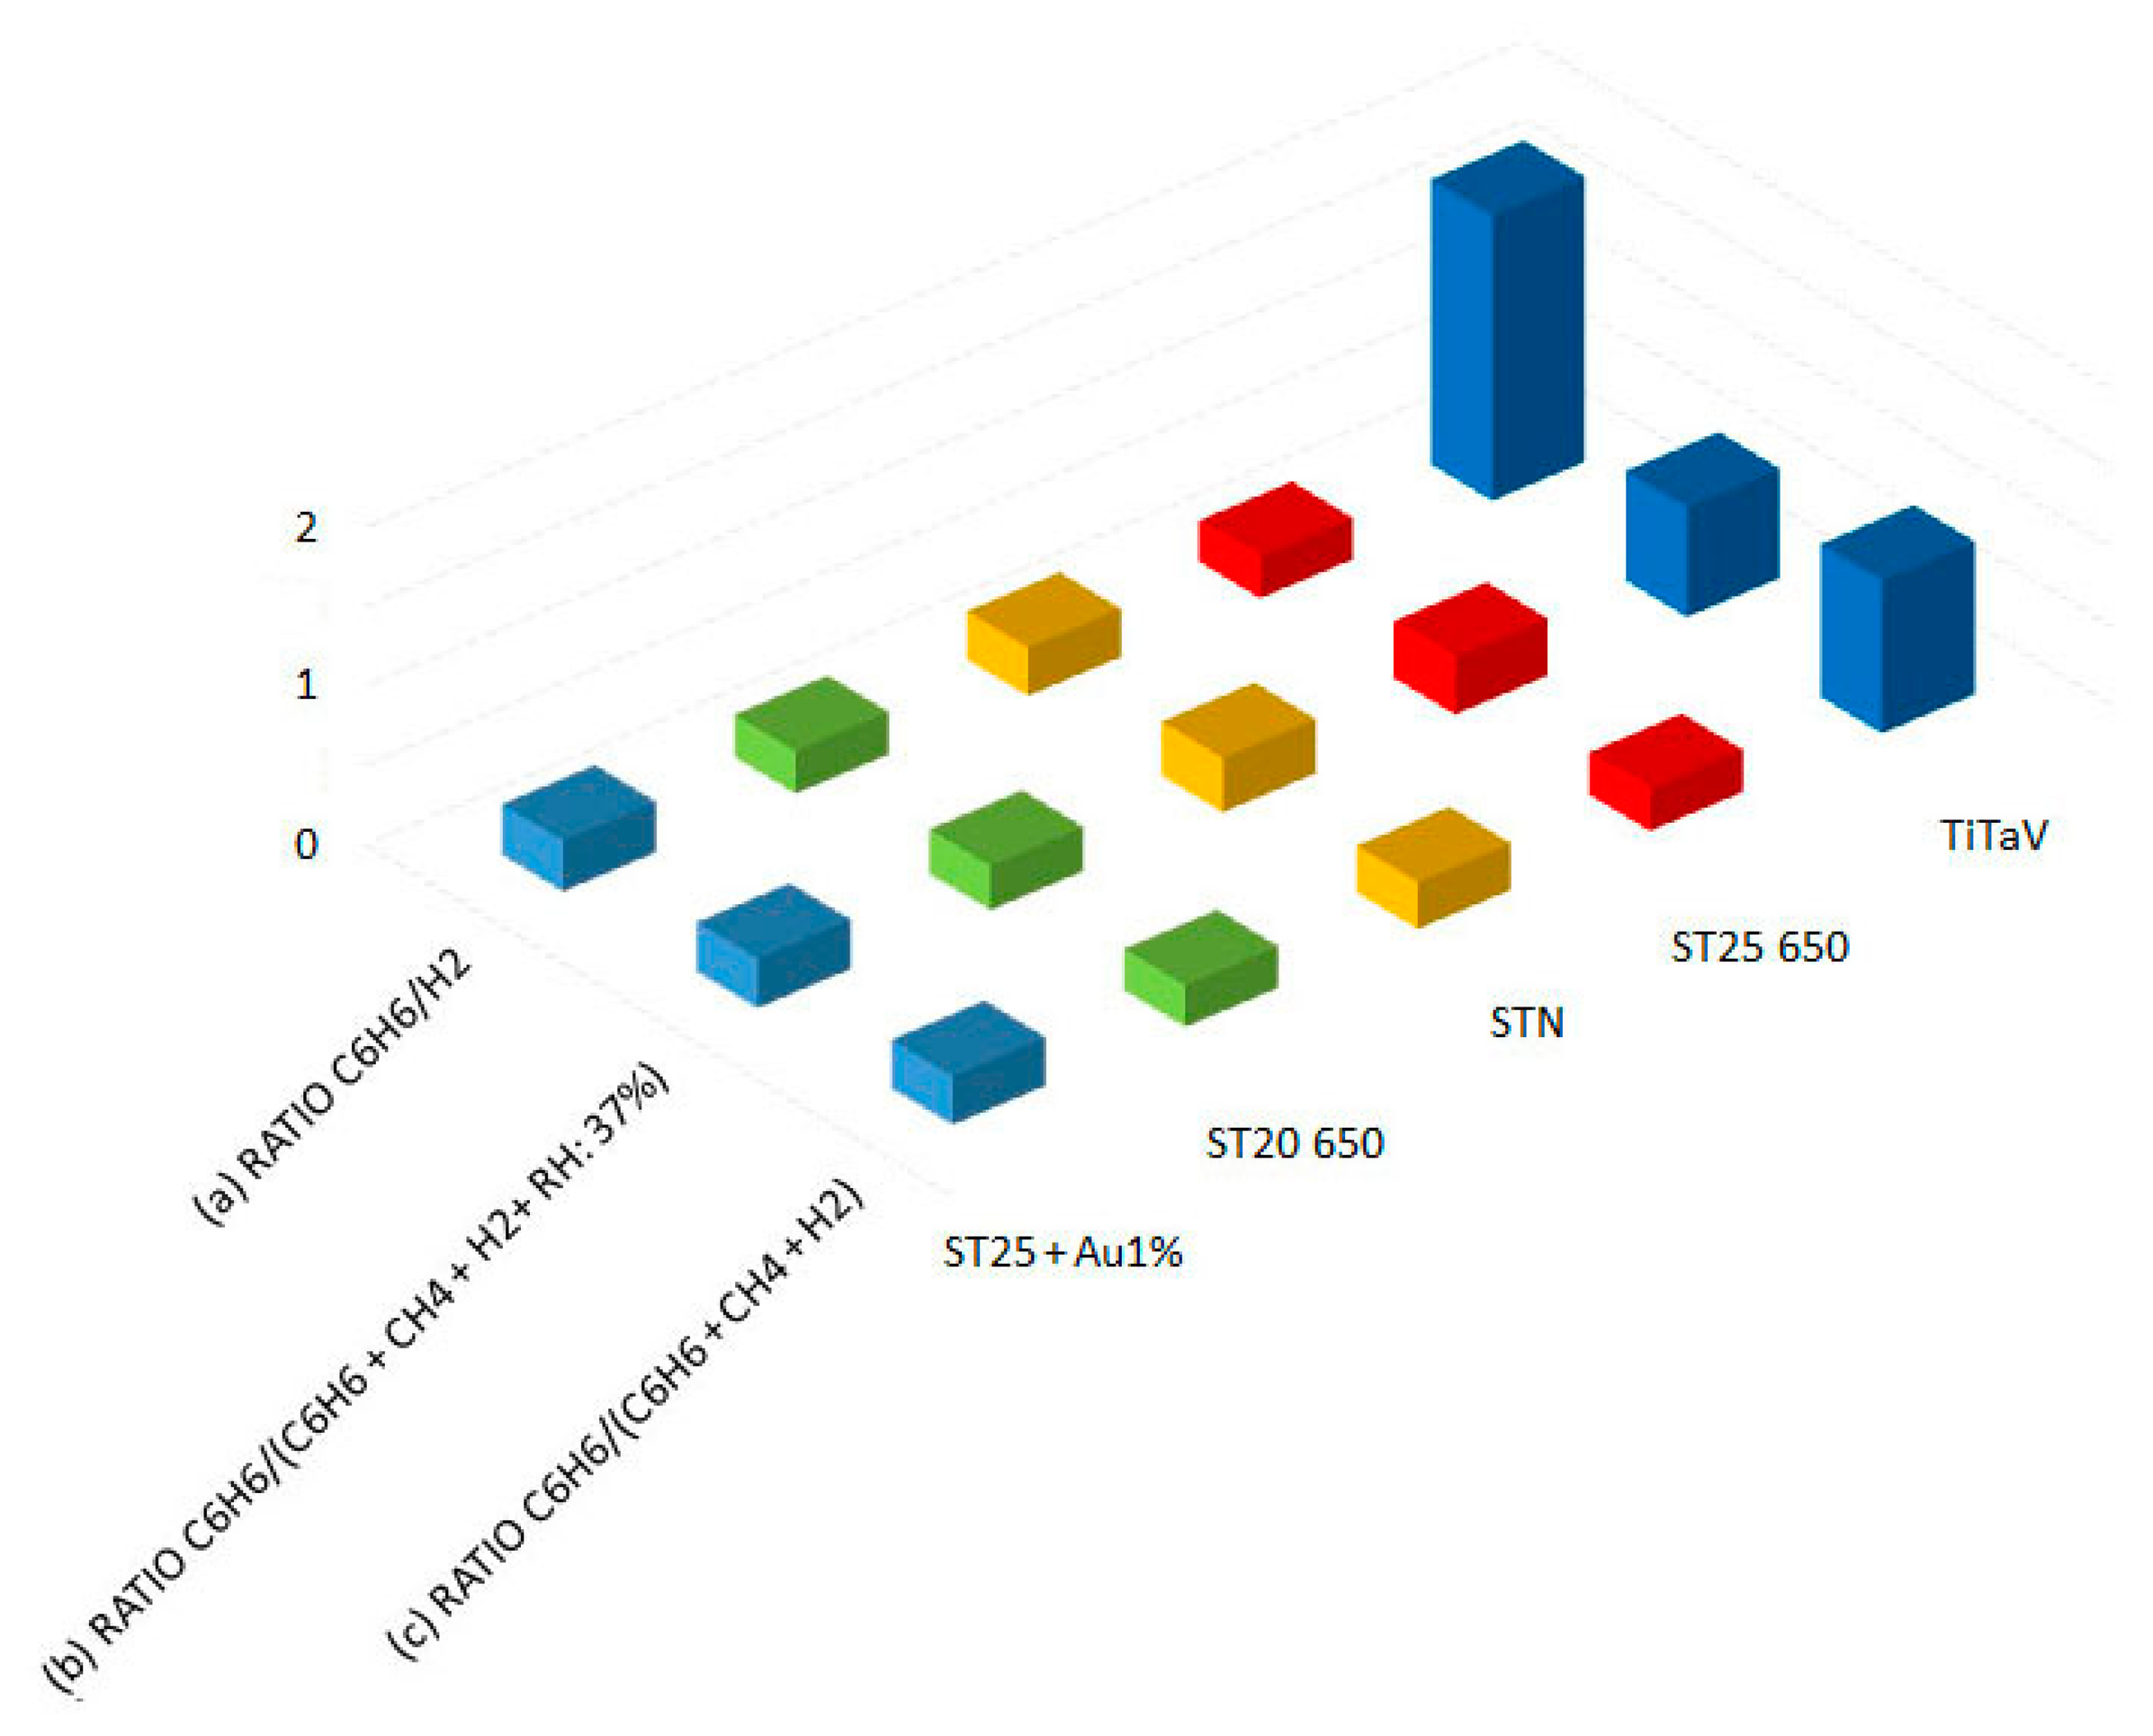
As anticipated in Section 2, Figure 8 shows the ratios between benzene and interferers as methane, hydrogen and water vapor. From Line (a), we see that the responses of ST25 650, ST20 650, STN and ST25 + Au1% are considerably affected by the presence of H2, while the response of TiTaV remains almost unaffected (the ratio C6H6/H2 is 1.8). Comparing Lines (b) and (c), it is evident that humidity tends to reduce the response of TiTaV in the presence of H2 and CH4; however, it remains a selective material for benzene (C6H6/(C6H6 + CH4 + H2) ∼1 without humidity and ∼0.7 with RH = 37%).
Tests with 1-iodo-nonane were performed in a temperature range spanning from 300°C to 650°C, with steps of 50°C. The concentrations calculated for this VOC are in the range between ∼3 and 5 ppm. As reported in Figure 6, sensors with the best response to 1-iodo-nonane are, in order of decreasing response, ST25 650 (peak at 350°C of 6.05), ST20 650 (peak at 350°C of 5.87), ST25 + Au1% (peak at 350°C of 5.69), WS30 (peak at 300°C of 4.76) and STN (peak at 350°C of 4.62). The effect of NO and CH4 as interfering gases in the measurements of 1-iodo-nonane has been tested, resulting in a negligible disturbance.
Concentration tests for 1-iodo-nonane were made with an array of sensors composed of ST20 650, ST25 650, ST25 + Au1% and ST30 650, to study how the responses vary along with concentration. RH has been fixed at about 18% during the measurement. Results are summarized in Figure 9.
The response and recovery times vary from sensor to sensor and are linked to numerous variables (e.g., working temperature of the sensors, presence of humidity, gas species and concentration). In our tests, the response time is always faster than the recovery, and these vary from a few minutes to about one hour.
4. Conclusions
A set of sensors made of single and mixed oxides has been tested with benzene and 1-iodo-nonane. An array of sensors was then obtained combining different materials working at their best temperatures, which proved to be highly selective to these gases, also in a background of realistic concentrations of CH4, NO and H2. All sensors in the array show a response that can be fitted with a fourth order polynomial with a peak around the best working temperature (an example of fit for WS30 650 in Figure 10).
The best working temperature has been determined for each sensor, and the responses of the different films to the target compounds have been analyzed. The sensors that resulted in being the most selective to benzene in dry conditions in a methane background are TiTaV (tin, tantalum and vanadium oxides) and STN (mixed tin, titanium and niobium oxides) and in NO background are ST25 650 (tin, titanium) and STN. TiTaV shows a great selectivity to benzene also when a high concentration of hydrogen is injected. Humidity tends to lower the responses without substantially changing their trends. The best sensors to detect 1-iodo-nonane in a wet ambient environment are ST20 650, ST25 650 and ST25 + Au1%, and their responses tend to increase along with concentration (order of 10−2 ppm). The chosen array will serve as the basis to set up an electronic network of sensors to be trained for target gases in CRC screening. This device may represent a non-invasive and potentially inexpensive pre-screening method for the diagnosis of CRC and a substitute of preventive colonoscopy.
Author Contributions
C.M. and V.G. conceived and designed the experiments; N.L. performed the experiments; B.F. and A.G. analyzed the data; S.G. contributed analysis tools; G.Z. wrote the paper.
Conflicts of Interest
The authors declare no conflict of interest.
References
- Fortina, P.; Kricka, L. Application of nanoparticles to diagnostics and therapeutics in colorectal cancer. Trends Biotechnol. 2007, 25, 145–152. [Google Scholar]
- Bajaj, A.; Miranda, O.R. Detection and differentiation of normal, cancerous, and metastatic cells using nanoparticle-polymer sensor arrays. Proc. Natl. Acad. Sci. USA 2009, 106, 10912–10916. [Google Scholar]
- Colorectal Cancer Facts & Figures. Available online: http://www.cancer.org/acs/groups/content/@epidemiologysurveilance/documents/document/acspc-028312.pdf (accessed on 11 October 2014).
- Hompes, R.; Cunningham, C. Colorectal cancer: Management. Medicine 2011, 29, 254–258. [Google Scholar]
- Horvath, L.; Lazar, Z. Exhaled biomarkers in lung cancer. Eur. Respir. J. 2009, 34, 261–275. [Google Scholar]
- Buzewski, S.; Rudnicka, J. Analytical and unconventional methods of cancer detection using odor. Trends Anal. Chem. 2012, 38, 1–12. [Google Scholar]
- Amann, A.; Spanel, P. Breath analysis: The approach towards clinical applications. Mini Rev. Med. Chem. 2007, 7, 115–129. [Google Scholar]
- Mazzone, P.J. Analysis of volatile organic compounds in the exhaled breath for the diagnosis of lung cancer. J. Thorac. Oncol. 2008, 3, 774–780. [Google Scholar]
- Di Lena, M.; Travaglio, E. New strategies of colorectal cancer screening. World J. Gastroenterol. 2013, 19, 1855–1860. [Google Scholar]
- Peng, G.; Hakim, M. Detection of lung, breast, colorectal, and prostate cancers from exhaled breath using a single array of nanosensors. Br. J. Cancer 2010, 103, 542–551. [Google Scholar]
- Altomare, D.F.; di Lena, M. Exhaled volatile organic compounds identify patients with colorectal cancer. Wiley Online Libr. 2013. [Google Scholar] [CrossRef]
- Tomlin, J.; Lowis, C. Investigation of normal flatus production in healthy volunteers. Gut. 1991, 32, 665–669. [Google Scholar]
- Suarez, F.L.; Springfield, J. Identification of gases responsible for the odour of human flatus and evaluation of a device purported to reduce this odour. Gut. 1998, 43, 100–104. [Google Scholar]
- Suarez, F.; Furne, J. Insights into human colonic physiology obtained from the study of flatus composition. Am. J. Physiol. 1997, 272, G1028–G1033. [Google Scholar]
- Michael, D.; Levitt, M.D. Volume and Composition of Human Intestinal Gas Determined by Means of an Intestinal Washout Technic. N. Engl. J. Med. 1971, 284, 1394–1398. [Google Scholar]
- Salzman, A.L. Nitric oxide in the gut. New Horiz. 1995, 3, 33–45. [Google Scholar]
- Blo, M.; Carotta, M.C. Synthesis of pure and loaded powders of WO3 for NO2 detection through thick film technology. Sens. Actuators B Chem. 2004, 103, 213–218. [Google Scholar]
- Guidi, V.; Malagu', C. Printed Films: Materials Science and Applications in Sensors, Electronics and Photonics; Woodhead Publishing: Cambridge UK, 2012; pp. 278–334. [Google Scholar]
- Ghiotti, G.; Chiorino, A. Preparation and characterization of WOx/SnO2 nanosized powders for thick films gas sensor. Stud. Surf. Sci. Catal. 2001, 140, 287–296. [Google Scholar]
- Benetti, M.; Blo, M. Symplectic gel co-precipitation of TixSn1−xO2 solid solutions for gas sensing.
- Carotta, M.C.; Benetti, M. Nanostructured (Sn, Ti, Nb) O2 solid solutions for hydrogen sensing. 68210.
- Maria, C.C.; Vincenzo, G. Vanadium and tantalum-doped titanium oxide (TiTaV): A novel material for gas sensing. Sens. Actuators B Chem. 2005, 108, 89–96. [Google Scholar]
- Carotta, M.C.; Cervi, A. Metal-oxide solid solutions for light alkane sensing. Sens. Actuators B Chem. 2008, 133, 516–520. [Google Scholar]
- Carotta, M.C.; Cervi, A. Ethanol interference in light alkane sensing by metal-oxide solid solutions. Sens. Actuators B Chem. 2009, 136, 405–409. [Google Scholar]
- NIST (National Institute of Standards and Technology). Available online: http://webbook.nist.gov/cgi/inchi/InChI%3D1S/C9H19I/c1-2-3-4-5-6-7-8-9-10/h2-9H2,1H3 (accessed on 11 October 2014).


| Name | Film Composition |
|---|---|
| ST20 650 | SnO2, TiO2 (20%) |
| ST25 650 | SnO2, TiO2 (25%) |
| ST25 + Au1% | SnO2, TiO2 (25%), Au (1%) |
| ST30 650 | SnO2, TiO2 (30%) |
| ST50 650 | SnO2, TiO2 (50%) |
| WS30 | WO3, SnO2 (30%) |
| TiTaV | TiO2, Ta2O5, vanadium oxide |
| STN | SnO2, TiO2, Nb2TiO7 |
| 1-iodo-nonane | |
|---|---|
| ASSAY | 95% |
| CONTAINS | copper as stabilizer |
| REFRACTIVE INDEX | n20/D 1.487 |
| BOILING POINT | 107–108 °C/8 mmHg |
| DENSITY | 1.288 g/mL at 25 °C |
| PACKAGING | 25 g in glass bottle |
| Code | 139A/A4 | 157A/B5 | 158A/A5 | 143A/A4 | 147A/A10 | 145A/B9 | 104/B9 | 129/D1 |
| Sensor | ST20 650 | ST25 650 | ST25Au1 | ST30 650 | ST50 650 | WS30 | TiTaV | STN |
| Tbest | 550 | 550 | 550 | 500 | 500 | 550 | 400 | 500 |
© 2014 by the authors; licensee MDPI, Basel, Switzerland. This article is an open access article distributed under the terms and conditions of the Creative Commons Attribution license ( http://creativecommons.org/licenses/by/4.0/).
Share and Cite
Malagù, C.; Fabbri, B.; Gherardi, S.; Giberti, A.; Guidi, V.; Landini, N.; Zonta, G. Chemoresistive Gas Sensors for the Detection of Colorectal Cancer Biomarkers. Sensors 2014, 14, 18982-18992. https://doi.org/10.3390/s141018982
Malagù C, Fabbri B, Gherardi S, Giberti A, Guidi V, Landini N, Zonta G. Chemoresistive Gas Sensors for the Detection of Colorectal Cancer Biomarkers. Sensors. 2014; 14(10):18982-18992. https://doi.org/10.3390/s141018982
Chicago/Turabian StyleMalagù, Cesare, Barbara Fabbri, Sandro Gherardi, Alessio Giberti, Vincenzo Guidi, Nicolò Landini, and Giulia Zonta. 2014. "Chemoresistive Gas Sensors for the Detection of Colorectal Cancer Biomarkers" Sensors 14, no. 10: 18982-18992. https://doi.org/10.3390/s141018982
APA StyleMalagù, C., Fabbri, B., Gherardi, S., Giberti, A., Guidi, V., Landini, N., & Zonta, G. (2014). Chemoresistive Gas Sensors for the Detection of Colorectal Cancer Biomarkers. Sensors, 14(10), 18982-18992. https://doi.org/10.3390/s141018982