NO and NO2 Sensing Properties of WO3 and Co3O4 Based Gas Sensors


Abstract
: Semiconductor-based gas sensors that use n-type WO3 or p-type Co3O4 powder were fabricated and their gas sensing properties toward NO2 or NO (0.5–5 ppm in air) were investigated at 100 °C or 200 °C. The resistance of the WO3-based sensor increased on exposure to NO2 and NO. On the other hand, the resistance of the Co3O4-based sensor varied depending on the operating temperature and the gas species. The chemical states of the surface of WO3 or those of the Co3O4 powder on exposure to 1 ppm NO2 and NO were investigated by diffuse reflectance infrared Fourier transform (DRIFT) spectroscopy. No clear differences between the chemical states of the metal oxide surface exposed to NO2 or NO could be detected from the DRIFT spectra.1. Introduction
Since environmentally hazardous gases include toxic and greenhouse effect gases, the threshold limit value, which is defined as the maximum concentration of a chemical allowable for repeated exposure without producing adverse health effects, is regulated by the American Conference of Governmental Industrial Hygienists [1]. Effective and inexpensive systems for the detection and quantification of environmentally hazardous gases are required. Standard air pollution measurements are still based on time-consuming and expensive analytical techniques such as optical spectroscopy and gas chromatography [2,3]. Gas sensors have been considered as promising candidates for measurement of environmental pollution levels because of their low cost, high sensitivity, fast response, and direct electronic interface.
Environmentally hazardous gases can be classified into oxidizing gases (such as NO2, CO2, and Cl2) and reducing gases (such as NO, H2S, CO, and C2H5OH). When an oxidizing gas is steamed on an n-type semiconductor surface, the concentration of electrons on the surface decreases and the resistance of the n-type semiconductor increases. In the case of a p-type semiconductor, the concentration of electrons on the p-type semiconductor surface decreases and the resistance of the p-type semiconductor decreases because the extracted electrons result in the generation holes in the valence band. When the reducing gas is streamed on a metal oxide semiconductor, the gas reacts with the oxygen ions on the semiconductor surface, releasing electrons back to the conduction band. Therefore, when the concentration of electrons on the semiconductor surface increases, the resistance of the n-type semiconductor decreases and that of the p-type semiconductor increases because the generated electrons recombine with holes [4].
Many kinds of NOx (NO and NO2) gas sensors including metal oxide semiconductors [5–7] and solid electrolytes [8,9] have been investigated. Among metal oxide semiconductors, n-type semiconductors, specifically those based on WO3, which are highly sensitive, are promising candidates that can be used for the detection of NOx gas [10–12]. Despite the large number of reports on the use of metal oxide semiconductors for the detection of NOx, only a few make a clear distinction between the response toward NO and NO2. Because NO is easily oxidized to NO2 in air, the detection of NO2 gas is carried out via the oxidation of NO by an oxidizing agent such as alumina supported potassium permanganate or by oxygen in air over a catalyst such as Pt [13,14]. To develop a high-performance NO gas sensor, it is essential to understand the means of optimizing the semiconductor that constitutes the sensor.
In the present work, the gas sensing properties of the sensor element that uses both n-type WO3 and p-type Co3O4 toward the NO2 and NO were examined. The oxidation of NO was a thermally activated reaction in air atmosphere so that the in situ observation of the chemical state of NO2 and NO on the surface of the sensing material at the temperature of operation may provide important information on the gas detection mechanism. A diffuse reflectance infrared Fourier transform (DRIFT) spectroscopy is an excellent analysis to obtain the chemical state on the surface of the sensing material and has been performed to elucidate the gas detection mechanism of the gas sensors [15,16]. The chemical states of NO2 and NO on the surface of the semiconductor oxide were investigated by the DRIFT spectroscopy at a specific working temperature could be changed to indicate the two temperature used in this project.
2. Experimental
WO3 powder (99.5%, Wako Pure Chemical, Osaka, Japan) and Co3O4 powder (average particle size: 20∼30 nm, 99.8%, Sigma-Aldrich, St. Louis, MO, USA) were mixed with an organic dispersant, consisting of a mixture of ethyl cellulose and terpineol, to obtain a paste. The weight ratio of the mixture of ethyl cellulose and terpineol was 1:9. The weight ratio of the powder and the organic dispersant was 1:16. The paste was dispensed on a 5 × 9.5 mm2 surface-oxidized Si substrate, which consisted of a 2.5 × 4 mm2 platinum comb-type electrode with a gap and line width of 10 μm each. The substrate was annealed at 500 °C for 3 h under air to obtain the sensor elements consisting of n-type WO3 and p-type Co3O4.
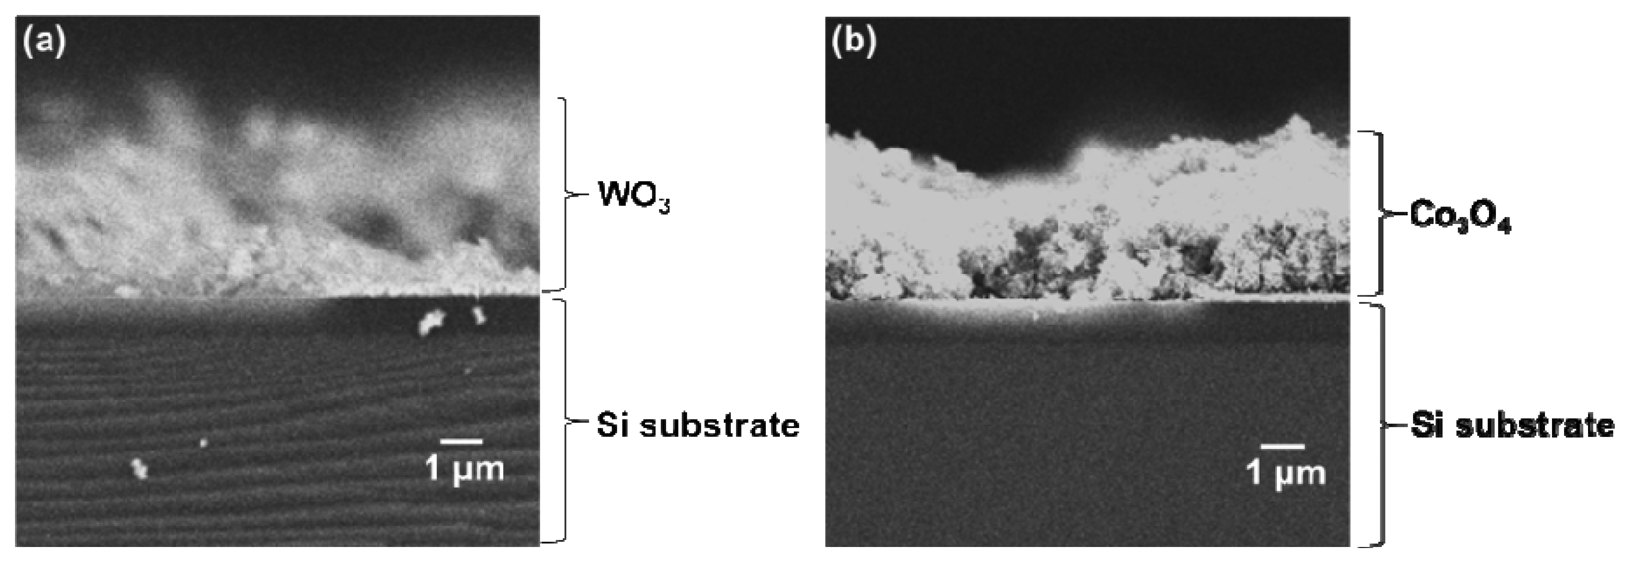
The cross-sectional SEM image of the sensor element of WO3 or Co3O4 was observed using field-emission scanning electron microscopy (FE-SEM; JSM-6335FM, JEOL, Tokyo, Japan). For the cross-sectional observations, the sensor element was broken at the center of the WO3 of Co3O4 film to form the sample. The thickness of the WO3 or Co3O4 film was estimated from the cross-sectional FE-SEM image.
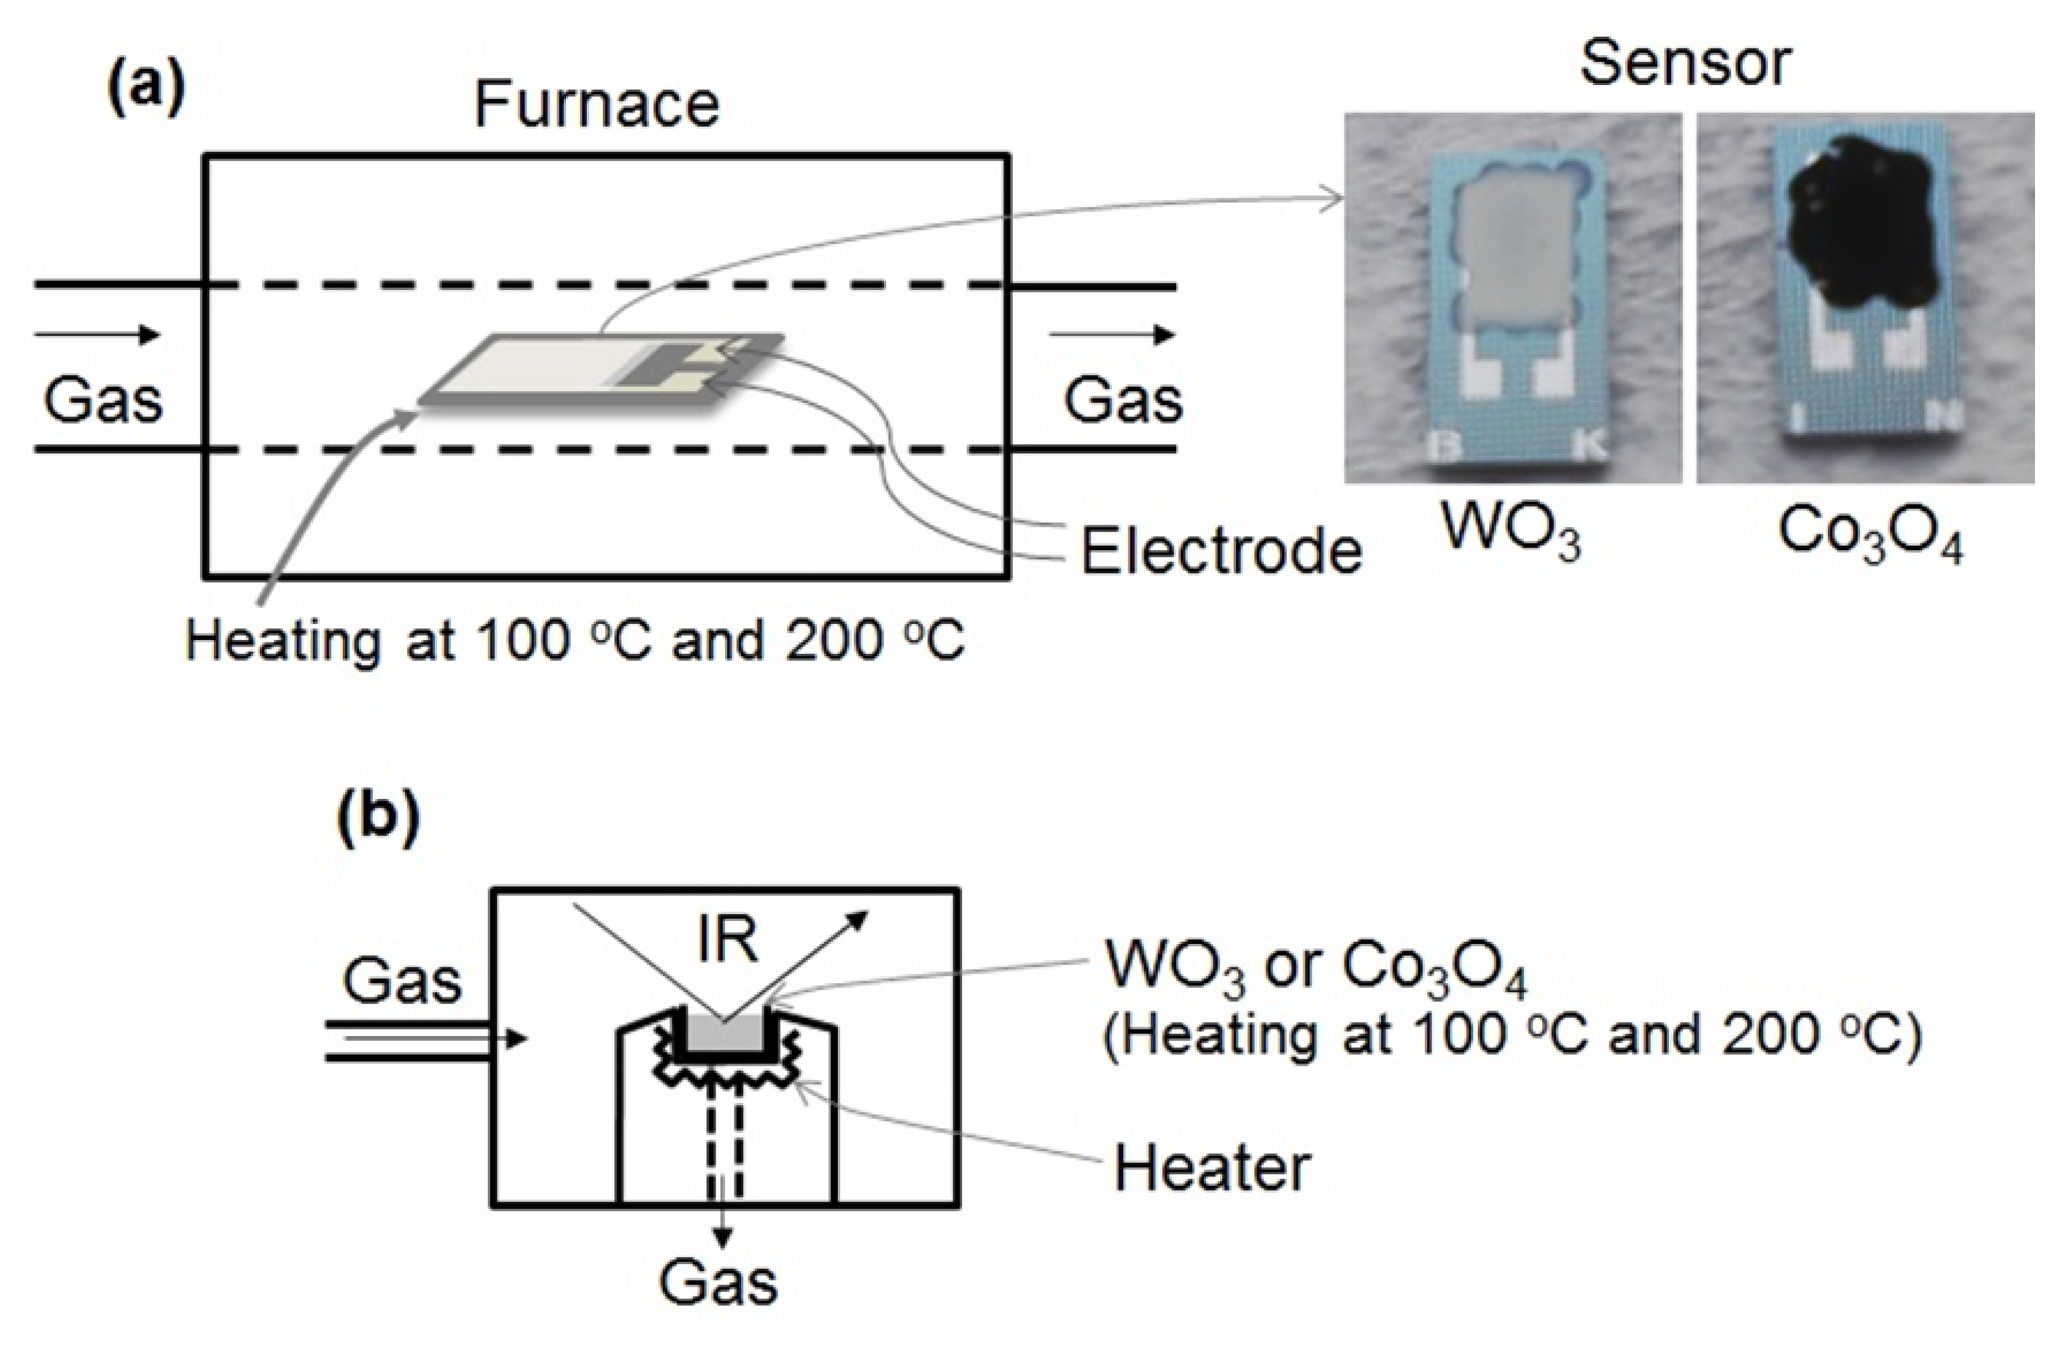
Figure 1 shows the schematic drawings of the experimental apparatus used for measuring the gas sensing properties and to carry out DRIFT spectroscopy. The gas sensing properties of the sensor element was measured using a flow-type gas sensing measurement apparatus as shown in Figure 1a. The element was placed in a tubular sample chamber heated to 100 °C or 200 °C in an electrical tube furnace. Air was introduced into the chamber for 15 min, and then, a gas mixture of NO2 or NO in air was injected for 15 min. Then the flow of gas mixture was halted and replaced by air injected at a flow rate of 200 mL/min. The concentration of NO2 or NO was controlled to take the values of 0, 0.5, 1, and 5 ppm in air. The electrical resistance of the element in various gaseous atmospheres was measured by a multimeter (K2700, Keithley, Cleveland, OH, USA). The electrical resistances of the sensor in air and under the gas mixture are denoted as Ra and Rg, respectively. The value of Rg of the element was measured after 15 min of exposure to NO2 or NO gas. When Rg is higher than Ra, the sensor response is defined as S = Rg/Ra. However, when Rg is lower than Ra, the response is defined as S = Ra/Rg.
The DRIFT spectrum of the WO3 and Co3O4 powder were recorded by a spectrometer (Nexus 470 FTIR, Nicolet, Waltham, MA, USA) equipped with liquid nitrogen cooled MCT detector, as shown in Figure 1b. After loading the powder into the DRIFT sample cell, the powder was purged under air flow and heated at 350 °C to eliminate impurities on the powder surface. Then, the powder was cooled at 100 °C or 200 °C to obtain the interferogram, which was used as the background reference for the DRIFT spectrum. Following this, 1 ppm NO or NO2 in air was introduced into the powder and the DRIFT spectrum was obtained. Then, the powder was purged to remove NO or NO2 by air flow and the DRIFT spectrum was once again obtained. The spectra were recorded at a spectral resolution of 1 cm−1 with 256 scans.
3. Results and Discussion
3.1. Gas Sensing Properties of WO3
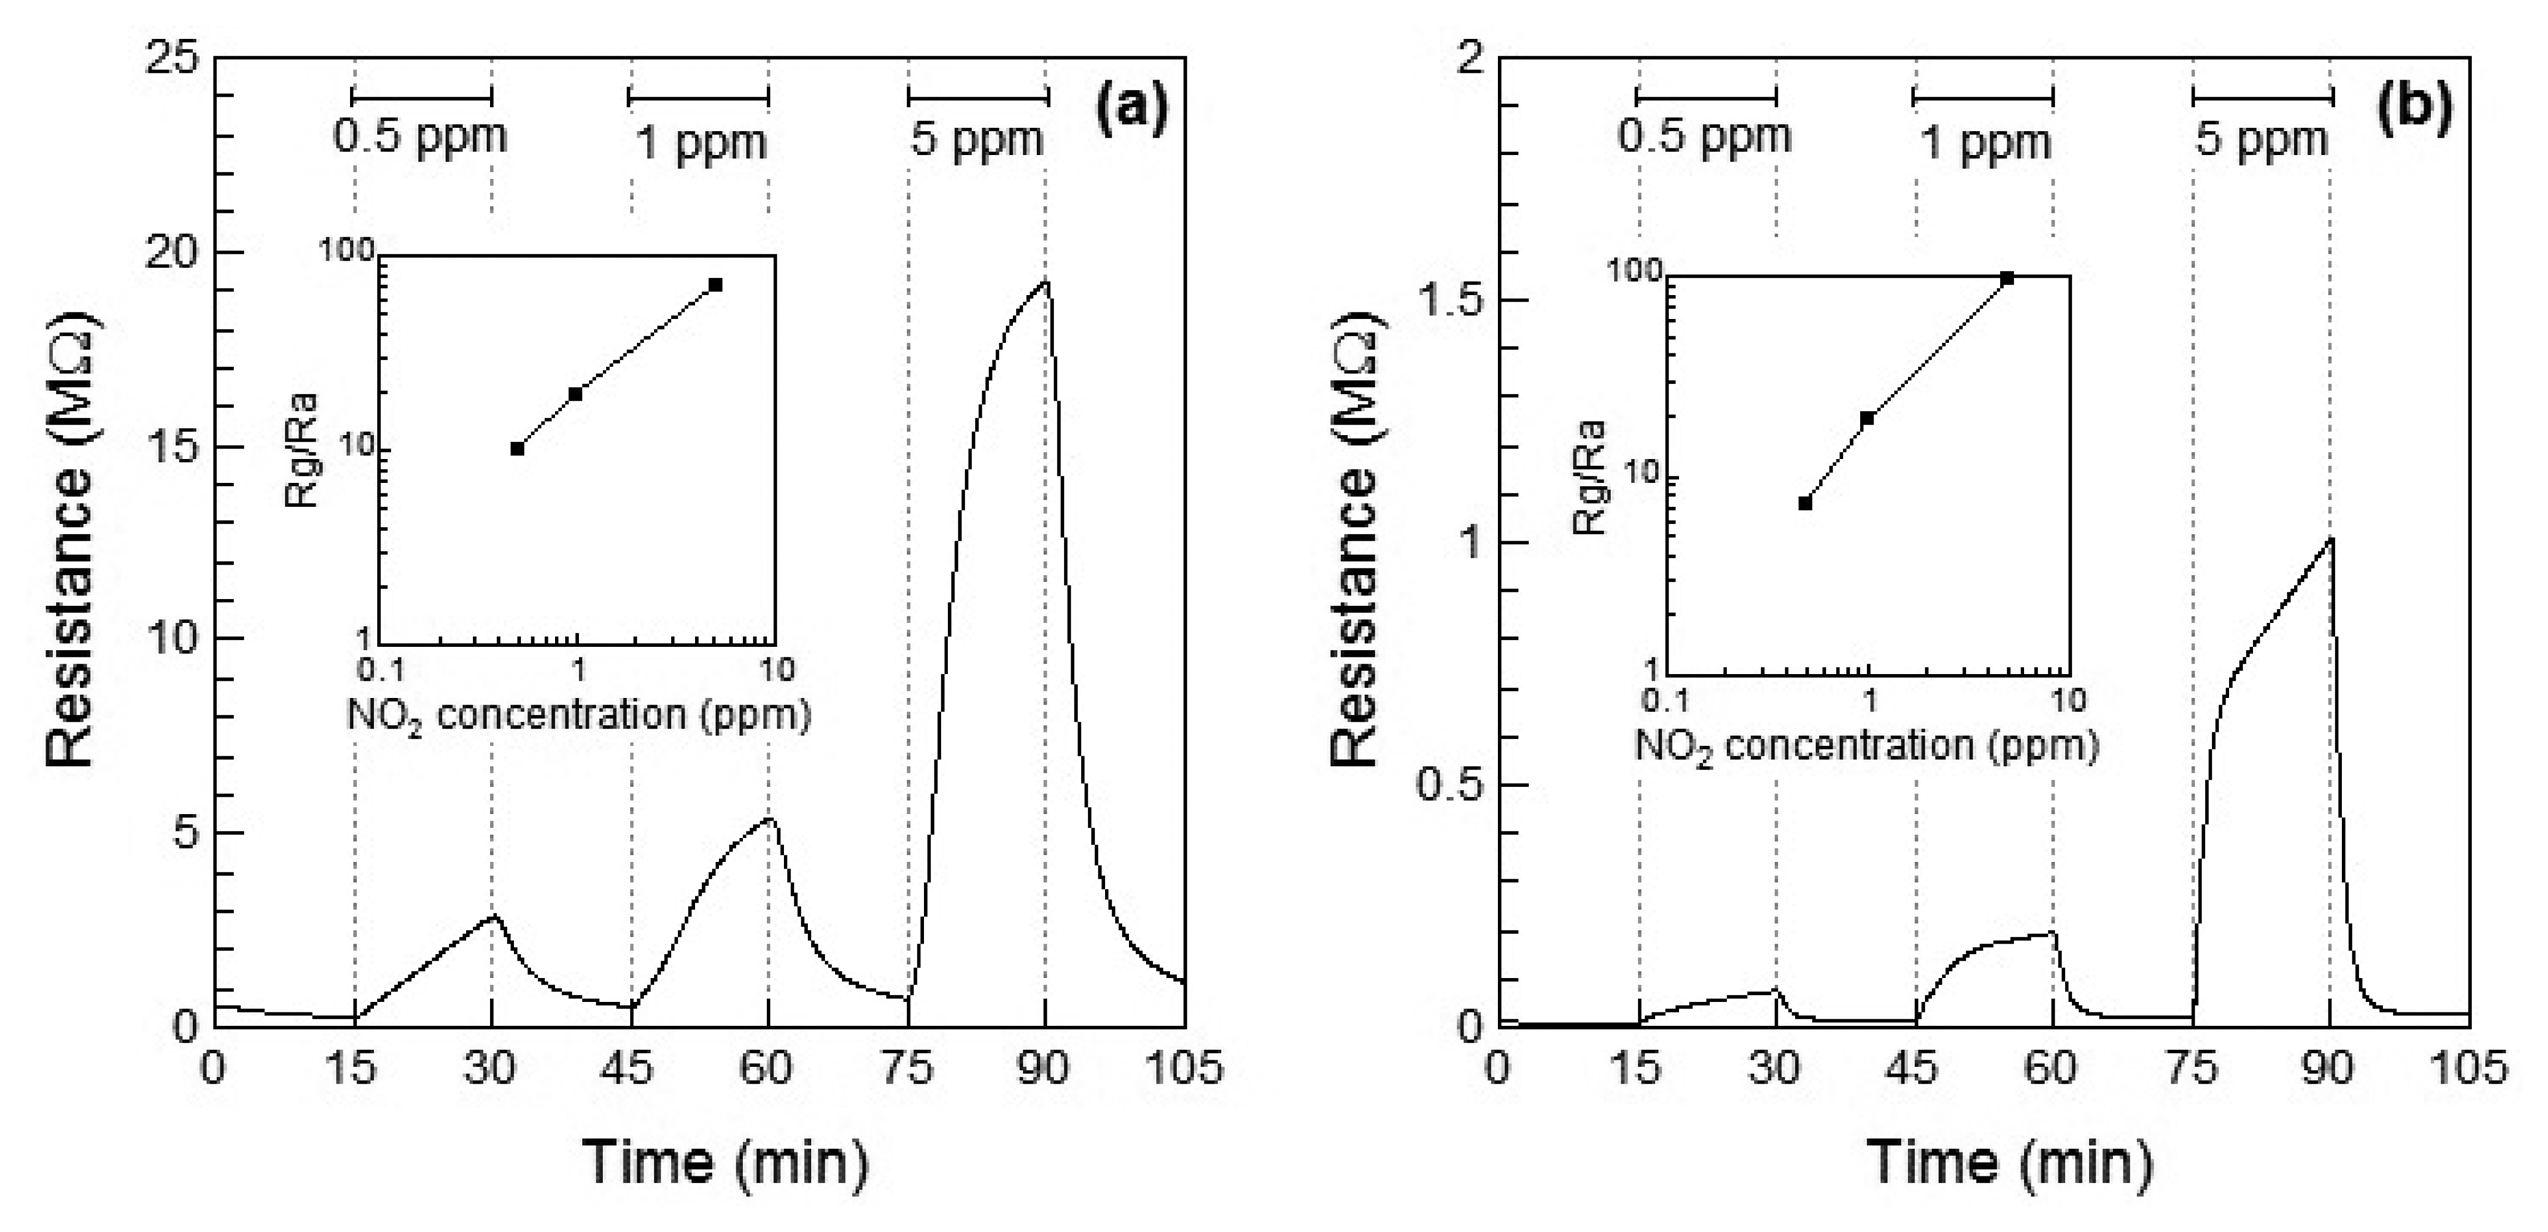
Figure 2a,b show the response of the WO3 sensor element to NO2 at 100 °C and 200 °C, respectively. When NO2 gas was introduced, the resistance of the WO3 sensor element increased with increase in the concentration of NO2. This is the typical response of an n-type oxide toward an oxidizing gas, leading to Rg > Ra. At 200 °C, Ra of WO3 decreased with temperature, and the sensor responses were higher than those at 100 °C. At 200 °C, the response of the WO3 sensor element increased to S = 19.2 at 1 ppm of NO2 and the response was adequately linear. The response and recovery times of the resistance of the WO3 sensor element reduced with increasing the operating temperature, but the resistance did not reach the saturation even after 15 min for NO2 exposure. The response time of the WO3 sensor element was not so fast in comparison with the other sensors [5–7]. In order to reduce the response and recovery times, the optimum operating temperature is required.
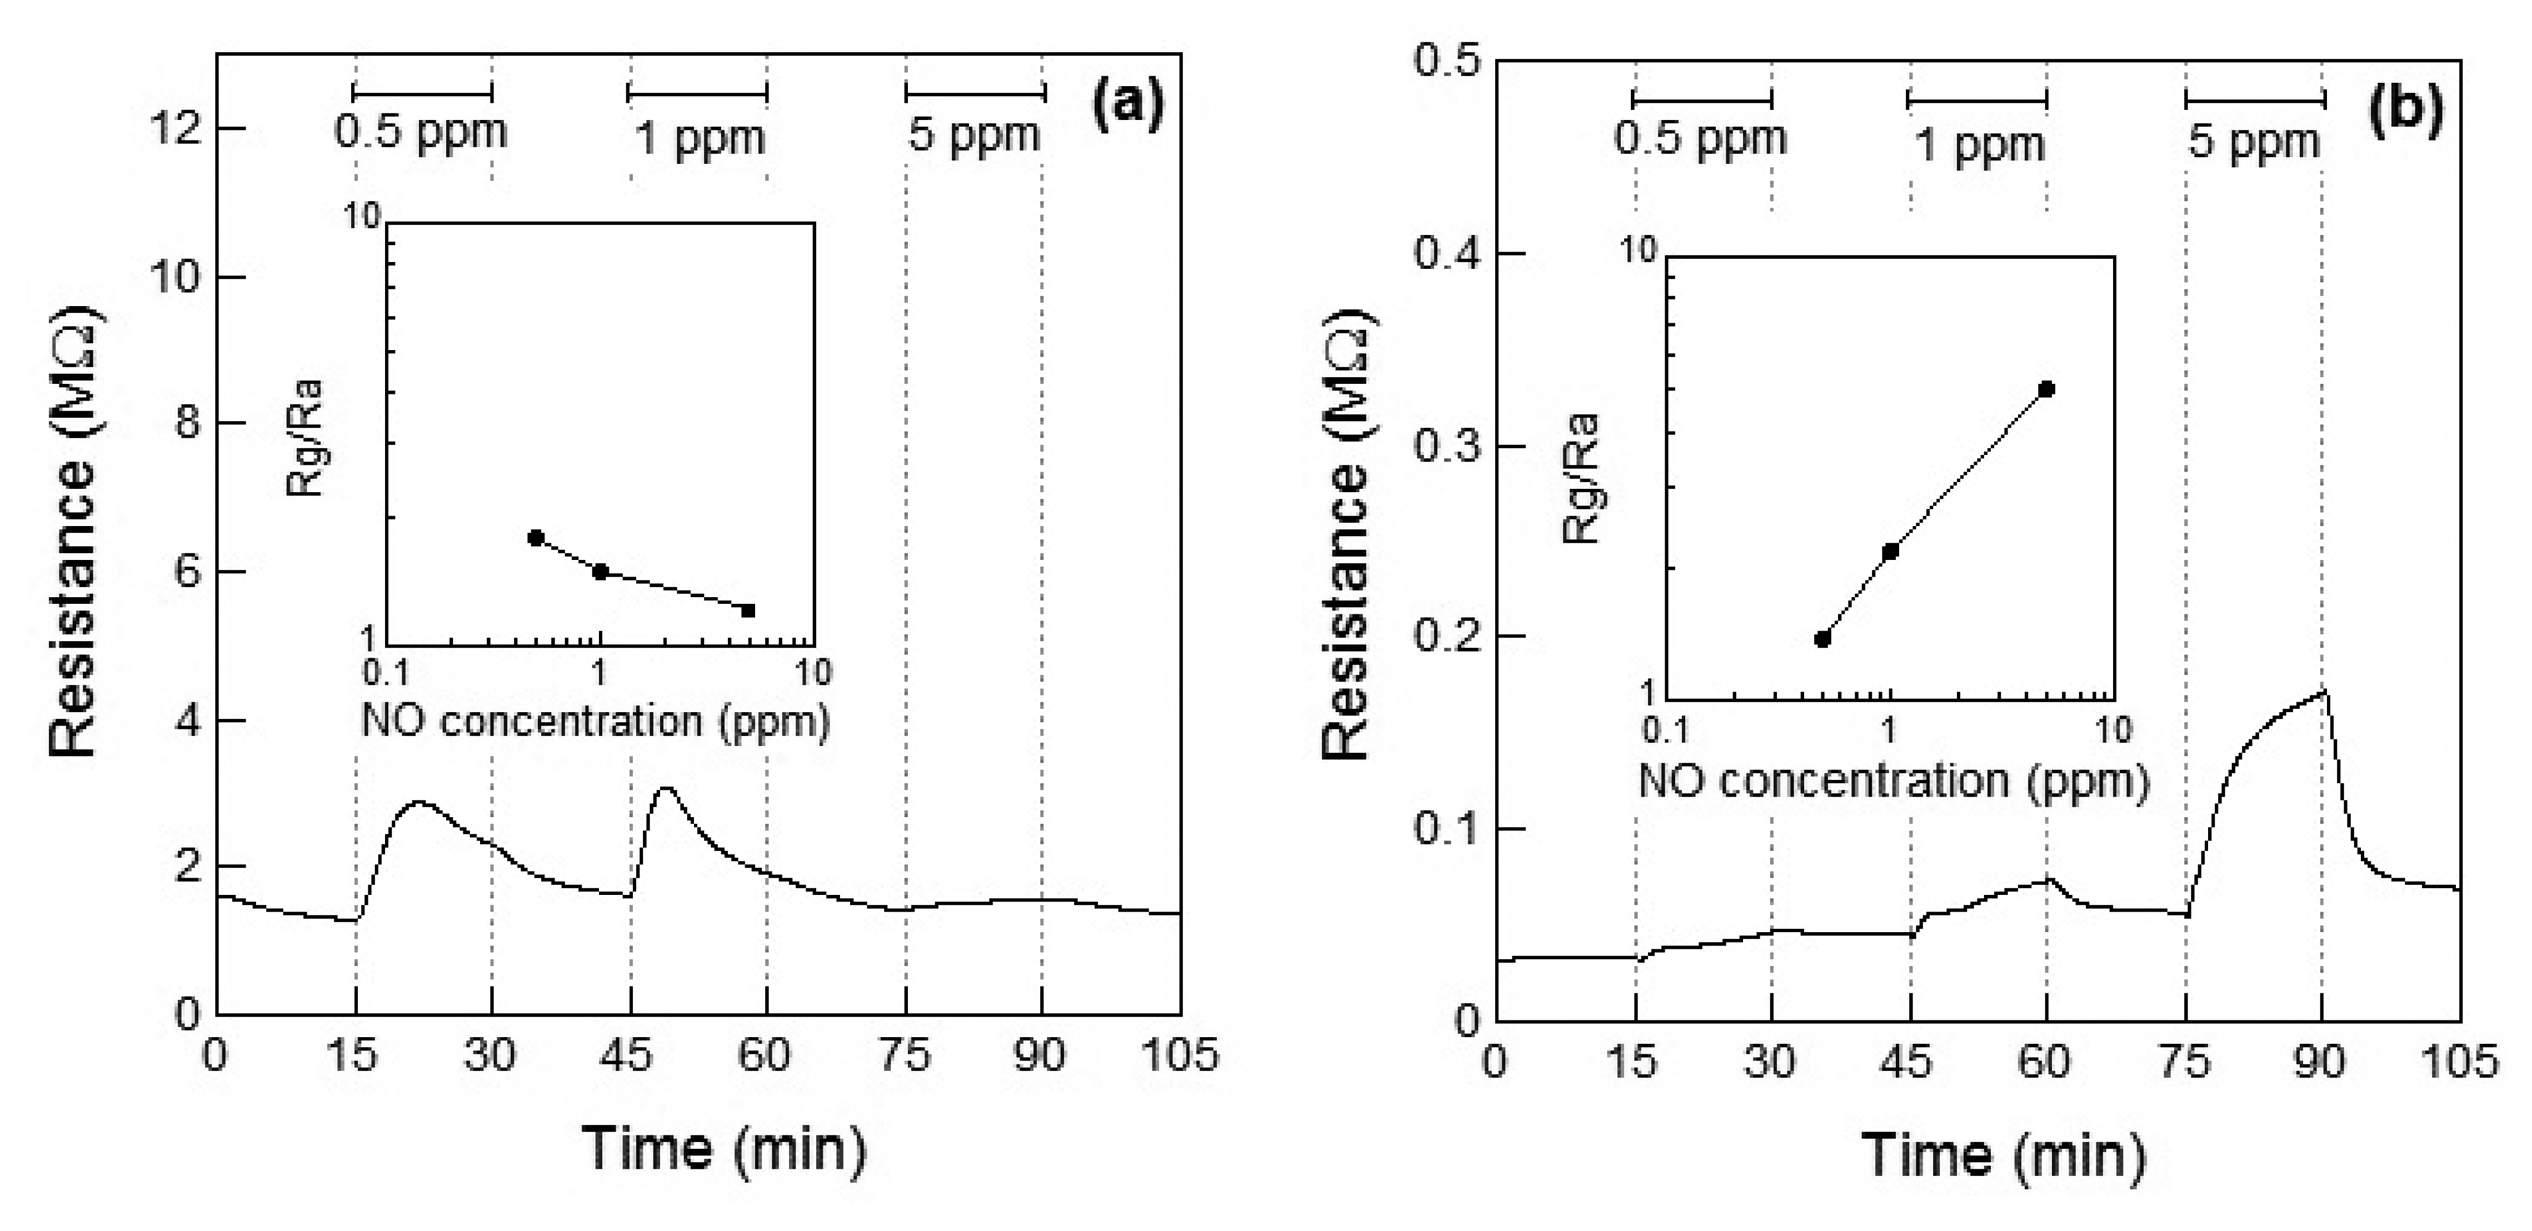
Figure 3a,b show the response of the WO3 sensor element to NO at 100 °C and 200 °C, respectively. When NO gas was introduced at 100 °C, the resistance of the sensor element immediately increased and then subsequently decreased within 10 min. No clear relationship between the gas concentration and sensor response could be observed. Therefore, the resistance of the sensor to 5 ppm of NO was smaller than that to 0.5 and 1 ppm NO. The unexpected changes of the sensor resistance of WO3 are supposed to be under the influence of the low operating temperature of 100 °C, which is not high enough for desorption of the reaction product on the WO3. However, when the WO3 sensor was exposed to NO gas at 200 °C, the resistance of the element increased with increase in the concentration of NO, similar to the response shown to NO2, as seen in Figure 2b. At 200 °C, the response of the WO3 sensor element to 1 ppm NO was S = 2.2, and the response was adequately linear.
The resistance of the WO3 sensor element increased by exposure to NO2 and NO at 200 °C. Although the resistance of the sensor based on the n-type WO3 is considered to be decreased by exposure to reductive NO, the resistance increased, as shown in Figure 3a,b. Since NO with an unpaired electron is unstable state, NO easily reacts with oxygen in air to become a stable NO2. The reaction of NO to NO2 proceeds with temperature [13]. It has previously been reported that NO could be partially oxidized to NO2 and leading to adsorption of NO2 on WO3 (or Pt-doped WO3) surface, which has been confirmed by temperature programmed desorption (TPD) analysis [17]. Therefore, we assumed that the resistance of the sensor on exposure to NO increased and the responses of the sensor toward NO exposure were smaller than those toward NO2 exposure at 100 °C and 200 °C because of the partial oxidation of NO.
3.2. Gas Sensing Properties of Co3O4
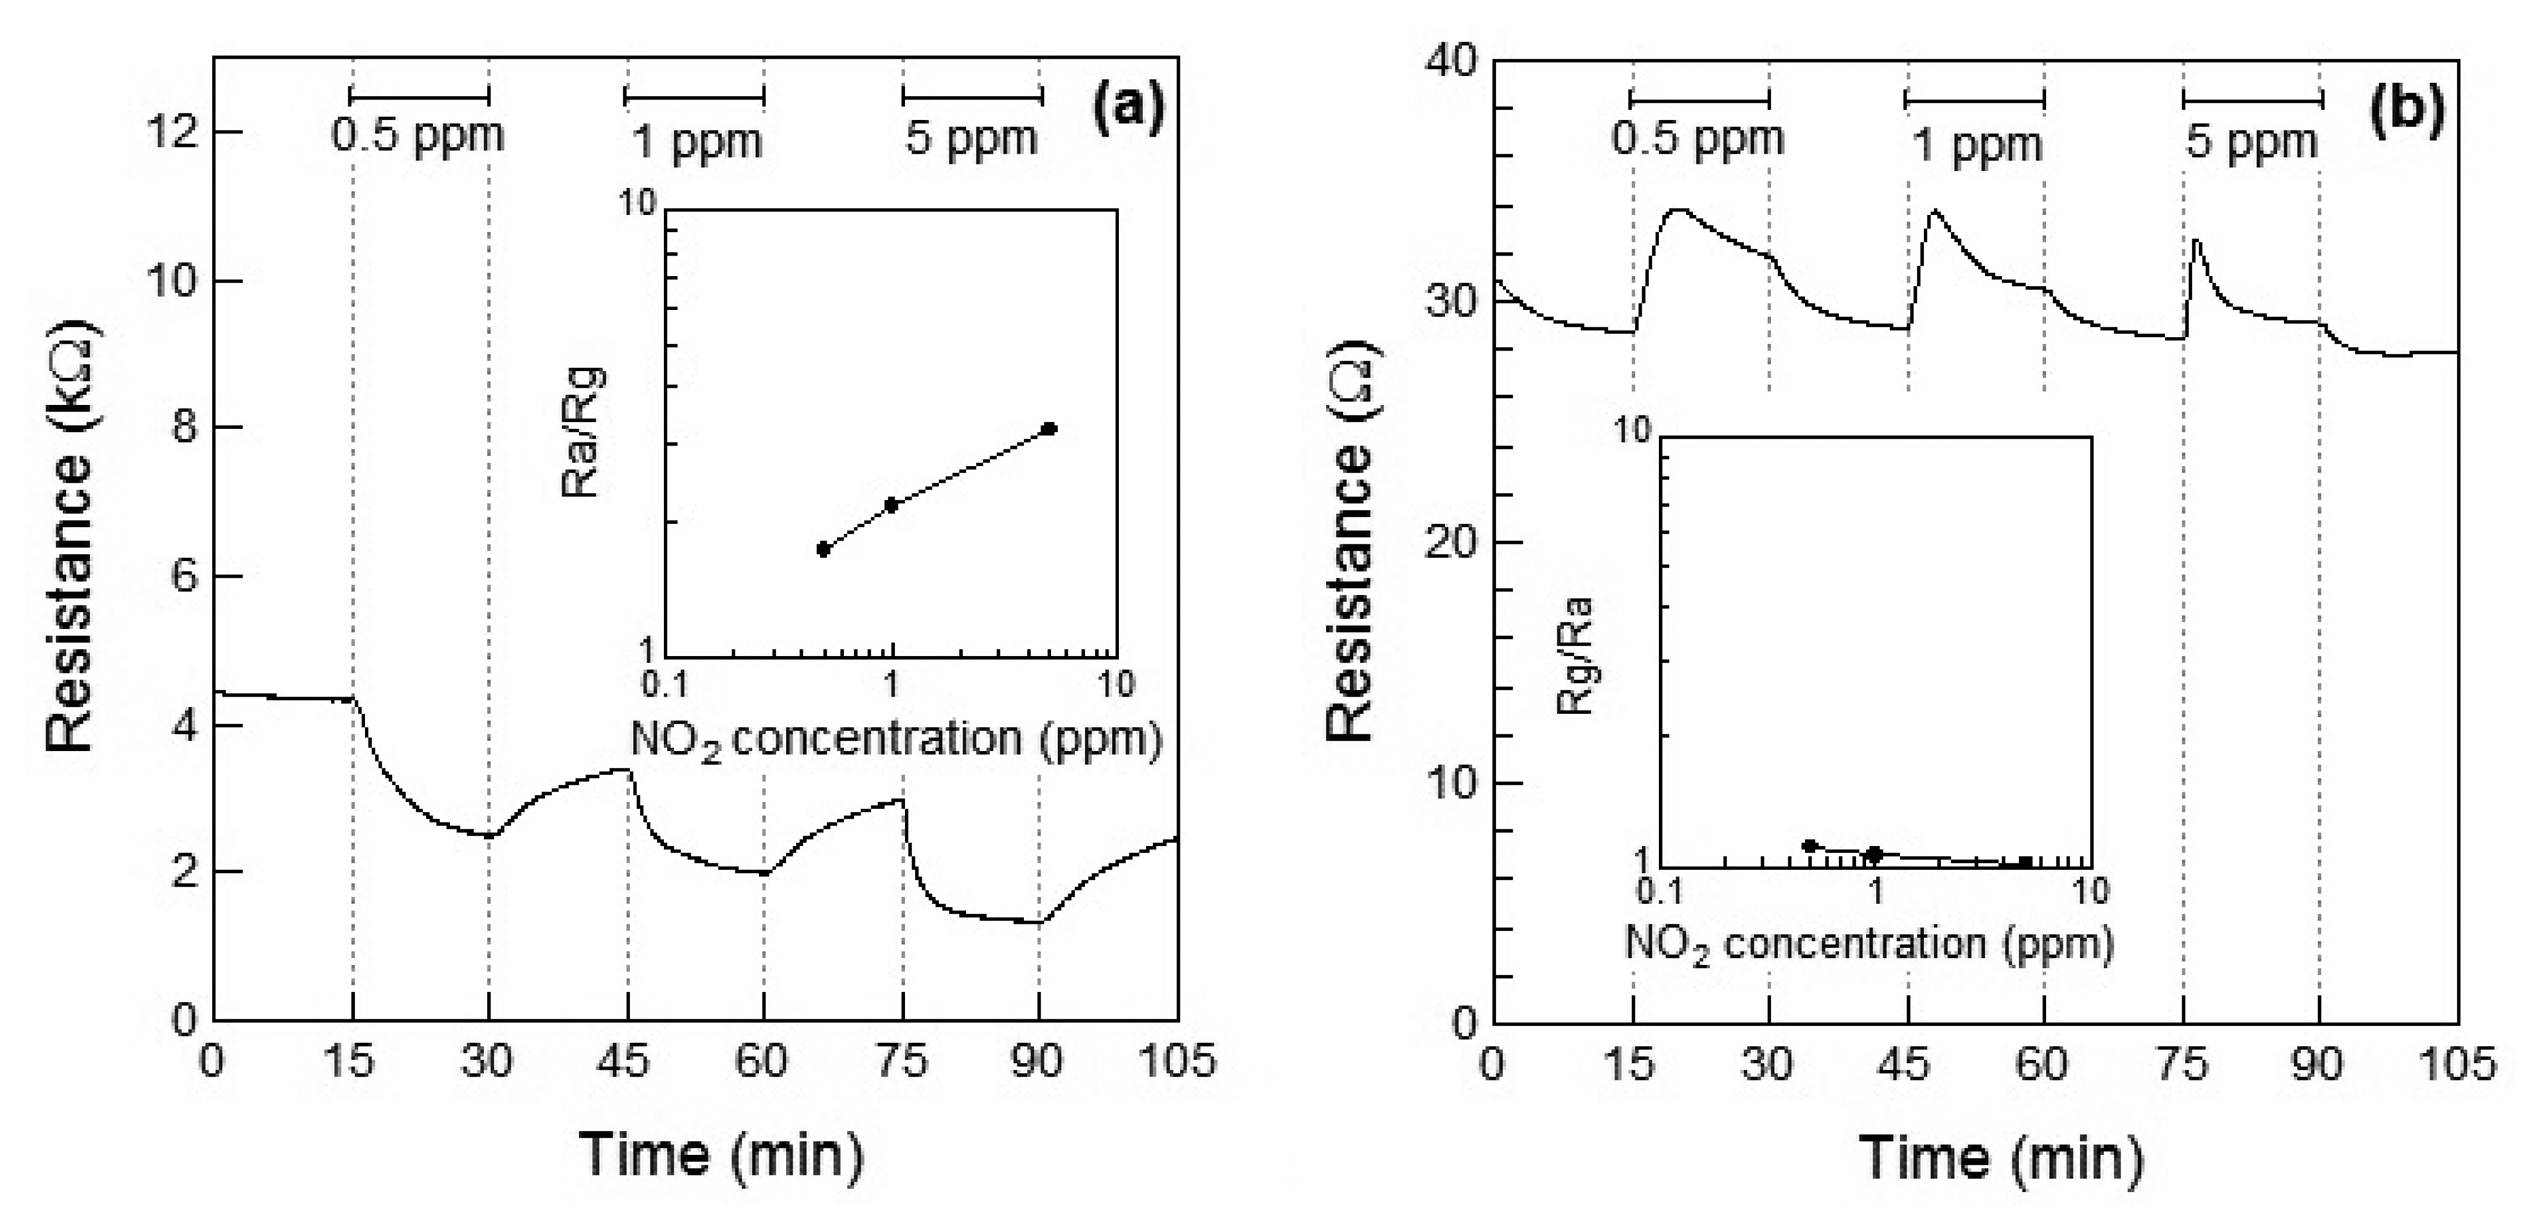
Figure 4a,b show the response of the Co3O4 sensor element toward NO2 exposure at 100 °C and 200 °C, respectively. When NO2 gas was introduced at 100 °C, the resistance of the sensor element immediately decreased. This may be attributed to the adsorption of NO2 onto the surface of the p-type semiconductor Co3O4 and to the role of NO2 as an oxidizing gas at 100 °C. A linear relationship between the gas concentration and the sensor response was observed. The response of the Co3O4 sensor element to 1 ppm of NO2 at 100 °C was S = 2.2. The sensor resistance of NO2-exposed Co3O4 did not reached to Ra even after 15 min for air exposure; the recovery time of Co3O4 sensor element was not so fast. In our preliminary experiment, the sensor resistance of NO2-exposed Co3O4 reached the saturation within 60 min for air exposure. Therefore, the sensor resistance of NO2-exposed Co3O4 in this work is also expected to reach the saturation within 60 min for air exposure. When the sensor was exposed to NO2 at 200 °C, the resistance of the sensor element immediately increased and then gradually decreased on further exposure to NO2, which seems to indicate the role of NO2 as a reducing gas at 200 °C. The decrease in the resistance of the Co3O4 sensor increased with the concentration of the NO2 gas. As a result, the resistance of the Co3O4 element after 15 min of exposure to NO2 decreased with the concentration of NO2 gas. In our preliminary experiment, the sensor resistance of the Co3O4 reached the saturation after 30 min for NO2 exposure and did not reached to Ra even after 60 min for NO2 exposure. Therefore, the sensor resistance of the Co3O4 in this work is also expected to reach the saturation within 30 min for NO2 exposure. No clear linear relationship between the gas concentration and sensor response could be observed.
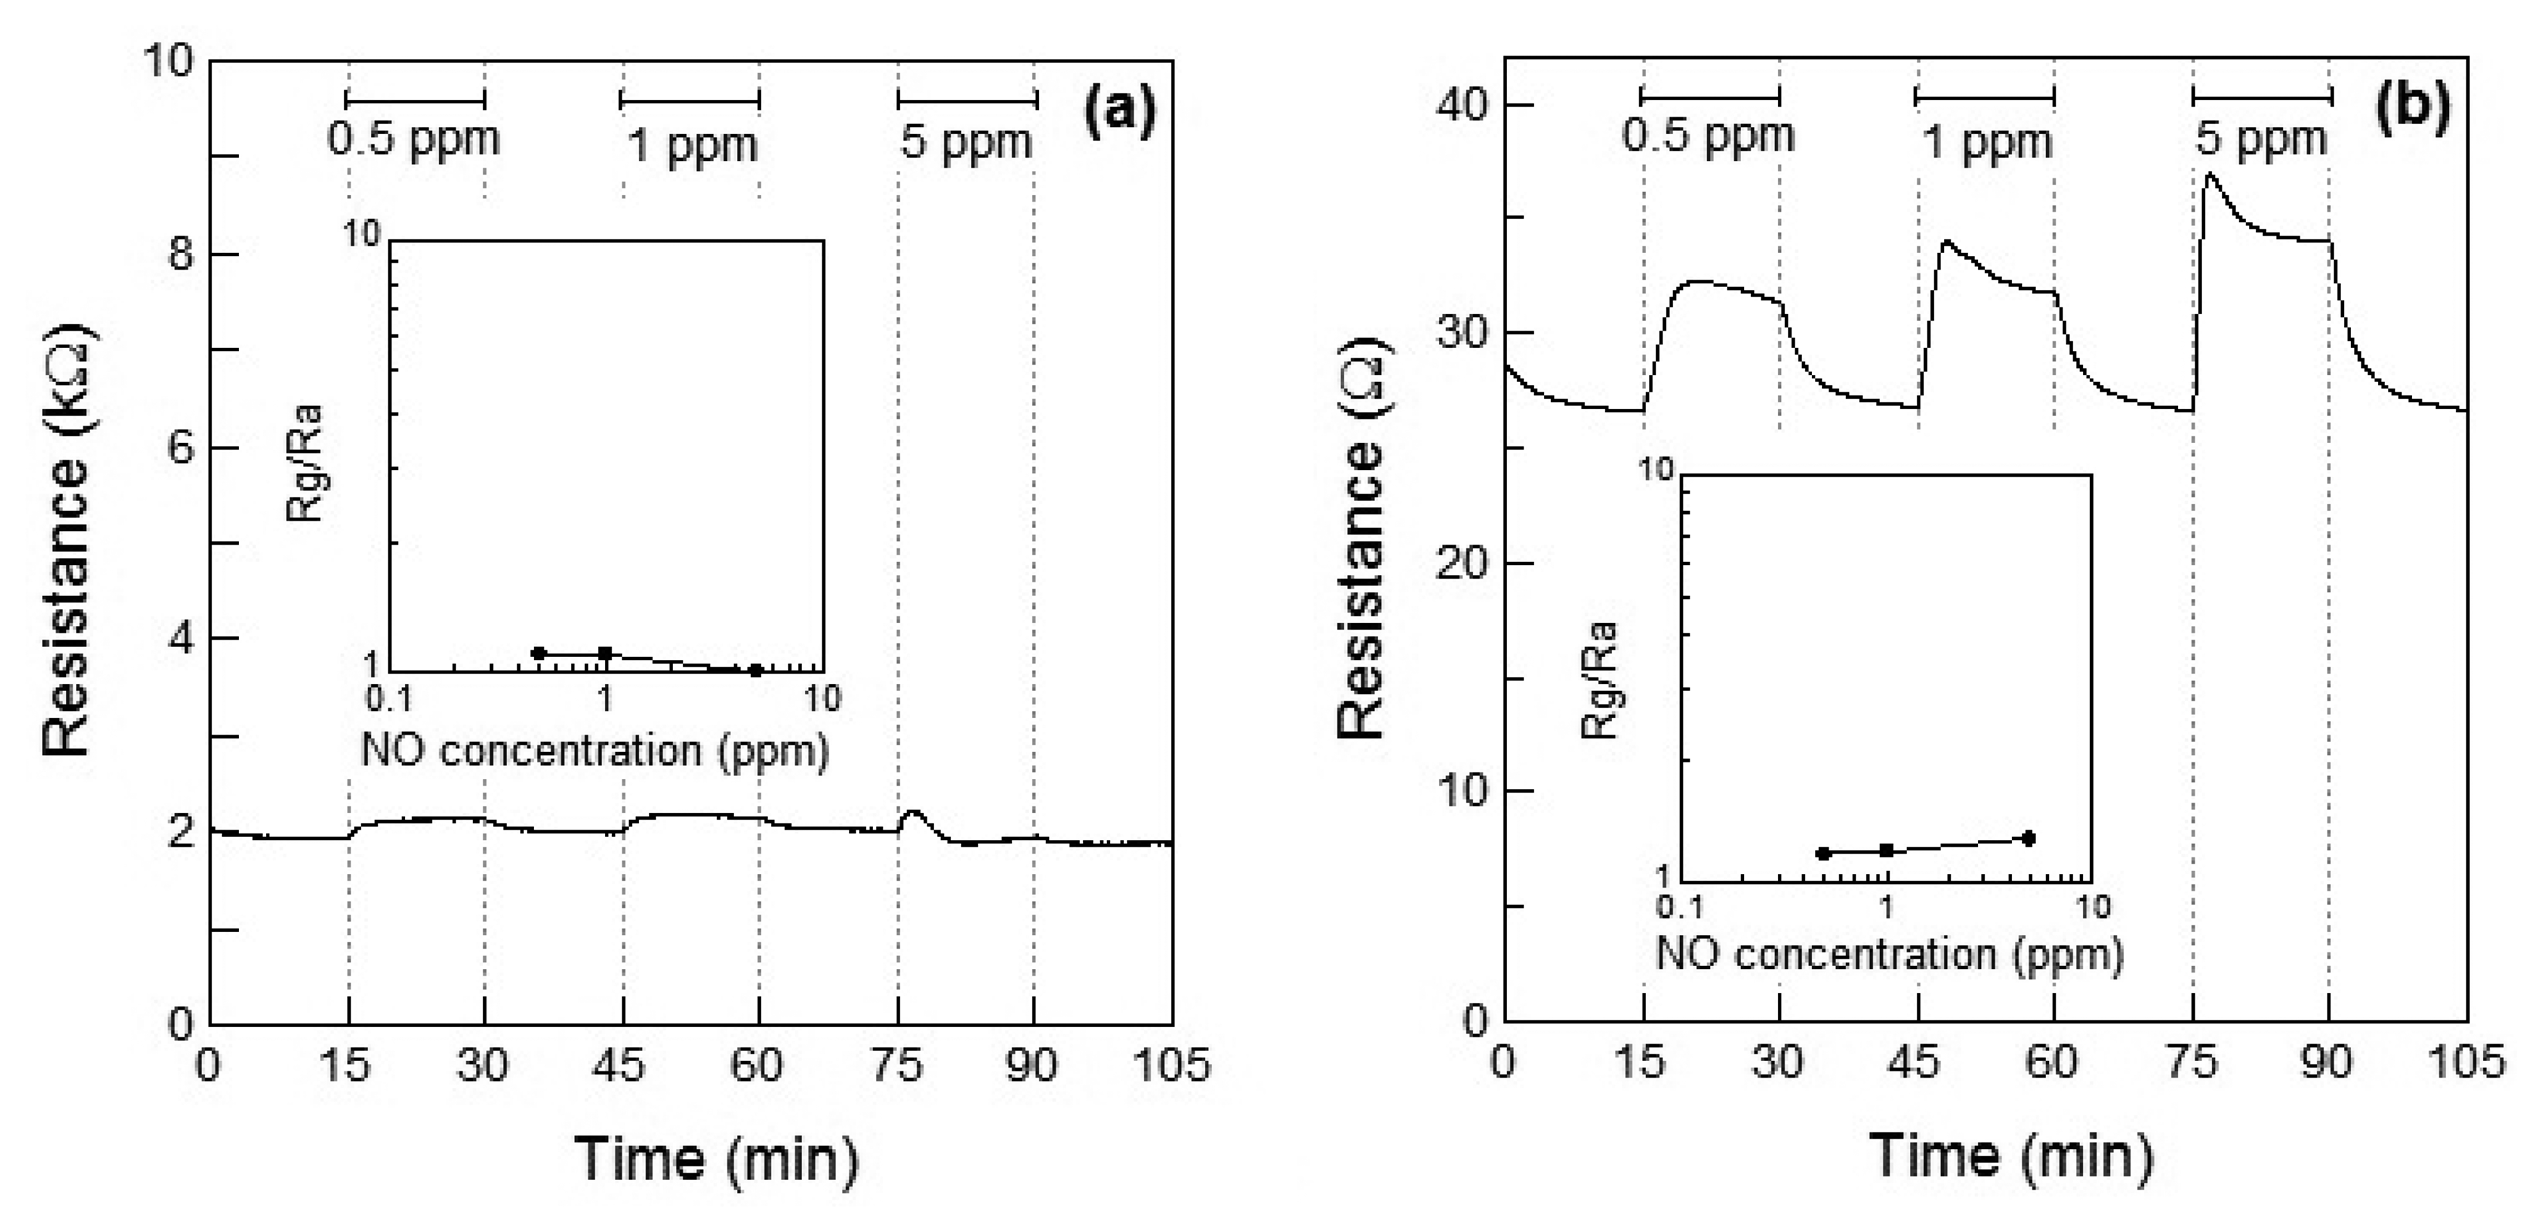
Figure 5a,b show the response of the Co3O4 sensor element at 100 °C and 200 °C, respectively, toward NO. When 5 ppm of NO gas was introduced at 100 °C, the resistance of the Co3O4 sensor slightly increased. However, the resistance decreased within 3 min of exposure and a linear relationship between the NO gas concentration and the resistance of the Co3O4 sensor element was absent. However at 200 °C, the resistance increased with the concentration of NO gas and the relationship between the gas concentration and sensor response was linear, as shown in Figure 5b. The response of the Co3O4 sensor element to 1 ppm NO at 200 °C was S = 1.2.
Figure 4a shows the Rg decrease exhibited by the p-type Co3O4 on exposure to NO2 at 100 °C, however, the response of resistance Rg of Co3O4 reversed and Rg increased on exposure to NO2 at 200 °C. This contradictory result indicated a role of NO2 as an oxidizing gas at 100 °C and as a reducing gas at 200 °C. However, it rermains unclear how an oxidizing gas such as NO2 could become a reducing gas at a different temperature. As shown in Figure 5a,b, NO is expected to be adsorbed on the surface of Co3O4 and act as a reducing gas, resulting in an increase in the sensor resistance. The sensor resistance of Co3O4 on exposure to 5 ppm of NO at 100 °C increased within 3 min of exposure and then became slightly smaller than Ra. The unexpected changes of the sensor resistance of Co3O4 are supposed to be due to insufficient desorption of reaction product on the oxide surface, similar to the case of the WO3 sensor. The reaction of Co3O4 on exposure to 5 ppm of NO at 100 °C is assumed as follows: NO reacts with adsorbed oxygen on Co3O4 surface and the sensor resistance increases; the reaction of NO and adsorbed oxygen generates NO2. Although the generated NO2 is normally desorbed from Co3O4 surface, the generated NO2 is expected to be readsorbed into Co3O4 surface at 100 °C; the sensor resistance of Co3O4 gradually decreases.
Figure 6a,b show cross-sectional SEM images of the sensor element of WO3 and Co3O4. The thicknesses of WO3 and Co3O4 films were estimated to be 3.6 and 3.3 μm, respectively. We reported the relationship between the gas response toward nonanal gas and Pt-, Pd-, Au-loaded SnO2 film [18]. In that report, the sensor response toward nonanal gas was influenced by the thickness of Pt-, Pd-, Au-loaded SnO2 film and also the operating temperature. Although the sensor responses of WO3 and Co3O4 are not sufficiently large at this stage, we expect that they can be improved after optimizing the thicknesses of WO3 and Co3O4 films and the operating temperature.
3.3. DRIFT Spectra of WO3 Powder
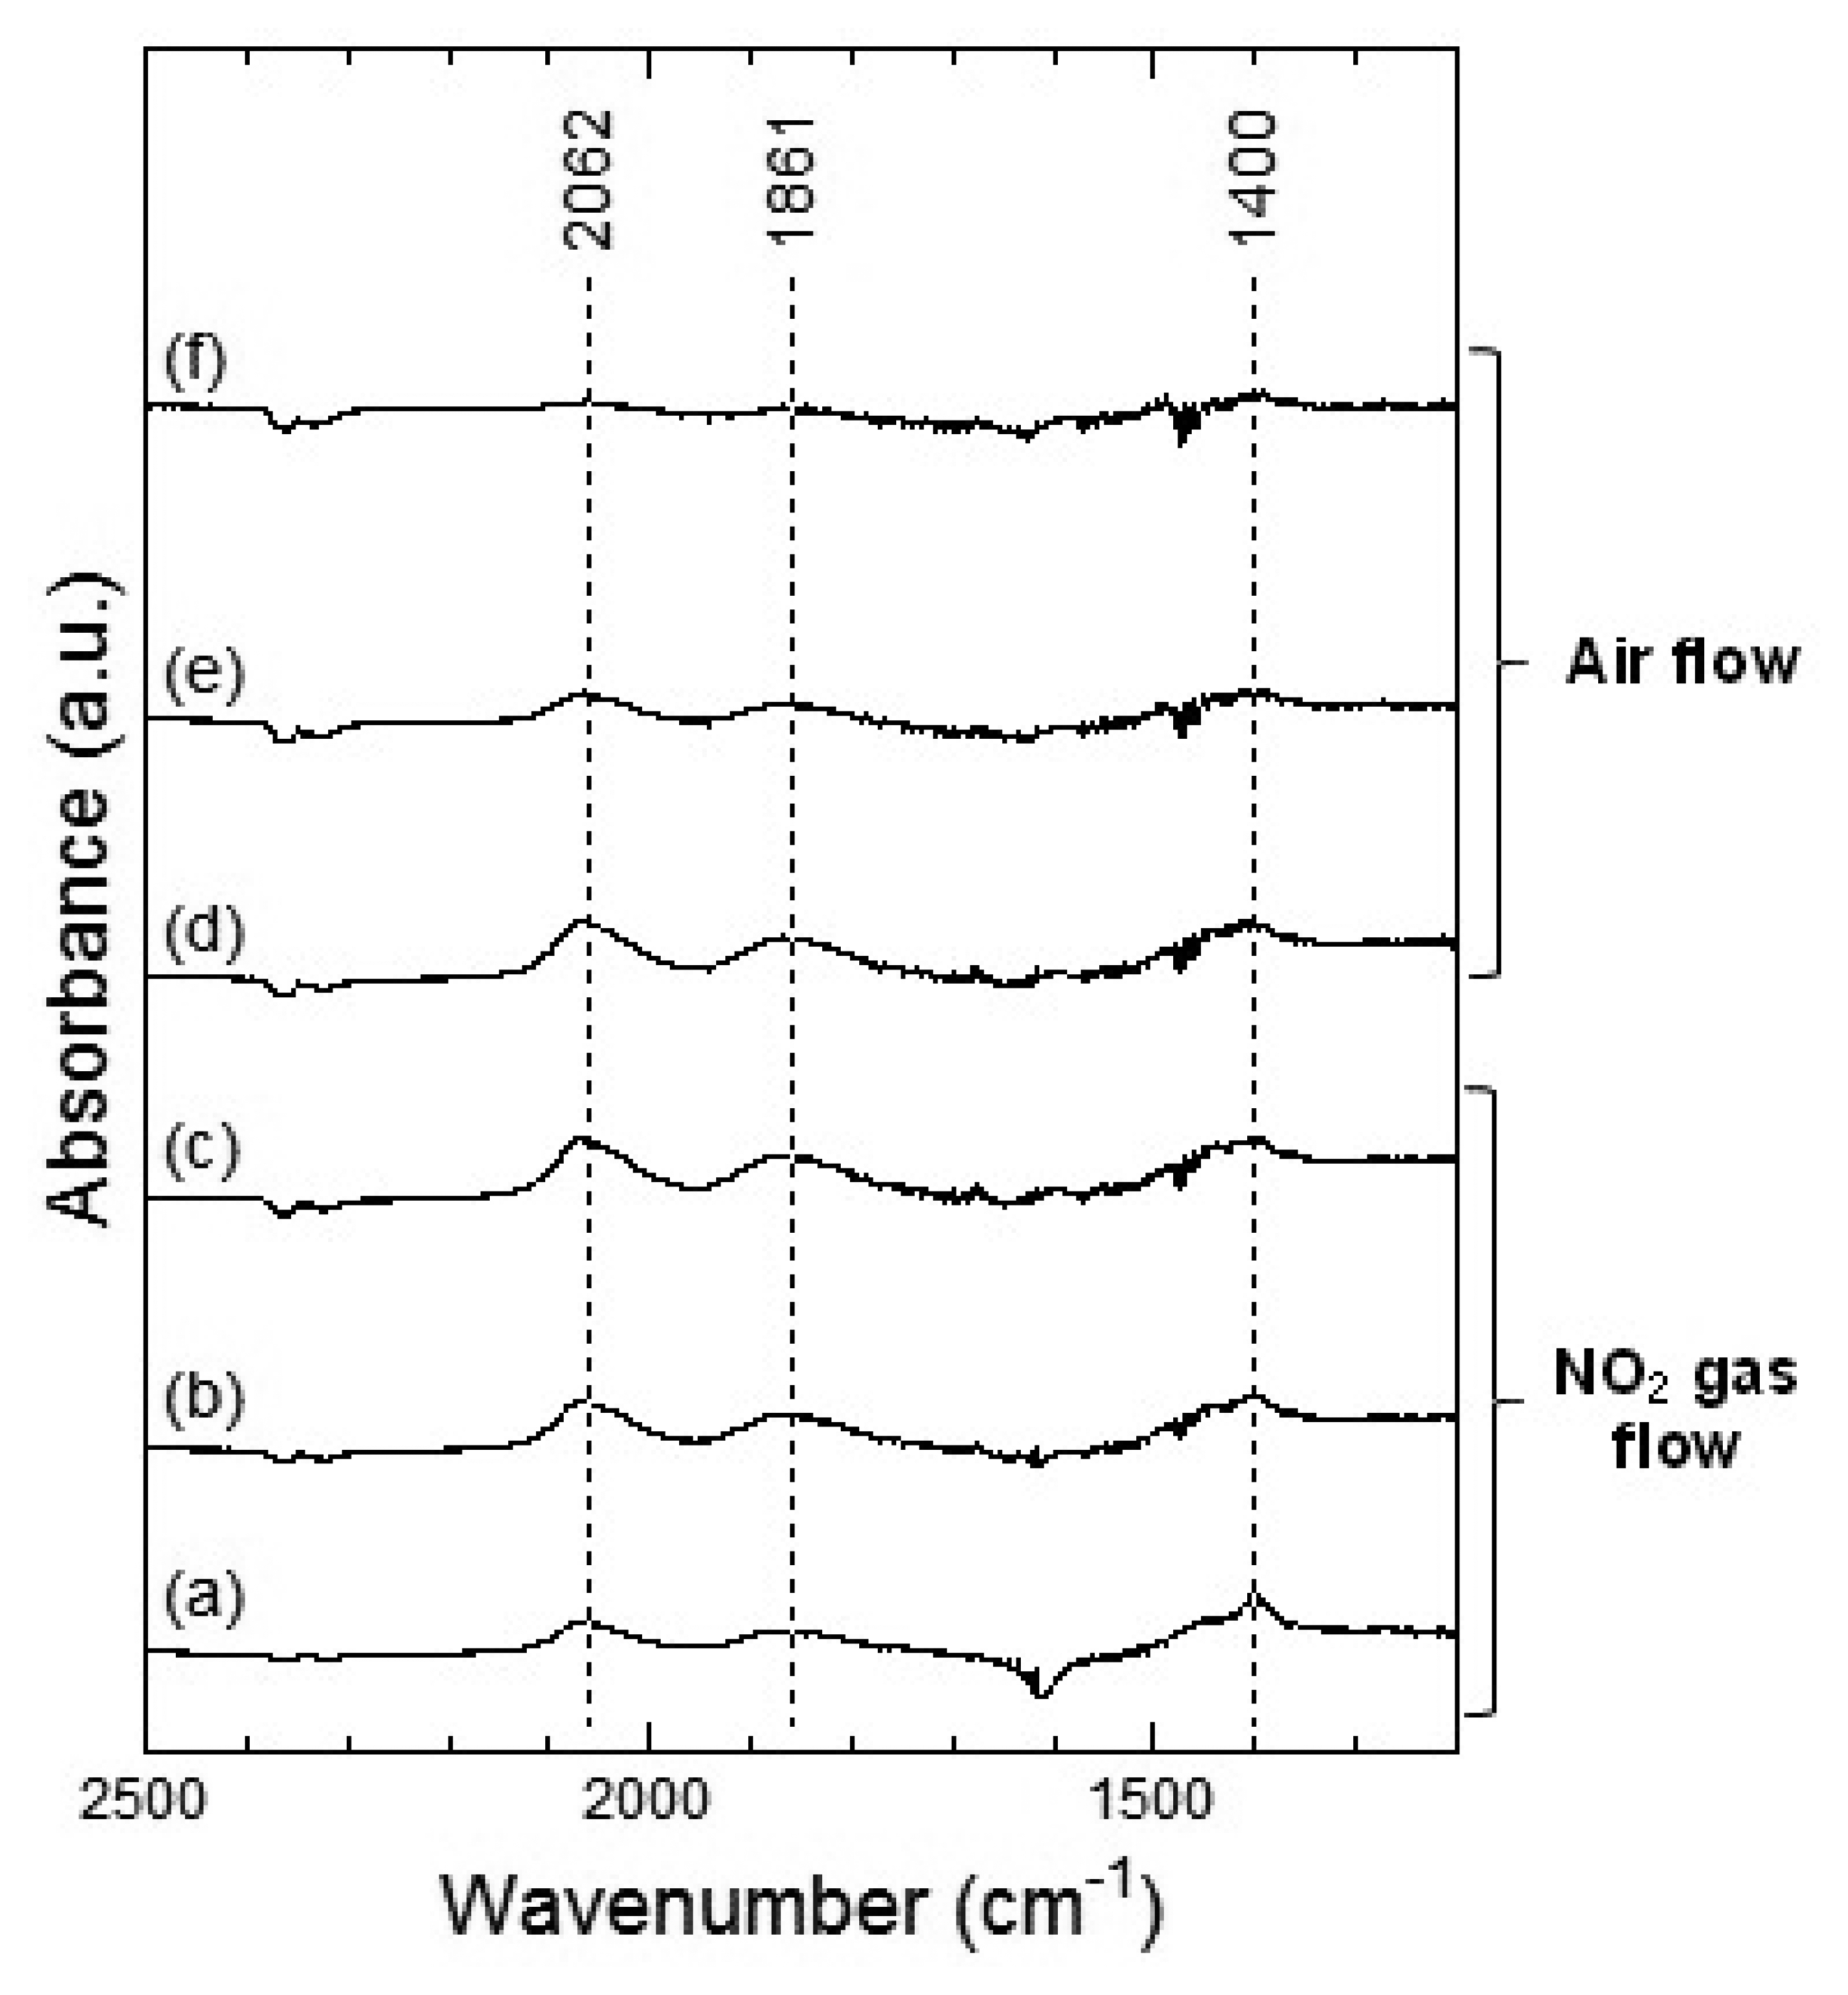
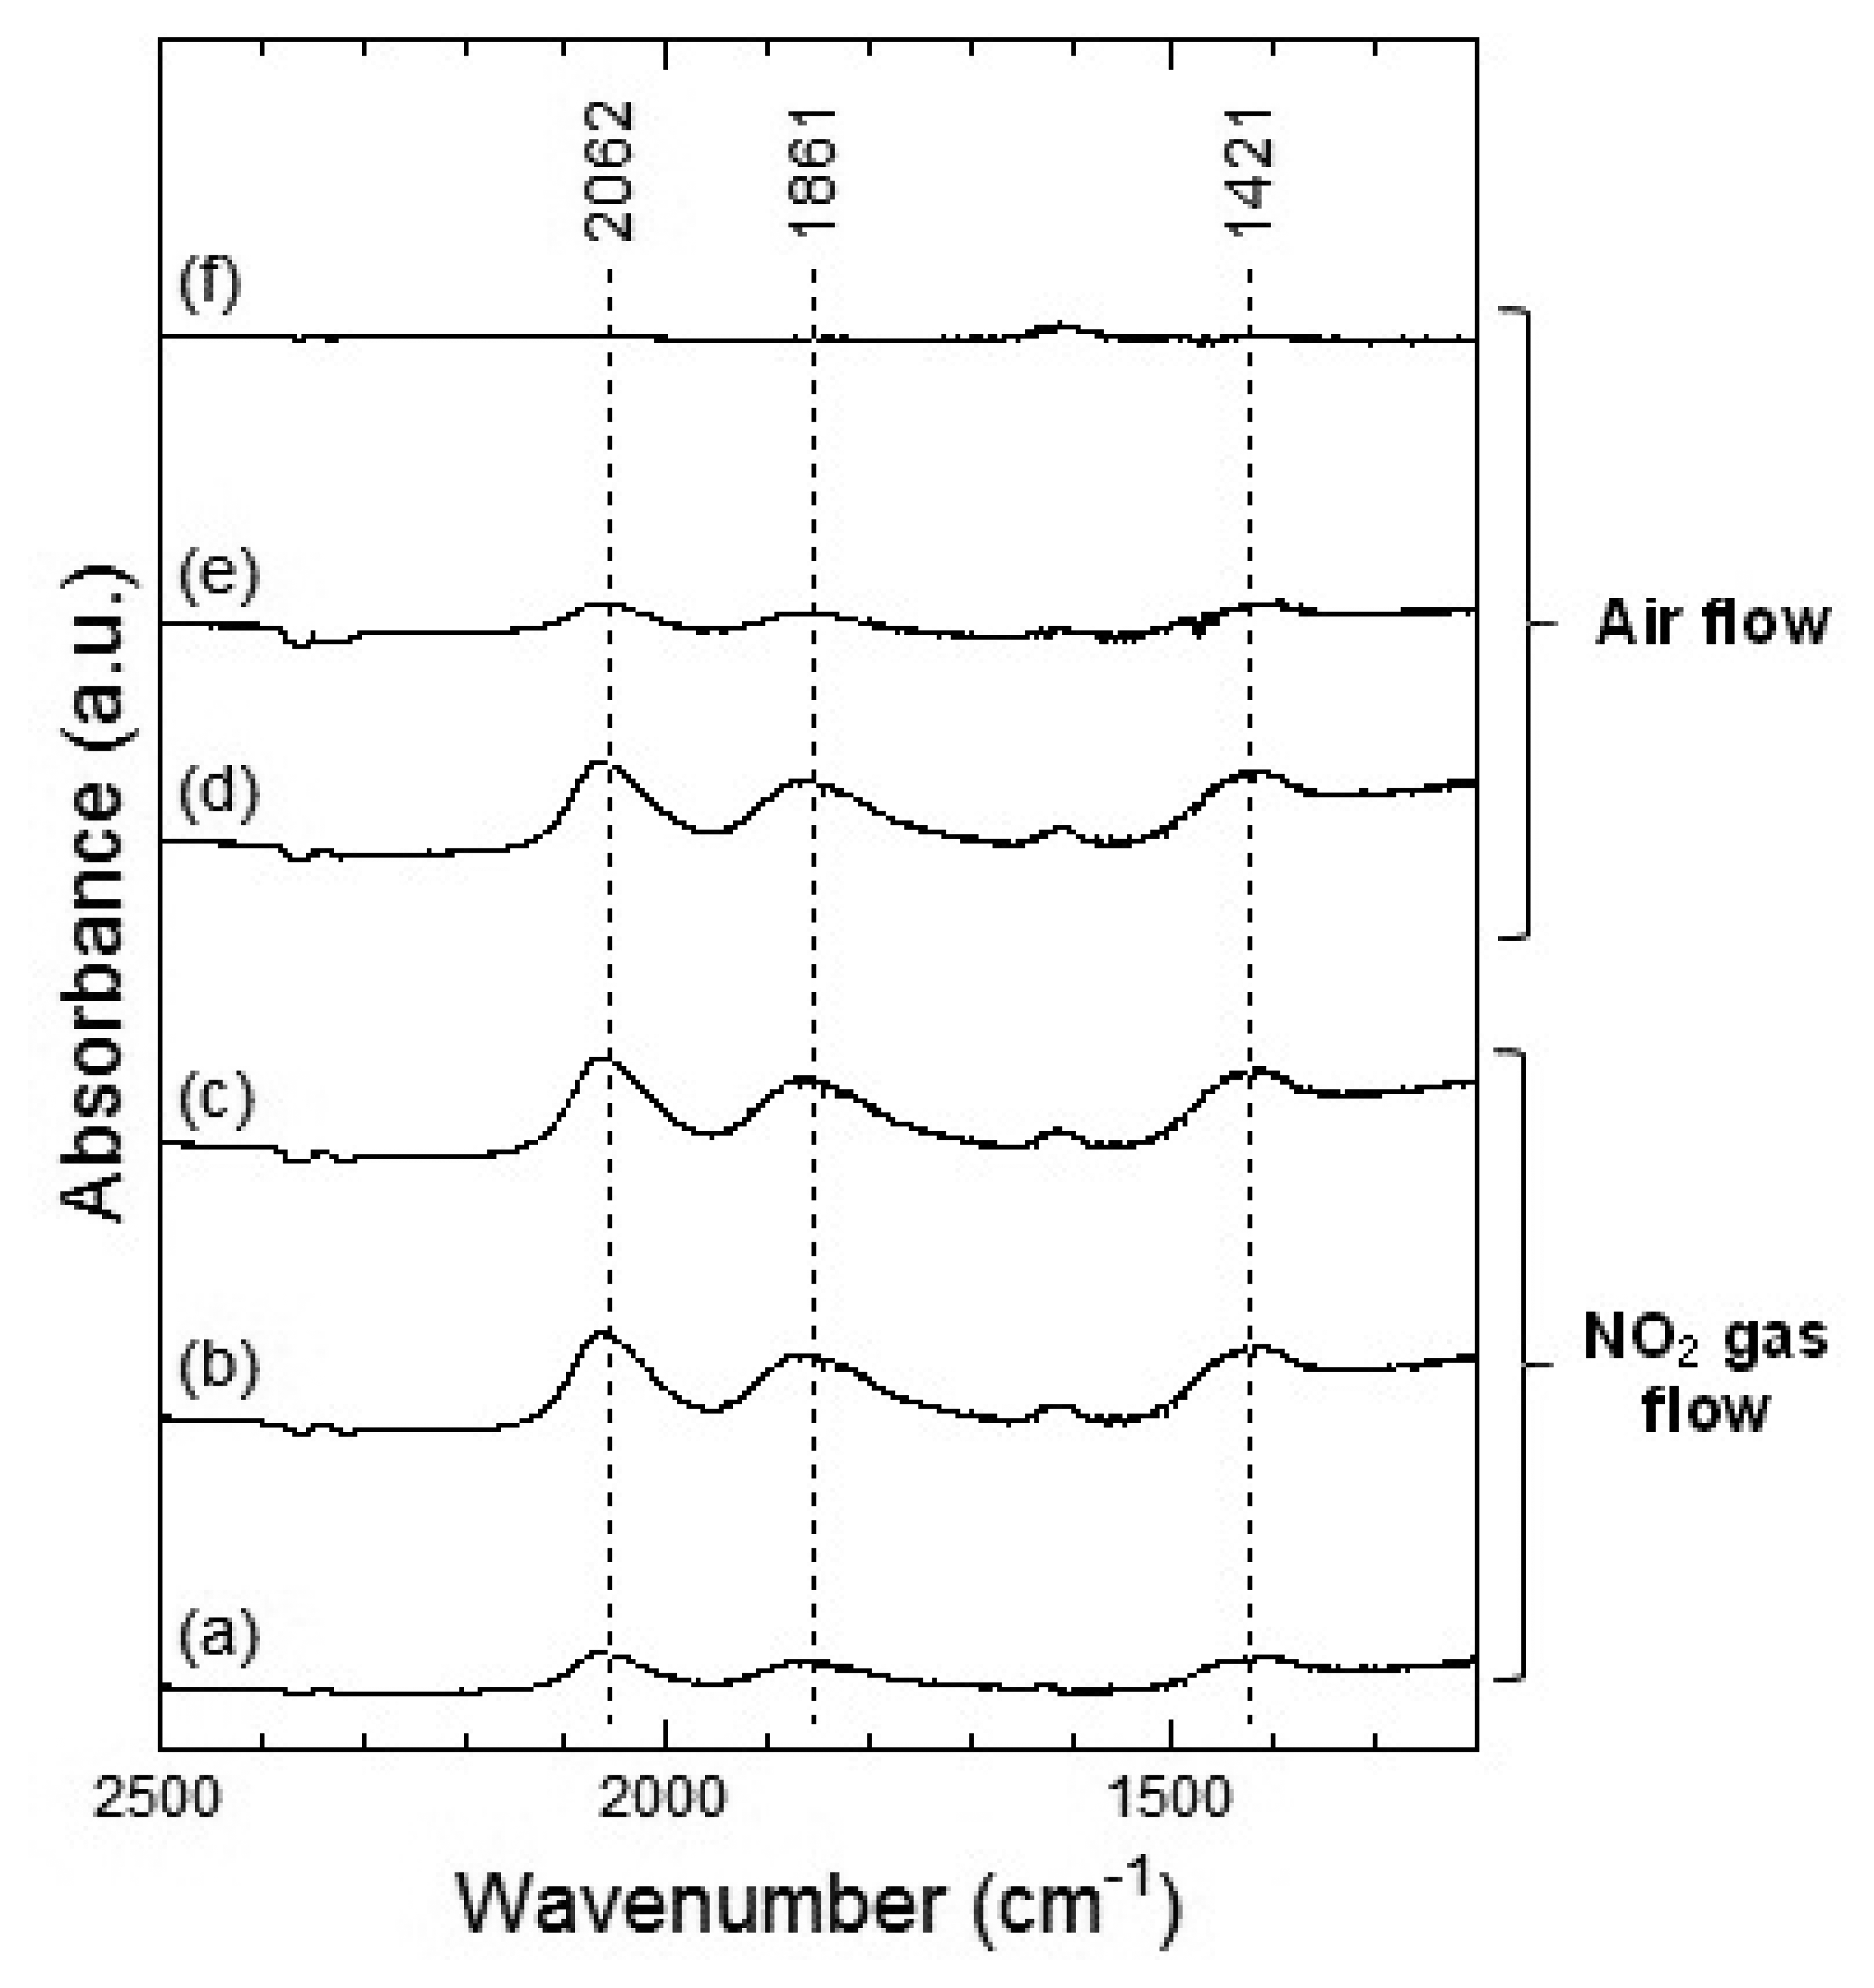
Figures 7 and 8 show the DRIFT spectra of WO3 powder on exposure to 1 ppm NO2 exposure at 100 °C and 200 °C, respectively. As shown in Figure 7, the intensity of three peaks at around 2,062, 1,861 and 1,400 cm−1 increased with the time of exposure of NO2 and decreased with purging with air. According to reports, the peaks around 2,062 and 1,861 cm−1 can be assigned to various overtones and combination modes of the W-O bond in the lattice of the oxide [16,19]. The several small peaks in the 1,400–1,700 cm−1 region seemed to be the result of multiple overlapping bands and could not be determined. The peak around 1,400 cm−1 could be assigned to nitrate species [20,21].
At 200 °C, the peaks around 2,062, 1,861 and 1,421 cm−1 were also observed in WO3 on NO2 exposure. The peaks at about 2,062 and 1,861 cm−1 formed upon interaction with NO2 at 200 °C were similar to those at 100 °C and the peaks could be assigned to the various overtones and combination modes of the bond between oxygen and tungsten in the lattice of the oxide. The peak at around 1,421 cm−1 could be assigned to nitrate species. This peak at 200 °C seemed much stronger than that at 100 °C and hence, the amount of the nitrate species on WO3 surface at 200 °C was larger than that at 100 °C. When air was introduced to the WO3 powder sensor after exposure to NO2, the intensity of the peaks at 100 °C and 200 °C decreased with the time of air flow, which indicated the desorption of NO2 from the surface of WO3.
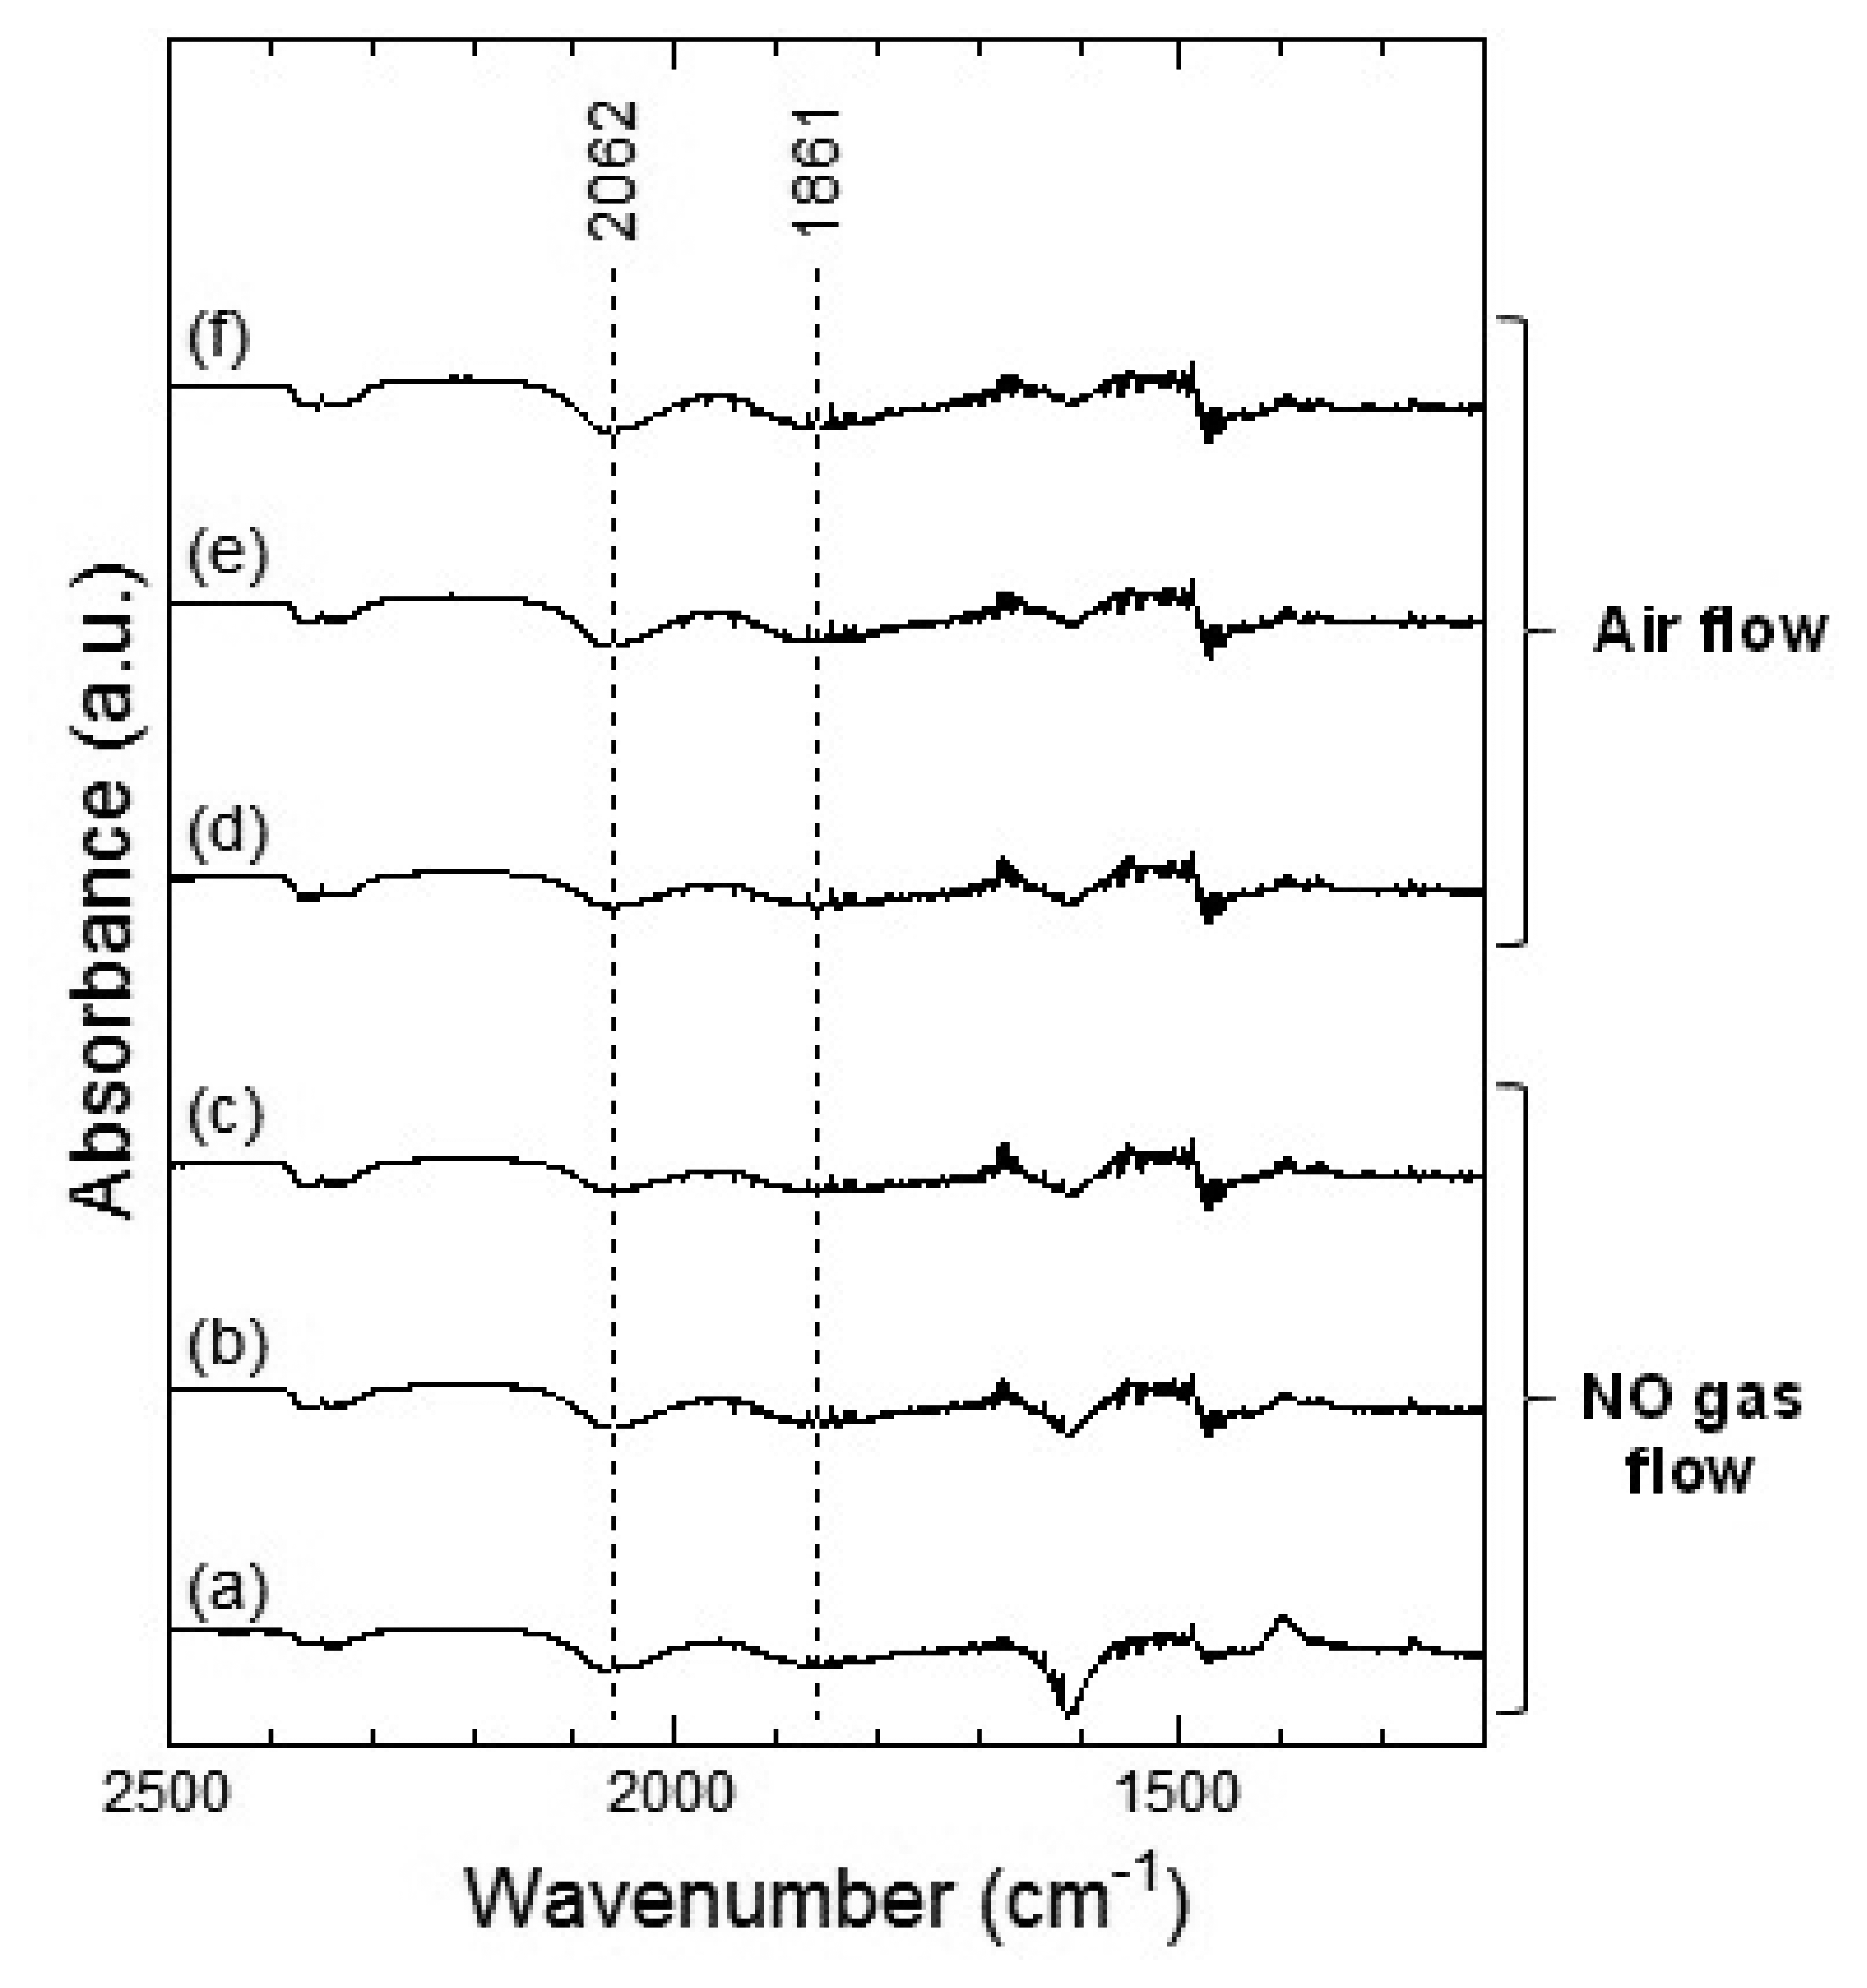
Figures 9 and 10 show the DRIFT spectra of WO3 powder on exposure to 1 ppm of NO at 100 °C and 200 °C, respectively. In Figure 9, negative peaks at around 2,062 and 1,861 cm−1 were seen upon the introduction of NO gas. WO3 powder is supposed to be unreactive for NO at 100 °C because there was no difference between the spectra obtained on exposure to NO (Figure 9a–c) and on exposure to air (Figure 9d–f). However, as shown in Figure 10, the intensity of the peaks at around 2,062 and 1,861 cm−1 increased with the time of exposure to NO and decreased on introduction of air. The negative peaks of NO observed in Figure 9, Figure 10e,f may be attributed to possible glitches with the background subtraction. When NO reacts with adsorbed oxygen on the WO3 surface, NO2 formed and adsorbed on the surface of WO3, resulting in the increase in the intensity of the peaks shown in Figure 7 or Figure 8. Subsequently, NO2 desorbed from the surface of WO3 by air flow, and the intensity of the peaks reduced again.
In the DRIFT spectra of WO3 on exposure to NO2 and NO, peaks corresponding to NO vibration and NO2 asymmetric vibration bands could not be observed. Previous reports have shown the presence of peaks corresponding to CO vibration and CO2 asymmetric vibration bands in the DRIFT spectra of SnO2 exposed to CO, while peaks of W-O alone were observed in the DRIFT spectra of WO3 exposed to CO [16,22]. We assumed that WO3 may have insignificant interaction with NO2 or NO gas in comparison with other metal oxide semiconductors. The positions of the peaks observed in the DRIFT spectra of WO3 exposed to NO2 were similar to those observed in the DRIFT spectra of WO3 exposed to NO. Further, as shown in Figure 7, the peaks in the DRIFT spectra were small and there were hardly any differences between the DRIFT spectra. Therefore, the response of the sensor to NO exposure was more unstable than that to NO2 exposure at 100 °C.
3.4. DRIFT Spectra of Co3O4 Powder
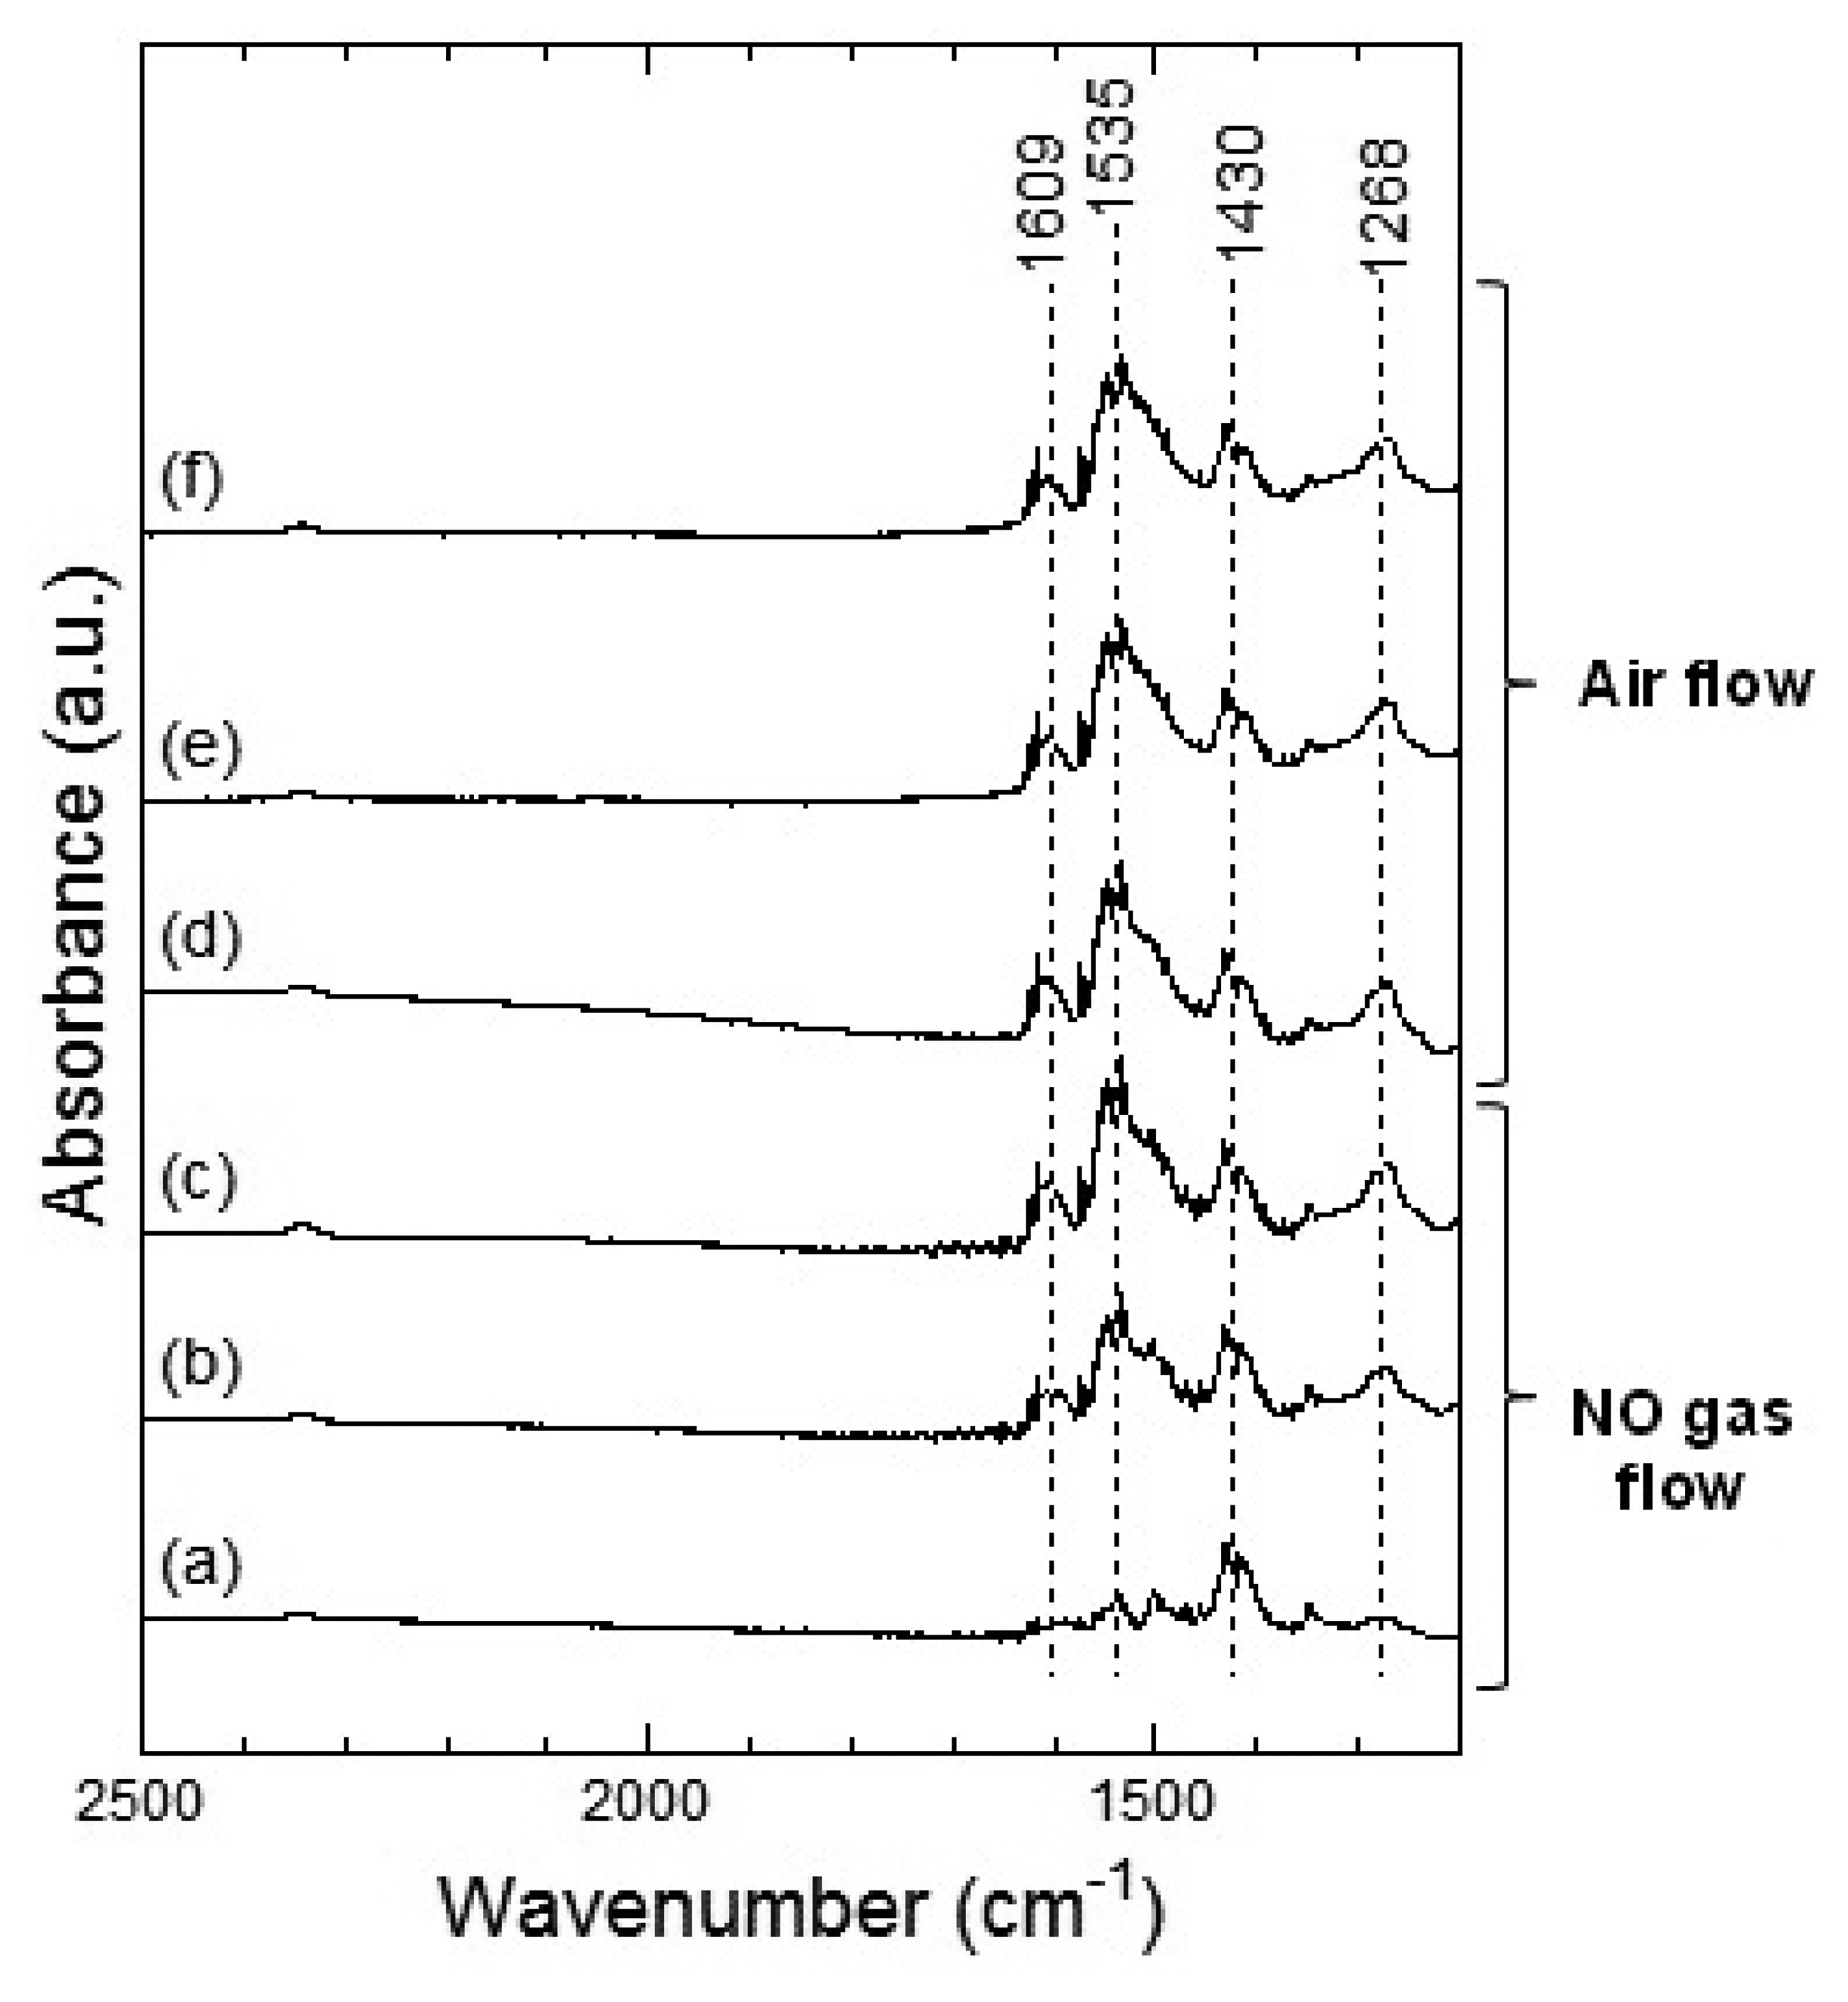
Figures 11 and 12 show the DRIFT spectra of Co3O4 powder exposed to 1 ppm NO2 at 100 °C and 200 °C, respectively. In Figure 11, four peaks around 1,609, 1,535, 1,430 and 1,268 cm−1 were observed which are reported to correspond to the NO vibration band of the bridging bidentate nitrate, the NO vibration band of the chelating bidentate nitrate, the NO2 asymmetric vibration band of the monodentate nitrate, and the NO2 asymmetric vibration of the bridging bidentate nitrate or chelating bidentate nitrate, respectively [20,21]. The intensity of the peaks increased with the time of exposure to NO2 gas and the intensities did not decrease even after the replacing NO2 flow with air flow.
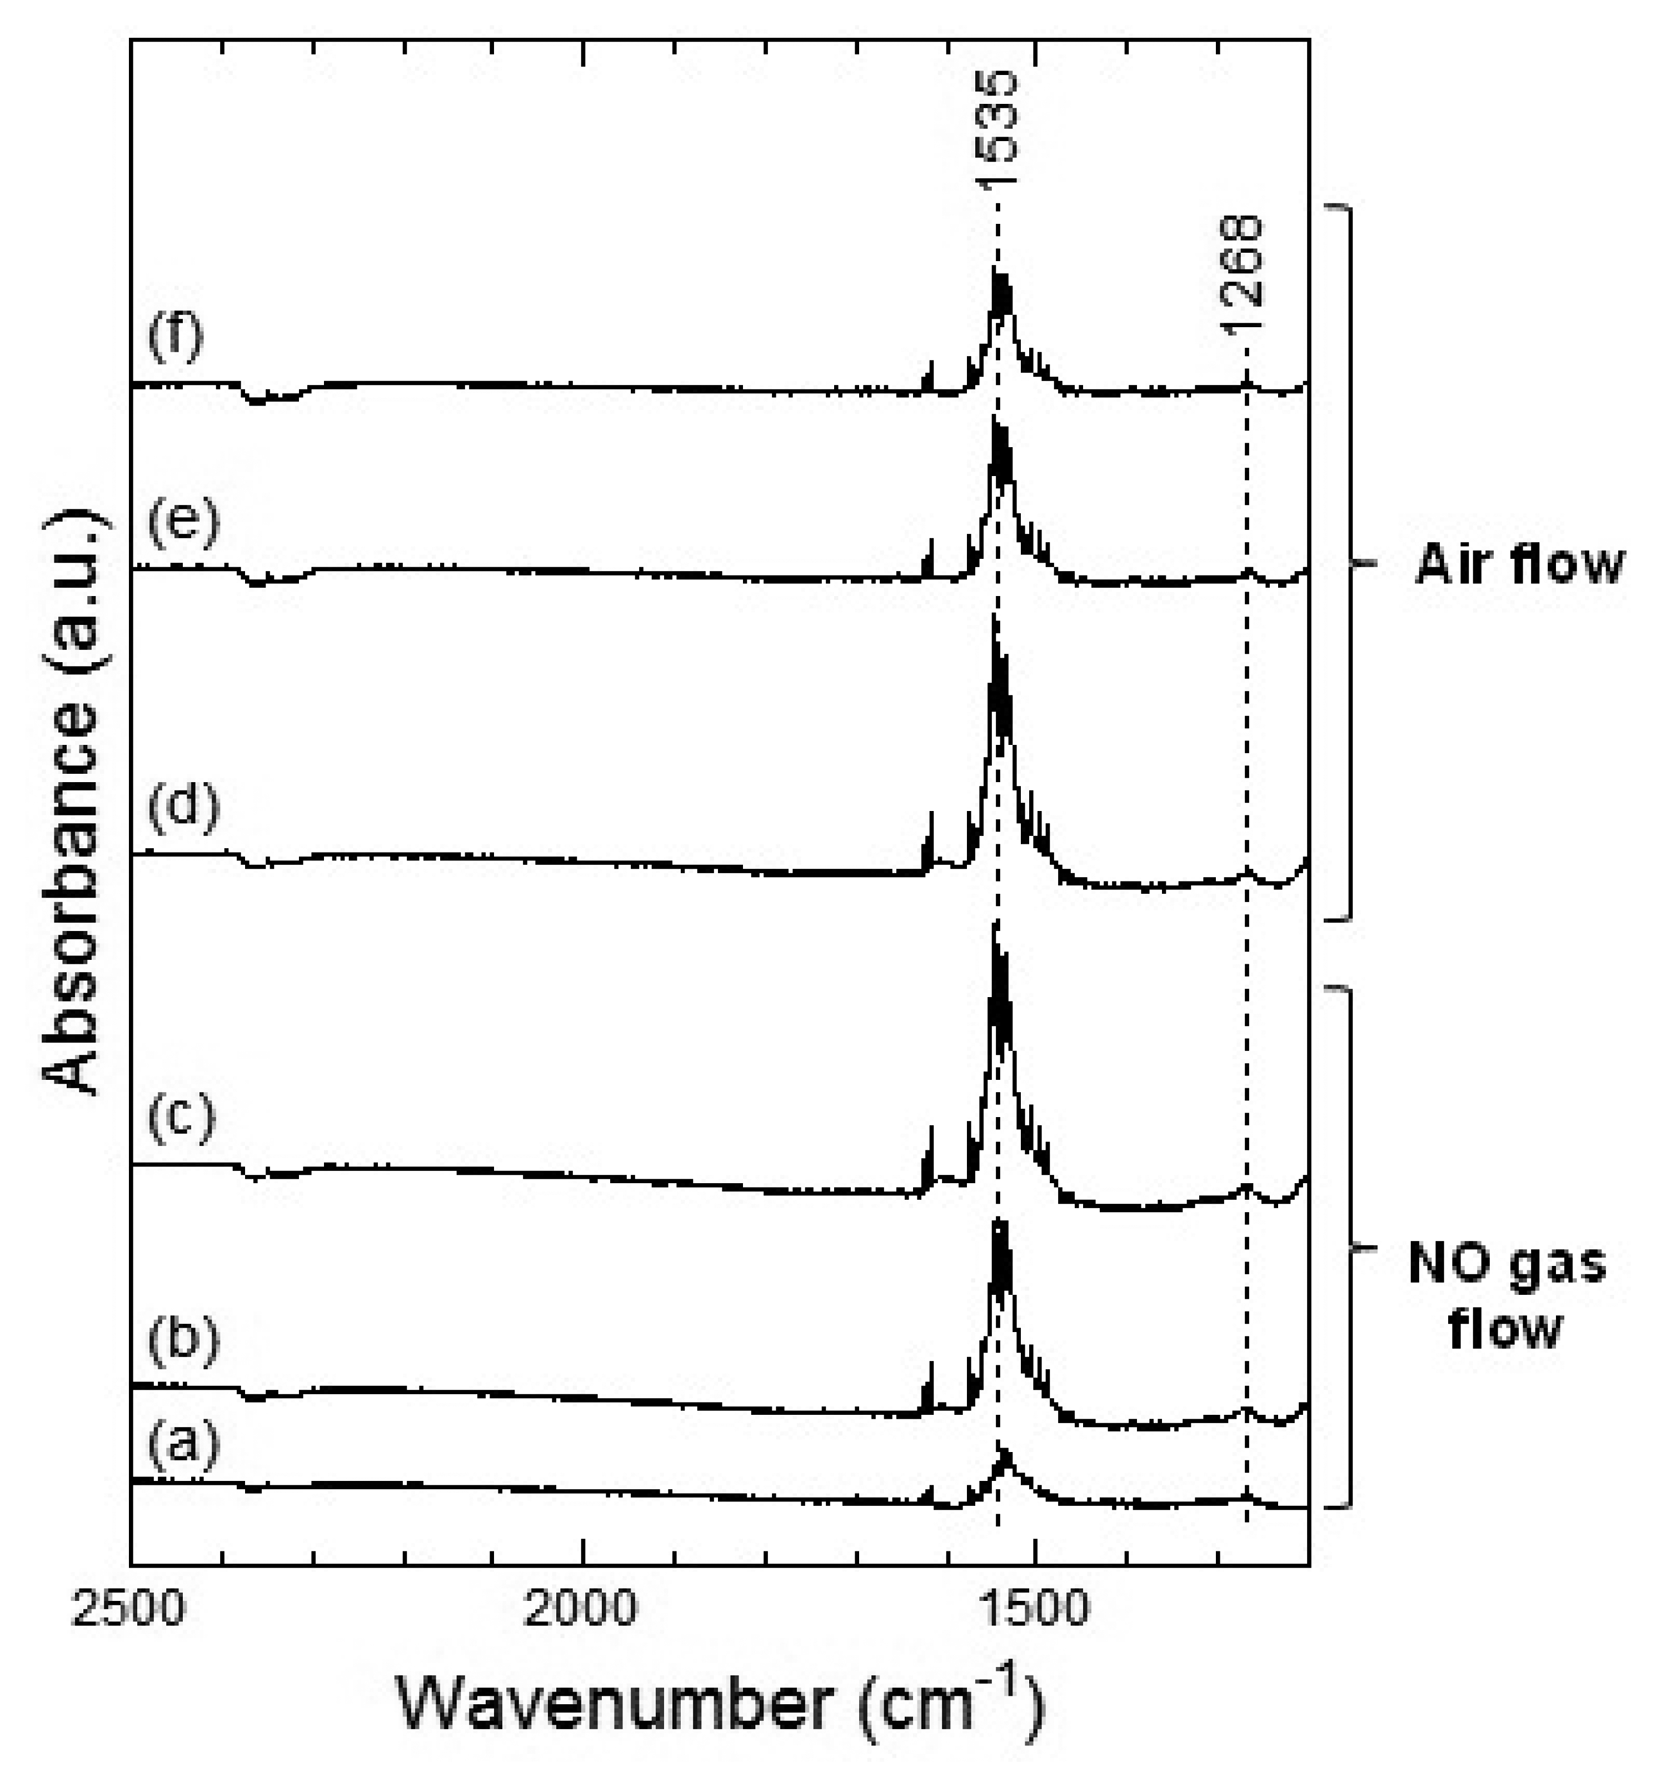
In Figure 12, two strong peaks at around 1,535 cm−1 and a weak peak around 1,268 cm−1 were observed, which could be assigned to the chelating bidentate nitrate. From the spectra shown in Figures 11 and 12, we could suggest that exposure of NO2 gas to the Co3O4 surface formed the bridging bidentate, chelating bidentate, and monodentate nitrates at 100 °C and the chelating bidentate nitrate at 200 °C.
Figures 13 and 14 show the DRIFT spectra of Co3O4 powder exposed to 1 ppm NO at 100 °C and 200 °C, respectively. The peak patterns shown in Figures 13 and 14, are similar to the patterns shown by the DRIFT spectra of Co3O4 powder exposed to NO2. Hence, the chemical states of the Co3O4 surface achieved on exposure to NO2 and NO seemed identical. Further, most peaks in the DRIFT spectra of Co3O4 exposed to air and on exposure to NO2 or NO gases were similar. Despite the changes observed in the resistance of Co3O4 on exposure to various atmospheres, there was no clear difference in the DRIFT spectra of Co3O4 powder exposed to various atmospheres. With the present data, it is difficult to discuss the origin of these contradictory results and we intend to investigate these in future.
As in the case of the DRIFT spectra of Co3O4 powder, no difference between NO2 and NO exposures could be observed in the case of the DRIFT spectra shown by WO3 powder. However, as shown in Figures 4 and 5, the sensor resistance of Co3O4 varied depended on the operating temperature (100 °C or 200 °C) and the gas species (NO2 or NO in air). It is to be noted that although the chemical state of the Co3O4 surface exposed to NO2 exposure was similar to that of the Co3O4 surface exposed to NO at 100 °C, the sensor resistance decreased on exposure to NO2 and increased on exposure to NO. With the change in the electron concentration on Co3O4 surface, the sensor resistance changed. The resistance of the sensor on exposure to NO2 decreased at 100 °C and increased at 200 °C. This can be viewed on the basis of the previous studies which report on the transitions from p-type to n-type behavior of several metal oxide sensors (or vice versa) [12,23–25]. In particular, Zhang et al. showed that the transition of WO3 was observed under 93 ppb NO2 exposure at working temperature above 130 °C [12]. A similar transition seemed to have occurred in the case of the Co3O4 sensor on exposure NO2 at 200 °C in this study. On the other hand, no transition of WO3 seemed to have occurred because NO2 concentration was higher than 0.5 ppm in this study. Although the transition would be due to the oxygen adsorption and formation of inversion layer at the metal oxide surface, further works are necessary to clear the transition mechanism. In this work, we could not examine the DRIFT spectra of WO3 or Co3O4 powder in the sample cell but the DRIFT spectra of WO3 or Co3O4 film on the Si substrate with a platinum comb-type electrode; the difference between the reactions of the powder and the film might be present. Due to the difference between the reactions of the powder and the film, some contradictory results in this work are supposed to be appeared. The chemical states of NO2 and NO on the sensor elements will be investigated in the future.
In this study, we have dealt with the sensor responses of WO3 and Co3O4 elements on exposure to NO2 or NO at different operating temperatures. In the case of the real-life application of the sensors, if the target gas consisting of an unknown mixture of NO2 and NO is to be analyzed by WO3 and Co3O4-based gas sensors, the results should be viewed carefully because the sensor response could be changed by the component ratio of NO2 and NO in NOx.
4. Conclusions
We have investigated the gas sensing properties of the sensor element that uses n-type WO3 or p-type Co3O4 toward NO2 and NO. Further, we also analyzed the chemical states of NO2 and NO on the semiconductor oxide surfaces. The resistance of the WO3 sensor at 100 °C and 200 °C increased with the concentration of NO2. The resistance of the WO3 sensor to NO exposure first increased and then immediately decreased within 10 min at 100 °C, while at 200 °C, the resistance of the sensor increased. Since the sensor resistance of Co3O4 exposed to NO increased at 100 °C and 200 °C, NO acted as a reducing reagent and oxidized to NO2. The sensor properties for NO exposure were consistent with the DRIFT spectra at 100 °C and 200 °C. On the other hand, since the sensor resistance of Co3O4 exposed to NO2 decreased at 100 °C, NO2 acted as an oxidizing agent and the sensor properties for NO2 exposure were consistent with the DRIFT spectra. At 200 °C, the sensor resistance of Co3O4 exposed to NO2 increased and the sensor properties for NO2 exposure were inconsistent with the DRIFT spectra. Interestingly, no clear differences between the chemical states of the metal oxide surface exposed to NO2 or NO could be detected from the DRIFT spectra of sensors based on either of the semiconductors. We think that NO was oxidized into NO2 and was adsorbed on the surface of WO3 or Co3O4 as NO2.
Acknowledgments
This work was supported in part by the “Development Project for Extremely-Early Diagnostics Technologies for Human Diseases” of Aichi prefecture, Japan.
Conflicts of Interest
The author declares no conflict of interest.
References
- American Conference of Governmental Industrial Hygienists. Available online: http://www.acgih.org (accessed on 22 August 2013).
- Saito, J.; Inoue, K.; Sugawara, A.; Yoshikawa, M.; Watanabe, K.; Ishida, T.; Ohtsuka, Y.; Munakata, M. Exhaled nitric oxide as a marker of airway inflammation for an epidemiologic study in schoolchildren. J. Allergy Clin. Immunol. 2004, 114, 512–516. [Google Scholar]
- Giannovario, J.A.; Grob, R.L.; Rulon, P.W. Analysis of trace pollutants in the air by means of cryogenic gas chromatography. J. Chromatogr. 1976, 121, 285–294. [Google Scholar]
- Wetchakun, K.; Samerjai, T.; Tamaekong, N.; Liewhiran, C.; Siriwong, C.; Kruefu, V.; Wisitsoraat, A.; Tuantranont, A.; Phanichphant, S. Semiconducting metal oxides as sensors for environmentally hazardous gases. Sens. Actuator B 2011, 160, 580–591. [Google Scholar]
- Ishihara, T.; Shiokawa, K.; Eguchi, K.; Arai, H. The mixed oxide Al2O3-V2O5 as a semiconductor gas sensor for NO and NO2. Sens. Actuator 1989, 19, 259–265. [Google Scholar]
- Inoue, T.; Ohtsuka, K.; Yoshida, Y.; Matsuura, Y.; Kajiyama, Y. Metal oxide semiconductor NO2 sensor. Sens. Actuator B 1995, 25, 388–391. [Google Scholar]
- Lin, C.Y.; Fang, Y.Y.; Lin, C.W.; Tunney, J.J.; Ho, K.C. Fabrication of NOx gas sensors using In2O3-ZnO composite films. Sens. Actuator B 2010, 146, 28–34. [Google Scholar]
- Tierney, M.J.; Kim, H.O.; Madou, M.; Otagawa, T. Microelectrochemical sensor for nitrogen oxides. Sens. Actuator B 1993. [Google Scholar]
- Miura, N.; Yao, S.; Shimizu, Y.; Yamazoe, N. Development of high-performance solid-electrolyte sensors for NO and NO2. Sens. Actuator B 1993, 13–14, 387–390. [Google Scholar]
- Akiyama, M.; Tamaki, J.; Miura, N.; Yamazoe, N. Tungsten oxide-based semiconductor sensor highly sensitive to NO and NO2. Chem. Lett. 1991, 20, 1611–1614. [Google Scholar]
- Tamaki, J.; Hashihin, T.; Uno, Y.; Dao, D.V.; Sugiyama, S. Ultrahigh-sensitive WO3 nanosensor with interdigitated Au nano-electrode for NO2 detection. Sens. Actuator B 2008, 132, 234–238. [Google Scholar]
- Zhang, C.; Debliquy, M.; Boudiba, A.; Liao, H.; Coddet, C. Sensing properties of atmospheric plasma-sprayed WO3 coating for sub-ppm NO2 detection. Sens. Actuator B 2010, 144, 280–288. [Google Scholar]
- Fruhberger, B.; Stirling, N.; Grillo, F.G.; Ma, S.; Ruthven, D.; Lad, R.J.; Frederick, B.G. Detection and quantification of nitric oxide in human breath using a semiconducting oxide based chemiresistive microsensor. Sens. Actuator B 2001, 76, 226–234. [Google Scholar]
- Penza, M.; Martucci, C.; Cassano, G. NOx gas sensing characteristics of WO3 thin films activated by noble metals (Pd, Pt, Au) layers. Sens. Actuator B 1998, 50, 52–59. [Google Scholar]
- Harbeck, S.; Szatvanyi, A.; Barsan, N.; Weimar, U.; Hoffmann, V. DRIFT studies of thick film un-doped and Pd-doped SnO2 sensors: Temperature changes effect and CO detection mechanism in the presence of water vapour. Thin Solid Films 2003, 436, 76–83. [Google Scholar]
- Hübner, M.; Simion, C.E.; Haensch, A.; Barsan, N.; Weimar, U. CO sensing mechanism with WO3 based gas sensors. Sens. Actuator B 2010, 151, 103–106. [Google Scholar]
- Akiyama, M.; Zhang, Z.; Tamaki, J.; Harada, T.; Miura, N.; Yamazoe, N. Promotion of NO sensitivity of WO3 element with the addition of noble metals. J. Surf. Sci. Jpn. 1993, 14, 295–300. [Google Scholar]
- Itoh, T.; Nakashima, T.; Akamatsu, T.; Izu, N.; Shin, W. Nonanal gas sensing properties of platinum, palladium, and gold-loaded tin oxide VOCs sensors. Sens. Actuator B Chem. 2013, 187, 135–141. [Google Scholar]
- Kanan, S.M.; Lu, Z.; Cox, J.K.; Bernhardt, G.; Tripp, C.P. Identification of surface sites on monoclinic WO3 powders by infrared spectroscopy. Langmuir 2002, 18, 1707–1712. [Google Scholar]
- Chi, Y.; Chuang, S.S.C. Infrared and TPD studies of nitrates adsorbed on Tb4O7, La2O3, BaO, and MgO/γ-Al2O3. J. Phys. Chem. B 2000, 104, 4673–4683. [Google Scholar]
- Műslehiddino ğ lu, J.; Vannice, M.A. Adsorption of NO on promoted Ag/α-Al2O3 catalysts. J. Catal. 2003, 217, 442–456. [Google Scholar]
- Emiroglu, S.; Barsan, N.; Weimar, U.; Hoffman, V. In situ diffuse reflectance infrared spectroscopy study of CO adsorption on SnO2. Thin Solid Films 2001, 391, 176–185. [Google Scholar]
- Ruhland, B.; Becker, T.; Müller, G. Gas-kinetic interactions of nitrous oxides with SnO2 surface. Sens. Actuator B 1998, 50, 85–94. [Google Scholar]
- Gurlo, A.; Sahm, M.; Oprea, A.; Barsan, N.; Weimar, U. A p- to n-transition on α-Fe2O3-based thick film sensors studied by conductance and work function change measurements. Sens. Actuator B 2004, 102, 291–298. [Google Scholar]
- Kim, Y.-S.; Hwang, I.-S.; Kim, S.-J.; Lee, C.-Y.; Lee, J.-H. CuO nanowire gas sensors for air quality control in automotive cabin. Sens. Actuator B 2008, 135, 298–303. [Google Scholar]


© 2013 by the authors; licensee MDPI, Basel, Switzerland. This article is an open access article distributed under the terms and conditions of the Creative Commons Attribution license (http://creativecommons.org/licenses/by/3.0/).
Share and Cite
Akamatsu, T.; Itoh, T.; Izu, N.; Shin, W. NO and NO2 Sensing Properties of WO3 and Co3O4 Based Gas Sensors. Sensors 2013, 13, 12467-12481. https://doi.org/10.3390/s130912467
Akamatsu T, Itoh T, Izu N, Shin W. NO and NO2 Sensing Properties of WO3 and Co3O4 Based Gas Sensors. Sensors. 2013; 13(9):12467-12481. https://doi.org/10.3390/s130912467
Chicago/Turabian StyleAkamatsu, Takafumi, Toshio Itoh, Noriya Izu, and Woosuck Shin. 2013. "NO and NO2 Sensing Properties of WO3 and Co3O4 Based Gas Sensors" Sensors 13, no. 9: 12467-12481. https://doi.org/10.3390/s130912467
APA StyleAkamatsu, T., Itoh, T., Izu, N., & Shin, W. (2013). NO and NO2 Sensing Properties of WO3 and Co3O4 Based Gas Sensors. Sensors, 13(9), 12467-12481. https://doi.org/10.3390/s130912467