Stroke Damage Detection Using Classification Trees on Electrical Bioimpedance Cerebral Spectroscopy Measurements

Abstract
: After cancer and cardio-vascular disease, stroke is the third greatest cause of death worldwide. Given the limitations of the current imaging technologies used for stroke diagnosis, the need for portable non-invasive and less expensive diagnostic tools is crucial. Previous studies have suggested that electrical bioimpedance (EBI) measurements from the head might contain useful clinical information related to changes produced in the cerebral tissue after the onset of stroke. In this study, we recorded 720 EBI Spectroscopy (EBIS) measurements from two different head regions of 18 hemispheres of nine subjects. Three of these subjects had suffered a unilateral haemorrhagic stroke. A number of features based on structural and intrinsic frequency-dependent properties of the cerebral tissue were extracted. These features were then fed into a classification tree. The results show that a full classification of damaged and undamaged cerebral tissue was achieved after three hierarchical classification steps. Lastly, the performance of the classification tree was assessed using Leave-One-Out Cross Validation (LOO-CV). Despite the fact that the results of this study are limited to a small database, and the observations obtained must be verified further with a larger cohort of patients, these findings confirm that EBI measurements contain useful information for assessing on the health of brain tissue after stroke and supports the hypothesis that classification features based on Cole parameters, spectral information and the geometry of EBIS measurements are useful to differentiate between healthy and stroke damaged brain tissue.1. Introduction
Stroke is not only the third greatest cause of death worldwide [1] but also the cause of severe suffering to the surviving individuals with neurological deficits and a significant economic burden to society. The cost burden associated with post-stroke deficits has been estimated to be 65.5 billion USD for 2008 for the United States alone [2,3]. Stroke patients usually require the prompt intervention of clinical staff to prevent permanent lesions from developing. A time window of 3–4.5 h is usually required for certain treatments after the onset of stroke to maximise the treatment benefits and avoid permanent neurological impairment [4,5]. Every effort should be made to shorten the delay of the onset of therapy following stroke. Even a few minutes can make a difference. Adequate treatment within 90 min or less increases the probability of a favourable outcome for the patient [6]. However, many diagnostic tools, such as magnetic resonance imaging, X-ray or computer tomography are not accessible until patients reach a hospital, thus delaying the initiation of proper neural rescue therapies.
Moreover, none of these medical imaging devices can be used for continuous bedside monitoring of the brain. Therefore, to enable early detection of stroke and maximise the treatment outcome for the patients, it is crucial to have access to new monitoring tools that allow bedside monitoring or that can be used in ambulances.
Electrical bioimpedance (EBI) is a well-known, portable, affordable and non-invasive technology. Its use in various clinical activities and in physiological research has long been widespread [7–9]. Early applications of EBI used single-frequency measurements. Examples of these applications include impedance cardiography in 1940 [10] and lung function monitoring [11] in the 1970s. More recently, applications based on EBI Spectroscopy (EBIS) analysis have entered fields such as skin cancer detection [12] and nutritional status assessment in haemodialysis patients [13].
Since the 1950s and 1960s, EBI studies of the brain have been used to study different pathologies, including spreading depression, seizure activity, asphyxia and the effects of cardiac arrest [14]. Since this time, EBI research studies of the brain have been widespread, especially during the past 20 years [15,16]. Since Holder foresaw the development of electrical bioimpedance-based neurological applications in 1988 [16], several bioimpedance research and clinical studies have been performed in the areas of brain ischemia [17–19], spreading depression [20,21], epilepsy [21–24], brain function monitoring [25], perinatal asphyxia [26–28], cerebral blood flow monitoring [29–31] and stroke [32–34].
Stroke can be categorised into two main groups, namely, ischemia and haemorrhagic, with 87% of cases being ischemic and the remainder haemorrhagic [35]. Ischemic stroke is caused by arterial embolism or thrombosis, with a lack of blood supply to the brain followed by oedema, whereas haemorrhage is caused by accumulation of blood due to rupture of a blood vessel forming a haematoma. Different authors have drawn attention to the changes imposed on the electrical properties of the brain after an incident of cerebrovascular damage and have shown that these changes are detectable by means of electrical bioimpedance [16,32,36,37]. Both ischemia and haemorrhage will produce a change in the composition and structure of the cerebral tissue, and the electrical properties of the brain will change as a result [27,28,32,36–40].
It has been demonstrated that the electrical properties of the cerebral tissue change after an occurrence of stroke and that these changes are detectable from EBIS measurements performed on both hemispheres [37]. It has been observed that the Cole parameters [41] obtained from these EBIS measurements contain information that could be used to detect brain damage. However, this information was not sufficient to fully distinguish healthy cerebral tissue from stroke-damaged tissue.
Earlier studies have demonstrated the use of classification methods such as support vector machine (SVM) or multimodality classifier for detection of deteriorations in tissue or tissue characterization [42,43]. In this study, features extracted from EBIS measurements are fed into a relatively simple classification tree with the goal of separating healthy brain hemispheres from brain hemispheres with stroke damage. The authors believe the high explanatory power of classification tress make them an ideal choice for this study [44].
2. Materials and Methods
2.1. Tetrapolar EBI Measurements and Spectrometer
EBIS measurements were recorded using a SFB7 Spectrometer manufactured by Impedimed (Pinkenba, Queensland, Australia). Recordings were obtained in the frequency range of 3.096–1,000 kHz using the four electrode technique [45] and a sinusoidal current with the RMS value of 200 μA sweeping the frequency range over 256 logarithmically spaced frequency points. This will provide 256 complex EBI measurements from the frequency range. Two sets of EBIS measurements each containing 20 consecutive measurements were recorded from each hemisphere of all subjects. The first set includes measurements with the electrodes located close to the centre line of the head and the second set includes measurements with the electrodes located more laterally.
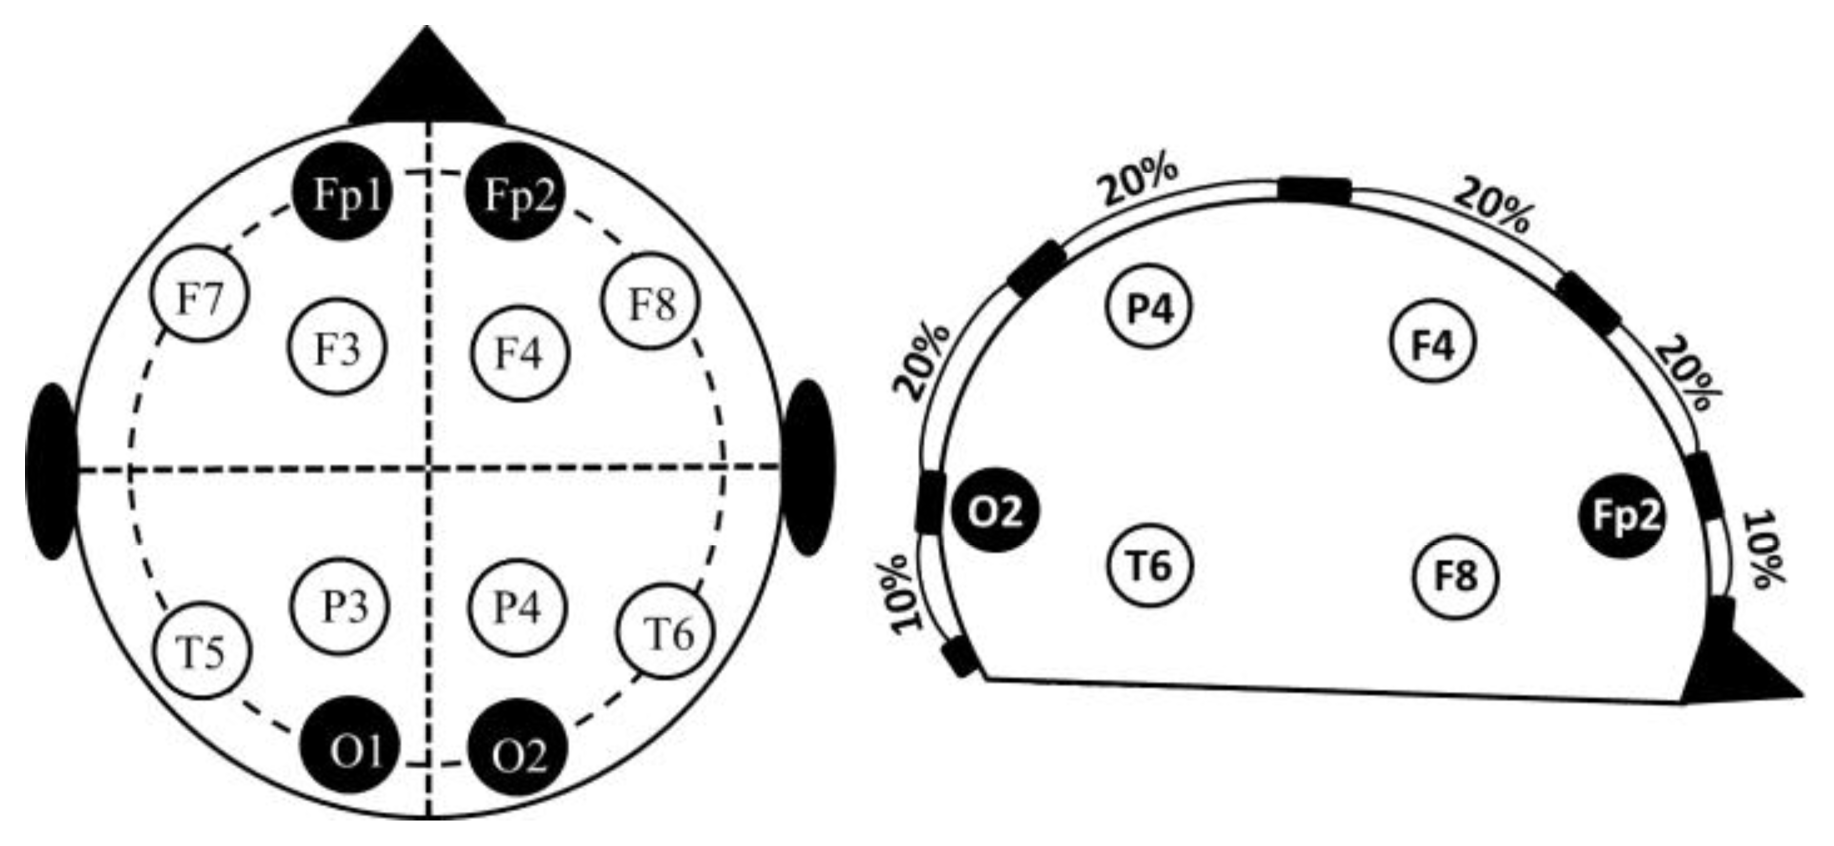
The electrodes were placed according to the 10–20 electrode placement system (Figure 1). The central measurements were labelled as MCL or MCR to indicate the left or right hemisphere. The lateral measurements were labelled as MLL or MLR. All the recordings were performed using standard EEG silver electrodes dipped in Elefix electro-conductive paste. The details of electrode positioning are shown in Table 1. Prior to the application of the electrodes, the skin surface was prepared by cleaning the skin with alcohol and scrubbing gently with mild abrasive conductive cream.
2.2. Measurements Subjects
This study included a total of six volunteers and three patients who had suffered a unilateral stroke, i.e., only one brain hemisphere was damaged by the stroke, The healthy volunteers were all males aged 29–54. The ages of the patients ranged from 40–55. Two of the patients were female, one male. The stroke was present in the left hemisphere in two patients and in the right hemisphere in the other patient. The patients were in the initial phase of rehabilitation, 6–8 weeks after the stroke episode. Details of the stroke location and relevant lesion area are listed in Table 2.
A total of 720 EBIS measurements were recorded from all nine subjects. From these measurements, 600 were recordings from 15 hemispheres with no stroke i.e., undamaged and the remaining 120 were EBIS recordings from the three hemispheres with stroke. The 600 undamaged recordings consist of 480 EBIS recordings from twelve hemispheres of six healthy subjects and 120 measurements were from hemispheres of the patients with no stroke i.e., undamaged hemispheres. This study was conducted with the ethical approval of the regional ethical review board of Gothenburg.
2.3. Cole Characterisation
Experimentally obtained EBI measurements can be fitted with sufficient accuracy by the Cole Equation (1), introduced by Cole in 1940 [41]:
The Cole function consists of four parameters: R0, the DC resistance; R∞, the resistance at infinite frequency; α; and fc, the characteristic frequency [41,46]. In this study, all 720 EBIS measurements were fitted to the Cole model, and the Cole parameters were extracted for each measurement.
However, EBI measurements are known to be sensitive to stray capacitances in parallel with the measurement load, shifting the intrinsic dispersion of the tissue under study towards the dispersion of the capacitors in parallel and producing a deviation in the recorded data [47,48].
Seoane et al. have shown that the use of the real part of the admittance spectrum, i.e., the conductance, to fit the Cole function using non-linear least squares (NLLS) fitting [49] in MATLAB® allows the Cole parameters to be obtained free from capacitive leakage [50]. Therefore, as shown in [50], the value of the Cole parameters was estimated from the EBIS measurements based on NLLS fitting to the expression for the conductance Cole Equation (2) where Y0 and Y∞ are inverse of R0 and R∞, respectively:
2.4. Feature Set
Three features based on the Cole parameters, on spectral information and on the geometry of the EBIS measurements were defined for classification purposes. Each of these features was designed to be obtained from a different frequency region of the spectrum, i.e., low, medium and high frequencies (see Table 3). To obtain the feature sets, the 720 measurements were first separated into two groups, namely, central and lateral, each consisting of 360 measurements.
The first two features were derived from Cole parameters R0 and R∞ as representatives of the high and low frequencies, respectively. These features were expressed as the ratio of central and lateral measurements inspired by the symmetry between brain hemispheres expected in a healthy subject. Earlier results reported suggest that these features will have a discriminative power around absolute value one [37]. The third feature was defined around the central frequency of the resistance and reactance spectra as the ratio of resistance to reactance at the characteristic frequency for the central and lateral measurements. This feature can be viewed as the phase of the impedance. In [51], it was proposed that this ratio is related to the ability of the volume fraction to track changes imposed on the tissue impedance. Therefore, this ratio is believed to contain useful information for monitoring a suspension of cells after changes are imposed on it due to the damaged mechanism, i.e., ischemic or haemorrhagic damage.
Observing the Equation (3) for the electrical impedance of biological tissue as a shape factor usually related to length and area denoted by k and multiplied by its specific impedance z*(ω), known also as impedivity, Features 1 and 2 are primarily related to the shape factor, whereas Feature 3 targets the intrinsic frequency dependence:
2.5. Classification Trees
Reliable automatic decision making based on a set of simple questions is highly beneficial and greatly needed in medicine. In situations requiring a decision based on a large amount of input data, hierarchical decision-making algorithms can reduce the complexity of the problem and produce an accurate decision. Classification trees are hierarchical decision-making solutions that are well suited for the classification of categorical dependent variables. These solution methods offer a high degree of flexibility and exploratory power. Among other advantages of classification trees compared with other classification methods is their inherently non-parametric nature, which means they can be used regardless of the data distribution, whether normally distributed or skewed. In addition, classification trees have an inherent straightforward logic that is easily interpretable by a non-statistician or clinician. [52]. In a classification tree based on the attributes of a set of instances whose classes are already known, a mapping is performed from the attribute values to the classes, and the classification tree is essentially the formalisation of this mapping [44]. Each attribute/feature with the potential for classifying a data set will occupy a node of the tree, partitioning the data set into two subgroups, each placed on a leaf of the tree. This process continues until the tree is fully grown. Additionally, the convenient graphical display of classification trees is of substantial value in studying the performance of each individual attribute/feature more effectively.
In this study, three thresholds based on the features and symmetries were introduced hierarchically and placed at three nodes of a tree. Binary answers to the thresholds at each node were then used to separate the data into two new sub-classes, each placed on the leaves of the tree. The thresholds applied to Features 1 and 2 are essentially related to the geometry and shape factor of the EBI recordings derived from Cole parameters R0 and R∞, with an absolute value of approximately 1 according to the results stated in [37]. The threshold applied to Feature 3 was obtained experimentally.
2.6. Leave-One-Out Cross-Tree Validation
If the number of subjects is small, the measurements cannot be separated into two well-distributed groups of training and test data, as this split may produce an undesirable outcome and misleading results. In any case, other alternatives remain for evaluating the performance of the method in scenarios such as the current scenario.
At a higher computational cost, the Leave-One-Out (LOO) cross-validation technique [53] may be applied to provide useful values. In the application of the LOO method to an experiment i.e., stroke detection with N examples i.e., nine subjects in the case of this study, N iterations are performed with N–1 examples used for training and 1 for testing. In each iteration i, the error Ei and the final classification error are calculated using Equation (4). Note that Ei is calculated as the percentage of misclassified measurements out of all measurements performed on one subject and a total of 40 measurements per subject (20 measurements per hemisphere) are provided, from each measurement three features are extracted:
3. Results
3.1. Cole Parameters
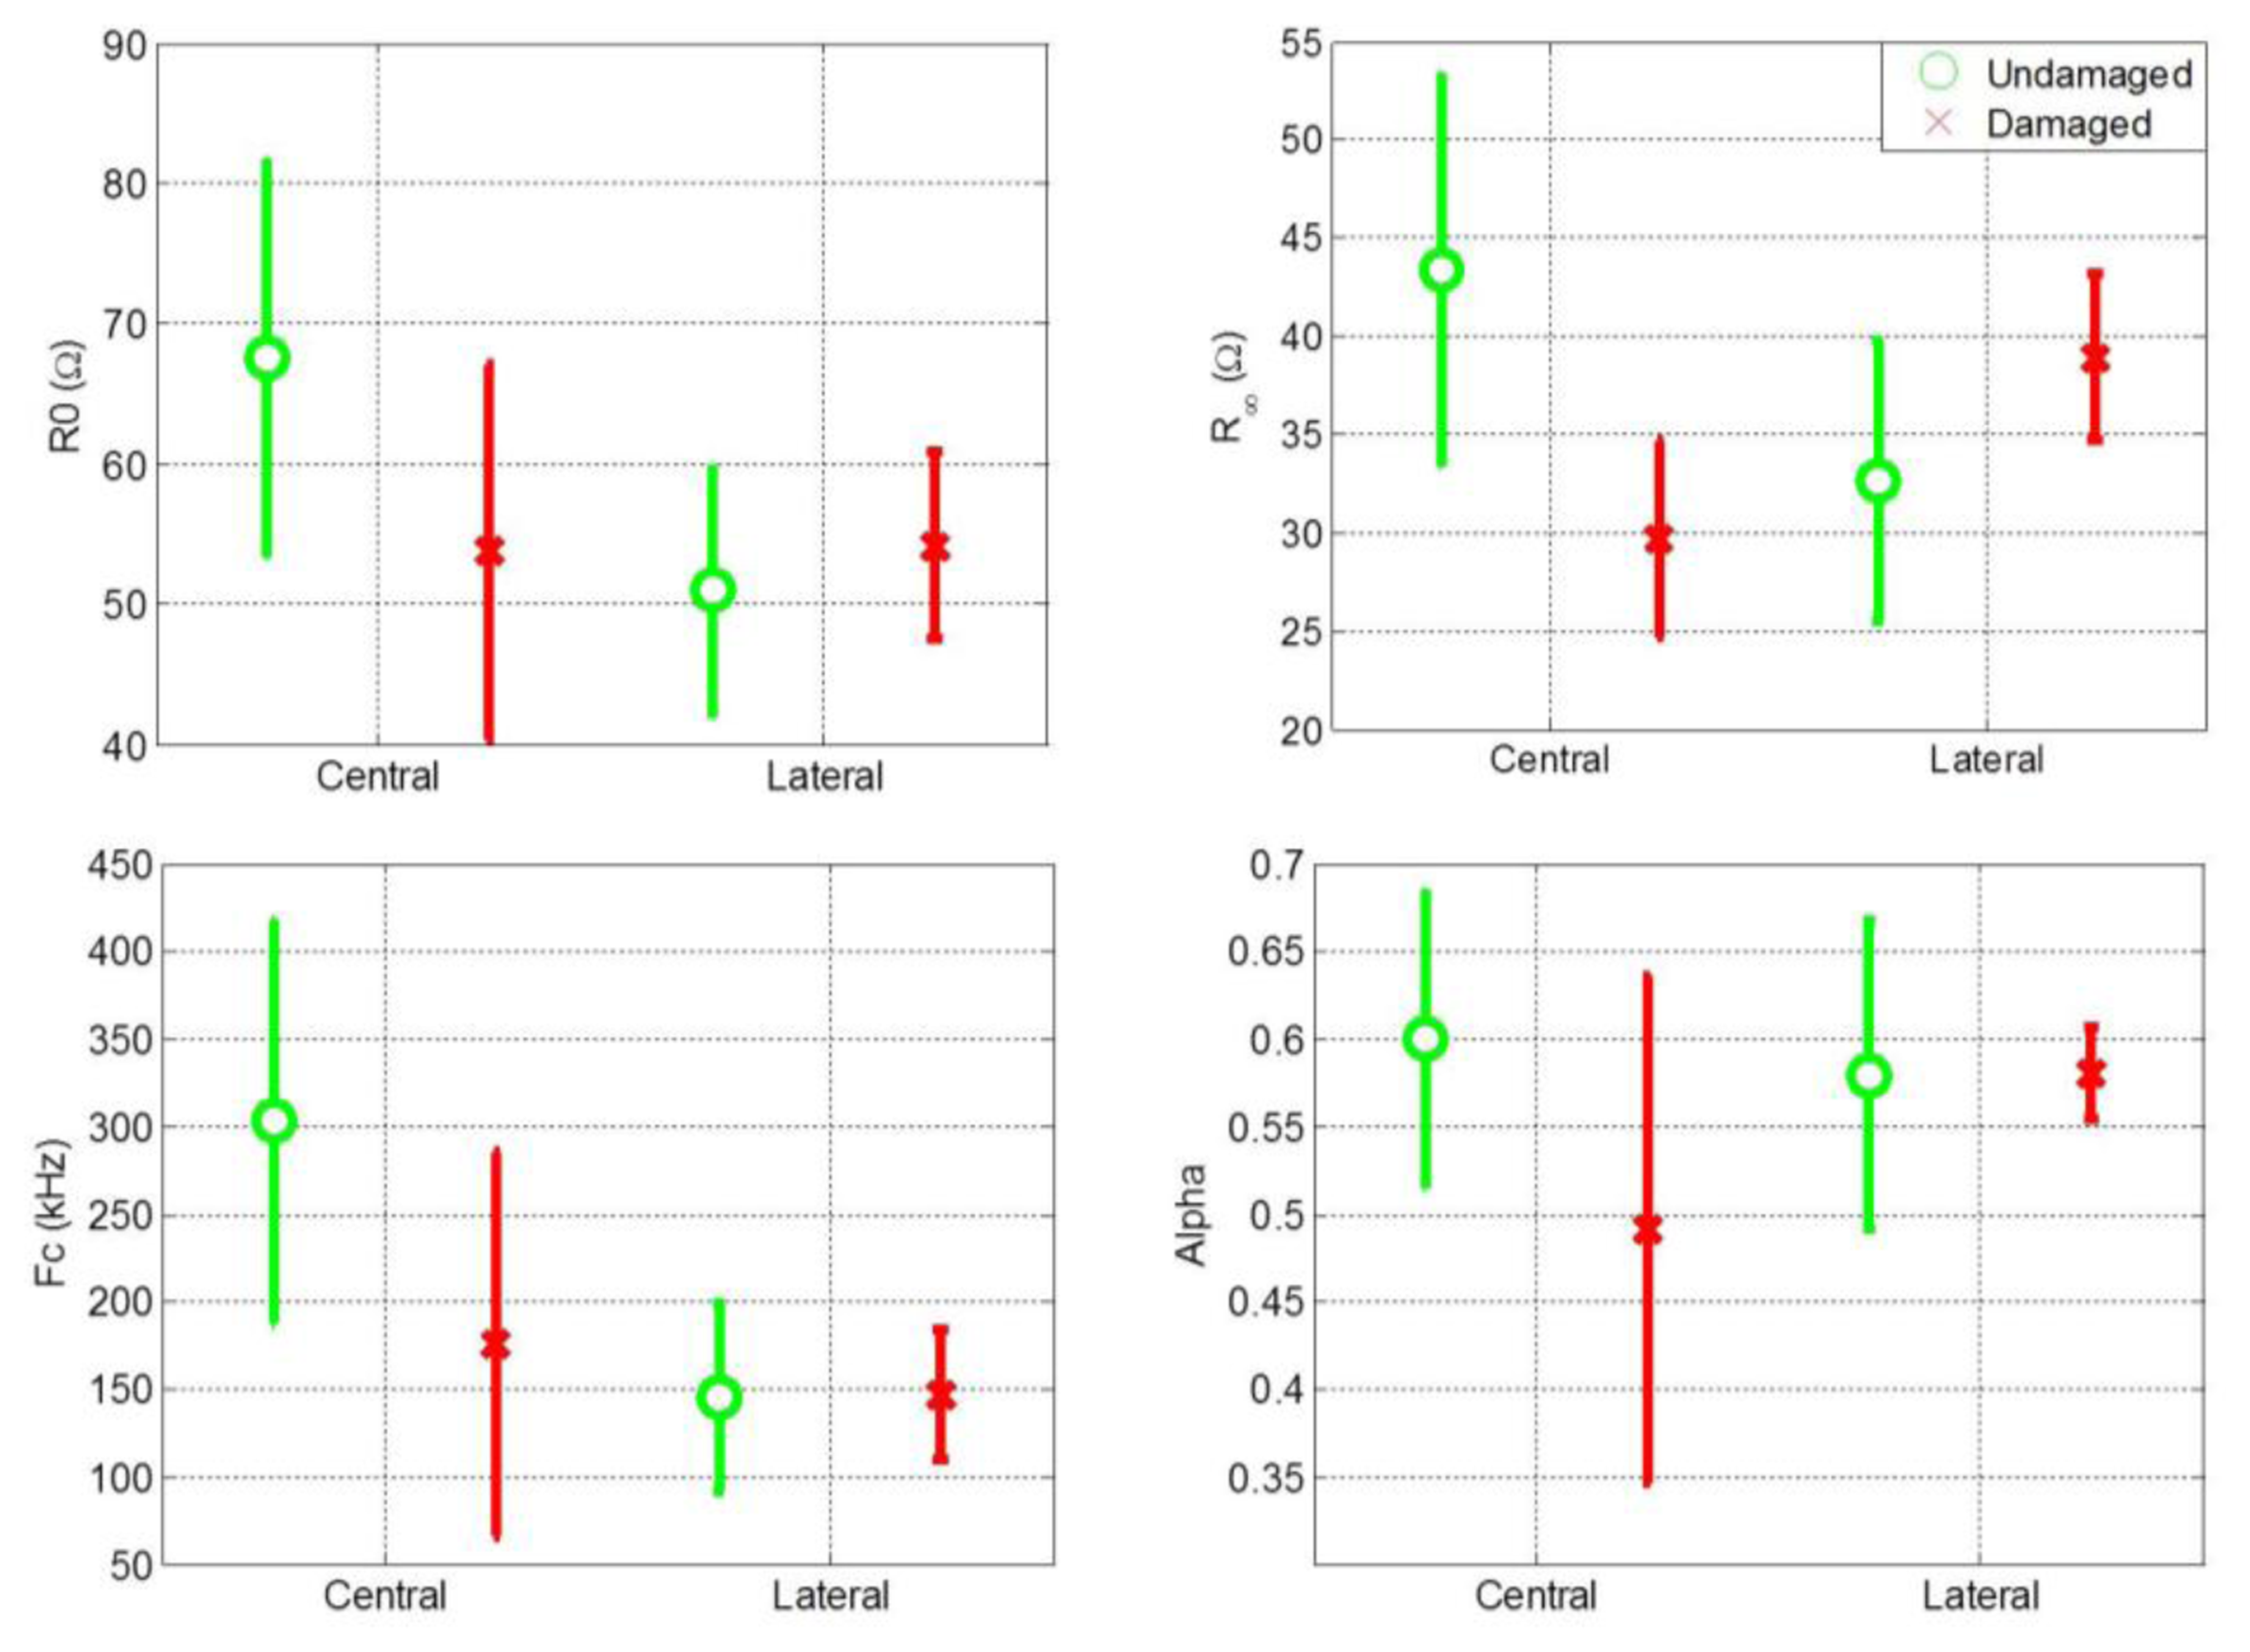
Cole parameters were extracted for all central and lateral measurements. The mean value and standard deviation of the Cole parameters for central and lateral measurements of both damaged and undamaged hemispheres are shown separately in Figure 2. Figure 2 shows that the distribution of the Cole parameter values exhibit a high variance. One reason for this high variance is the high variance among patients in the magnitude of the impedance recordings. It is also evident that comparing the Cole parameters individually for central and lateral measurements is not an effective procedure for distinguishing between healthy and damaged cerebral tissue.
3.2. Feature Maps
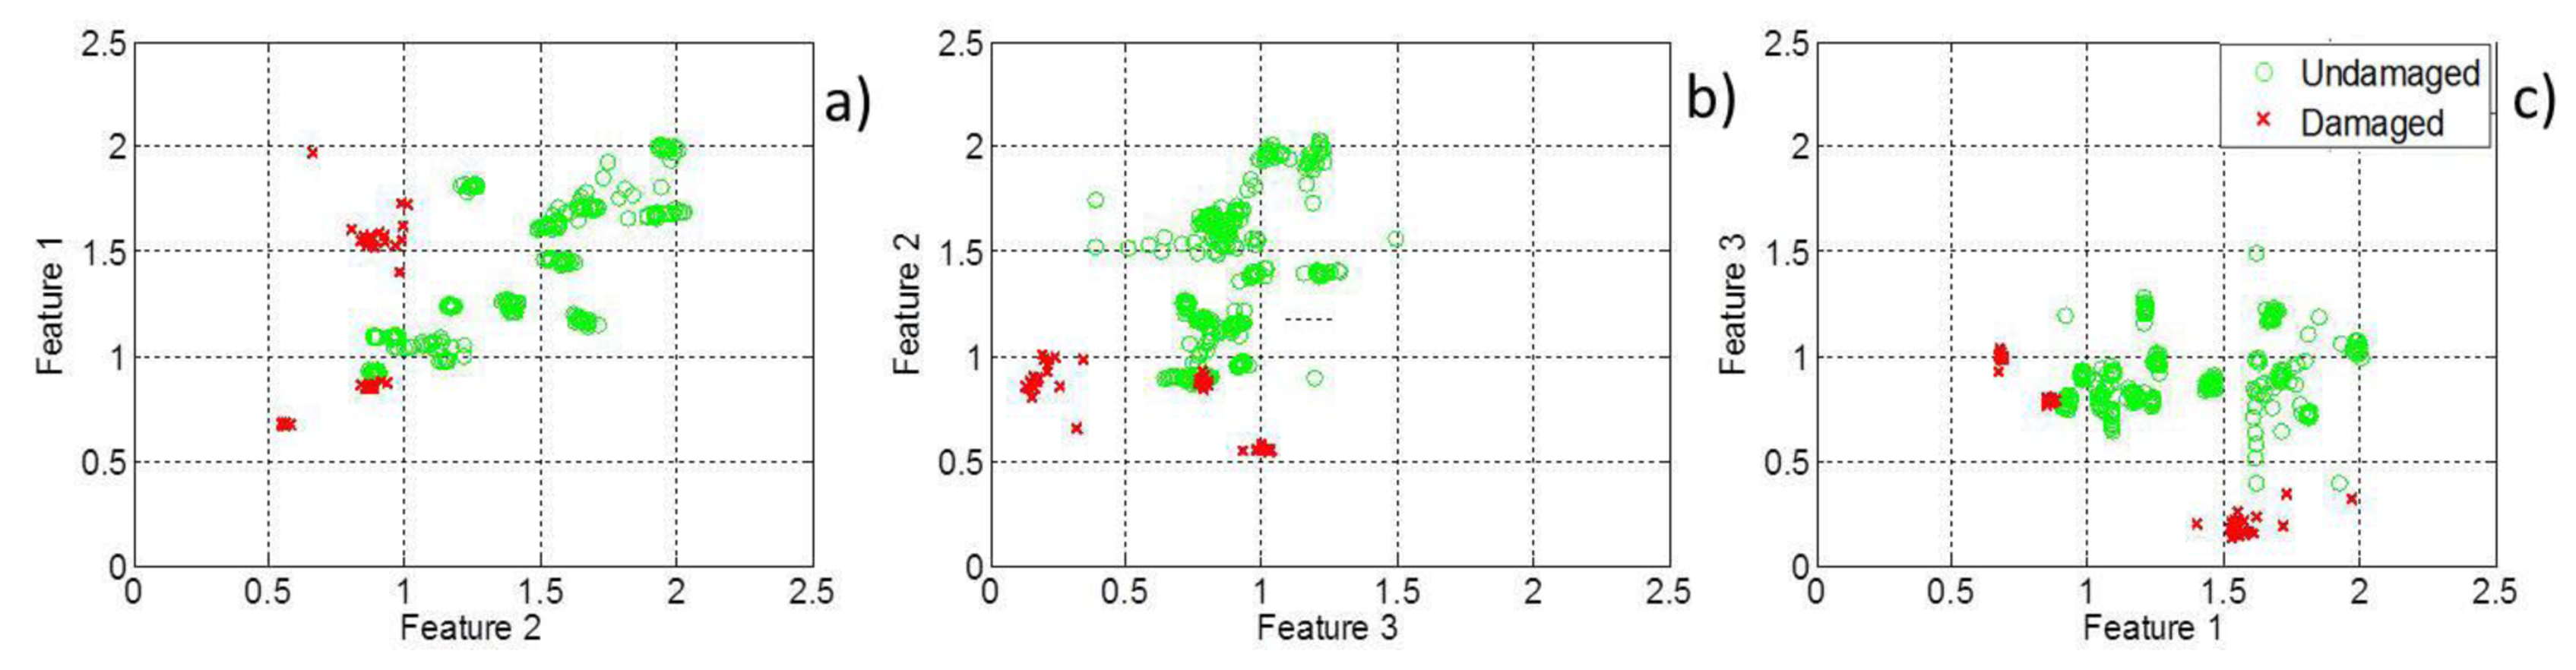
The three features introduced in this study are plotted in a pairwise manner in two-dimensional feature maps, Figure 3. Figure 3 shows that feature Maps (a) and (b) can distinguish to a certain extent between healthy and damaged cerebral tissue but that a full classification is not possible based on either of these feature maps. However, a hierarchical decision-making classifier based on these features can fully separate stroke cases from healthy cases.
3.3. Classification Tree
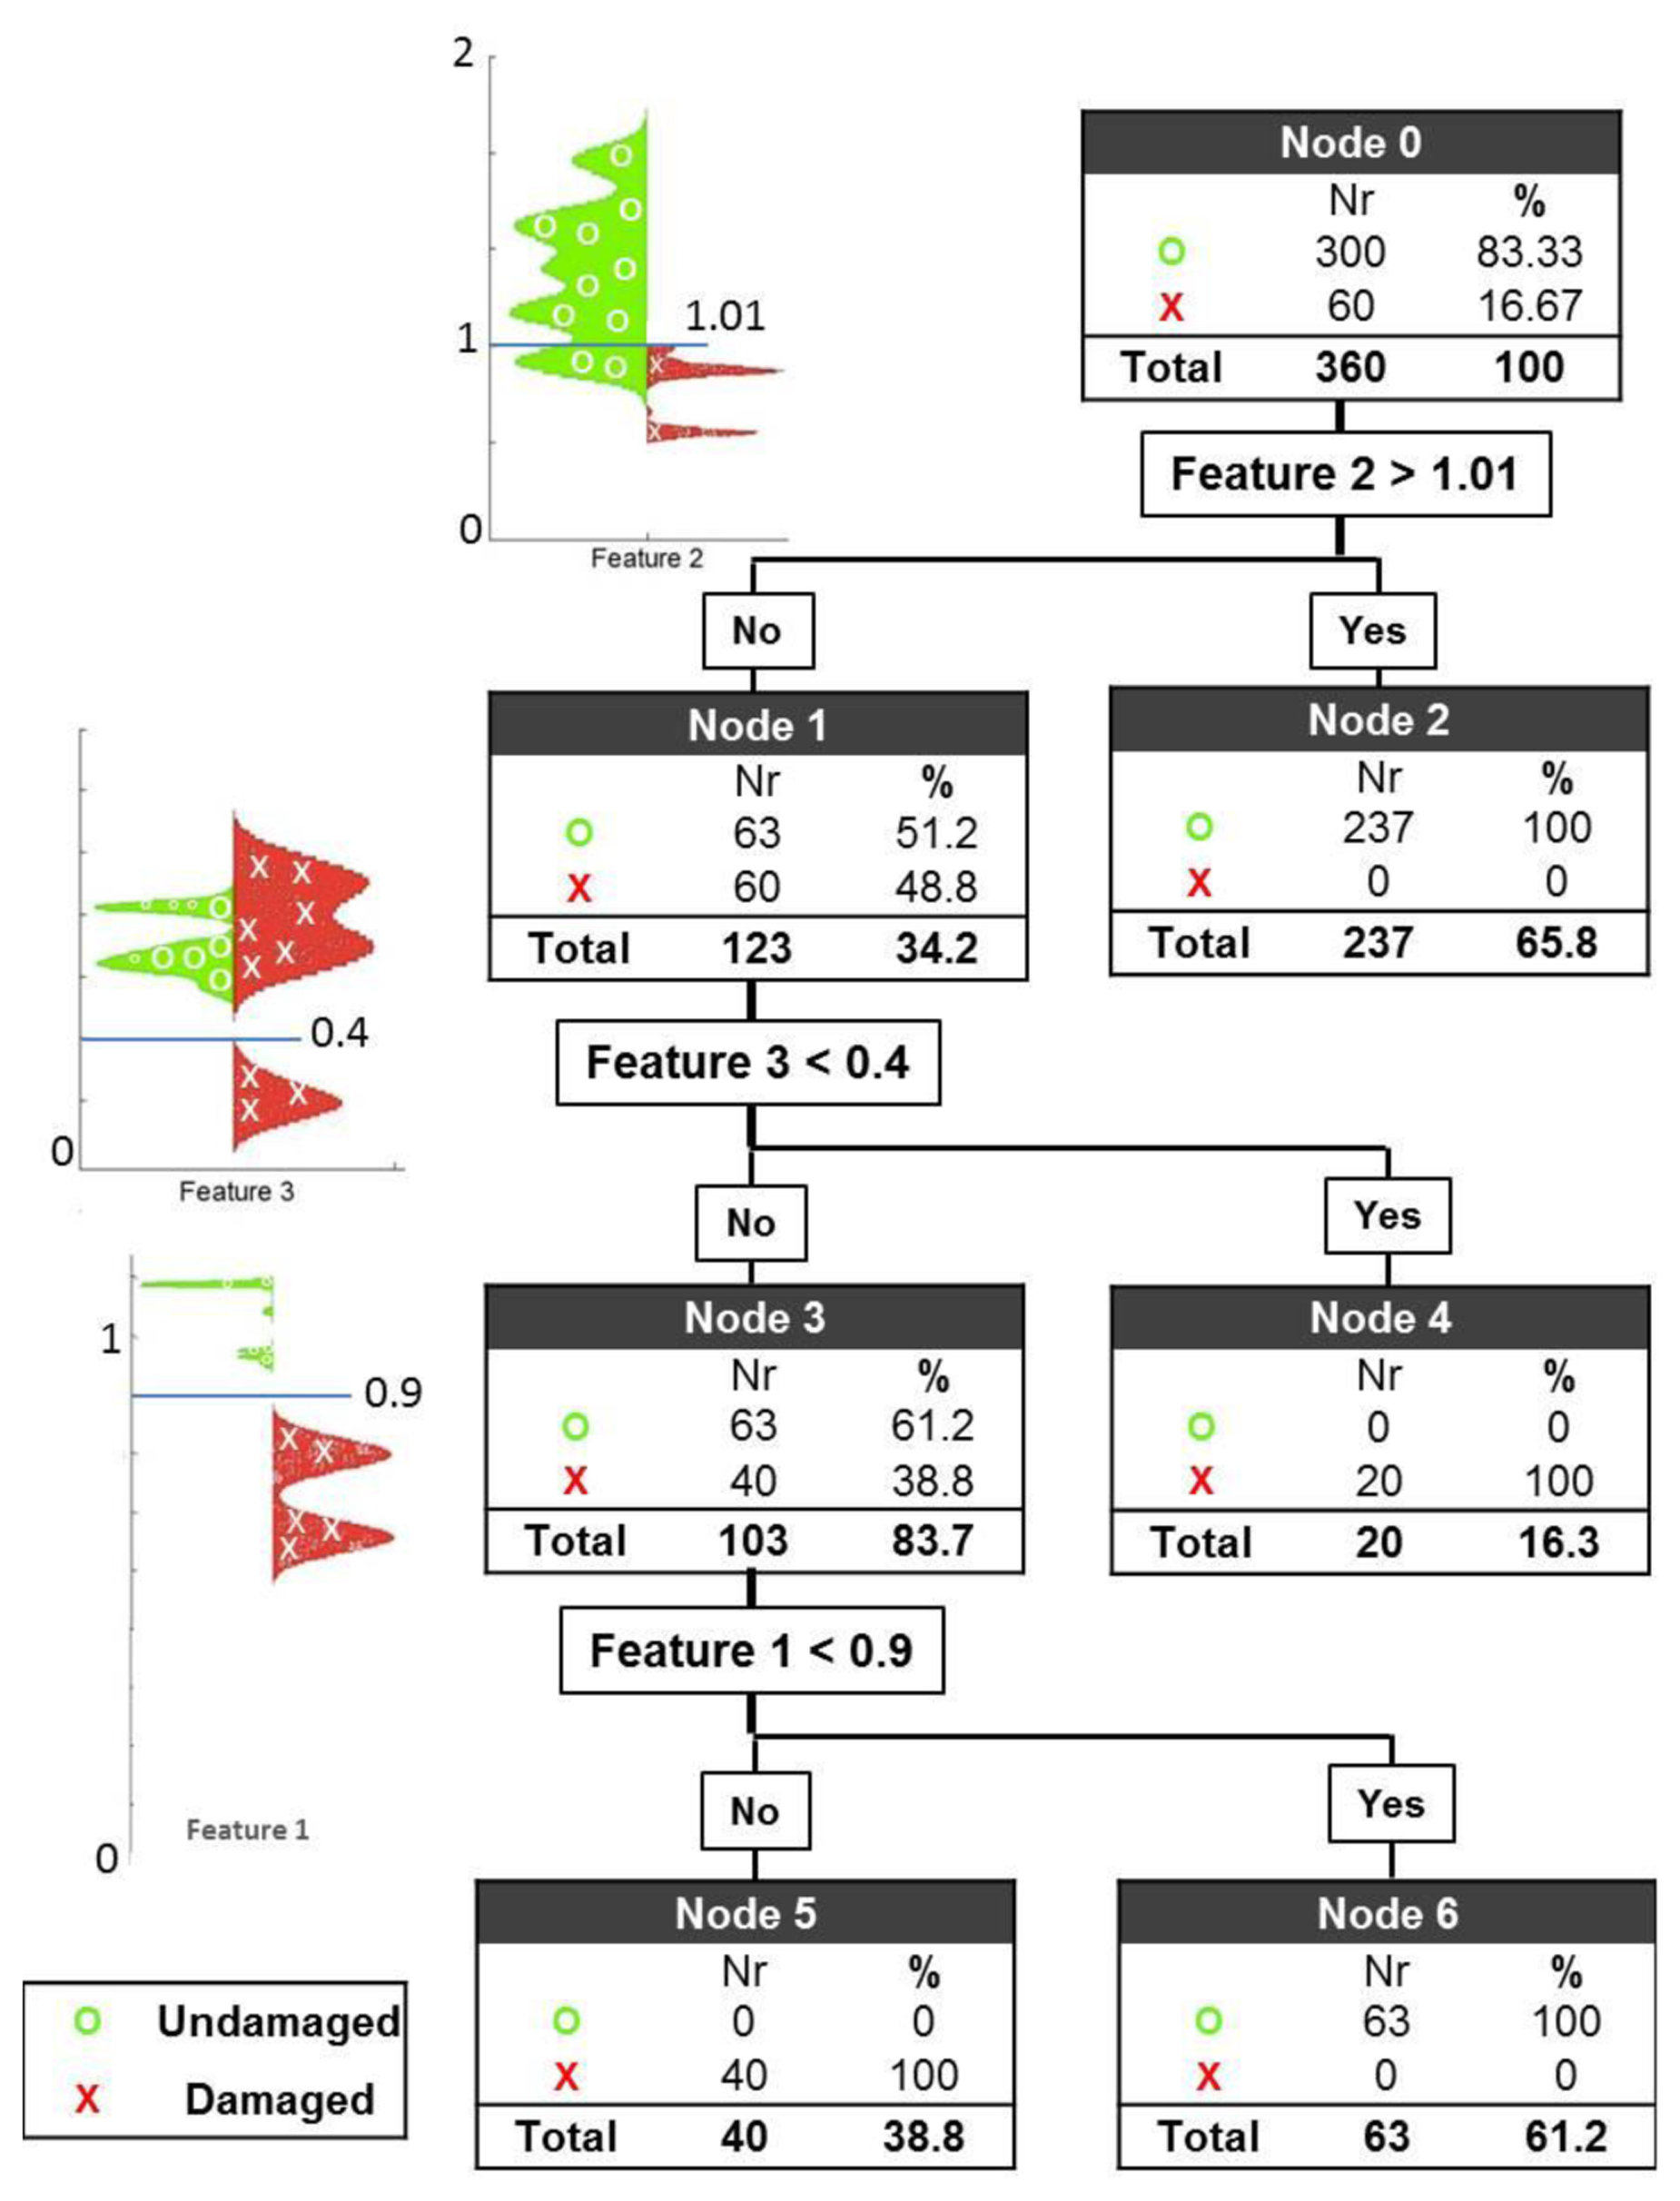
The three features introduced earlier are situated at three different nodes of a classification tree with the following three thresholds: 0.9 for Feature 1, 1.10 for Feature 2 and 0.4 for Feature 3. The first and second thresholds are related to Cole parameters R0 and R∞ respectively as explained earlier they were expected to have values around 1 however the exact values were determined after the observation of feature maps in Figure 3. The third threshold was entirely selected by observation of feature maps. The results are shown on the leaves of the tree. The application of these thresholds yields a perfect classification of healthy and damaged cerebral tissue (see Figure 4).
At the first node, the first threshold is set to 1.01 for Feature 2 with the expectation of classifying a cluster of healthy subjects. With the application of this threshold, 79% of the healthy cases are correctly classified, leaving 21% of the healthy cases and 100% of the damage cases for further evaluation. Applying the second threshold with the value 0.4 for Feature 3, 1/3 of the damage cases are successfully separated, leaving 28.6% of all the measurements (63 healthy cases and 40 damage cases) for further evaluation. At the last node, the third and final threshold is then applied to Feature 1, with a value of 0.9. The result of this evaluation is that all 63 healthy cases are classified correctly in node 6, and all 40 remaining damaged cases are also correctly classified in node 5.
3.4. Classifier Performance
After a total of nine iterations implementing the LOO-CV test, not a single measurement was misclassified. In each iteration, all the data from the test set were separated perfectly into the healthy and damaged categories based on a classification tree customised with the values from the other eight data sets.
4. Discussion
Several previous studies have demonstrated the ability of electrical bioimpedance measurements at a single frequency of 50 kHz to detect haematoma and oedema as the principal indicators of stroke [33,34]. Although this approach is highly informative, EBIS measurements, in contrast to single-frequency EBI recordings, cover a wide range of frequencies from low to high, facilitating a more comprehensive study of all components within the tissue. Several previous studies have shown that EBIS measurements contain useful information on tissue characteristics and structure, thus providing features suitable for an automated classification of healthy/damaged tissue and, in particular, cerebral tissue [37,46,54]. It is known that impedance data are closely related to the geometry of the effective conductive volume and dielectric properties of the conductive tissue. For this reason, applying known geometrical information embedded in the EBIS recordings may produce more successful classification results [37].
In this study, we combined spectral information, i.e., Cole parameters, with the measurement geometry to produce features that were well suited for classification. These features were then fed to a classification tree, and a perfect classification of healthy and damaged tissue was achieved after three steps. Due to the small size of the data set, which includes only three cases and six controls, the possibility that the results are due to chance cannot be excluded with a high degree of confidence. Moreover, the performance resulting from automatising the tree could not be evaluated. However, the results strengthen the hypothesis that cerebral EBIS can be useful in stroke detection and diagnosis. Given a sufficient number of subjects, the data set could be divided into two groups. The tree could be fully grown using the first data set. The performance of the classifier could then be tested with the second group. Lastly, pruning could be used to improve the accuracy of the classification tree [44]. Note, however, that the purpose of this manuscript is to claim that transencephalic EBIS measurements contain information on brain tissue state. This information is potentially useful for building a non-invasive monitoring device for the early detection of stroke damage.
5. Conclusions/Outlook
Three features were identified based on Cole parameters and geometry-related EBIS information. These were then fed into a simple classification tree that successfully separated healthy from stroke-damaged brain hemispheres. Although the available data were insufficient to perform a substantial evaluation of the performance of the classification approach or to apply other non-parametric automatic classification approaches, the results indicate that bioimpedance spectroscopy of head measurements provides useful information that might enable the development of a monitoring device to screen brain damage.
A larger data set including several patients should be obtained to verify the findings of this study and to allow the investigations to be extended to other classification modalities. Currently, transcephalic measurements of electrical bioimpedance are being performed on stroke patients at the Neurology ward at Karolinska Hospital. Accordingly, it is expected that these results will be verified in the near future with a larger cohort of patients.
Acknowledgments
This work was hosted by the MedTech West initiative. The authors acknowledge support from the Department of Clinical Neurophysiology at Sahlgrenska University Hospital and the Department for Neuro-rehabilitation 623 at Högsbo Hospital. The authors specifically thank Göran Pegenius and Mikael Elam for their support.
Conflicts of Interest
The authors declare no conflict of interest.
References
- Donnan, G.A.; Fisher, M.; Macleod, M.; Davis, S.M. Stroke. Lancet 2008, 371, 1612–1623. [Google Scholar]
- Rosamond, W.; Flegal, K.; Furie, K.; Go, A.; Greenlund, K.; Haase, N.; Hailpern, S.M.; Ho, M.; Howard, V.; Kissela, B.; et al. Heart disease and stroke statistics—2008 update: A report from the American Heart Association Statistics Committee and Stroke Statistics Subcommittee. Circulation 2008, 117, e25–e146. [Google Scholar]
- Mackay, J.; Mensah, G.A. The Atlas of Heart Disease and Stroke; Myriad Edtions Ltd. WHO: Geneva, Switzerland, 2004; p. 112. [Google Scholar]
- Del Zoppo, G.J.; Saver, J.L.; Jauch, E.C.; Adams, H.P., Jr. Expansion of the time window for treatment of acute ischemic stroke with intravenous tissue plasminogen activator: A science advisory from the American Heart Association/American Stroke Association. Stroke 2009, 40, 2945–2948. [Google Scholar]
- Nor, A.M.; Davis, J.; Sen, B.; Shipsey, D.; Louw, S.J.; Dyker, A.G.; Davis, M.; Ford, G.A. The Recognition of Stroke in the Emergency Room (ROSIER) scale: Development and validation of a stroke recognition instrument. Lancet Neurol. 2005, 4, 727–734. [Google Scholar]
- Lees, K.R.; Bluhmki, E.; von Kummer, R.; Brott, T.G.; Toni, D.; Grotta, J.C.; Albers, G.W.; Kaste, M.; Marler, J.R.; Hamilton, S.A.; et al. Time to treatment with intravenous alteplase and outcome in stroke: An updated pooled analysis of ECASS, ATLANTIS, NINDS, and EPITHET trials. Lancet 2010, 375, 1695–1703. [Google Scholar]
- Gabriel, C.; Gabriel, S.; Corthout, E. The dielectric properties of biological tissues: I. Literature survey. Phys. Med. Biol. 1996, 41, 2231–2249. [Google Scholar]
- Gabriel, S.; Lau, R.; Gabriel, C. The dielectric properties of biological tissues: II. Measurements in the frequency range 10 Hz to 20 GHz. Phys. Med. Biol. 1996, 41, 2251–2269. [Google Scholar]
- Gabriel, S.; Lau, R.; Gabriel, C. The dielectric properties of biological tissues: III. Parametric models for the dielectric spectrum of tissues. Phys. Med. Biol. 1996, 41, 2271–2293. [Google Scholar]
- Nyboer, J.; Bango, S.; Barnett, A.; Halsey, R.H. Radiocardiograms: Electrical impedance changes of the heart in relation to electrocardiograms and heart sounds. J. Clin. Invest. 1940, 19, 773. [Google Scholar]
- Olsson, T.; Victorin, L. Transthoracic impedance, with special reference to newborn infants and the ratio air-to-fluid in the lungs. Acta Paediatr. Scand. Suppl. 1970, 207 Suppl 207:1+. [Google Scholar]
- Aberg, P.; Nicander, I.; Hansson, J.; Geladi, P.; Holmgren, U.; Ollmar, S. Skin cancer identification using multifrequency electrical impedance—A potential screening tool. IEEE Trans. Biomed. Eng. 2004, 51, 2097–2102. [Google Scholar]
- Azar, R.; Al-Moubarak, I.; Barsumau, J.; Smessaert, C.; Vairon, M.X. Assessment and follow-up of nutritional status in hemodialysis patients. Nephrol. Ther. 2009, 5, S317–S322. [Google Scholar]
- Ochs, S.; van Harreveld, A. Cerebral impedance changes after circulatory arrest. Am. J. Physiol. 1956, 187, 180–192. [Google Scholar]
- Holder, D.S. Feasibility of developing a method of imaging neuronal activity in the human brain: A theoretical review. Med. Biol. Eng. Comput. 1987, 25, 2–11. [Google Scholar]
- Holder, D.S.; Gardner-Medwin, A.R. Some possible neurological applications of applied potential tomography. Clin. Phys. Physiol. Meas. 1988, 9, 111–119. [Google Scholar]
- Williams, C.E.; Gunn, A.; Gluckman, P.D. Time course of intracellular edema and epileptiform activity following prenatal cerebral ischemia in sheep. Stroke 1991, 22, 516–521. [Google Scholar]
- Holder, D.S. Detection of cerebral ischaemia in the anaesthetised rat by impedance measurement with scalp electrodes: Implications for non-invasive imaging of stroke by electrical impedance tomography. Clin. Phys. Physiol. Meas. 1992, 13, 63–75. [Google Scholar]
- Seoane, F.; Lindecrantz, K.; Olsson, T.; Kjellmer, I.; Mallard, C. Evolution of Cerebral Bioelectrical Resistance at Various Frequencies During Hypoxia in Fetal Sheep. Proceedings of Annual Conferense of the EPSM 2004, Geelong, Australia, 14–18 November 2004; p. 237.
- Holder, D.S. Detection of cortical spreading depression in the anaesthetised rat by impedance measurement with scalp electrodes: Implications for non-invasive imaging of the brain with electrical impedance tomography. Clin. Phys. Physiol. Meas. 1992, 13, 77–86. [Google Scholar]
- Olsson, T.; Broberg, M.; Pope, K.J.; Wallace, A.; Mackenzie, L.; Blomstrand, F.; Nilsson, M.; Willoughby, J.O. Cell swelling, seizures and spreading depression: An impedance study. Neuroscience 2006, 140, 505–515. [Google Scholar]
- Cusick, G.; Holder, D.; Birkett, A.; Boone, K. A system for impedance imaging of epilepsy in ambulatory human subjects. Innov. Technol. Biol. Med. 1994, 15, 40–46. [Google Scholar]
- Rao, A. Electrical Impedance Tomography of Brain Activity: Studies into Its Accuracy and Physiological Mechanisms; University College London: London, UK, 2000. [Google Scholar]
- Fabrizi, L.; McEwan, A.; Oh, T.; Woo, E.J.; Holder, D.S. A comparison of two EIT systems suitable for imaging impedance changes in epilepsy. Physiol. Meas. 2009, 30, S103–S120. [Google Scholar]
- Tidswell, A.T.; Gibson, A.; Bayford, R.H.; Holder, D.S. Electrical impedance tomography of human brain activity with a two-dimensional ring of scalp electrodes. Physiol. Meas. 2001, 22, 167–175. [Google Scholar]
- Lingwood, B.E.; Dunster, K.R.; Colditz, P.B.; Ward, L.C. Noninvasive measurement of cerebral bioimpedance for detection of cerebral edema in the neonatal piglet. Brain Res. 2002, 945, 97–105. [Google Scholar]
- Lingwood, B.E.; Dunster, K.R.; Healy, G.N.; Ward, L.C.; Colditz, P.B. Cerebral impedance and neurological outcome following a mild or severe hypoxic/ischemic episode in neonatal piglets. Brain Res. 2003, 969, 160–167. [Google Scholar]
- Seoane, F.; Lindecrantz, K.; Olsson, T.; Kjellmer, I.; Flisberg, A.; Bågenholm, R. Spectroscopy study of the dynamics of the transencephalic electrical impedance in the perinatal brain during hypoxia. Physiol. Meas. 2005, 26, 849–863. [Google Scholar]
- Bodo, M.; Pearce, F.J.; Armonda, R.A. Cerebrovascular reactivity: Rat studies in rheoencephalography. Physiol. Meas. 2004, 25, 1371–1384. [Google Scholar]
- Bodo, M.; Pearce, F.J.; Baranyi, L.; Armonda, R.A. Changes in the intracranial rheoencephalogram at lower limit of cerebral blood flow autoregulation. Physiol. Meas. 2005, 26, 1–17. [Google Scholar]
- Bodo, M.; Pearce, F.J.; Montgomery, L.D.; Rosenthal, M.; Kubinyi, G.; Thuroczy, G.; Braisted, J.; Forcino, D.; Morrissette, C.; Nagy, I. Measurement of brain electrical impedance: Animal studies in rheoencephalography. Aviat. Space Environ. Med. 2003, 74, 506–511. [Google Scholar]
- Bonmassar, G.; Iwaki, S. The Shape of Electrical Impedance Spectroscopy (EIS) is Altered in Stroke Patients. Proceedings of 26th Annual International Conference of the IEEE Engineering in Medicine and Biology Society (IEMBS 2004), San Francisco, CA, USA, 1–5 September, 2004; pp. 3443–3446.
- Liu, L.X.; Dong, W.; Ji, X.; Chen, L.; Chen, L.; He, W.; Jia, J. A new method of noninvasive brain-edema monitoring in stroke: Cerebral electrical impedance measurement. Neurol. Res. 2006, 28, 31–37. [Google Scholar]
- Liu, L.X.; Dong, W.W.; Wang, J.; Wu, Q.; He, W.; Jia, Y.J. The role of noninvasive monitoring of cerebral electrical impedance in stroke. Acta Neurochirur. Suppl. 2005, 95, 137–140. [Google Scholar]
- Go, A.S.; Mozaffarian, D.; Roger, V.L.; Benjamin, E.J.; Berry, J.D.; Borden, W.B.; Bravata, D.M.; Dai, S.; Ford, E.S.; Fox, C.S.; et al. Heart disease and stroke statistics—2013 update: A report from the American Heart Association. Circulation 2013, 127, e6–e245. [Google Scholar]
- Bonmassar, G.; Iwaki, S.; Goldmakher, G.; Angelone, L.M.; Belliveau, J.W.; Lev, M.H. On the measurement of Electrical Impedance Spectroscopy (EIS) of the human head. Int. J. Bioelectromagn. 2010, 12, 32–46. [Google Scholar]
- Atefi, S.R.; Seoane, F.; Lindecrantz, K. Electrical Bioimpedance Cerebral Monitoring. Preliminary Results from Measurements on Stroke Patients. Proceedings of 2012 34th Annual International Conference of the IEEE Engineering in Medicine and Biology Society (EMBC), San Diego, CA, USA, 28 August–1 September 2012; pp. 126–129.
- Gonzalez, C.A.; Valencia, J.A.; Mora, A.; Gonzalez, F.; Velasco, B.; Porras, M.A.; Salgado, J.; Polo, S.M.; Hevia-Montiel, N.; Cordero, S. Volumetric electromagnetic phase-shift spectroscopy of brain edema and hematoma. PLoS One 2013, 8, e63223. [Google Scholar]
- Xu, C.; Dai, M.; You, F.; Shi, X.; Fu, F.; Liu, R.; Dong, X. An optimized strategy for real-time hemorrhage monitoring with electrical impedance tomography. Physiol. Meas. 2011, 32, 585–598. [Google Scholar]
- Shi, X.; You, F.; Fu, F.; Liu, R.; You, Y.; Dai, M.; Dong, X. Preliminary Research on Monitoring of Cerebral Ischemia Using Electrical Impedance Tomography Technique. Proceedings of 30th Annual International Conference of the IEEE Engineering in Medicine and Biology Society, Vancouver, BC, Canada, 21–24 August 2008; pp. 1188–1191.
- Cole, K.S. Permeability and impermeability of cell membranes for ions. Quant. Biol. 1940, 8, 110–122. [Google Scholar]
- Laufer, S.; Rubinsky, B. Tissue characterization with an electrical spectroscopy SVM classifier. IEEE Trans. Biomed. Eng. 2009, 56, 525–528. [Google Scholar]
- Shini, M.A.; Laufer, S.; Rubinsky, B. SVM for prostate cancer using electrical impedance measurements. Physiol. Meas. 2011, 32, 1373–1387. [Google Scholar]
- Podgorelec, V.; Kokol, P.; Stiglic, B.; Rozman, I. Decision trees: An overview and their use in medicine. J. Med. Syst. 2002, 26, 445–463. [Google Scholar]
- Schwan, H.P.; Ferris, C.D. Four‐electrode null techniques for impedance measurement with high resolution. Rev. Sci. Instrum. 1968, 39, 481–485. [Google Scholar]
- Kun, S.; Ristic, B.; Peura, R.A.; Dunn, R.M. Algorithm for tissue ischemia estimation based on electrical impedance spectroscopy. IEEE Trans. Biomed. Eng. 2003, 50, 1352–1359. [Google Scholar]
- Atefi, S.R.; Buendia, R.; Lindecrantz, K.; Seoane, F. Cole Function and Conductance-Based Parasitic Capacitance Compensation for Cerebral Electrical Bioimpedance Measurements. Proceedings of 34th Annual International Conference of the IEEE Engineering in Medicine and Biology Society, San Diego, CA, USA; 2012; pp. 3368–3371. [Google Scholar]
- Scharfetter, H.; Hartinger, P.; Hinghofer-Szalkay, H.; Hutten, H. A model of artefacts produced by stray capacitance during whole body or segmental bioimpedance spectroscopy. Physiol. Meas. 1998, 19, 247–261. [Google Scholar]
- Ayllon, D.; Seoane, F.; Gil-Pita, R. Cole Equation and Parameter Estimation from Electrical Bioimpedance Spectroscopy Measurements—A Comparative Study. Proceedings of 31st Annual International Conference of the IEEE Engineering in Medicine and Biology Society, Minneapolis, MN, USA, 3–6 September 2009; pp. 3779–3782.
- Seoane, F.; Buendia, R.; Gil-Pita, R. Cole Parameter Estimation from Electrical Bioconductance Spectroscopy Measurements. Proceedings of 32nd Annual International Conference of the IEEE Engineering in Medicine and Biology Society, Buenos Aires, Argentina, 1–4 September 2010; pp. 3495–3498.
- Seoane, F.; Lindecrantz, K. Extraction of Structural Information from Impedance Spectrum Data. A Step Towards the Identification of Cellular Oedema. Proceedings of the 18th EURASIP Biosignal Conference Analysis of Biomedical Signals and Images, Brno, Czech Republic, 28–30 June 2006; pp. 90–93.
- Lewis, R.J. An Introduction to Classification and Regression Tree (CART) Analysis. Proceedings of Annual Meeting of the Society for Academic Emergency Medicine, San Francisco, CA, USA, 22–25 May 2000; pp. 1–14.
- Refaeilzadeh, P.; Tang, L.; Liu, H. Cross-Validation. In Encyclopedia of Database Systems; Liu, L., ÖZsu, M.T., Eds.; Springer: Tempe, AZ, USA, 2009; pp. 532–538. [Google Scholar]
- Kun, S.; Peura, R.A.; Ristic, B. Impedance Spectroscopy System for Ischemia Monitoring and Detection. U.S. Patent 5807272, 15 September 1998.


| MLL | MCL | MCR | MLR | |
|---|---|---|---|---|
| I+ | Fp1 | Fp1 | Fp2 | Fp2 |
| V+ | F7 | F3 | F4 | F8 |
| V− | T5 | P3 | P4 | T6 |
| I− | O1 | O1 | O2 | O2 |
| Patient Number | Location | Size |
|---|---|---|
| i | Putamen | 6 × 3 cm |
| ii | Temporal Lobe | 8.5 × 5.2 cm |
| iii | Tempoparietal Junction | 4 × 4 cm |
| Feature 1 | Feature 2 | Feature 3 |
|---|---|---|
© 2013 by the authors; licensee MDPI, Basel, Switzerland. This article is an open access article distributed under the terms and conditions of the Creative Commons Attribution license (http://creativecommons.org/licenses/by/3.0/).
Share and Cite
Atefi, S.R.; Seoane, F.; Thorlin, T.; Lindecrantz, K. Stroke Damage Detection Using Classification Trees on Electrical Bioimpedance Cerebral Spectroscopy Measurements. Sensors 2013, 13, 10074-10086. https://doi.org/10.3390/s130810074
Atefi SR, Seoane F, Thorlin T, Lindecrantz K. Stroke Damage Detection Using Classification Trees on Electrical Bioimpedance Cerebral Spectroscopy Measurements. Sensors. 2013; 13(8):10074-10086. https://doi.org/10.3390/s130810074
Chicago/Turabian StyleAtefi, Seyed Reza, Fernando Seoane, Thorleif Thorlin, and Kaj Lindecrantz. 2013. "Stroke Damage Detection Using Classification Trees on Electrical Bioimpedance Cerebral Spectroscopy Measurements" Sensors 13, no. 8: 10074-10086. https://doi.org/10.3390/s130810074
APA StyleAtefi, S. R., Seoane, F., Thorlin, T., & Lindecrantz, K. (2013). Stroke Damage Detection Using Classification Trees on Electrical Bioimpedance Cerebral Spectroscopy Measurements. Sensors, 13(8), 10074-10086. https://doi.org/10.3390/s130810074