Communication

Laser Photoacoustic Detection of CO2 in Old Disc Tree-Rings

Institute of Atmospheric Optics of Siberian Branch of the Russian Academy of Sciences, Academician Zuev Square, 1. Tomsk, 634055, Russia
*
Author to whom correspondence should be addressed.
Sensors 2010, 10(4), 3305-3313; https://doi.org/10.3390/s100403305
Submission received: 29 December 2009 / Revised: 16 February 2010 / Accepted: 6 March 2010 / Published: 4 April 2010
(This article belongs to the Special Issue Laser Spectroscopy and Sensing)

Abstract

:
A homemade CO2–laser photoacoustic spectrometer has been used for monitoring CO2 in gas samples extracted under vacuum from the wood of old spruce disc tree-rings for a ∼60 year series. The experimental results show that (1) the CO2 concentration exhibits annual trends correlated with an increase in atmospheric CO2 in a number of cases; (2) at the time when the annual CO2 trend changes from positive to negative, the annual tree-ring stable carbon isotope ratios (δ13C) of CO2 change as well; (3) the disc tree-ring widths are observed to decrease in most cases where the annual CO2 increased; (4) simultaneously with the annual CO2 variation, annual H2O distribution was detected in gas samples of the wood tree-rings of one spruce disc. The observed patterns of the annual CO2 distribution in the disc tree-rings are assumed to be the evidence of the impact of the atmospheric CO2 increase. In other words, a change in the concentration gradient between the stem and the atmospheric CO2 may lead to a gradual CO2 accumulation in the stem because of a decrease in the diffusion rate and to a change in the tree parameters.
Classification:
PACS: 42.62.Fi

1. Introduction

It is recognized that due to a high CO2 concentration in the stem of a living tree [1], an increase in the atmospheric CO2 produce minor changes in the concentration gradient between the atmospheric and stem CO2. Thus an increase in the atmospheric CO2 does not significantly affect the diffusion of CO2 from the tree stem into the atmosphere. However, an annual change in the concentration gradient due to the increase in the atmospheric CO2 does exist (and will exist in the future) and we believe that the dynamics of this process must be evident in the CO2 concentration trend in the stem. We have hypothesized [2] that the wood of tree-rings of old tree discs where a large amount of CO2 has been preserved [3] may contain this information, since gases involved in metabolism of a living tree in each of the years studied are sorbed by a capillary-porous system of the ring wood and may be preserved for a long time within stems. In this work, we report the results of a laser photoacoustic gas analysis of CO2 present in gas samples extracted under vacuum from annual rings of 5 spruce discs for a ∼60 year series, as well as results of correlation analysis of data versus the concentration of atmospheric CO2. Nowadays photoacoustic spectrometers based on different lasers are unique tools for gas testing [47], medical diagnostic by breath [8,9], etc.

2. Experimental Section

The concentration of CO2 (extracted under vacuum) in the wood of tree-rings was measured on 5 spruce discs, collected 30 km away from Tomsk in 2004. The mean radius and height of the trees were ∼26 cm and ∼23 m, respectively, and the number of rings was ∼85. All discs were stored under laboratory conditions until 2009, so the wood can be considered to be room-dried. The measurements were made using a homemade laser photoacoustic spectrometer with a computer-controlled tunable waveguide CO2–laser [10]. The detection limit of the spectrometer for a laser power of 70 mW was 2 × 10⁻⁵ cm−1 and the measurement error was ±5%. Before the measurements, the system was calibrated using a CO2/N2 reference mixture. A maximum sensitivity of the photoacoustic detector was achieved for a total pressure of 100 Torr. All measurements were performed at this pressure. To prepare the samples for the analysis, the wood of 4 rings was planed down using special chisels. Then the samples were weighted (3–20 g) and placed in 4 sealed exposure chambers. The latter were evacuated down to a vacuum of ∼0.1 Torr for 1 min for gas diffusion stimulation. Because the larger the sample amount, the higher the gas pressure P(total) and P(CO2), it follows that P (CO2): P (total) [ppm] = const, irrespective of the sample weight. Then the exposure chambers were allowed to stay for 40 min to ensure a maximum yield of gases sorbed by the wood. Next, an exposure chamber was connected to the evacuated photoacoustic detector so that the gas samples enter the detector and air was admitted to get a total pressure of 100 Torr. We have analyzed each ring gas sample at the same pressure (∼6 Torr) and in the same volume (photoacoustic detector). The signal amplitudes Um from the analyzed gas sample (100 + 6 Torr) and from air Ua (at 100 Torr) were recorded, and the difference ΔU = UmUa was determined automatically. Using a calibration curve, we determined a relative CO2 content in the gas sample for each of 4 rings of the disc. Then, the wood of the next 4 rings was examined on CO2 and so on. The absorption by the gas samples in a detector of laser radiation at 3 laser lines 10P (20, 16, 14) was found to be approximately equal. For our purposes, use was made of an average value of absorption. The CO2 measurements were made at laser lines that did not coincide with water lines at a gas sample pressure of 6–8 Torr. The absorption coefficients of H2O in the P10 (20, 16, 14) laser lines calculated by the line-by-line method [11] with spectroscopic database HITRAN 2008 [12] were 102–103 times lower than the CO2 absorption coefficient (at 1 atm). We believe that these measurements refer mostly to CO2 in these lines, the water contribution is negligible small. The presence of water in the gas samples was detected from the signal in the CO2 laser line 10R (20) whose frequency coincided with the H2O absorption line center.
H2O detection experiments were carried out using a classical drying method [13]: milled wood of the rings was placed into weighting bottles and that were allowed to stay in a thermostat 100–103 °C for two days and the difference in weights was then determined.
The tree-ring stable carbon isotope ratio (δ13C) of CO2 chemically extracted from the wood rings was analyzed by an automated measuring MI-1201V Mass Spectrometer and DELTA V Advantage. The samples were prepared using standard certified methods of chemical preparation of organic substances. The results were reduced to the PDB international standard of Vienna Pee Dee belemnite for C.

3. Results and Discussion

In our earlier work [2], the annual CO2 distribution in the wood of tree-rings of old fir tree discs was reported for a 25-year series. It was found that in most cases, the CO2 content in gas samples extracted under vacuum from the annual rings of the discs was higher than the atmospheric CO2. Moreover, an annual trend of the CO2 concentration exists and in some cases, it correlates with atmospheric CO2 (and O3 [14]).
Measurements of CO2 extracted under vacuum from the wood of the tree rings of 5 spruce discs were performed for a ∼60 year series (1940–2004) using the homemade laser photoacoustic spectrometer.

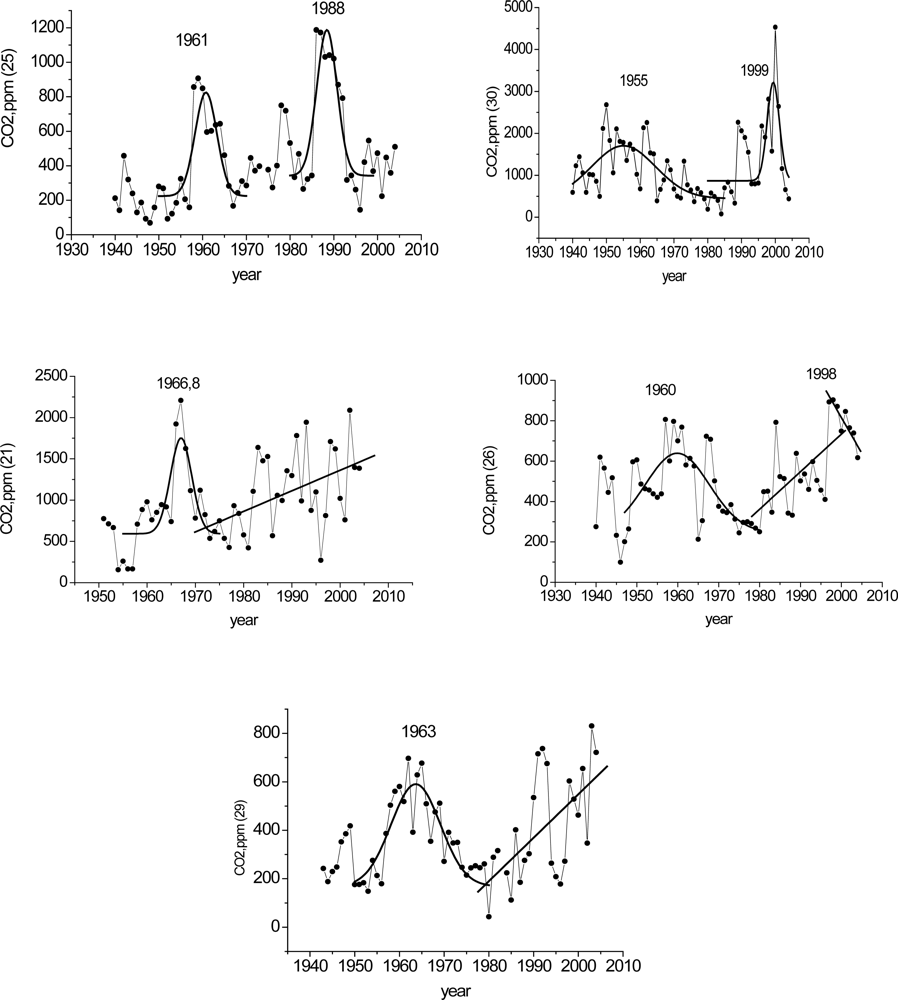
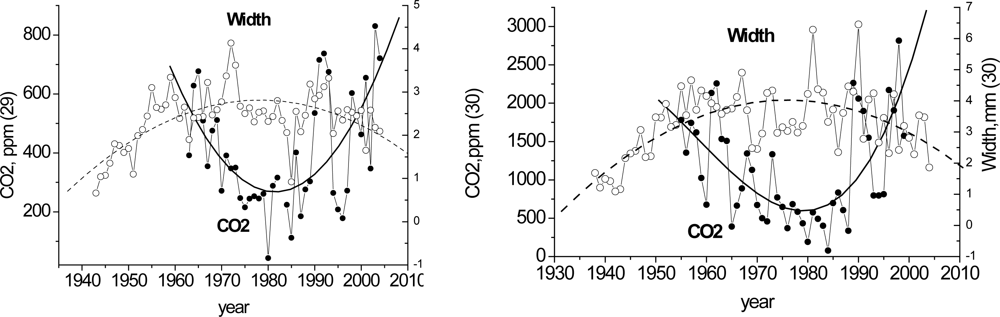
3.1. Correlation between Tree-Rings and Atmospheric CO2

The measurements of the CO2 content in the wood of the rings of 5 spruce discs revealed certain characteristic features: in all discs the first CO2 concentration maximum in the tree-rings was roughly dated to the 1960s, whereas the second maximum observed in certain discs was dated to ∼1988–1999 (Figure 1). Strong CO2 fluctuations were caused by structural heterogeneity of the biological objects under study and partly by the difference in wood ring destruction during sample preparation. However, even for such a spread in the results, the tendency for the CO2 growth in the discs is well pronounced.
We compared our CO2 measurements in the tree-rings with the atmospheric CO2. To this end, all annual CO2 trends were divided into annual sections and the years where CO2 increased were compared with the those of Mauna Loa data on an increase in the atmospheric CO2 (2008, http://cdiac.ornl.gov/ftp/trends/co2/maunaloa.co2). If a linear approximation could be used for our data and those of Mauna Loa, the correlation between them was determined using Origin software package and the correlation coefficients R and P values (probability that R is zero) were estimated.
The results of the correlation are presented in Table 1. Assuming the significance level of P ≤ 0.05, we may conclude that the observed positive CO2 trend in the disc tree rings for the above indicated CO2 fluctuations correlate well with the increase in the atmospheric CO2. The change of the sign of the trend seen in the 1990s was observed by a number of investigators who carried out isotope analyses for cellulose carbon in tree rings [15,16]. The decrease in the tree-ring δ13C was explained in the following way: “Tree-ring δ13C chronologies showing a decline over recent decades, that is not explained by a parallel change in the controlling climatic variables, have been reported from several areas, including the Swiss Alps, north-eastern France. McCarroll et al. (2009) suggest that this is threshold effect, with trees having reached the limits of physiological adaptation to increasing CO2 levels in the atmosphere” [17]. Conceivably, the change of the sign of the trend in the annual CO2 distribution (maximum) in the disc and cellulose carbon is due to general metabolic processes. We recorded another maximum as early as the 1960s. It is evident in Figure 1 that, for certain discs, the annual CO2 growth in the 1990s did not reach a maximum, probably due to tree growth conditions.

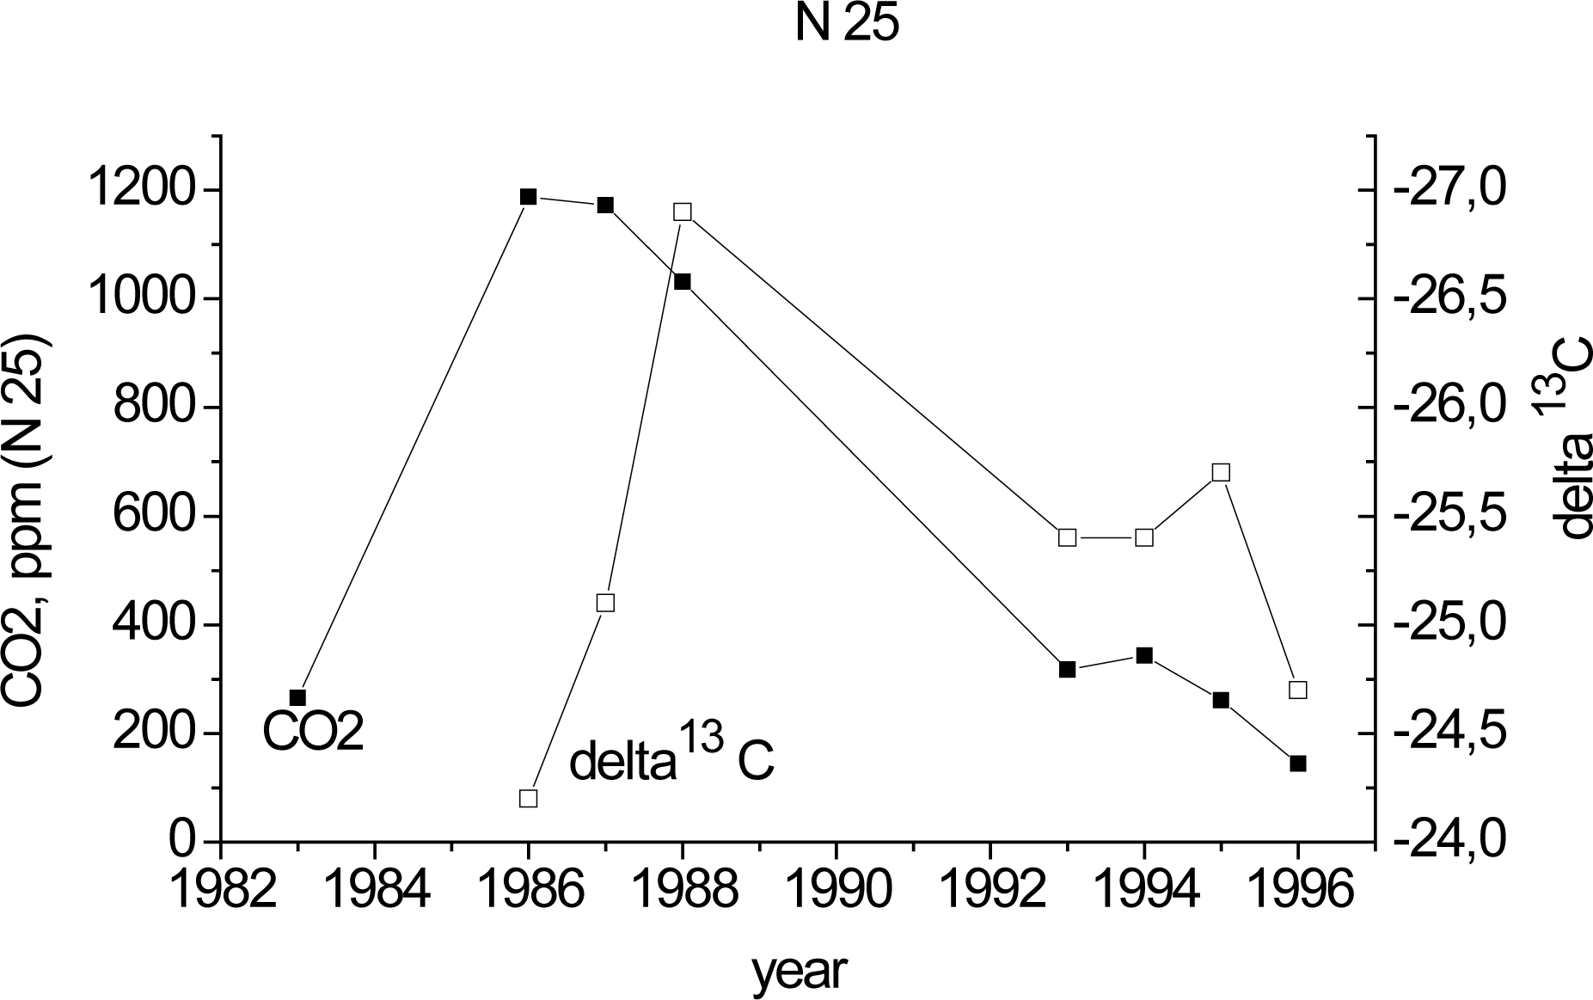
3.2. The Sign of the CO2 Trend Associated with a Change in Metabolic Processes

According to our earlier assumption [18], the change of the sign of the trend (i.e., a decrease in the CO2 concentration in the discs after its increase) is attributable to any change in metabolic processes. This assumption can be verified by analyzing the tree-ring stable carbon isotope ratios of CO213C). It is known that terrestrial plants (C3 type, including conifers) are characterized by a range of isotope compositions (δ 13C) from approximately −22‰ to −32‰, while the isotope composition of the atmosphere is on average −7‰ [19]. The results obtained from an investigation of (δ 13C) in the time period where the disc CO2 (spruce 25) changes the sign are illustrated in Figure 2. It is obvious that CO2 was formed by the tree itself. Stable carbon isotope ratios (δ 13C) of CO2 changed as well, along with the annual CO2 variations in the tree-rings.
We compared our annual CO2 distribution over spruce disc tree-rings with the ring widths. In most cases, the annual ring width narrows with increase in the annual CO2 (Figure 3).

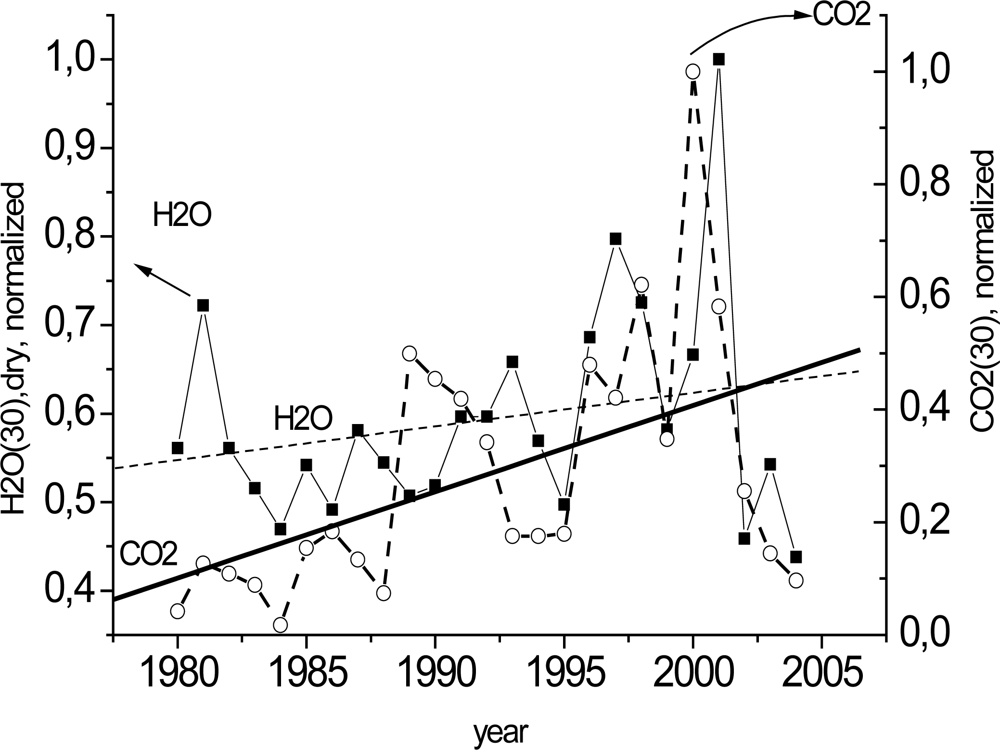
3.3. Presence of CO2 in Tree-Ring Water

Early in the experiment, it was assumed that CO2 was sorbed only by the wood capillary-porous system. The results showed that tree-ring gas samples contained not only CO2 but H2O as well. Figure 4 illustrates the annual CO2 distribution (normalized to unity) measured by the photoacoustic method and the annual H2O distribution measured by the classical drying method in the tree-rings (disc 30). As seen from Figure 4, CO2 and H2O demonstrate nearly identical trends. This leads us to suggest that CO2 also exists in water solution. There are many papers concerning the moisture content in wood (see, e.g., [20,21]), but none of them considers annual H2O distribution in old disc tree-rings.

4. Conclusions

It is generally accepted that a long stay of tree discs under atmospheric conditions makes the stem-contained excess CO2 to decrease down to the atmospheric CO2 level due to diffusion processes. However, the results of our measurements of the CO2 extracted under the vacuum from the wood of tree-rings of old discs by the photoacoustic method have shown that (1) in most cases, the relative CO2 content in gas samples exceeds the atmospheric CO2 concentration; (2) certain annual trends of the CO2 concentration are observed; (3) the trend of the annual CO2 concentration in the rings of spruce discs changes the sign (from positive to negative) and the tree-ring stable carbon isotope ratios (δ 13C) change as well; and (4) in the time period where the CO2 concentration in the wood of tree-rings increases, the ring widths change (they are generally narrowed).
It is our opinion, that the observed CO2 trends are associated with the increase in the atmospheric CO2 content: the permanent growth of the atmospheric CO2 always decreases the CO2 diffusion rate from the stem, thus resulting in CO2 accumulation and, probably, in a change of certain internal metabolic processes. It is impossible to detect such a trend in a living tree, whereas the analysis of the wood sorbed gas can reveal its existence. We can also assume that the increased sorbed CO2 concentration in the tree-rings may be attributed to the ring narrowing, which conceivably explains why the trees do not show large radial increment when the temperature and atmospheric CO2 increase. The results obtained show that old discs contain valuable information that can be used for estimating the carbon budget in forests.

Acknowledgments

We strongly acknowledge the help of our anonymous referees for precious insights on our paper.
We would like to thank D.A. Savchuk for providing discs and measuring the ring widths; we give special thanks to A.P. Zotikova for assistance in experiments with H2O (Institute of Monitoring of Climatic and Ecological Systems SB RAS, Tomsk), and to the staff of Laboratory of Isotope Organic Geochemistry (Tomsk Department of Federal State Unitary Enterprise “Siberian Research Institute of Geology, Geophysics, and Mineral Resources”) for performing an isotope analysis.

References and Notes

  1. Teskey, R.O.; Saveyn, A.; Steppe, K.; McGuire, M.A. Origin, fate and significance of CO2 in tree stems. New Phytol 2008, 177, 17–32. [Google Scholar]
  2. Ageev, B.G.; Ponomarev, Yu, N.; Sapozhnikova, V.A. Photoacoustic analysis of CO2 content in annual tree rings. J. Appl. Spectrosc 2009, 3, 452–455. [Google Scholar]
  3. Ageev, B.G.; Nesvetailo, V.D.; Ponomarev, Yu, N.; Sapozhnikova, V.A. Dendrochronoindication Using Gas Analysis. Sib. J. Ecol 2005, 1, 61–65. [Google Scholar]
  4. Yun, Y.; Chen, W.; Wang, Y.; Pan, C. Photoacoustic detection of dissolved gases in transformer oil. Eur. Trans. Electr. Power 2008, 18, 562–576. [Google Scholar]
  5. Sigrist, M.W. Trace gas monitoring by laser photoacoustic spectroscopy and related techniques. Rev. Sci. Instr 2003, 1, 486–490. [Google Scholar]
  6. Schramm, D.U; Sthel, M.S.; da Silva, M.G.; Carneiro, L.O.; Junior, A.J.S.; Souza, A.P.; Vargas, H. Application of laser photoacoustic spectroscopy for the analysis of gas samples emitted by diesel engines. Infrared Phys. Technol 2003, 44, 263–269. [Google Scholar]
  7. Koskinen, V.; Fonsen, J.; Kauppinen, J.; Kauppinen, I. Extremely sensitive trace gas analysis with modern photoacoustic spectroscopy. Vib. Spectrosc 2006, 42, 239–242. [Google Scholar]
  8. McCurdy, M.R.; Bakhirkin, Yu.; Wysocki, G.; Lewicki, R.; Tittel, F.K. Recent advances of laser-spectroscopy-based techniques for applications in breath analysis. J. Breath Res 2007, 1. [Google Scholar] [CrossRef]
  9. Wang, C.; Sahay, P. Breath analysis using laser spectroscopic techniques: breath biomarkers, spectral fingerprints, and detection limits. Sensors 2009, 9, 8230–8262. [Google Scholar] [CrossRef]
  10. Sherstov, I.V.; Bychkov, K.V.; Vasiliev, V.A.; Karapuzikov, A.I.; Spitsin, V.V.; Chernikov, S.B. Twochannel CO2 laser system for heterodyne lidar. Atmos. Ocean. Opt 2005, 3, 270–276. [Google Scholar]
  11. Mitsel, A.A.; Ptashnik, I.V.; Firsov, K.M.; Fomin, B.A. Efficient technique for line-by-line calculating the transmittance of the absorbing atmosphere. Atmos. Ocean. Opt 1995, 8, 847–850. [Google Scholar]
  12. Rothman, L.S.; Gordon, I.E.; Barbe, A.; Benner, D.C.; Bernath, P.F.; Birk, M.; Boudon, V.; Brown, L.R.; Compargue, A.; Champion, J.-P.; Chance, K.; Coudert, L.N.; Dana, V.; Devi, V.M.; Fally, S.; Flaud, J.-M.; Gamache, R.R.; Goldman, A.; Jacquemart, D.; Kleiner, I.; Lacome, N.; Lafferty, W.J.; Mandin, J.-Y.; Massie, S.T.; Mikhailenko, S.N.; Miller, C.E.; Moazzen-Ahmadi, N.; Naumenko, O.V.; Nikitin, A.V.; Orphal, J.; Perevalov, V.I.; Perrin, A.; Predoi-Cross, A.; Rinsland, C.P.; Rotger, M.; Šimecková, M.; Smith, M.A.H.; Sung, K.; Tashkun, S.A.; Tennyson, J.; Toth, R.A.; Vandaele, A.C.; Vander Auwera, J. The HITRAN 2008 molecular spectroscopic database. J. Quant. Spectrosc. Radiat 2009, 110, 533–572. [Google Scholar]
  13. Ermakov, A.I.; Arasimovitch, V.V.; Smirnova-Ikonnikova, M.I.; Yarosh, N.P.; Lukovnikova, G.A. Methods for Biochemical studies of Plants; Kolos: Leningrad, Russia, 1972; p. 456. [Google Scholar]
  14. Zuev, V.V; Ageev, B.G.; Bondarenko, S.L.; Savchuk, D.A.; Sapozhnikova, V.A. Possibilities of use of gas composition of annual tree rings for bioindication of stratospheric ozone variations. In Bioindication of stratospheric ozone; Publishing House of the Siberian Branch of the Russian Academy of Sciences: Novosibirsk, Russia, 2006; pp. 166–176. [Google Scholar]
  15. Bettger, T. Tree rings as climate and environmental archives—stable isotope dendrological studies in Germany (Central Europe). Proceedings of Th eNew Methods in Dendroecology, Irkutsk, Russia, 10–13 September; 2007; pp. 20–21. [Google Scholar]
  16. Voronin, V.I.; Ivlev, A.A. Dendroisotopical data indicates to modern chance of the climate of the earth. In. Proceedings of Th eNew Methods in Dendroecology, Irkutsk, Russia, 10–13 September; 2007; pp. 139–143. [Google Scholar]
  17. Sidorova, O.V.; Siegwolf, R.T.W.; Saurer, M.; Shaskin, A.V.; Knorre, A.A.; Prokushkin, A.S.; Vaganov, E.A.; Kirdyanov, A.V. Do centennial tree-ring and stable isotope trends of Larix gmelinii (Rupr.) Rupr. indicate increasing water shortage in the Siberian north? Oecologia 2009, 161, 825–835. [Google Scholar]
  18. Ageev, B.G.; Ponomarev, Yu, N.; Sapozhnikova, V.A. A trend of the CO2 concentration in tree rings and the atmospheric CO2. Atmos. Ocean. Opt 2009, 1, 128–134. [Google Scholar]
  19. Galimov, E. Nature of Isotope Biological Fractionation; Nauka: Moscow, Russia, 1981; p. 247. [Google Scholar]
  20. Hartley, I.D.; Kamke, F.A.; Peemoeller, H. Cluster theory for water sorption in wood. Wood Sci. Technol 1992, 26, 83–99. [Google Scholar]
  21. Fromm, J.H.; Sautter, I.; Matthies, D.; Kremer, J.; Schumacher, P.; Ganter, C. Xylem water content and wood density in spruce and oak trees detected by high-resolution computed tomography. Plant Physiol 2001, 127, 416–425. [Google Scholar]
Figure 1. Annual trends of the CO2 concentration in spruce discs (No. 21, 25, 26, 29, 30) obtained with the use of a Gaussian approximation for identifying a maximum content.
Sensors 10 03305f1
Figure 2. Annual trend of the CO2 concentration in a spruce disc (No. 25) and δ 13C isotope composition (delta13C).
Sensors 10 03305f2
Figure 3. Annual trends of the tree-ring CO2 concentration and widths of spruce discs (No. 29, 30).
Sensors 10 03305f3
Figure 4. The tree-ring CO2 and H2O concentrations (normalized to unity) of a spruce disc (No. 30) obtained by two methods.
Sensors 10 03305f4
Table 1. Correlation between spruce disc and atmospheric CO2.
Spruce No.Total number of tree ringsTime periodCorrelation coefficients
R
Probability (that R=0)
P
N, number of measurements (data points)
21∼751970–2004+0.50.0021634
25∼901966–1993+0.661.9×10−427
26∼801975–1997
1938–1960
+0.53
+0.73
0.01
0.01
22
11
29∼80–901980–2004+0.590.0026124
30∼1501988–2000+0.693.6×10−422

