Dynamics of Invertebrate Diversity in a Tropical Stream

Abstract
:1. Introduction
2. Methods
2.1. Site Description

| Mean | s.e. | Maximum | Minimum | |
|---|---|---|---|---|
| Periphyton (0–5 scale) | 2.67 | 0.16 | 5 | 1 |
| Bryophyte (0–5 scale) | 0.70 | 0.16 | 3 | 0 |
| Discharge (m3·s−1) | 0.217 | 0.038 | 0.70 | 0 |
| Current (cm·s−1) | 27.08 | 1.72 | 100 | 0 |
| Depth (cm) | 12.17 | 0.93 | 25 | 6 |
| % CPOM | 9.50 | 1.09 | 20 | 0 |
| % FPOM | 7.19 | 0.97 | 20 | 0 |
| % Gravel, φ ≥ −2 | 9.84 | 1.95 | 50 | 0 |
| % Gravel, φ = −3 | 5.78 | 0.70 | 20 | 0 |
| % Gravel, φ = −4 | 2.97 | 0.61 | 10 | 0 |
| % Gravel, φ = −5 | 3.59 | 0.73 | 10 | 0 |
| % Cobble, φ = −6 | 10.62 | 1.56 | 30 | 0 |
| % Cobble, φ = −7 | 33.11 | 4.96 | 90 | 0 |
| % Boulder, φ = −8 | 26.87 | 5.12 | 85 | 0 |
| Mean substratum (φ) | −5.33 | 0.11 | −8 | −1 |
| Temperature (°C) | 18.93 | 2.46 | 25.1 | 10.5 |
| Conductivity (µS/cm) | 48.13 | 5.11 | 70.1 | 33.4 |
| DO (% saturation) | 80.50 | 2.02 | 85.1 | 77.5 |
| pH | 6.53 | 0.14 | 6.9 | 5.9 |
| Total N (µg·L−1) | 121.1 | 47.6 | 229 | 48.7 |
| Nitrate N (µg·L−1) | 17.6 | 3.28 | 25 | 12.5 |
| Total P (µg·L−1) | 3.57 | 1.10 | 6.1 | 2.2 |
| Phosphate P (µg·L−1) | 2.31 | 0.95 | 4.5 | 1.03 |
| Sodium (mg·L−1) | 6.91 | 0.62 | 8.33 | 5.02 |
| Potassium (mg·L−1) | 1.01 | 0.07 | 1.16 | 0.9 |
| Calcium (mg·L−1) | 0.78 | 0.27 | 1.38 | 0.36 |
| Magnesium (mg·L−1) | 0.76 | 0.33 | 1.53 | 0.35 |
2.2. Sampling
2.3. Data Analysis
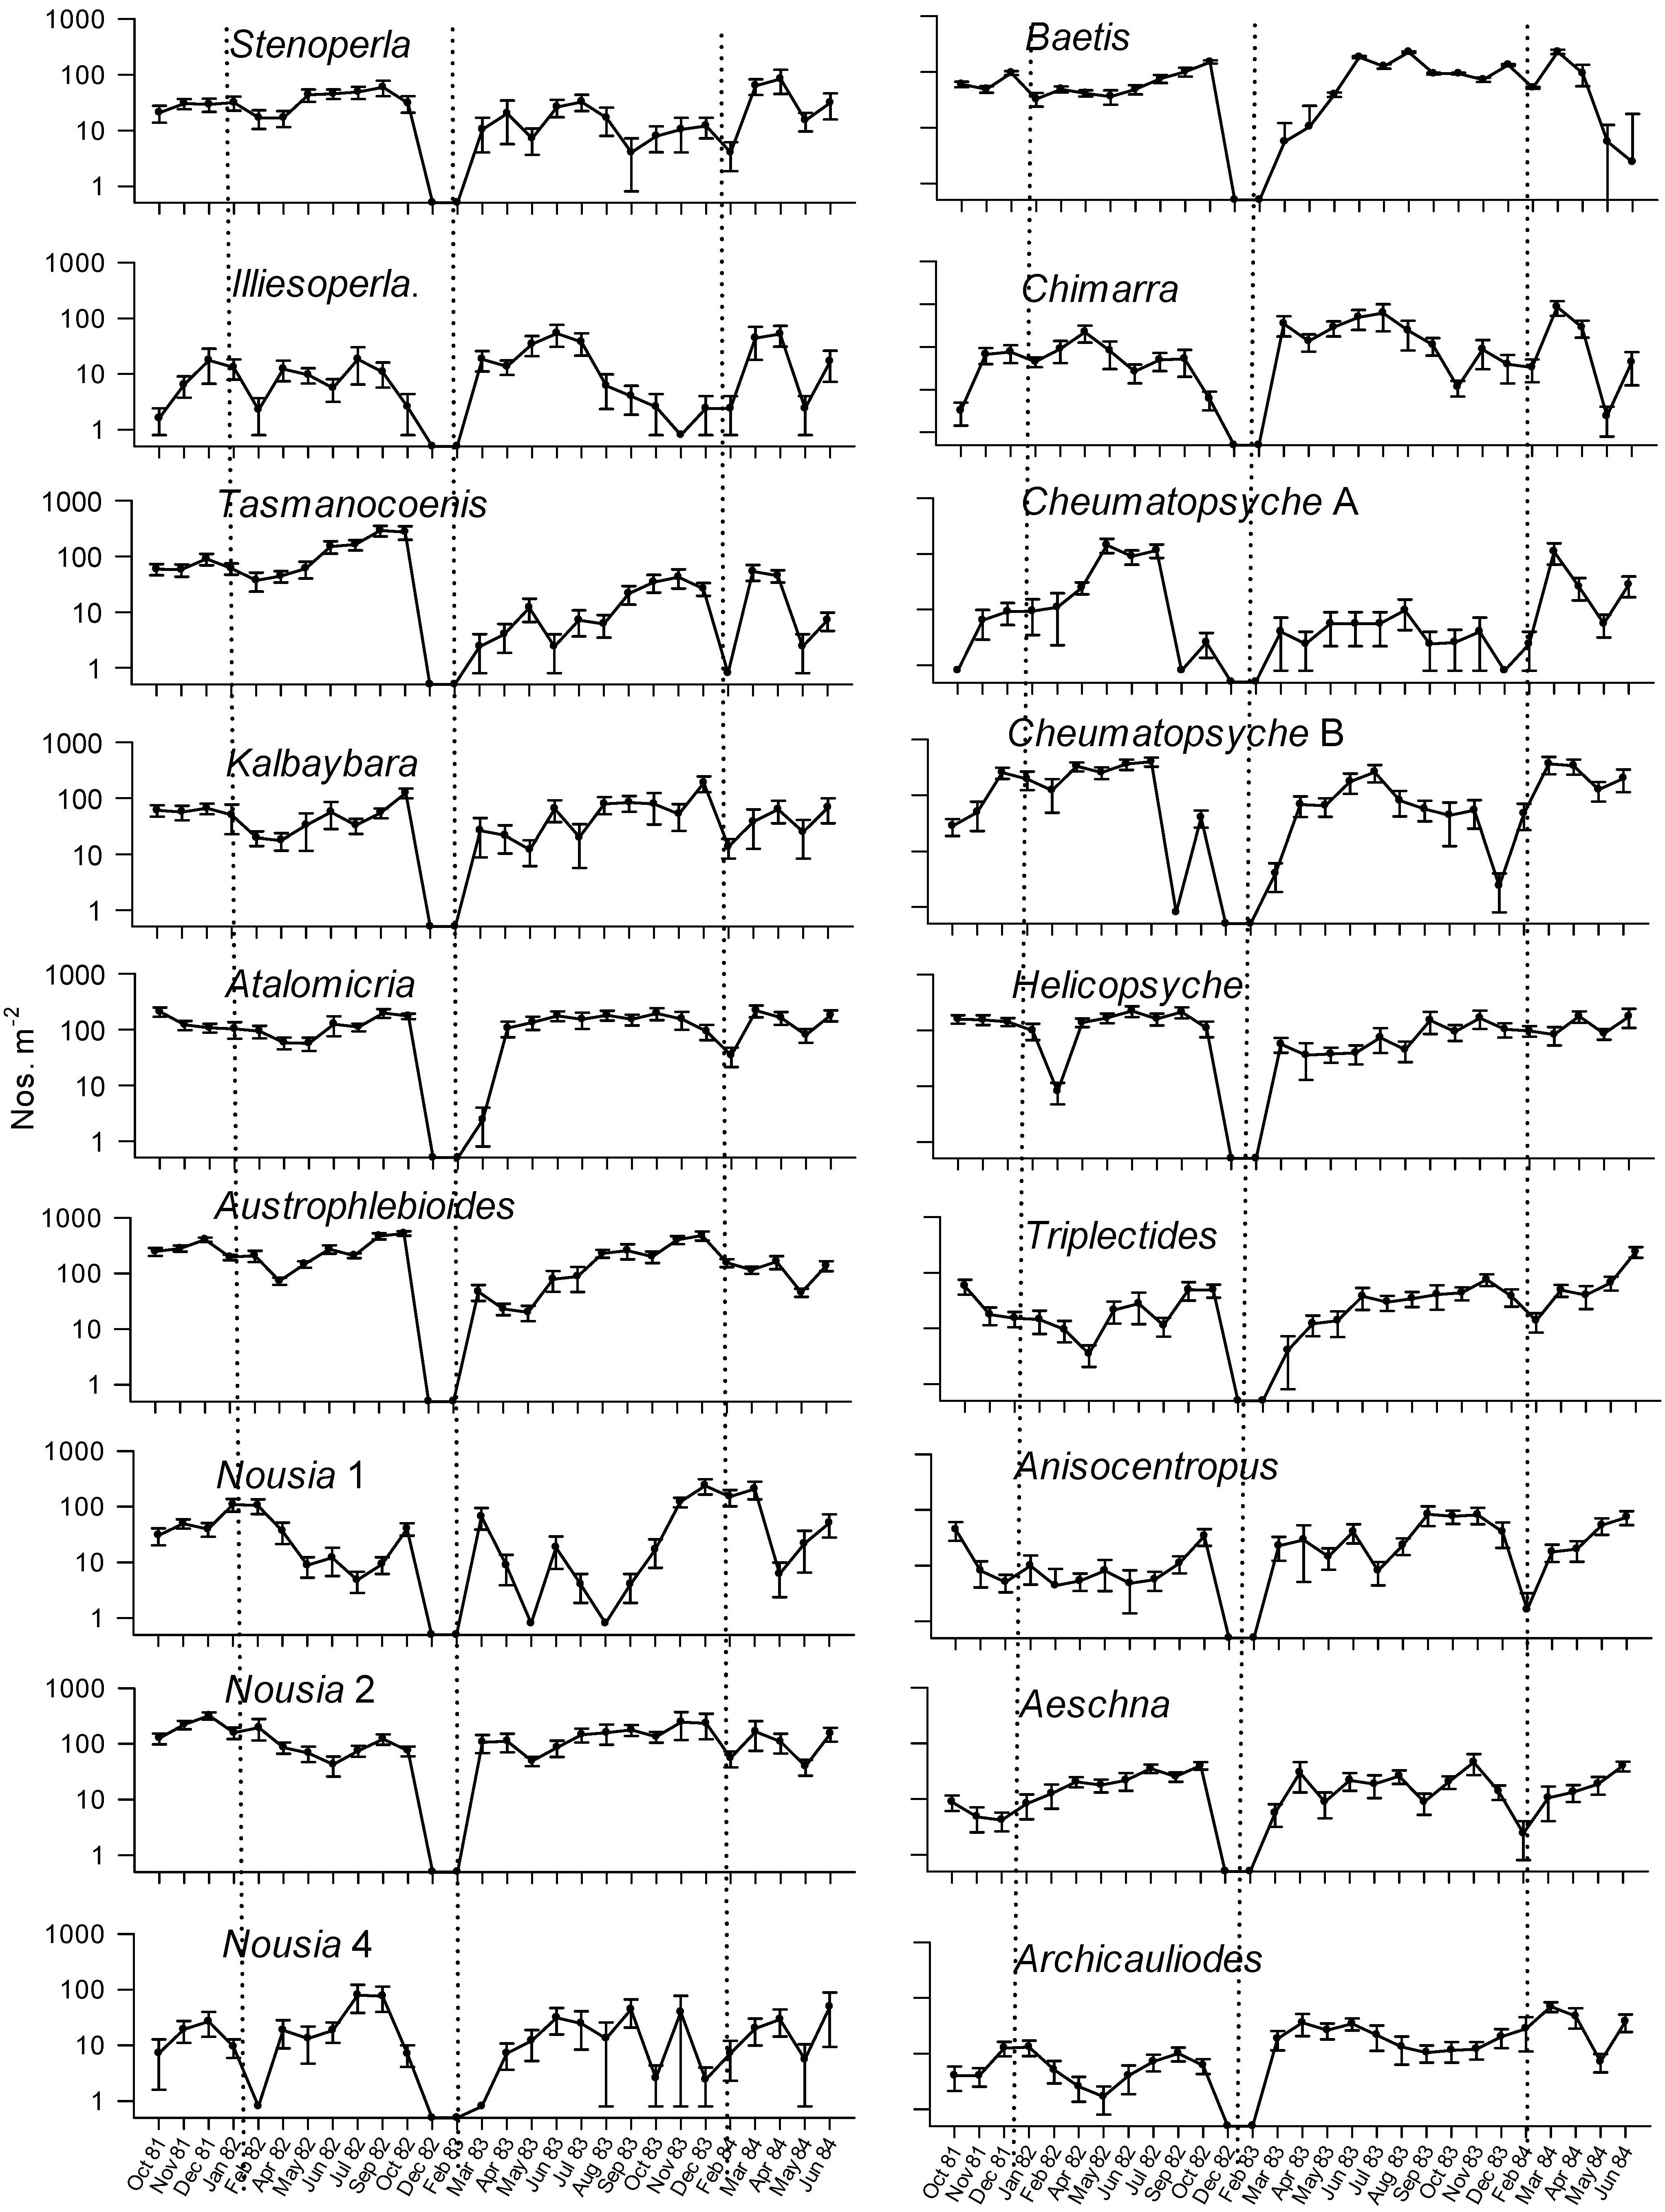
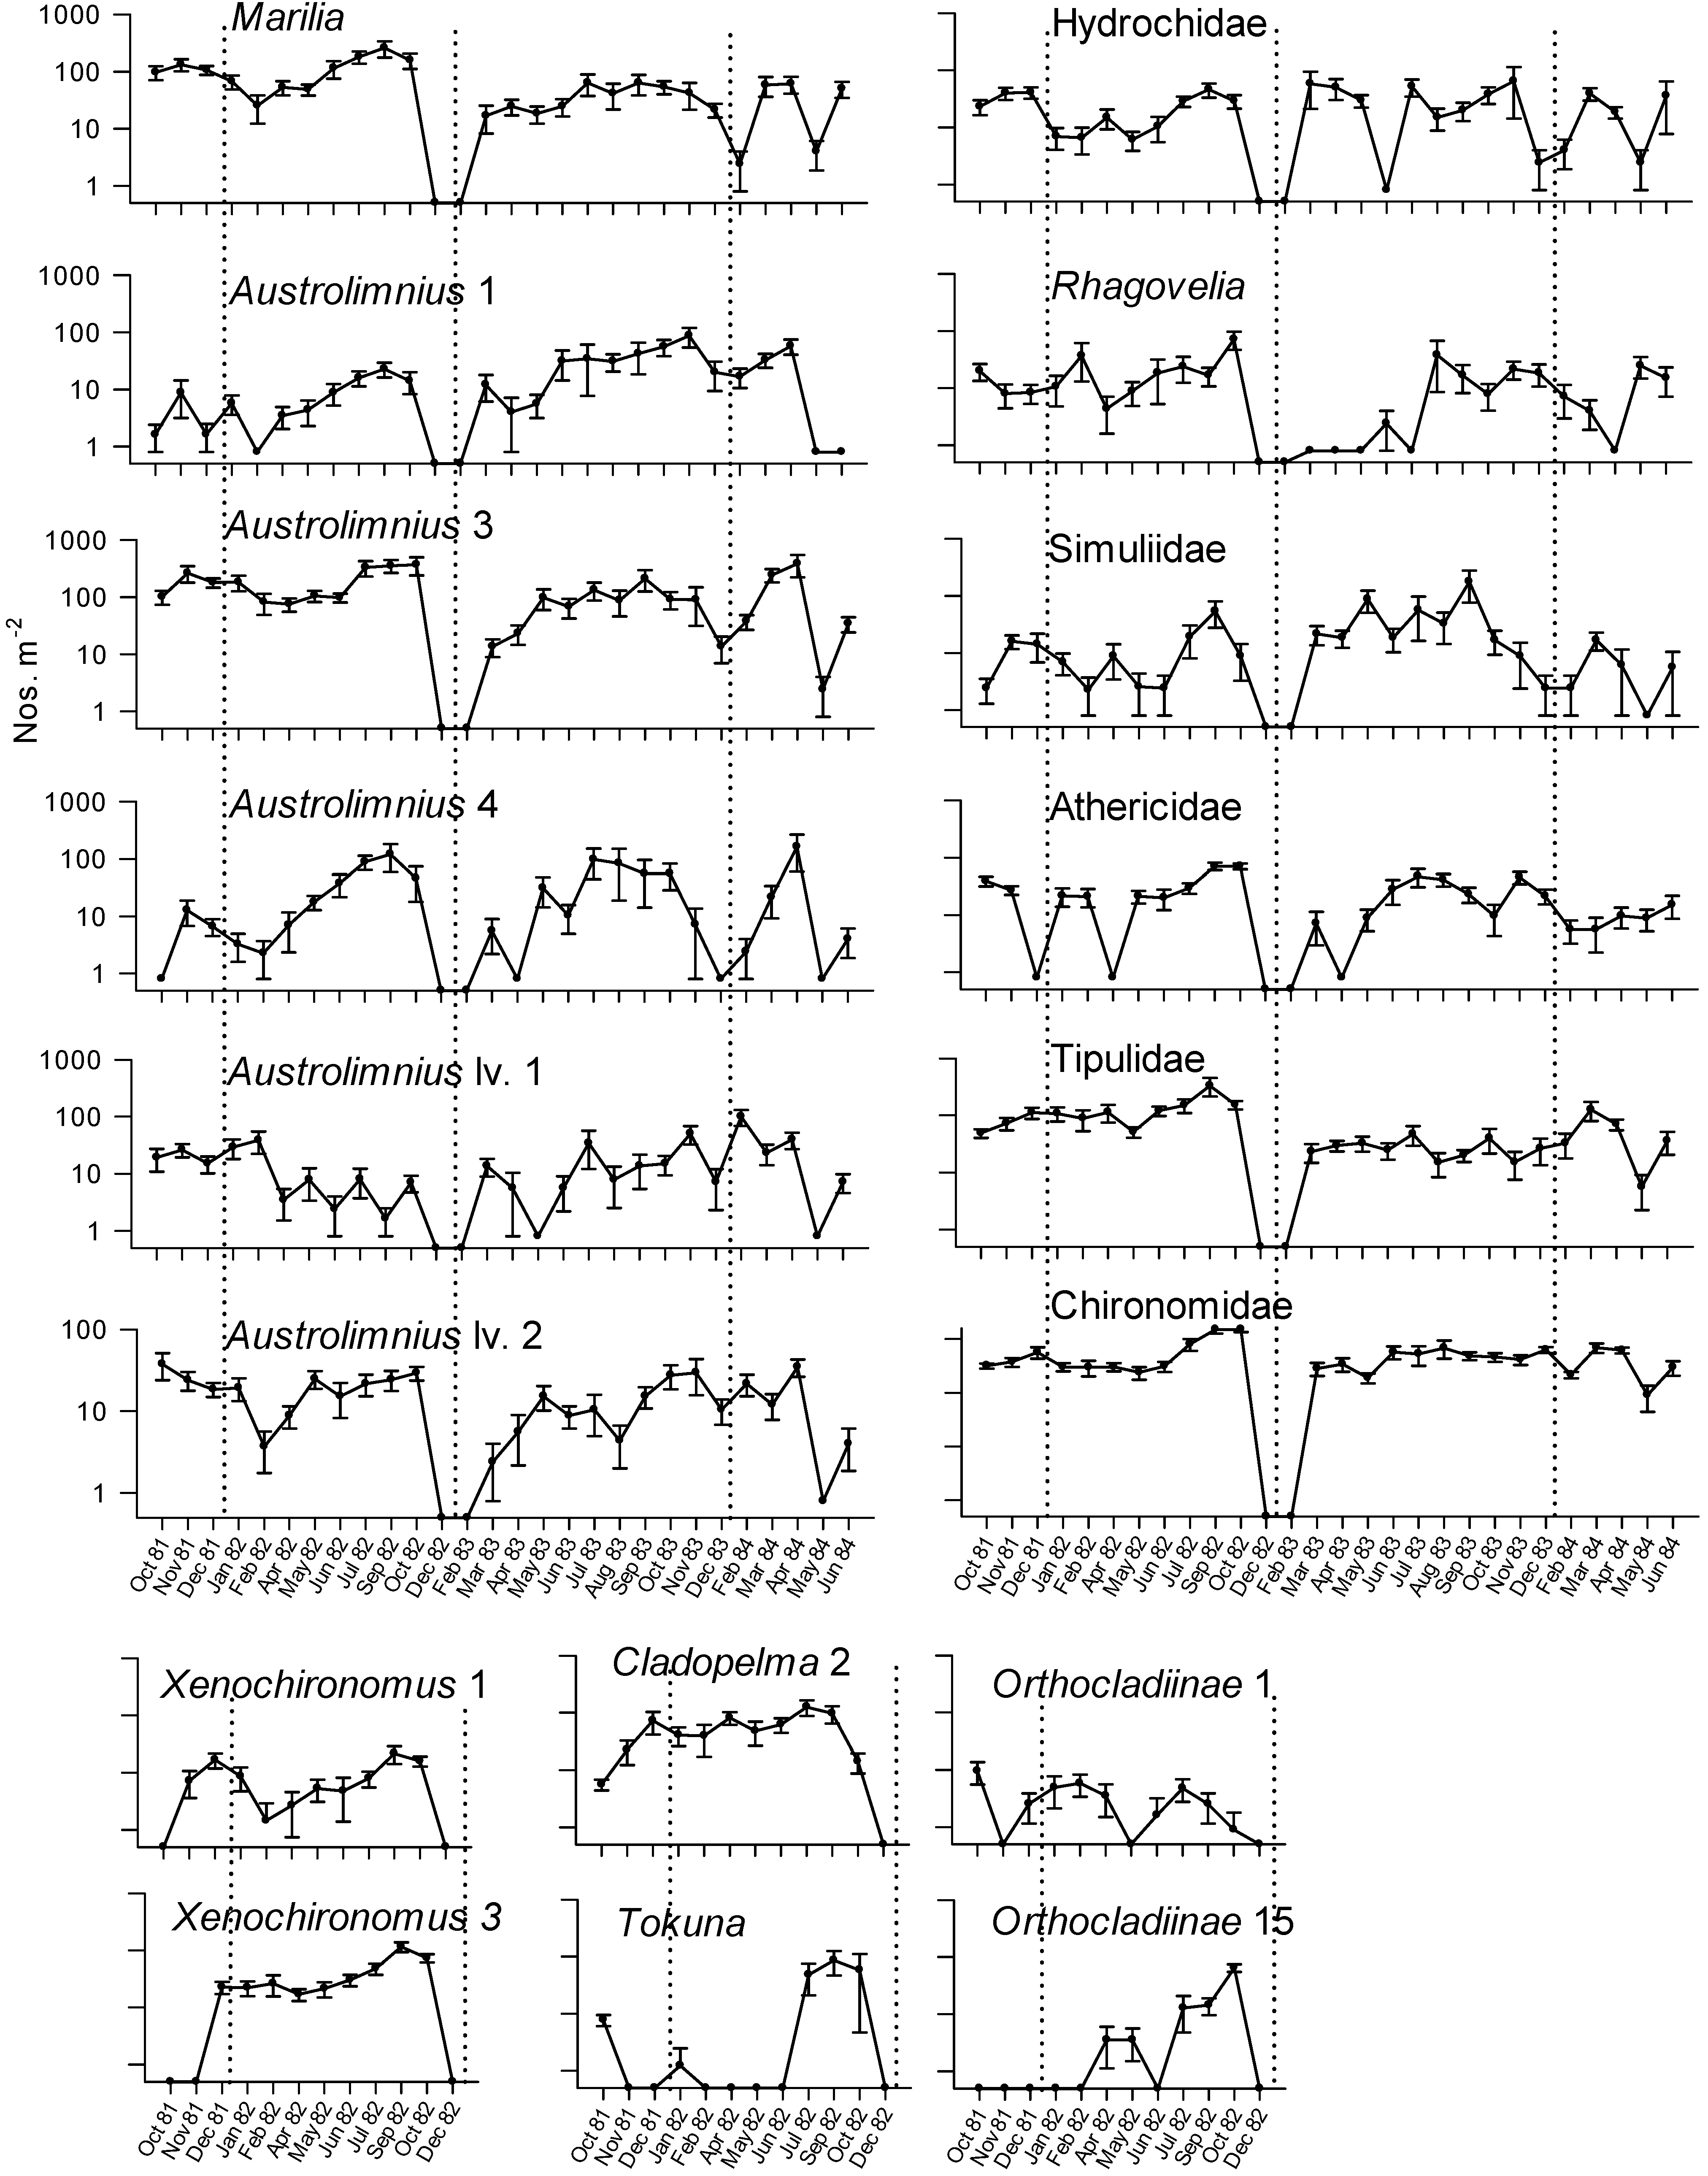
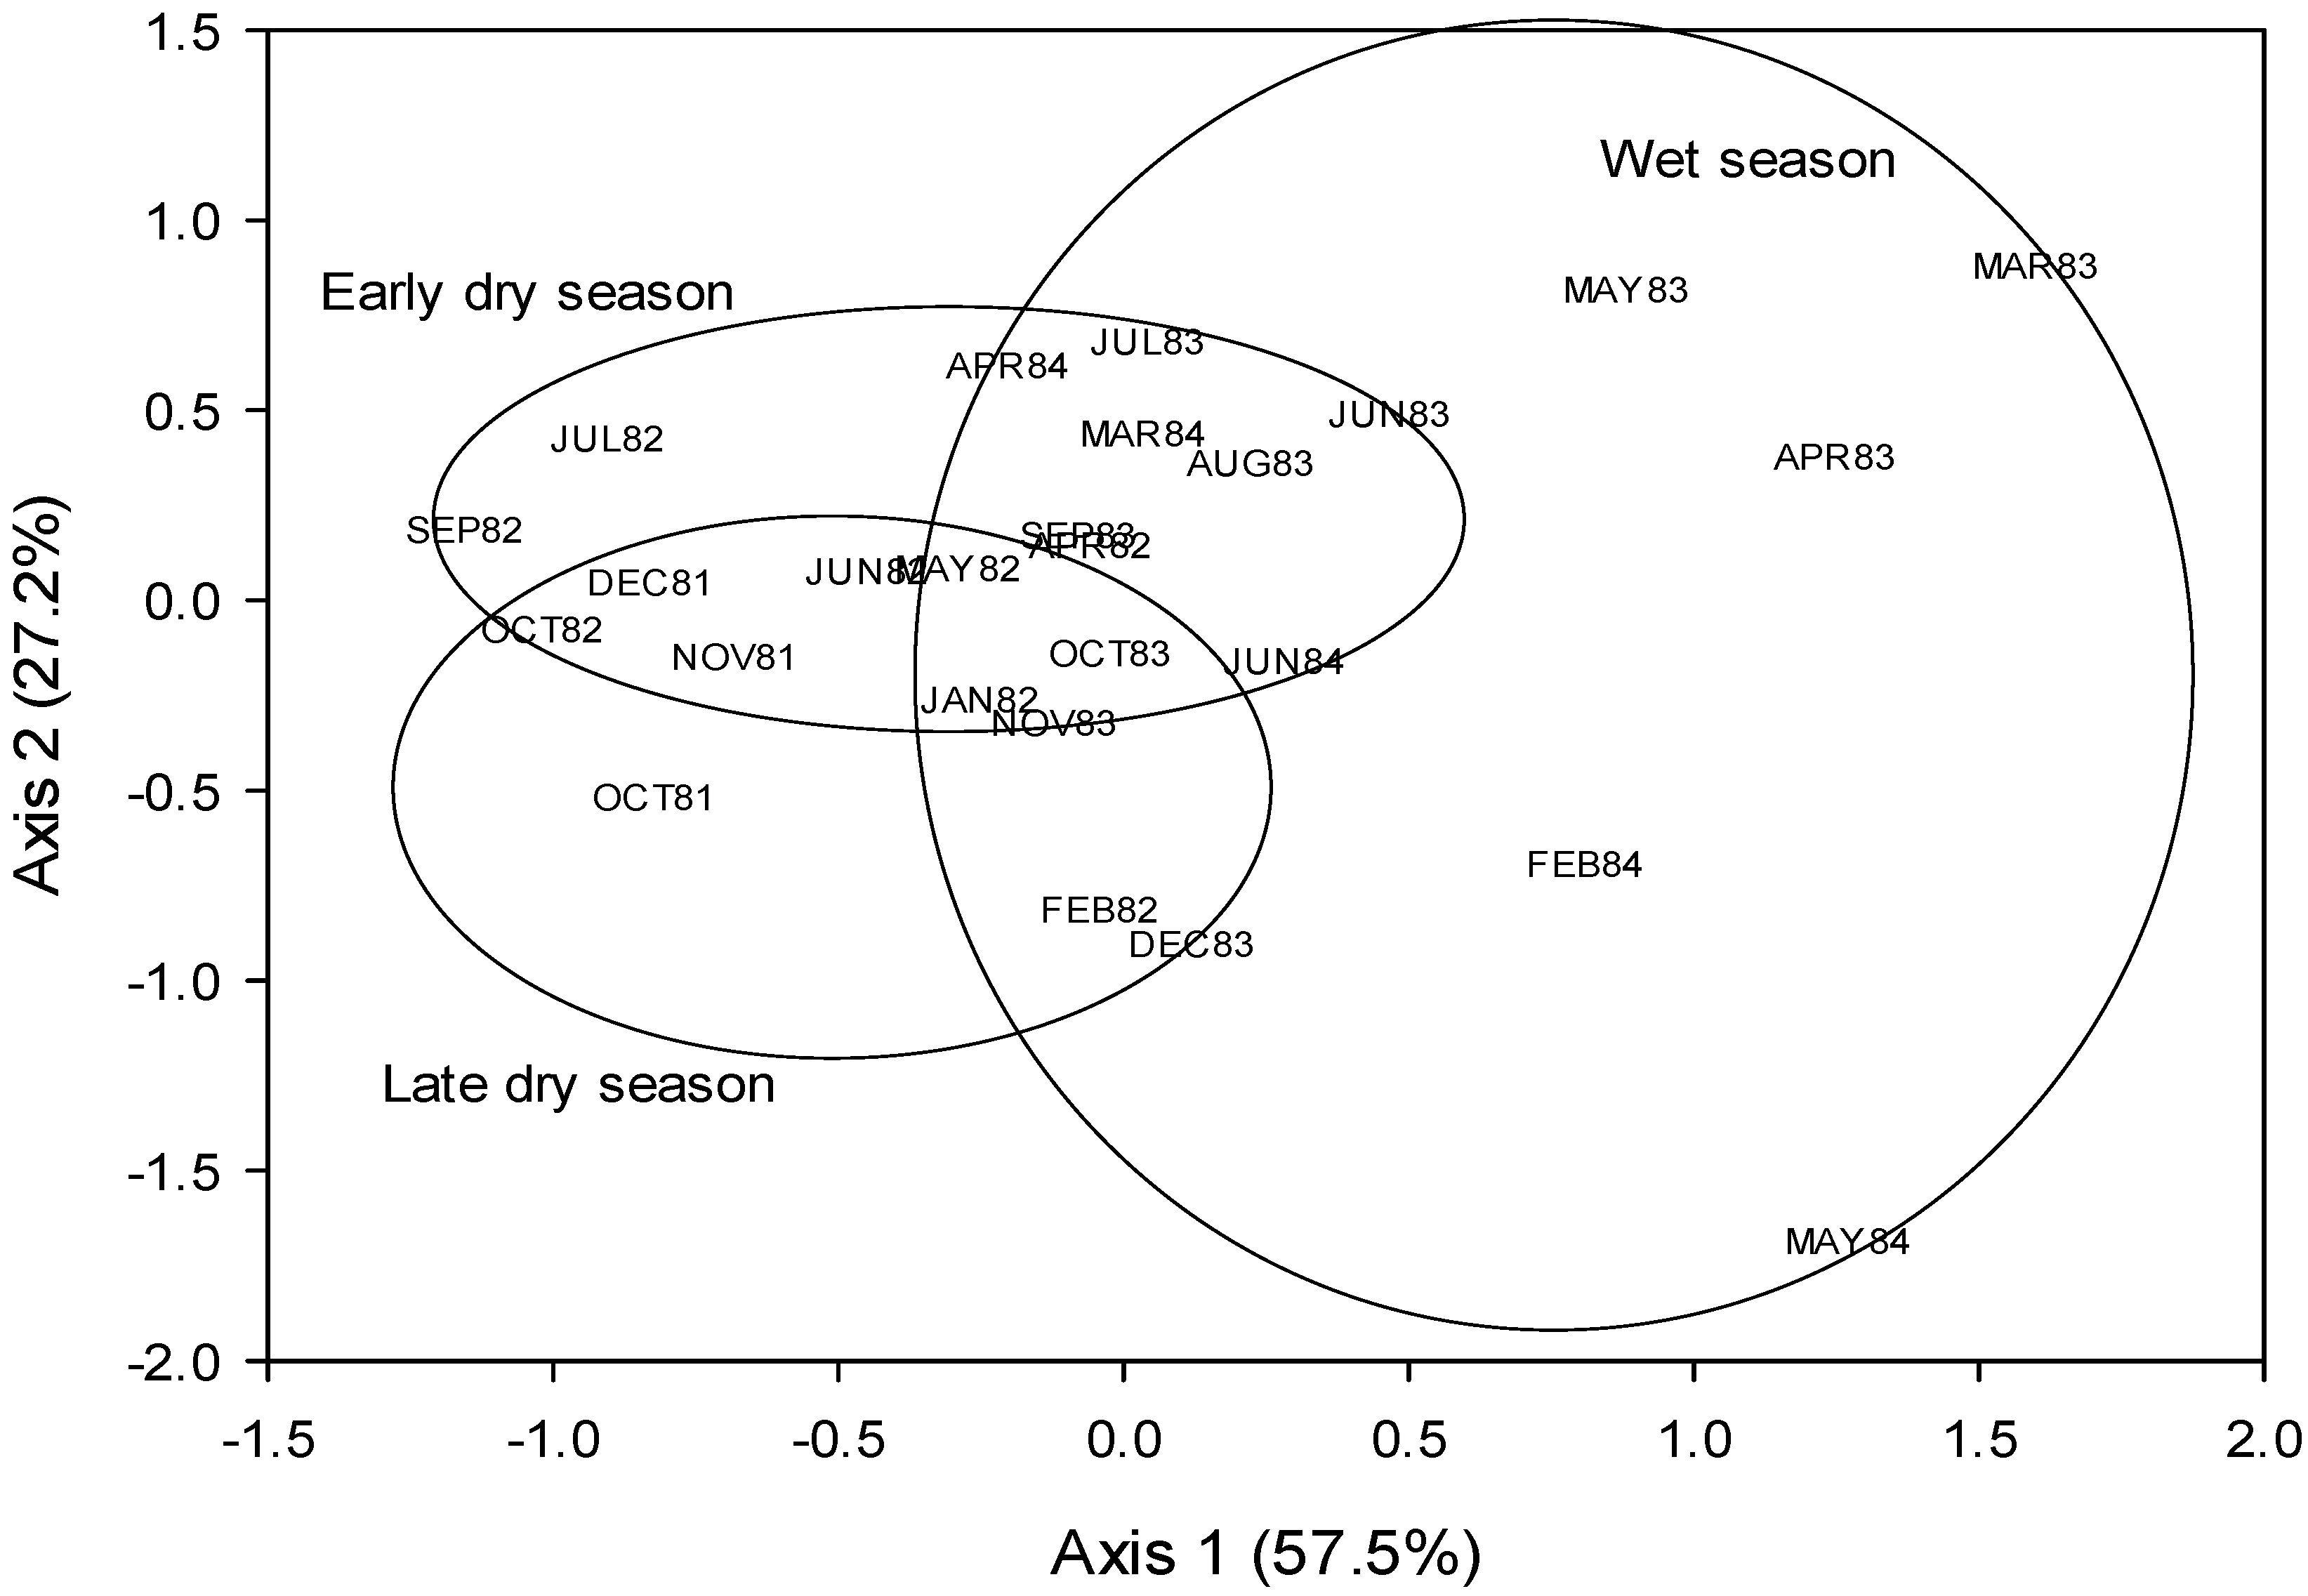
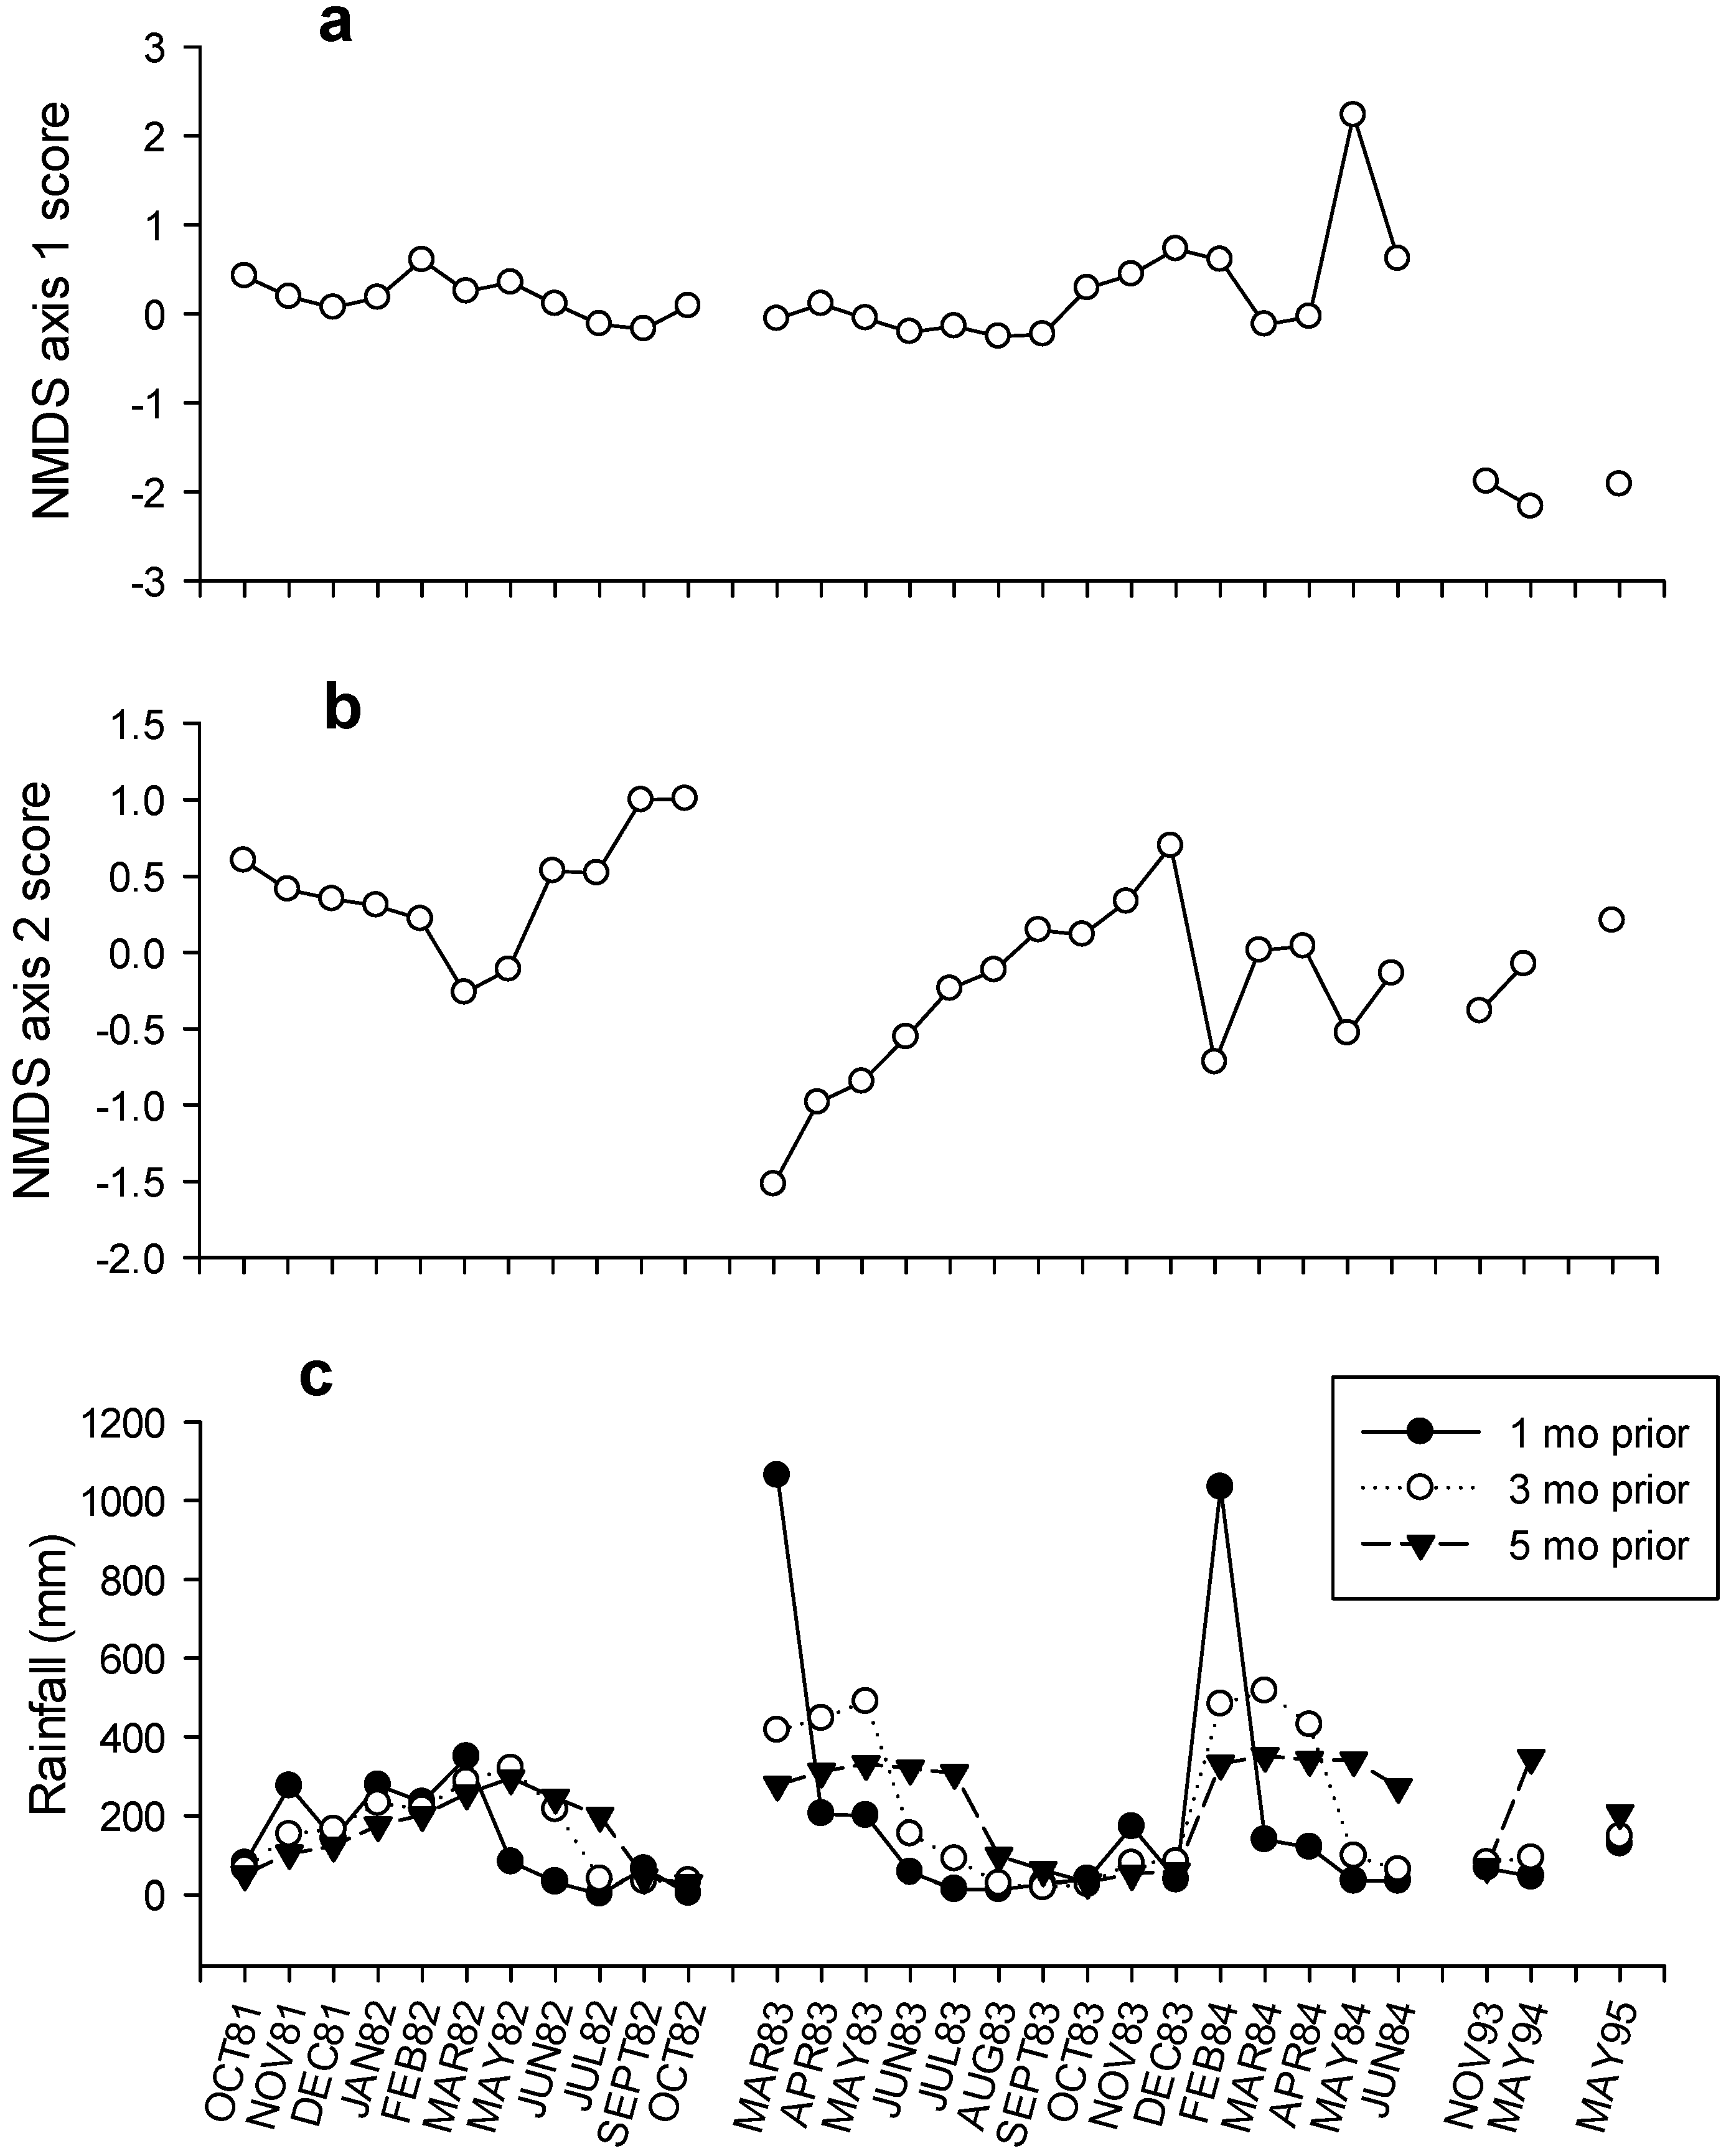
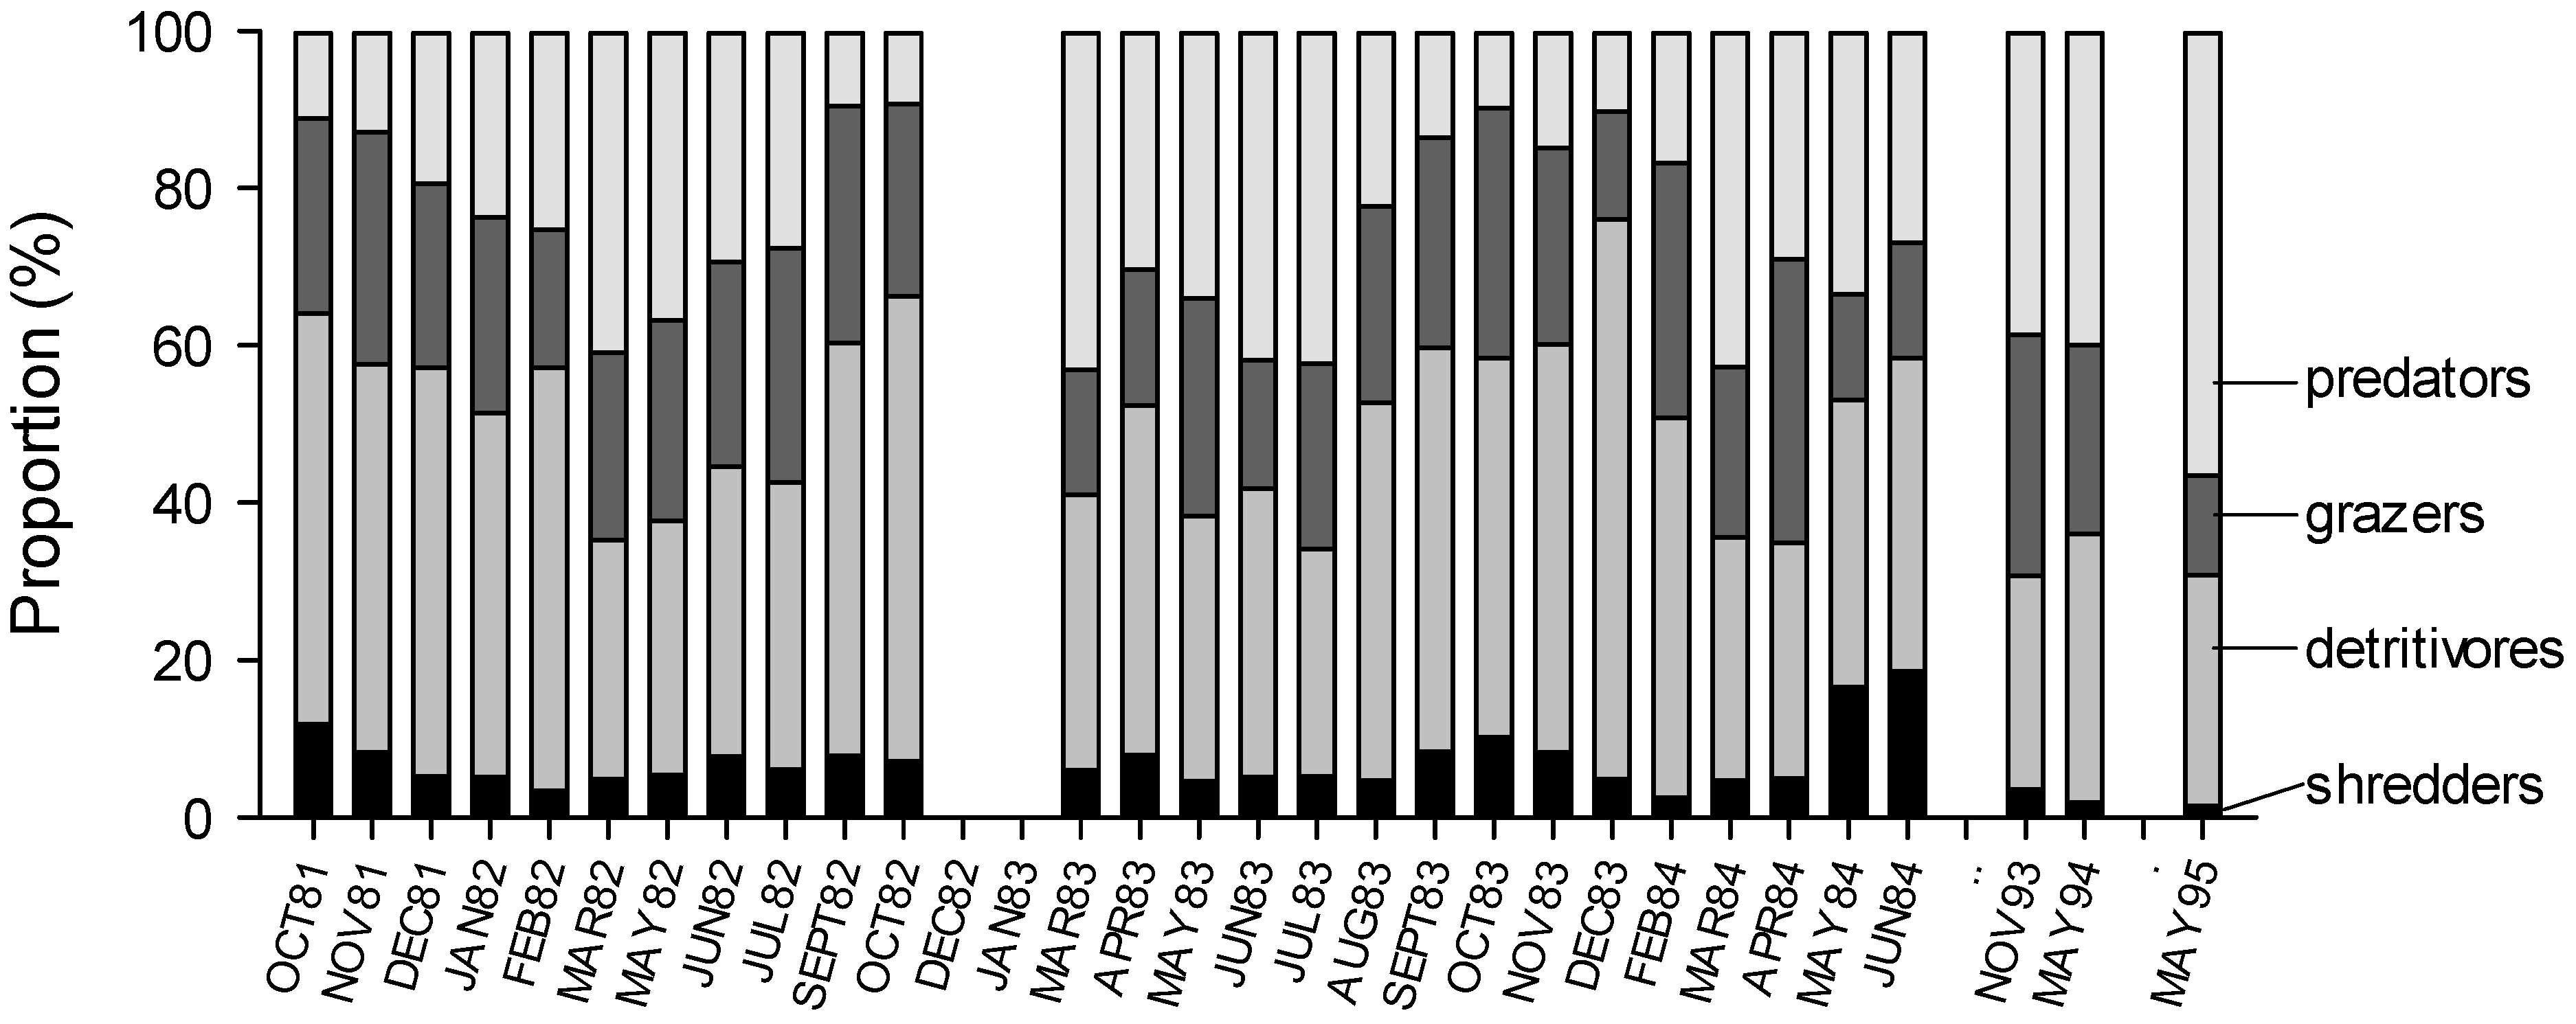
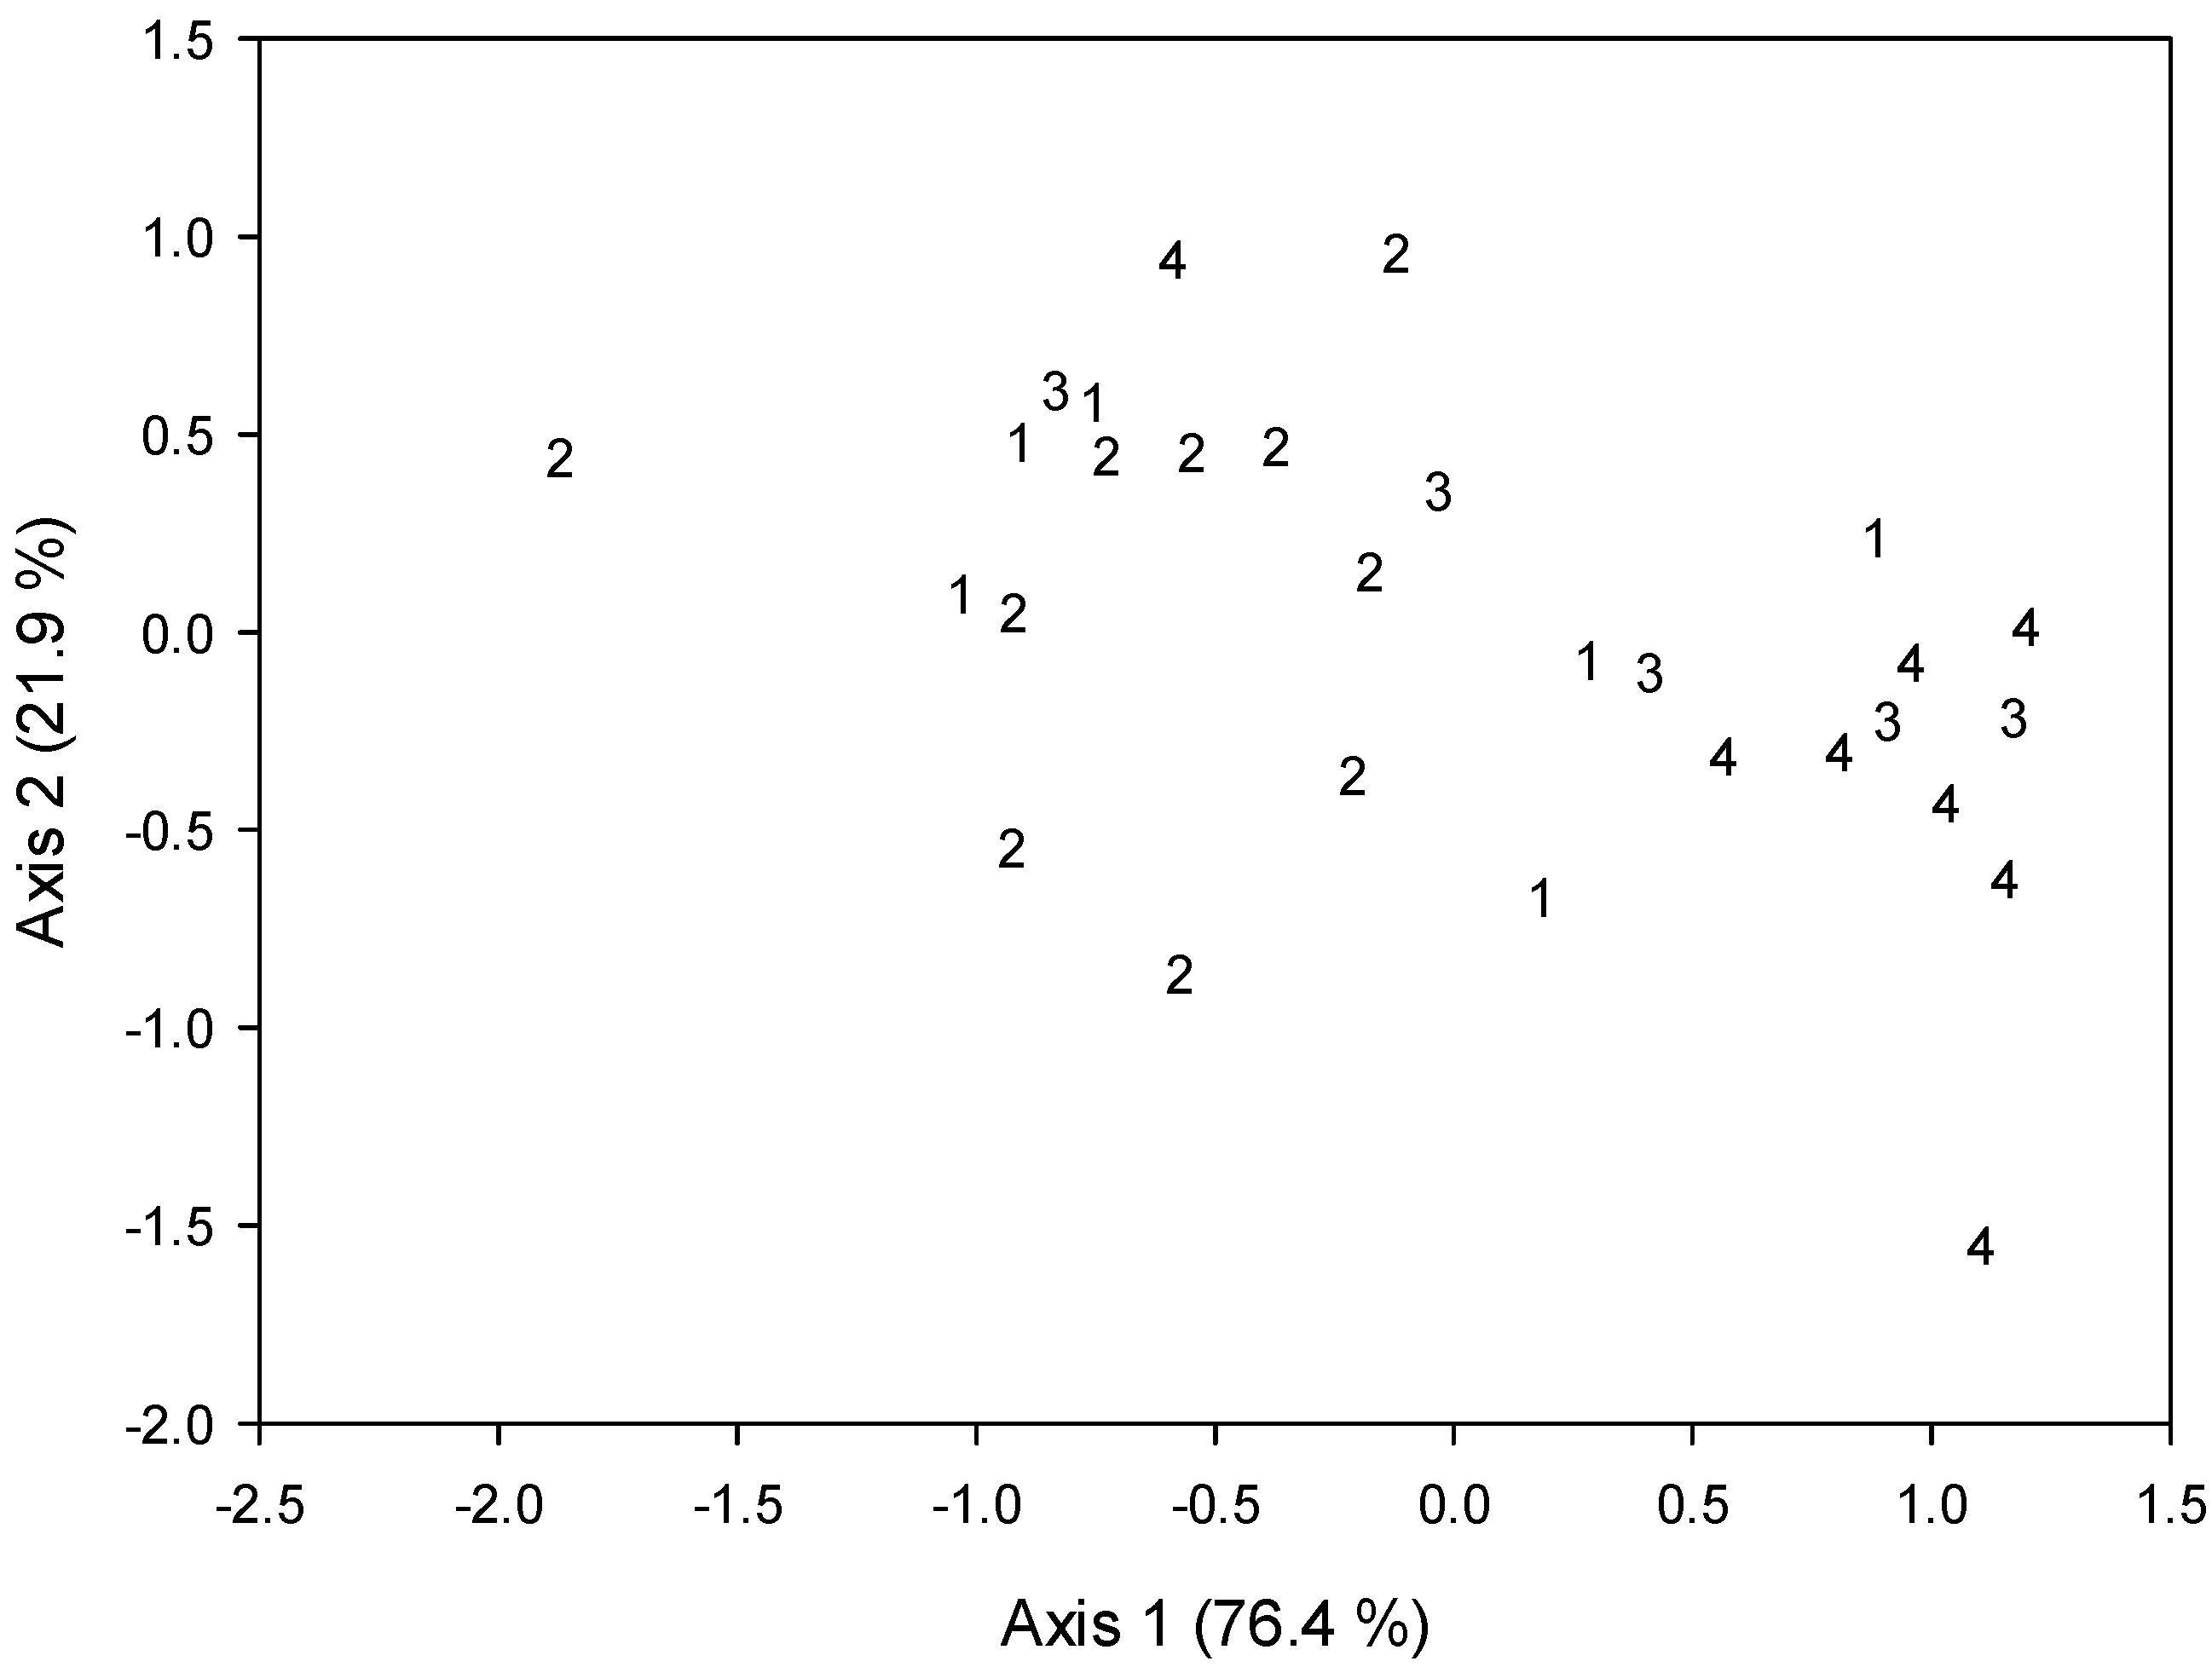
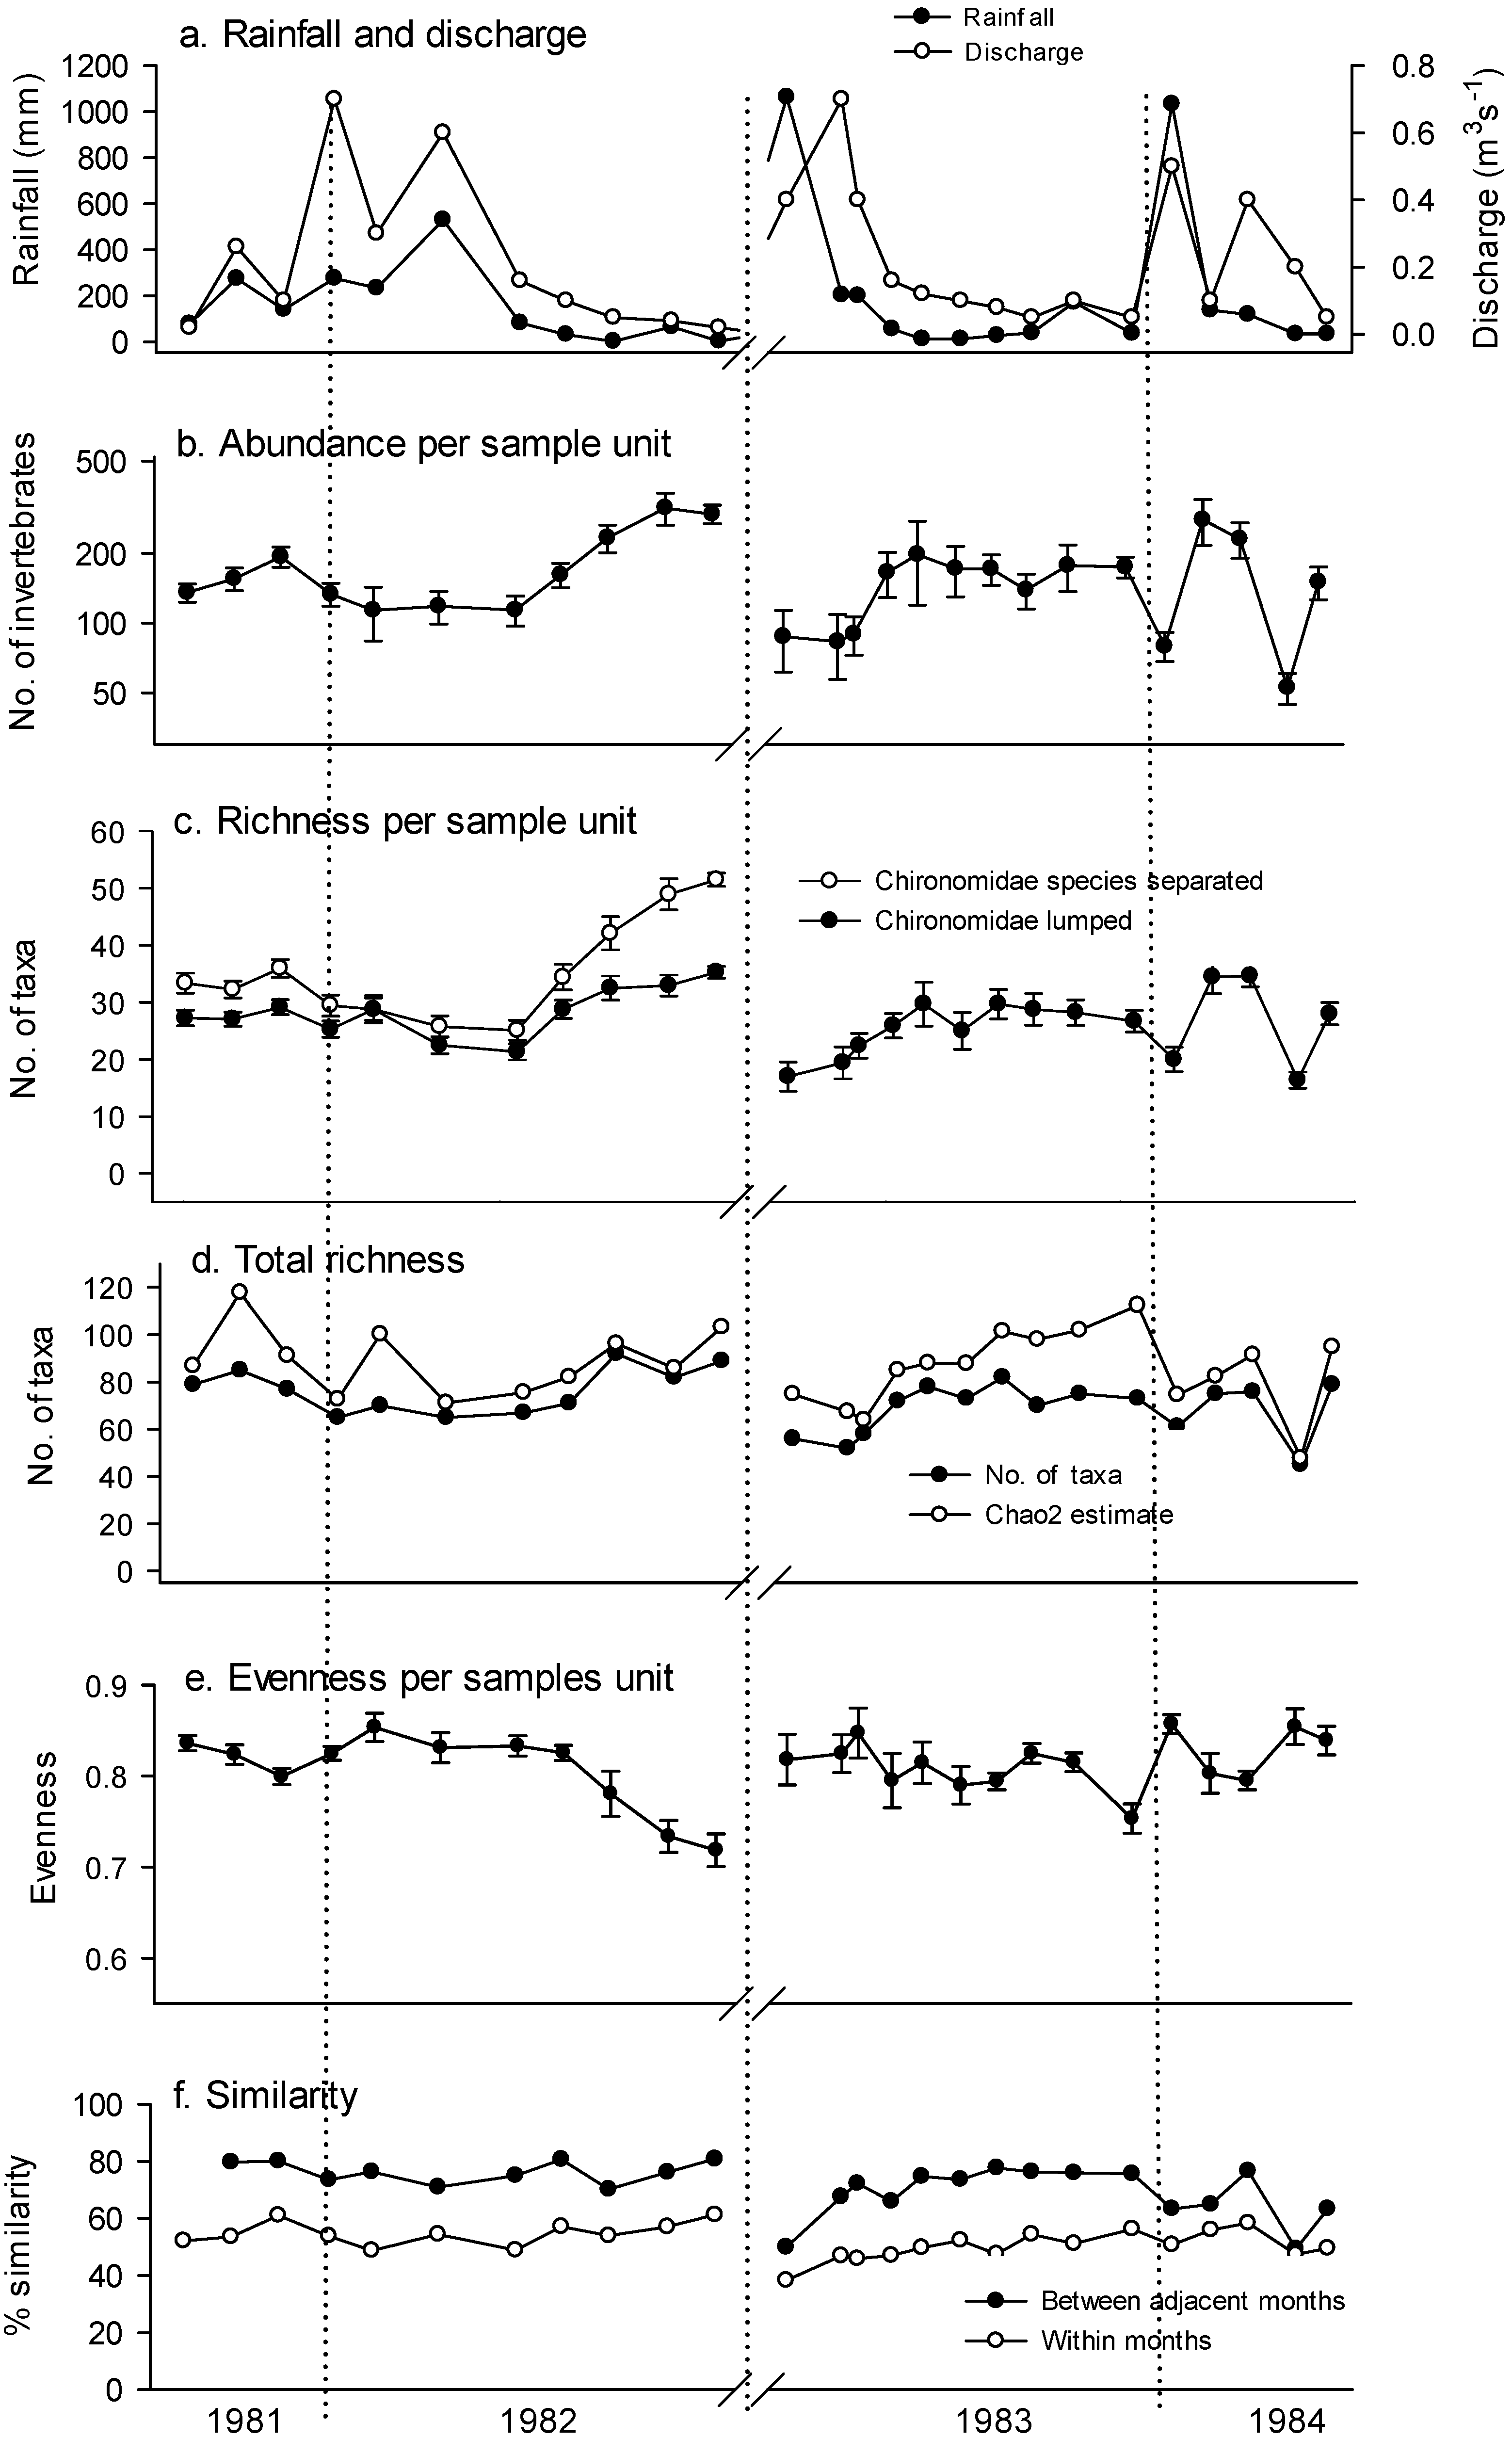
3. Results
| Pre-Drought | Post-Drought | t | p | Direction | |||
|---|---|---|---|---|---|---|---|
| Five months before and after drought | |||||||
| Austrophlebioides sp. | 209.5 | ±16.5 | 96.4 | ±11.8 | 5.60 | 0.001 | − |
| Rhagovelia sp. | 55.2 | ±4.8 | 9.5 | ±9.5 | 4.31 | 0.003 | − |
| Tasmanocoenis sp. | 99.2 | ±9.5 | 57.9 | ±4.6 | 3.92 | 0.004 | − |
| Aeschnidae | 115.8 | ±11.6 | 71.3 | ±5.6 | 3.47 | 0.008 | − |
| Philorheithridae | 85.9 | ±2.1 | 37.2 | ±15.3 | 3.17 | 0.013 | − |
| Athericidae | 128.0 | ±22.8 | 58.2 | ±15.8 | 2.52 | 0.036 | − |
| Baetis sp. | 128.4 | ±9.5 | 87.3 | ±13.3 | 2.52 | 0.036 | − |
| Simuliidae | 40.9 | ±2.7 | 74.7 | ±8.7 | 3.72 | 0.006 | + |
| Illiesoperla sp. | 53.2 | ±9.2 | 82.9 | ±6.4 | 2.66 | 0.029 | + |
| Chimarra sp. | 48.2 | ±5.5 | 66.8 | ±5.1 | 2.48 | 0.038 | + |
| Species richness | 22.1 | ±3.1 | 37.9 | ±4.1 | 3.07 | 0.015 | + |
| Ten months before and after drought | |||||||
| Philorheithridae | 85.4 | ±2.3 | 48.6 | ±8.4 | 4.25 | 0.002 | − |
| Austrophlebioides sp. | 204.1 | ±14.2 | 130.3 | ±15.4 | 3.53 | 0.002 | − |
| Cosmioperla sp. | 94.0 | ±8.4 | 65.2 | ±6.2 | 2.75 | 0.014 | − |
| Tasmanocoenis sp. | 98.9 | ±5.5 | 75.5 | ±7.3 | 2.57 | 0.020 | − |
| Anisocentropus sp. | 54.7 | ±4.4 | 80.7 | ±7.4 | 3.02 | 0.009 | + |
| Archicauliodes sp. | 67.9 | ±4.5 | 86.8 | ±6.0 | 2.52 | 0.022 | + |
| Simuliidae | 48.5 | ±4.9 | 65.3 | ±5.8 | 2.23 | 0.039 | + |
| Species richness | 22.6 | ±1.7 | 33.2 | ±2.8 | 3.21 | 0.005 | + |


| Time | Observed IV | Randomised IV | S.D. | p | |
|---|---|---|---|---|---|
| (a) Seasons 81–82 | |||||
| Helminthidae lv. sp. 7 | Early dry | 100 | 35.5 | 16.41 | 0.0076 |
| Kiefferula sp. 1 | Early dry | 100 | 35.3 | 16.21 | 0.0076 |
| Atalomicria | Early dry | 40.4 | 36.8 | 1.84 | 0.0340 |
| Philopotamidae | Early dry | 41.7 | 37.5 | 2.19 | 0.0448 |
| Helminthidae ad. sp. 5 | Late dry | 75 | 56.6 | 11.55 | 0.0204 |
| Xenochironomus sp. 8 | Late dry | 81.3 | 37.8 | 15.4 | 0.0290 |
| (b) Seasons 81–84 | |||||
| Anura | Late dry | 55.5 | 38.3 | 5.02 | 0.0016 |
| Synlestidae | Late dry | 63.7 | 32.2 | 8.33 | 0.0030 |
| Leptophlebia sp. | Late dry | 37 | 34.7 | 0.87 | 0.0034 |
| Polycentropodidae | Late dry | 48.7 | 40 | 3.65 | 0.0204 |
| Chaoboridae | Late dry | 47.7 | 24.5 | 8.98 | 0.0244 |
| Muscidae | Late dry | 40.5 | 19.9 | 8.67 | 0.0284 |
| Ceratopogonidae | Late dry | 52.9 | 40.5 | 5.57 | 0.0288 |
| Glossosomatidae | Wet | 55.5 | 33.3 | 10.52 | 0.0310 |
| Simuliidae | Wet | 53.4 | 42 | 5.6 | 0.0408 |
| (c) Decades | |||||
| Eustheniidae | 80’s | 100 | 55.1 | 6.8 | 0.0006 |
| Leptophlebiidae | 80’s | 65.5 | 52.6 | 2.1 | 0.0006 |
| Odontoceridae | 80’s | 100 | 54.6 | 6.13 | 0.0006 |
| Ptilodactilidae | 80’s | 100 | 58.3 | 9.02 | 0.0006 |
| Caenidae | 80’s | 96.2 | 55.9 | 9.64 | 0.0012 |
| Helicopsychidae | 80’s | 76.2 | 54.8 | 4 | 0.0016 |
| Hydrochidae | 80’s | 96.2 | 54.7 | 8.37 | 0.0018 |
| Philorheithridae | 80’s | 92.3 | 53.4 | 8.41 | 0.0028 |
| Anura | 80’s | 88.5 | 52.8 | 9.64 | 0.0052 |
| Synthemidae | 80’s | 88.5 | 52.6 | 9.71 | 0.0060 |
| Decapoda | 80’s | 80.8 | 50.5 | 11.46 | 0.0146 |
| Ecnomidae | 80’s | 81.3 | 55.8 | 9.31 | 0.0154 |
| Aeschnidae | 80’s | 70.7 | 56.7 | 5.34 | 0.0224 |
| Philopotamidae | 80’s | 73.8 | 58 | 6.25 | 0.0260 |
| Cordulidae | 90’s | 82.3 | 42.3 | 13.18 | 0.0006 |
| Hydracarina | 90’s | 97.7 | 34.7 | 11.84 | 0.0006 |
| Libellulidae | 90’s | 99.2 | 21.4 | 10.08 | 0.0006 |
| Psephenidae | 90’s | 91.7 | 56.9 | 11.97 | 0.0006 |
| Pyralidae | 90’s | 60.1 | 22.9 | 9.46 | 0.0082 |
| Empididae | 90’s | 63.7 | 24.3 | 11.38 | 0.0126 |
| Hydroptilidae | 90’s | 84.6 | 49.5 | 12.57 | 0.0162 |


4. Discussion
5. Conclusions
Acknowledgments
Appendix
| Year | Total Rain-Fall (mm) | Average Monthly Rainfall (mm) | |||
|---|---|---|---|---|---|
| August-December | September-December | October-December | November-December | ||
| 1981 | 3615 | 122 | 149 | 165 | 208 |
| 1982 | 1750 | 49 | 52 | 48 | 70 |
| 1983 | 2012 | 58 | 69 | 83 | 105 |
| 1984 | 1987 | 39 | 48 | 64 | 83 |
| 1985 | 1448 | 76 | 94 | 122 | 119 |
| 1986 | 1378 | 68 | 77 | 88 | 118 |
| 1987 | 1593 | 81 | 95 | 110 | 154 |
| 1988 | 2051 | 201 | 244 | 320 | 473 |
| 1989 | 2333 | 126 | 149 | 197 | 237 |
| 1990 | 1940 | 34 | 42 | 51 | 74 |
| 1991 | 2725 | 24 | 28 | 38 | 55 |
| 1992 | 1801 | 128 | 156 | 165 | 237 |
| 1993 | 1434 | 82 | 91 | 95 | 95 |
| 1994 | 1998 | 33 | 39 | 46 | 46 |
| 1995 | 1354 | 71 | 66 | 85 | 79 |
| Mean 1950–1996 | 85 | 99 | 122 | 153 | |
| Velocity | Particle | CPOM | |
|---|---|---|---|
| Cheumatopsyche B | 0.411 | 0.299 | |
| Chimarra M | 0.402 | 0.237 | |
| Cheumatopsyche A | 0.361 | ||
| Cosmioperla sp. | 0.357 | ||
| Chimarra 7 | 0.348 | 0.161 | |
| Illiesoperla sp. | 0.317 | ||
| Austrolimnius lv 3 | 0.273 | ||
| Helicopsyche sp. | 0.268 | ||
| Polycentropodidae 1 | 0.263 | ||
| Marilia sp. | 0.250 | ||
| Cheumatopsyche C | 0.243 | ||
| Asmicridea sp. | 0.240 | ||
| Kingolus 4 | 0.234 | ||
| Helminthidae 2 | 0.224 | ||
| Nousia sp. 4 | 0.215 | ||
| Hydraenidae | 0.212 | ||
| Ptilodactylidae | 0.203 | 0.163 | |
| Mecoptera | 0.203 | 0.163 | |
| Kingolus lv 2 | 0.182 | 0.187 | |
| Kingolus lv 1 | 0.181 | ||
| Austrolimnius 6 | 0.178 | ||
| Austrolimnius 4 | 0.172 | −0.163 | |
| Austrolimnius 5 | 0.171 | −0.280 | |
| Simuliidae | 0.161 | ||
| Dinotoperla sp. | 0.157 | ||
| Austrolimnius ad 1 | −0.152 | ||
| Ceratopogonidae | −0.192 | 0.164 | |
| Austrolimnius 1 | −0.212 | −0.183 | 0.304 |
| Nousia 2 | −0.213 | 0.475 | |
| Oecetis sp. | −0.262 | 0.465 | |
| Ulmerophlebia sp. | −0.268 | −0.216 | 0.524 |
| Anisocentropus sp. | −0.275 | 0.460 | |
| Nousia K | −0.287 | 0.187 | |
| Atalophebia sp. | −0.307 | −0.296 | 0.580 |
| Atalomicria sp. | −0.321 | 0.344 | |
| Triplectides sp. | −0.341 | 0.426 | |
| Polycentropodidae 7 | 0.171 | 0.187 | |
| Notalina sp. | −0.158 | 0.163 | |
| Rhagovelia sp. | −0.170 | ||
| Tasmanocoenis sp. | −0.244 | ||
| Austrophlebioides sp. | −0.299 | ||
| Nousia 1 | 0.331 | ||
| Anura | 0.187 |
Conflicts of Interest
References
- Boyero, L. Multiscale patterns of spatial variation in stream macroinvertebrate communities. Ecol. Res. 2003, 18, 365–379. [Google Scholar] [CrossRef]
- Downes, B.J.; Lake, P.S.; Schreiber, E.S.G. Spatial variation in the distribution of stream invertebrates: Implications of patchiness for models of community organization. Freshw. Biol. 1993, 30, 119–132. [Google Scholar]
- Downes, B.J.; Lake, P.S.; Schreiber, E.S.G. Habitat structure and invertebrate assemblages on stream stones: A multivariate view from the riffle. Aust. J. Ecol. 1995, 20, 502–514. [Google Scholar] [CrossRef]
- Lake, P.S. Ecological effects of perturbation by drought in flowing waters. Freshw. Biol. 2003, 48, 1161–1172. [Google Scholar] [CrossRef]
- Rosser, Z.; Pearson, R.G. Responses of rock fauna to physical disturbance in two Australian tropical rainforest streams. J. N. Am. Benthol. Soc. 1995, 14, 183–196. [Google Scholar] [CrossRef]
- Cheshire, K.; Boyero, L.; Pearson, R.G. Food webs in tropical Australian streams: Shredders are not scarce. Freshw. Biol. 2005, 50, 748–769. [Google Scholar] [CrossRef]
- Townsend, C.R.; Hildrew, A.G.; Schofield, K. Persistence of stream invertebrate communities in relation to environmental variability. J. Anim. Ecol. 1987, 56, 597–613. [Google Scholar] [CrossRef]
- Hildrew, A.G.; Giller, P.S. Patchiness, species interactions and disturbance in the stream benthos. In Aquatic Ecology: Scale, Pattern and Process; Giller, P.S., Hildrew, A.G., Raffaelli, D.G., Eds.; Symposium of the British Ecological Society, Blackwell: Oxford, UK, 1994; pp. 21–62. [Google Scholar]
- Woodward, G.; Jones, J.I.; Hildrew, A.G. Community persistence in Broadstone Stream (UK) over three decades. Freshw. Biol. 2002, 47, 1419–1435. [Google Scholar] [CrossRef]
- Dudgeon, D. (Ed.) Tropical Stream Ecology; Academic Press: London, UK, 2008.
- Boulton, A.J.; Boyero, L.; Covich, A.P.; Dobson, M.K.; Lake, P.S.; Pearson, R.G. Are tropical streams ecologically different from temperate streams? In Tropical Stream Ecology; Dudgeon, D., Ed.; Academic Press: San Diego, CA, USA, 2008; pp. 257–284. [Google Scholar]
- Boyero, L.; Ramírez, A.; Dudgeon, D.; Pearson, R.G. Are tropical streams ecologically different? J. N. Am. Benthol. Soc. 2009, 28, 397–403. [Google Scholar] [CrossRef]
- Smith, R.E.W.; Pearson, R.G. The macro‑invertebrate communities of temporary pools in an intermittent stream in tropical Queensland. Hydrobiologia 1987, 150, 45–61. [Google Scholar] [CrossRef]
- Townsend, S.A.; Douglas, M.M. The effect of three fire regimes on stream water quality, water yield and export coefficients in a tropical savanna (northern Australia). J. Hydrol. 2000, 229, 118–137. [Google Scholar] [CrossRef]
- Yule, C.M. Benthic invertebrate fauna of an aseasonal tropical mountain stream on Bougainville Island, Papua New Guinea. Mar. Freshw. Res. 1995, 46, 507–518. [Google Scholar] [CrossRef]
- Yule, C.M.; Pearson, R.G. Aseasonality of benthic invertebrates in a tropical stream on Bougainville Island, Papua New Guinea. Arch. Hydrobiol. 1996, 137, 95–117. [Google Scholar]
- Kennard, M.J.; Pusey, B.J.; Olden, J.D.; Mackay, S.J.; Stein, J.L.; Marsh, N. Classification of natural flow regimes in Australia to support environmental flow management. Freshw. Biol. 2010, 55, 171–193. [Google Scholar] [CrossRef]
- Petherham, C.; McMahon, T.A.; Peel, M.C. Flow characteristics of rivers in northern Australia: Implications for development. J. Hydrol. 2008, 357, 93–111. [Google Scholar] [CrossRef]
- Pearson, R.G.; Benson, L.J.; Smith, R.E.W. Diversity and abundance of the fauna in Yuccabine Creek, a tropical rainforest stream. In Limnology in Australia; De Deckker, P., Williams, W.D., Eds.; CSIRO: Melbourne, Australia, 1986; pp. 329–342. [Google Scholar]
- McNeil, V.H.; Cox, M.E.; Preda, M. Assessment of chemical water types and their spatial variation using multi-stage cluster analysis, Queensland, Australia. J. Hydrol. 2005, 310, 181–200. [Google Scholar]
- Benson, L.J.; Pearson, R.G. Diversity and seasonality of adult Trichoptera captured in a light-trap at Yuccabine Creek, a tropical Australian rainforest stream. Aust. J. Ecol. 1988, 13, 337–344. [Google Scholar] [CrossRef]
- Foggo, A.; Rundle, S.D.; Bilton, D.T. The net result: Evaluating species richness extrapolation techniques for littoral pond invertebrates. Freshw. Biol. 2003, 48, 1756–1764. [Google Scholar]
- McCune, B.; Mefford, M.J. PC-ORD Multivariate Analysis of Ecological Data. Version 6.06; MjM Software: Gleneden Beach, OR, USA, 2011. [Google Scholar]
- Soulsby, C.; Pomeroy, A.; Gibbins, C. Hydrology and hydrochemistry of a montane rainforest catchment in Queensland, Australia. In Hydrochemistry: Proceedings of the Rabat Symposium April 1997; Internat. Assoc. Hydrol. Sci. Publication, 1997; Volume 244, pp. 297–307. [Google Scholar]
- Lake, P.S. Disturbance, patchiness, and diversity in streams. J. N. Am. Benthol. Soc. 2000, 19, 573–592. [Google Scholar] [CrossRef]
- Dudgeon, D. Longitudinal and temporal changes in functional organization of macroinvertebrate communities in the Lam Tsuen River, Hong Kong. Hydrobiologia 1984, 111, 207–217. [Google Scholar] [CrossRef]
- Leung, A.S.L.; Dudgeon, D. Scales of spatiotemporal variability in macroinvertebrate abundance and diversity in monsoonal streams: Detecting environmental change. Freshw. Biol. 2011, 56, 1193–1208. [Google Scholar] [CrossRef]
- Leung, A.S.L.; Li, A.O.Y.; Dudgeon, D. Scales of spatiotemporal variation in macroinvertebrate assemblage structure in monsoonal streams: The importance of season. Freshw. Biol. 2012, 57, 218–231. [Google Scholar] [CrossRef]
- Rawi, C.S.M.; Al-Shami, S.A.; Madrus, M.R.; Ahmad, A.H. Biological and ecological diversity of aquatic macroinvertebrates in response to hydrological and physicochemical parameters in tropical forest streams of Gunung Tebu, Malaysia: Implications for ecohydrological assessment. Ecohydrology 2014, 7, 496–507. [Google Scholar] [CrossRef]
- Poff, N.L. Landscape filters and species traits: Towards mechanistic understanding and prediction in stream ecology. J. N. Am. Benthol. Soc. 1997, 16, 391–409. [Google Scholar] [CrossRef]
- Griswold, M.W.; Berzinis, E.W.; Crisman, T.L.; Golladay, S.W. Impacts of climatic stability on the structural and functional aspects of macroinvertebrate communities after severe drought. Freshw. Biol. 2008, 53, 2465–2483. [Google Scholar] [CrossRef]
- Chessman, B.C. Relationships between lotic macroinvertebrate traits and responses to extreme drought. Freshw. Biol. 2014. [Google Scholar] [CrossRef]
- Hynes, H.B.N. The invertebrate fauna of a Welsh mountain stream. Arch. Hydrobiol. 1961, 57, 344–388. [Google Scholar]
- Morrison, B.R.S. Recolonisation of four small streams in central Scotland following drought conditions in 1984. Hydrobiologia 1990, 208, 261–267. [Google Scholar] [CrossRef]
- Wulf, P.L. Bryophytes in streams: Habitat refuge for aquatic invertebrates. Honours Thesis, James Cook University, Townsville, Australia, 1999. [Google Scholar]
- Benson, L.J.; Pearson, R.G. Drift and upstream movements of macro-invertebrates in a tropical Australian stream. Hydrobiologia 1987, 153, 225–239. [Google Scholar] [CrossRef]
- Benson, L.J.; Pearson, R.G. The role of drift and effect of season in colonization of implanted substrata in a tropical Australian stream. Freshw. Biol. 1987, 18, 109–116. [Google Scholar] [CrossRef]
- Connolly, N.M.; Christidis, F.; McKie, B.; Boyero, L.; Pearson, R.G. Diversity of invertebrates in Wet Tropics streams: Patterns and processes. In Living in a Dynamic Tropical Forest Landscape; Stork, N.E., Turton, S., Eds.; Blackwells Publishing: Oxford, UK, 2008; pp. 161–177. [Google Scholar]
- Olsen, D.A.; Matthaei, C.D.; Townsend, C.R. Patch history, invertebrate patch dynamics and heterogeneous community composition: Perspectives from a manipulative stream experiment. Mar. Freshw. Res. 2007, 58, 307–314. [Google Scholar] [CrossRef]
- Sheldon, A.L.; Theischinger, G. Stoneflies (Plecoptera) in a tropical Australian stream: Diversity, distribution and seasonality. Illiesia 2009, 5, 40–50. [Google Scholar]
- Pearson, R.G. Biodiversity of the freshwater fauna of the Wet Tropics region of north-eastern Australia: Patterns and possible determinants. In Tropical Rain Forests: Past, Present and Future; Bermingham, E., Dick, C.W., Moritz, C., Eds.; University of Chicago Press: Chicago, IL, USA, 2005; pp. 470–485. [Google Scholar]
- Mykra, H.; Heino, J.; Oksanen, J.; Muotka, T. The stability-diversity relationship in stream macroinvertebrates: Influences of sampling effects and habitat complexity. Freshw. Biol. 2011, 56, 1122–1132. [Google Scholar] [CrossRef]
- Hearnden, M.R.; Pearson, R.G. Habitat partitioning among mayflies (Insecta: Ephemeroptera) in an Australian tropical stream. Oecologia 1991, 87, 91–101. [Google Scholar] [CrossRef]
- Erman, D.C.; Erman, N.A. The response of stream macroinvertebrates to substrate size and heterogeneity. Hydrobiologia 1984, 108, 75–82. [Google Scholar] [CrossRef]
- Cummins, K.W.; Lauff, G.F. The influence of substratum particle size on the distribution of stream benthos. Hydrobiologia 1969, 34, 145–181. [Google Scholar] [CrossRef]
- Rabeni, C.F.; Minshall, G.W. Factors affecting the microdistribution of stream benthic insects. Oikos 1977, 29, 33–43. [Google Scholar] [CrossRef]
- Minshall, G.W. Aquatic insect-substratum relationships. In The Ecology of Aquatic Insects; Resh, V.H., Rosenberg, D.M., Eds.; Praeger: New York, NY, USA, 1984; pp. 358–400. [Google Scholar]
- Doisy, K.E.; Rabeni, C.F. Flow conditions, benthic food resources, and invertebrate community composition in a low-gradient stream in Missouri. J. N. Am. BenthOL. Soc. 2001, 20, 17–32. [Google Scholar] [CrossRef]
- Lancaster, J.; Downes, B.J.; Glaister, A. Interacting environmental gradients, trade-offs and reversals in the abundance-environment relationships of stream insects: When flow is unimportant. Mar. Freshw. Res. 2009, 60, 259–270. [Google Scholar] [CrossRef]
- Göthe, E.; Angeler, D.G.; Sandin, L. Metacommunity structure in a small boreal stream network. J. Anim. Ecol. 2013, 82, 449–458. [Google Scholar] [CrossRef] [PubMed]
- Heino, J.; Grönroos, M. Untangling the relationships among regional occupancy, species traits, and niche characteristics in stream invertebrates. Ecol. Evol. 2014, 4, 1931–1942. [Google Scholar] [CrossRef] [PubMed]
- McDonald, K.; Alford, R.A. A review of declining frogs in northern Queensland. In Declines and Disappearances of Australian Frogs; Cambell, A., Ed.; Commmonwealth of Australai: Canberra, Australia, 1999; pp. 14–22. [Google Scholar]
- Skerratt, L.F.; Berger, L.; Speare, R.; Cashins, S.; McDonald, K.R.; Phillott, A.D.; Hines, H.D.; Kenyon, N. Spread of Chytridiomycosis has caused the rapid globalm decline and extinction of frogs. EcoHealth 2007, 4, 125–134. [Google Scholar] [CrossRef]
- Lake, P.S. The macroinvertebrate community of stones in an Australian upland stream. Verh. Int. Ver. Limnol. 1985, 22, 2141–2147. [Google Scholar]
- Dudgeon, D. The effects of spate-induced disturbance, predation and environmental complexity on macroinvertebrates in a tropical stream. Freshw. Biol. 1993, 30, 189–97. [Google Scholar] [CrossRef]
- Turcotte, P.; Harper, P.P. The macro-invertebrate fauna of a small Andean stream. Freshw. Biol. 1982, 12, 411–419. [Google Scholar] [CrossRef]
- Lake, P.S.; Schreiber, E.S.G.; Milne, B.J.; Pearson, R.G. Species richness in streams: Patterns over time, with stream size and with latitude. Verh. Int. Ver. Limnol. 1994, 25, 1822–1826. [Google Scholar]
- Pearson, R.G.; Boyero, L. Gradients in regional diversity of freshwater taxa. J. N. Am. Benthol. Soc. 2009, 28, 504–514. [Google Scholar] [CrossRef]
- Benson, L.J.; Pearson, R.G. Litter inputs to a tropical Australian upland rainforest stream. Aust. J. Ecol. 1993, 18, 377–383. [Google Scholar] [CrossRef]
- Cobb, D.G.; Galloway, T.D.; Flannagan, J.F. Effects of discharge and substrate stability on density and species composition of stream insects. Can. J. Fish Aquat. Sci. 1992, 49, 1788–1795. [Google Scholar] [CrossRef]
© 2014 by the authors; licensee MDPI, Basel, Switzerland. This article is an open access article distributed under the terms and conditions of the Creative Commons Attribution license (http://creativecommons.org/licenses/by/4.0/).
Share and Cite
Pearson, R.G. Dynamics of Invertebrate Diversity in a Tropical Stream. Diversity 2014, 6, 771-791. https://doi.org/10.3390/d6040771
Pearson RG. Dynamics of Invertebrate Diversity in a Tropical Stream. Diversity. 2014; 6(4):771-791. https://doi.org/10.3390/d6040771
Chicago/Turabian StylePearson, Richard G. 2014. "Dynamics of Invertebrate Diversity in a Tropical Stream" Diversity 6, no. 4: 771-791. https://doi.org/10.3390/d6040771
APA StylePearson, R. G. (2014). Dynamics of Invertebrate Diversity in a Tropical Stream. Diversity, 6(4), 771-791. https://doi.org/10.3390/d6040771