Article

Genetic Diversity and Population Structure of Two Freshwater Copepods (Copepoda: Diaptomidae), Neodiaptomus schmackeri (Poppe and Richard, 1892) and Mongolodiaptomus birulai (Rylov, 1922) from Taiwan

1
Department of Applied Science, National Hsinchu University of Education, Hsinchu 300, Taiwan
2
Hsinchu Municipal Hsinchu Elementary School, 106, Shingshiue Street, Hsinchu 300, Taiwan
3
National Applied Research Laboratories, Taiwan Ocean Research Institute, 3F, 106, Hoping Road, Section 2, Taipei 106, Taiwan
*
Author to whom correspondence should be addressed.
Diversity 2013, 5(4), 796-810; https://doi.org/10.3390/d5040796
Submission received: 22 September 2013 / Revised: 15 November 2013 / Accepted: 18 November 2013 / Published: 22 November 2013
(This article belongs to the Special Issue Genetic Diversity and Molecular Evolution)

Abstract

:
We used the mitochondria DNA COI (cytochrome c oxidase subunit I) sequence as a genetic marker to analyze the population genetic structure of two species of freshwater copepods, Neodiaptomus schmackeri (Poppe and Richard, 1892) and Mongolodiaptomus birulai (Rylov, 1922) from Taiwan. Four populations with 51 individuals of N. schmackeri and five populations with 65 individuals of M. birulai were included. We compared the nucleotide sequences of a 635-bp fragment of the COI gene of N. schmackeri and a 655-bp fragment of the COI gene of M. birulai, and eight and 14 unique haplotypes were recorded, respectively. Tseng-Wen reservoir and Wu-San-Tao reservoir are linked by a channel, and the gene flow between them was unrestricted (Fst = 0.058; Nm = 4.04; Fst, population differentiation parameter; Nm, the number of succesfull migrants per generation); the gene flow between all other populations of both species was restricted (Fst = 0.4–0.99; Nm = 0–0.37). Based on the COI gene diversification pattern, we suggest that most populations of N. schmackeri and M. birulai are isolated from each other. According to the neighbor-joining tree and the minimum spanning network (MSN), the species have similar metapopulation genetic structures. Genetic distance was not found to be correlated with geographical distance. The genetic diversification pattern was not shown to be comparable with geographical isolation owing to long-distance separation. The genetic structure of the present populations may result from serial extinction and redistribution of the populations formed in each reservoir relative to time. Human activity in the reservoirs with regards to water resource management and the fishery industry also exerts an effect on population redistribution.

1. Introduction

Population genetics describes a population that is not evolving as in Hardy–Weinberg equilibrium. A Hardy–Weinberg population must be of a very large population size, with individuals not isolated from each other, without net mutation, with no natural selection acting upon the population, and the mating must be random pairing [1,2]. In real populations, genetics predicts high dispersal rates and high levels of gene flow, preventing local populations from differentiating into new species. These populations approach the Hardy–Weinberg equilibrium state. Levins [3] developed the first metapopulation model as a set of local populations connected by migrating individuals. The metapopulation concept is derived from the influence of area and isolation on the colonization and extinction of each subpopulation [4]. Subpopulations usually inhabit an isolated habitat with patches of resources, and the degree of isolation may vary depending on the distance between patches. Metapopulation models consider each subpopulation as individual, and the dynamics of subpopulations are based on colonization-extinction equilibrium [5,6]. A metapopulation is composed of many small subpopulations. As described by the Hardy–Weinberg model, if the gene flow between subpopulations is small, they will move further away from the state of equilibrium, and these subpopulations will be highly isolated from each other.
Freshwater invertebrates, including copepods, living in lakes or ponds and those whose habitats are not connected with each other by a waterway appear to be strong candidates for metapopulations [7]. These freshwater bodies distributed on land are ideal analogs of oceanic islands, as per the first approach by MacArthur and Wilson [4]. The dispersal ability of copepods may be dissimilar to that of other groups of animals with resting eggs or other dormancy mechanisms allowing for easy dispersal [8]. These populations of copepods in reservoirs or lakes are isolated from each other to differing degrees owing to limited dispersal and low levels of gene flow, and the genetic structures of each population will be unique.
Knowledge of the early distribution pattern of Diaptomidae of Taiwan is limited. Kiefer [9] described Mongolodiaptomus formosanus (= Mongolodiaptomus birulai (Rylov, 1922)) from Zaugatan (Sun-Moon Lake) in the third year after the reservoir was filled with water and, in another paper, also described this species in Wu-San-Tao reservoir [10]. No reports of Neodiaptomus schmackeri (Poppe and Richard, 1892) in Taiwan were made until it was first collected in Lee-Yu-Tan in 1996 by the author [11]. After intense collection of samples, we found that most of the reservoir was dominated by M. birulai, while in some places, both species coexisted, with minor populations of N. schmackeri. At present, both species were the only freshwater calanoid copepods that could be found in the lowland reservoirs and fish ponds of Taiwan. Some species that had been recorded in the past became extinct after long-term environmental modification by modern agricultural development. Small animals in a freshwater ecosystem, such as zooplankton, at the microscopic scale are easier to ignore when discussing biodiversity decline. At present, more understanding of their metapopulation structure in an isolated habitat will be a crucial step for the conservation of plankton diversity. Isolated reservoirs around an island without water linking them are ideal sites to study the population genetics for small crustaceans.
In recent years, population genetics has employed molecular tools to study the genetic structure of different organisms. Genomic or mitochondrial DNA nucleotide sequences can explain the microevolution of populations of copepods [12,13,14,15,16]. The aim of this study is to investigate the biodiversity of freshwater copepods at the genetic level. We used the mitochondria DNA cytochrome c oxidase subunit I (COI) gene as a marker to understand the genetic diversity and metapopulation structure of two freshwater copepods living in isolated water bodies around Taiwan.

2. Materials and Methods

2.1. Sampling

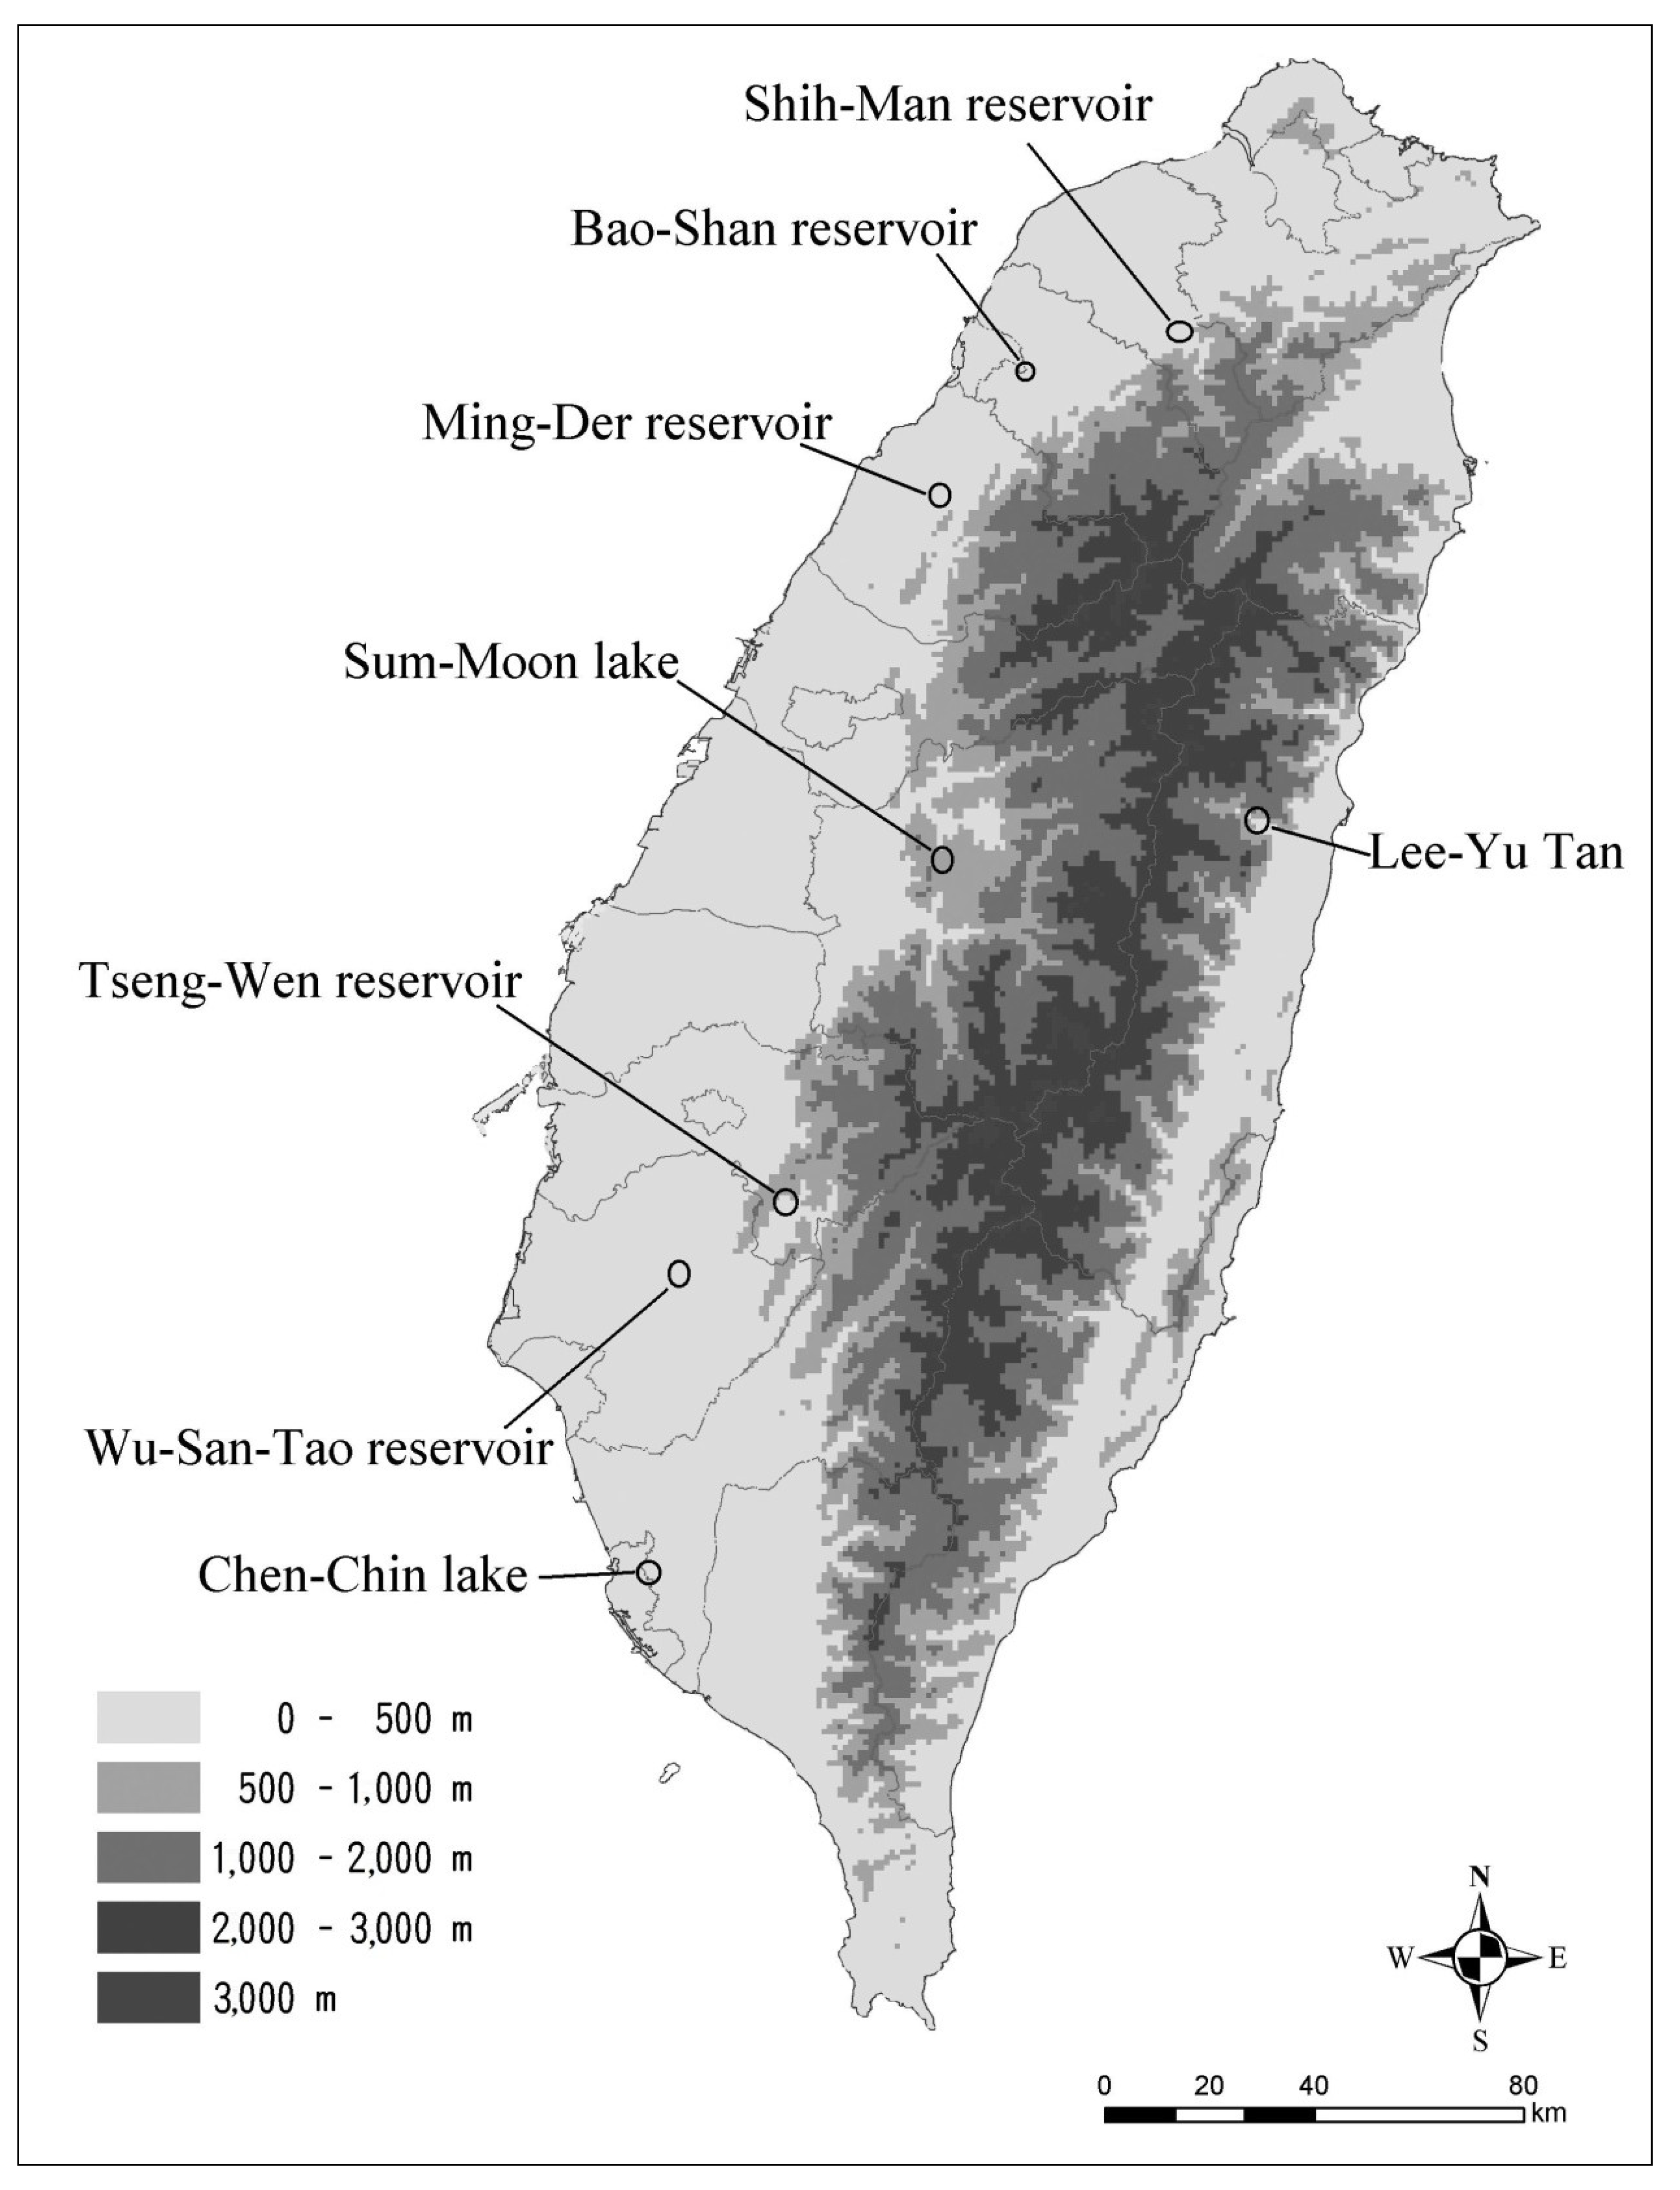
Populations of N. schmackeri and M. birulai in this study were collected from 8 reservoirs in Taiwan. The sampling sites were separated by different river systems (Figure 1). For N. schmackeri, we obtained four populations and 51 samples, and for M. birulai, we obtained five populations and 65 samples (see Table 1). The specimens were collected by towing a 55-μm mesh zooplankton net in the water. The samples were then washed, fixed and preserved in 95% ethanol in the field and were maintained in a freezer at −20 °C in the laboratory before proceeding with DNA extraction.
Table 1. Sample sites, sample sizes and haplotype distributions of Neodiaptomus schmackeri.
Sample SiteSample SizeHaplotypeHaplotype Diversity (Hd)Nucleotide Diversity (π)
Nb16N_Hap_1[Nb1-Nb16]00
Nm14N_Hap_2[Nm1-Nm2; Nm4-Nm14]; N_Hap_3[Nm3]0.1430.0002
Nw10N_Hap_4[Nw1]; N_Hap_5[Nw2-Nw5; Nw7-Nw8; Nw10]; N_Hap_6[Nw6; Nw9]0.5110.0050
Nl11N_Hap_7[NL1; NL3-NL8; NL11]; N_Hap_8[NL2; NL9-NL10]0.4360.0028
Total51 0.8030.0027
Nb: Bao-Shan reservoir in Hsinchu county; Nm: Ming-Der reservoir in Miaulih county; Nw: Wu-San-Tao reservoir in Tainan county; Nl: Lee-Yu-Tan in Hualien county.
Figure 1. Distribution of sampling sites: each site was separated by different river systems.
Diversity 05 00796 g001

2.2. DNA Extraction, Amplification and Sequencing

Total genomic DNA was extracted from single animals using Chelex (InstaGene Matrix Bio-Rad 7326030). Each animal was removed from the 95% ETOH and placed in pure water for one hour to clean off the ETOH. After cleaning, each animal was placed at the bottom of a 0.5-mL centrifugation tube for half an hour and dried in a speed-vacuum drying system. The dried samples were then ground using needles, and 50 μL of 5% Chelex solution was used to extract DNA under incubation at 56 °C for 2–3 hours. A final incubation at 90 °C for 8 minutes was necessary to complete the extraction process. For each PCR reaction, 5 μL of the cleaned upper portion of the extraction was used as the DNA template and was centrifuged at 10,000 RPM for 3 minutes.
We employed universal primers [17,18,19] LCO1490 (5′-GGTCAACAAATCATAAAGATATTGG-3′) and HCO2918 (5′-TAAACTTCAGGGTGACCAAAAAATCA-3′) to amplify the mitochondrial cytochrome oxidase I (COI) gene by polymerase chain reaction (PCR). The PCR reaction was carried out using a total volume of 50 μL, consisting of pH 9.2 buffer solution (50 mM tris-HCl, 16 mM ammonium sulfate, 2.5 mM MgCl2 and 0.1% Tween 20), 5 picomoles of each primer, 50 μmoles of Deoxynucleotide (dNTPs), 2 units of Taq DNA polymerase (SuperTherm DNA polymerase, Bio-Taq from BioKit Biotechnology Inc., Maioli, Taiwan) and 10–50 nanograms of genomic DNA. The PCR reactions were performed using an Eppendorf Mastercycler gradient 384 machine. Thermocycling began with 5 minutes of pre-heating, followed by 35 cycles at 94 °C for 30 seconds, primer annealing at 51 °C for 45 seconds and DNA extension at 72 °C for 45 seconds. After 35 cycles, the reaction mixture was incubated at 72 °C for 10 minutes for full extension of the DNA, after which the reaction was completed by holding-up at 4 °C. The PCR products were electrophoresed in 2% agarose gels, which were then stained with ethidium bromide (EtBr) and photographed under UV light. DNA fragments were excised from the gel and extracted using a 1-4-3 DNA extraction kit (Gene-Spin) to obtain purified DNA. The sequences of the DNA fragments were resolved on an ABI3730 automated sequencer using 20–50 nanograms of template with 5 pmoles of LCO1490 and HCO2198 primers.

2.3. Alignment, Genetic Diversity and Population Structure

We amplified a 635-base-pair fragment of the COI gene from N. schmackeri and a 655-base-pair fragment from M. birulai, which were aligned by eye using BioEdit program version 5.0.9 (Tom Hall Ibis Biosciences). Using MEGA 4 software [20], we calculated the haplotype diversity (Hd [21]), nucleotide diversity (π [21]), genetic distance (Dxy [21]) and gene flow between populations (Fst, population differentiation parameter [22,23]; and Nm, the number of successful migrants per generation [22]). We calculated the average genetic distance between each population of the two species and used the neighbor-joining method [24] based on the Kimura 2-parameter process with 1,000 bootstraps to obtain the geophylogenetic tree of each species. In geophylogenetic analysis, N. schmackeri was used as the out-group of M. birulai and M. birulai as the out-group of N. schmackeri. We used the pairwise distance between each haplotype to construct the minimum spanning network (MSN) in Arlequin version 2000 [25]. The algorithm was modified from minimum spanning trees (MSTs) in order to include all possible MSTs within a single graph. We also used the Tajima Dtest [26] and the Fu and Li D* and F* tests [27] to find whether or not the genetic marker we used was neutral or affected by environmental factors.

3. Results

3.1. Neodiaptomus schmackeri

Transition mutation relative to transversion mutation was 3.0. There were eight haplotypes (GenBank accession numbers: AB592987–AB592994) among the four populations; the total haplotype diversity (Hd) was 0.803, and the nucleotide diversity (π) was 0.0027 (Table 1). The most diversified population was found in Wu-San-Tao reservoir (Nw), with 3 haplotypes, the values of Hd and π being 0.511 and 0.005, respectively. The lowest diversity was found in Bao-Shan reservoir (Nb), which showed only one haplotype. The genetic distance between paired populations (Dxy) ranged from 0.013 to 0.058 (Table 2). The genetic distance between the Bao-Shan (Nb) population and the others was greater than 0.05, it being the most divergent relative to the others. The gene flow between populations was very low, the Fst ranging from 0.688 to 0.998, averaging 0.938. Based on Fst, we estimated that Nm ranged from zero to 0.11 (Table 3). Each population was completely isolated from the others. According to the Tajima Dtest and the Fu and Li D* and F* tests, the genetic variation between populations was under the selection effect and was not neutral (Tajima D = 2.45*, p < 0.05; Fu and Li’s D* test statistic = 1.57*, p < 0.05; Fu and Li’s F* test statistic = 2.26**, p < 0.05).
Table 2. Relative to Mongolodiaptomus birulai (out-group), the genetic distance between different populations of Neodiaptomus schmackeri is indicated by the cytochrome c oxidase subunit I (COI) gene. The distance was calculated using the Kimura 2-parameter (transition + transversion) method.
OutNbNmNw
Nb0.231
Nm0.2500.054
Nw0.2460.0580.022
Nl0.2400.0500.0130.016
Nb: Bao-Shan reservoir in Hsinchu county; Nm: Ming-Der reservoir in Miaulih county; Nw: Wu-San-Tao reservoir in Tainan county; Nl: Lee-Yu-Tan in Hualien county.
Table 3. The population differentiation parameter (Fst) and gene flow parameter (Nm, in parentheses) between different populations of Neodiaptomus schmackeri. The values were calculated based on the COI gene according to the method of Hudson et al. [22].
NbNmNw
Nm0.99783 (0.00)
Nw0.95107 (0.01)0.85246 (0.04)
Nl0.97134 (0.01)0.88092 (0.03)0.68772 (0.11)
Nb: Bao-Shan reservoir in Hsinchu county; Nm: Ming-Der reservoir in Miaulih county; Nw: Wu-San-Tao reservoir in Tainan county; Nl: Lee-Yu-Tan in Hualien county.
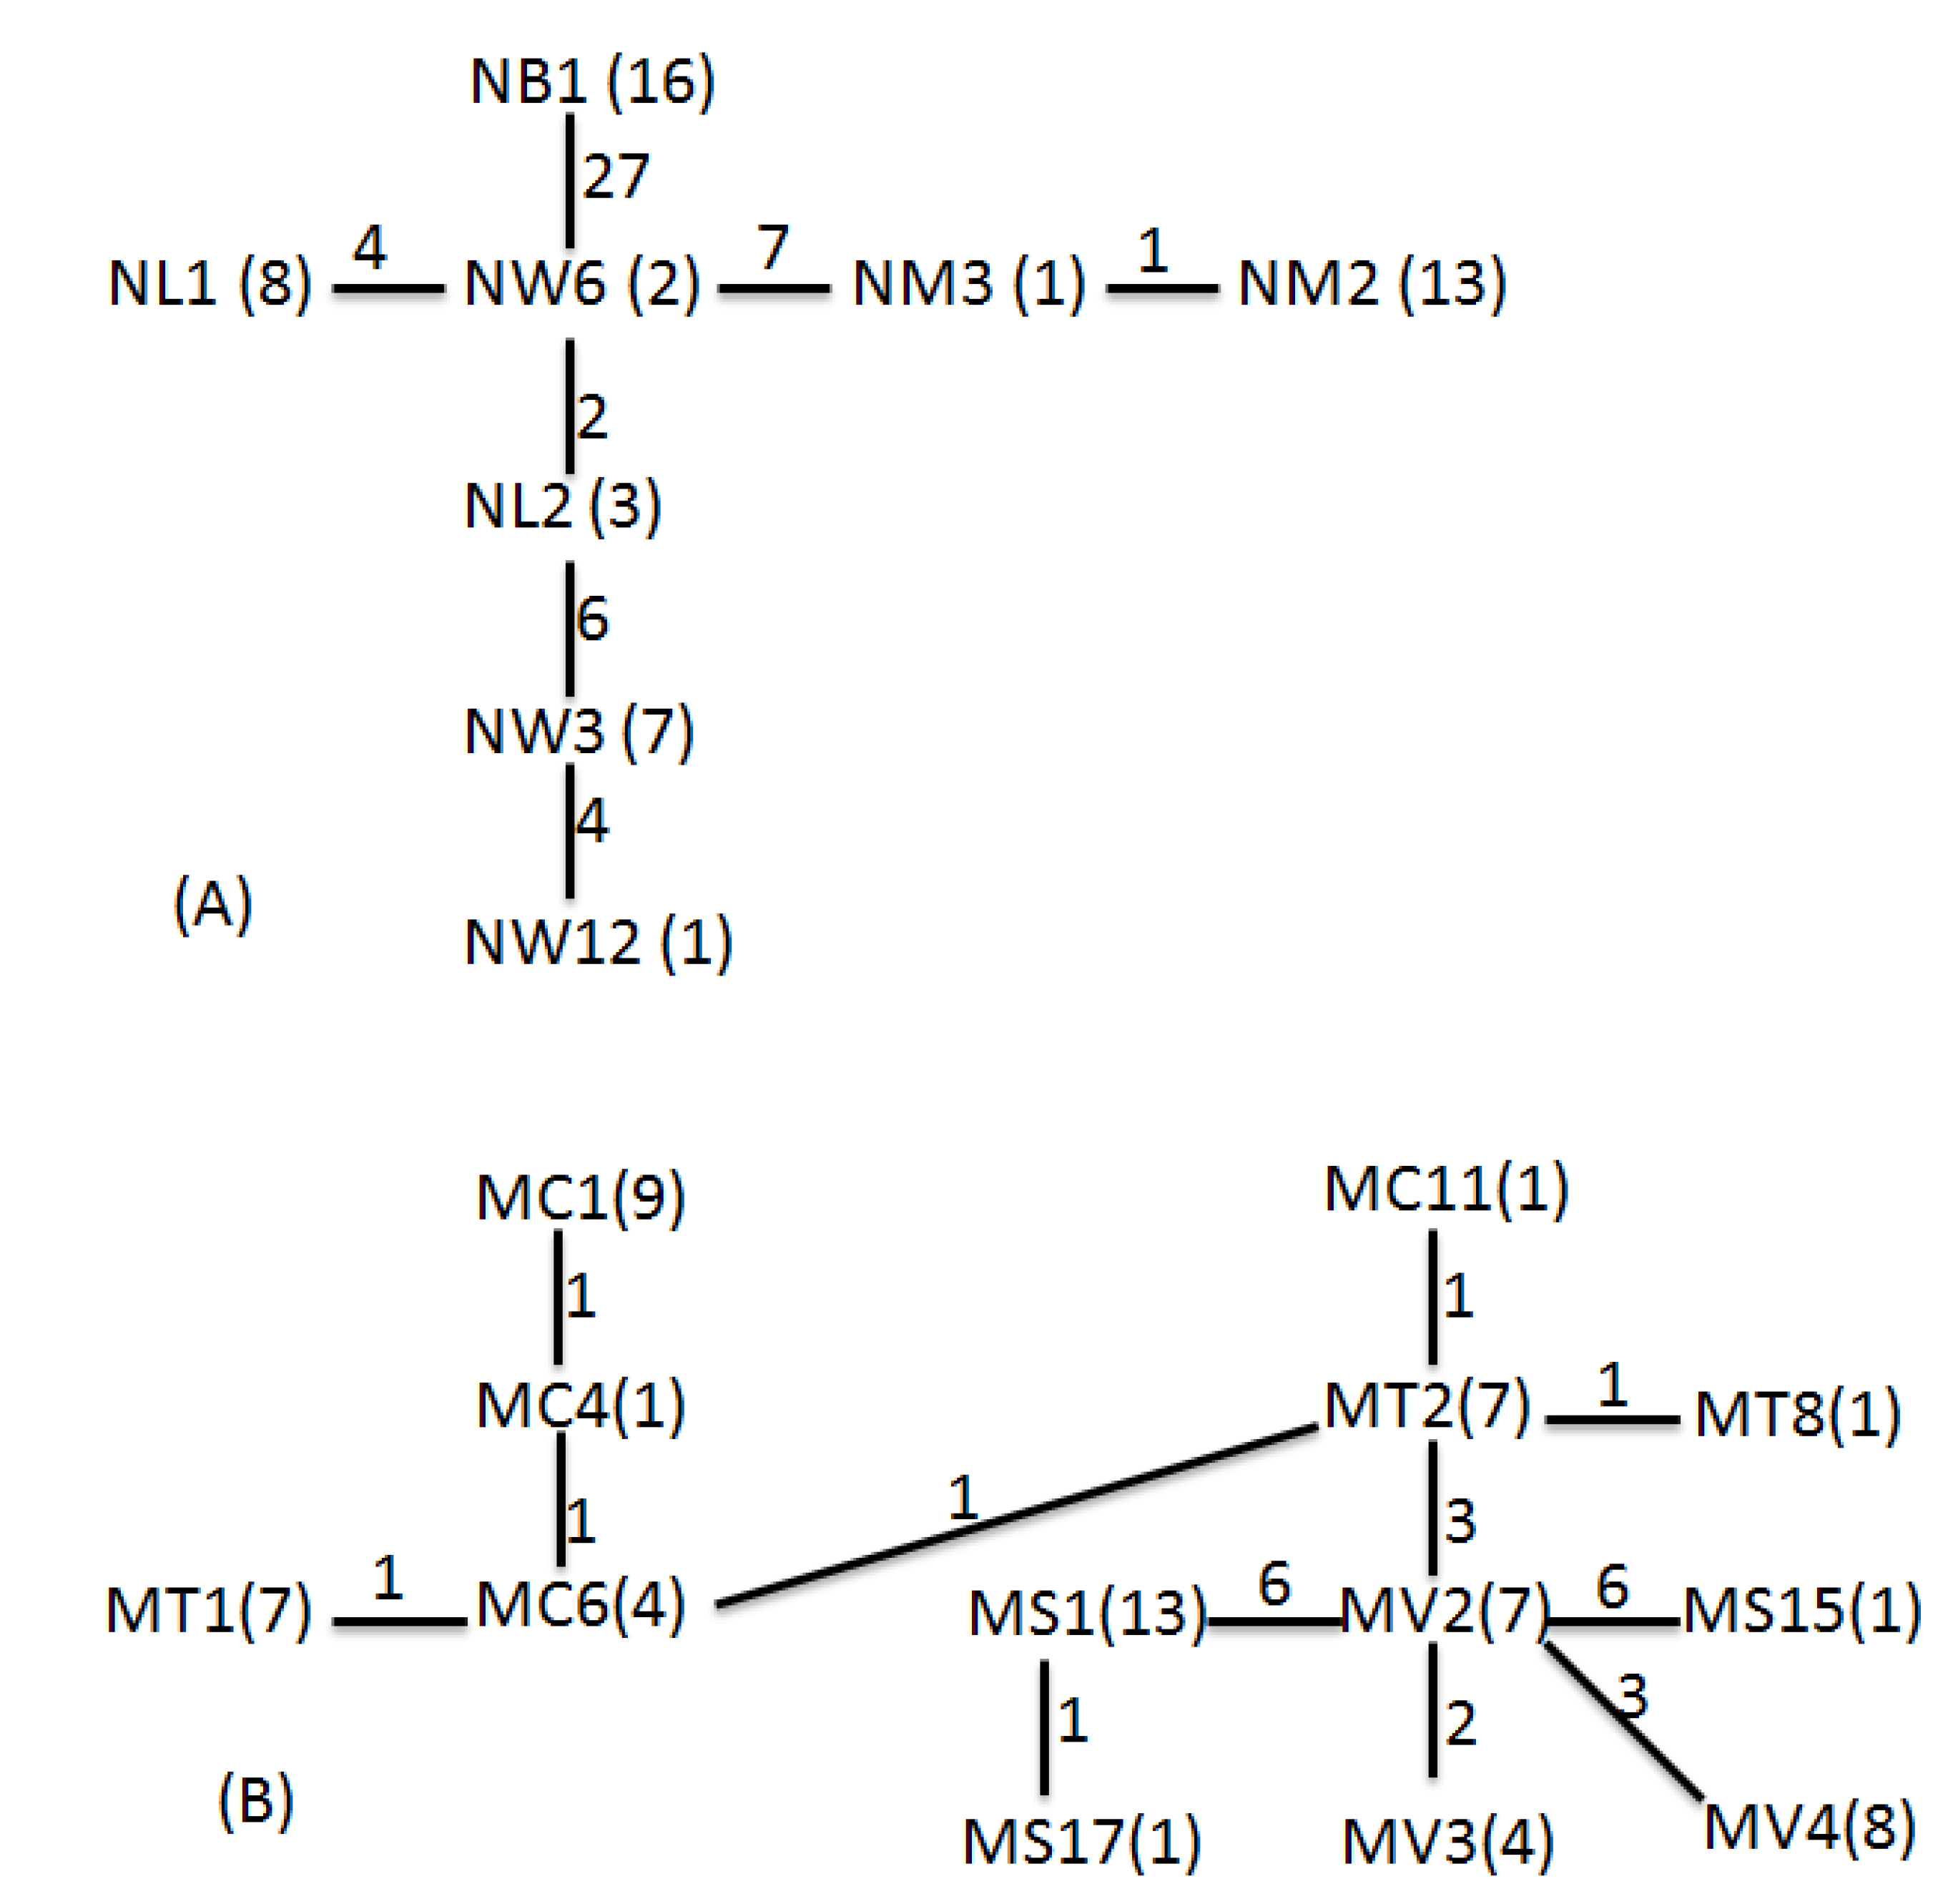
The neighbor-joining geophylogenetic tree was constructed using Kimura 2-parameter estimation of genetic distance (Figure 2). The geophylogenetic tree showed two main clades: the most basal that included specimens from the Bao-Shan reservoir, and another one where the remaining populations were included. Bao-Shan reservoir and Ming-Der reservoir were close to each other in terms of geographical distance (22 km), but had populations of distinct genetic composition. Wu-San-Tao and Lee-Yu-Tan are separated by a long distance (140 km), and between them is the central mountain area of Taiwan, which is higher than 2,000–3,000 meters; however, the genetic composition of their populations were more similar. The conclusions drawn from the minimum spanning network (MSN) were similar to those obtained from the neighbor-joining geophylogenetic tree. The center was located at Wu-San-Tao, and the longest connection length was between Bao-Shan reservoir and Wu-San-Tao (Figure 3). The only mixed lineage observed was one haplotype from Lee-Yu-Tan that also was found in the Wu-San-Tao line.
Figure 2. The geophylogenetic tree of Neodiaptomus schmackeri constructed by the neighbor-joining method based on the Kimura 2-parameter process with 1,000 bootstraps. Nb: Bao-Shan reservoir in Hsinchu county; Nm: Ming-Der reservoir in Miaulih county; Nw: Wu-San-Tao reservoir in Tainan county; Nl: Lee-Yu-Tan in Hualien county.
Diversity 05 00796 g002
Figure 3. The minimum spanning network (MSN) of each population by pair-wise distance between each haplotype. (A) Neodiaptomus schmackeri; (B) Mongolodiaptomus birulai.
Diversity 05 00796 g003

3.2. Mongolodiaptomus Birulai

Transition mutation relative to transversion mutation was 4.3. There were 14 haplotypes among five populations (GenBank accession numbers: AB592995–AB593008); the total haplotype diversity (Hd) and nucleotide diversity (π) were 0.896 and 0.0081, respectively (Table 4). The most diversified populations were found in Chen-Chin Lake (Mc) and Shih-Man reservoir (Mt), with three and four haplotypes, respectively; Hd was 0.65 and 0.60, respectively. Relative to the other sites, the population of Sun-Moon Lake (Ms) was simple, with three haplotypes; but, most of the individuals belonged to the same haplotype, and Hd was 0.257.
The genetic distance between paired populations (Dxy) ranged from 0.004 to 0.016 (Table 5). The genetic distance between the Sun-Moon Lake population and the other populations was greater than 0.01, it being the most divided relative to the others. The geographic distance with 260 km between Shih-Man reservoir and Chen-Chin Lake was greatest of all the pairs, but populations of each had the smallest genetic distance. The gene flow between populations was very low, the Fst ranging from 0.058 to 0.867, with an average of 0.719 (Table 6). Based on Fst, we estimated that Nm ranged from 0.04 to 4.04. Except Tseng-Wen reservoir and Wu-San-Tao reservoir, which are closely linked, the other populations were completely isolated. According to the Tajima Dtest and the Fu and Li D* and F* tests, the genetic variation between populations was neutral under the random effects of genetic drift and mutation (Tajima D = 0.29, p > 0.1; Fu and Li’s D* test statistic = −0.746*, p > 0.1; Fu and Li’s F* test statistic = −0.442, p > 0.1).
Table 4. Sample sites, sample sizes and haplotype distributions of Mongolodiaptomus birulai.
Sample SiteSample SizeHaplotype Haplotype Diversity (Hd)Nucleotide Diversity (π)
Mt16M_Hap_1 (Mt1, Mt3, Mt6, Mt10- Mt13); M_Hap_2 (Mt2, Mt4, Mt5, Mt7, Mt9, Mt14, Mt15); M_Hap_3 (Mt8); M_Hap_4 (Mt16)0.6500.0020
Ms15M_Hap_5 (Ms1- Ms11, Ms13, Ms14); M_Hap_6 (Ms12); M_Hap_7 (Ms15)0.2570.0014
Mv15M_Hap_8 (Mv1, Mv2, Mv5, Mv6, Mv10, Mv12, Mv15); M_Hap_9 (Mv3, Mv11, Mv13); M_Hap_10 (Mv4, Mv7-Mv9, Mv14)0.6760.0032
Mw4M_Hap_9 (Mw3); M_Hap_10 (Mw1, Mw2, Mw4)0.5000.0038
Mc15M_Hap_11 (Mc1- Mc3, Mc5, Mc8, Mc9, Mc12, Mc13, Mc15); M_Hap_12 (Mc4); M_Hap_13 (Mc6, Mc7, Mc10, Mc14); M_Hap_14 (Mc11)0.6000.0027
Total65 0.8960.0081
Mt: Shih-Man reservoir in Taoyung county; Ms: Sum-Moon Lake in Nanto county; Mv: Tseng-Wen reservoir in Tainan county; Mw: Wu-San-Tao reservoir in Tainan county; Mc: Chen-Chin Lake in Kaohshing City.
Table 5. Relative to Neodiaptomus schmackeri (out-group), the genetic distance between different populations of Mongolodiaptomus birulai is indicated by the COI gene. The distance was calculated using the Kimura 2-parameter (transition + transversion) method.
OutMtMsMvMw
Mt0.245
Ms0.2410.013
Mv0.2380.0070.010
Mw0.2390.0080.0110.004
Mc0.2500.0040.0160.0100.011
Mt: Shih-Man reservoir in Taoyung county; Ms: Sum-Moon Lake in Nanto county; Mv: Tseng-Wen reservoir in Tainan county; Mw: Wu-San-Tao reservoir in Tainan county; Mc: Chen-Chin Lake in Kaohshing City.
Table 6. The population differentiation parameter (Fst) and gene flow parameter (Nm, in parentheses) between different populations of Mongolodiaptomus birulai. The values were calculated based on the COI gene according to the method of Hudson et al. [22].
MtMsMvMw
Ms0.86212 (0.04)
Mv0.64317 (0.14)0.77591 (0.07)
Mw0.64157 (0.14)0.76538 (0.08)0.05831 (4.04)
Mc0.40066 (0.37) 0.86670 (0.04)0.71143 (0.10)0.70534 (0.10)
Mt: Shih-Man reservoir in Taoyung county; Ms: Sum-Moon Lake in Nanto county; Mv: Tseng-Wen reservoir in Tainan county; Mw: Wu-San-Tao reservoir in Tainan county; Mc: Chen-Chin Lake in Kaohshing City.
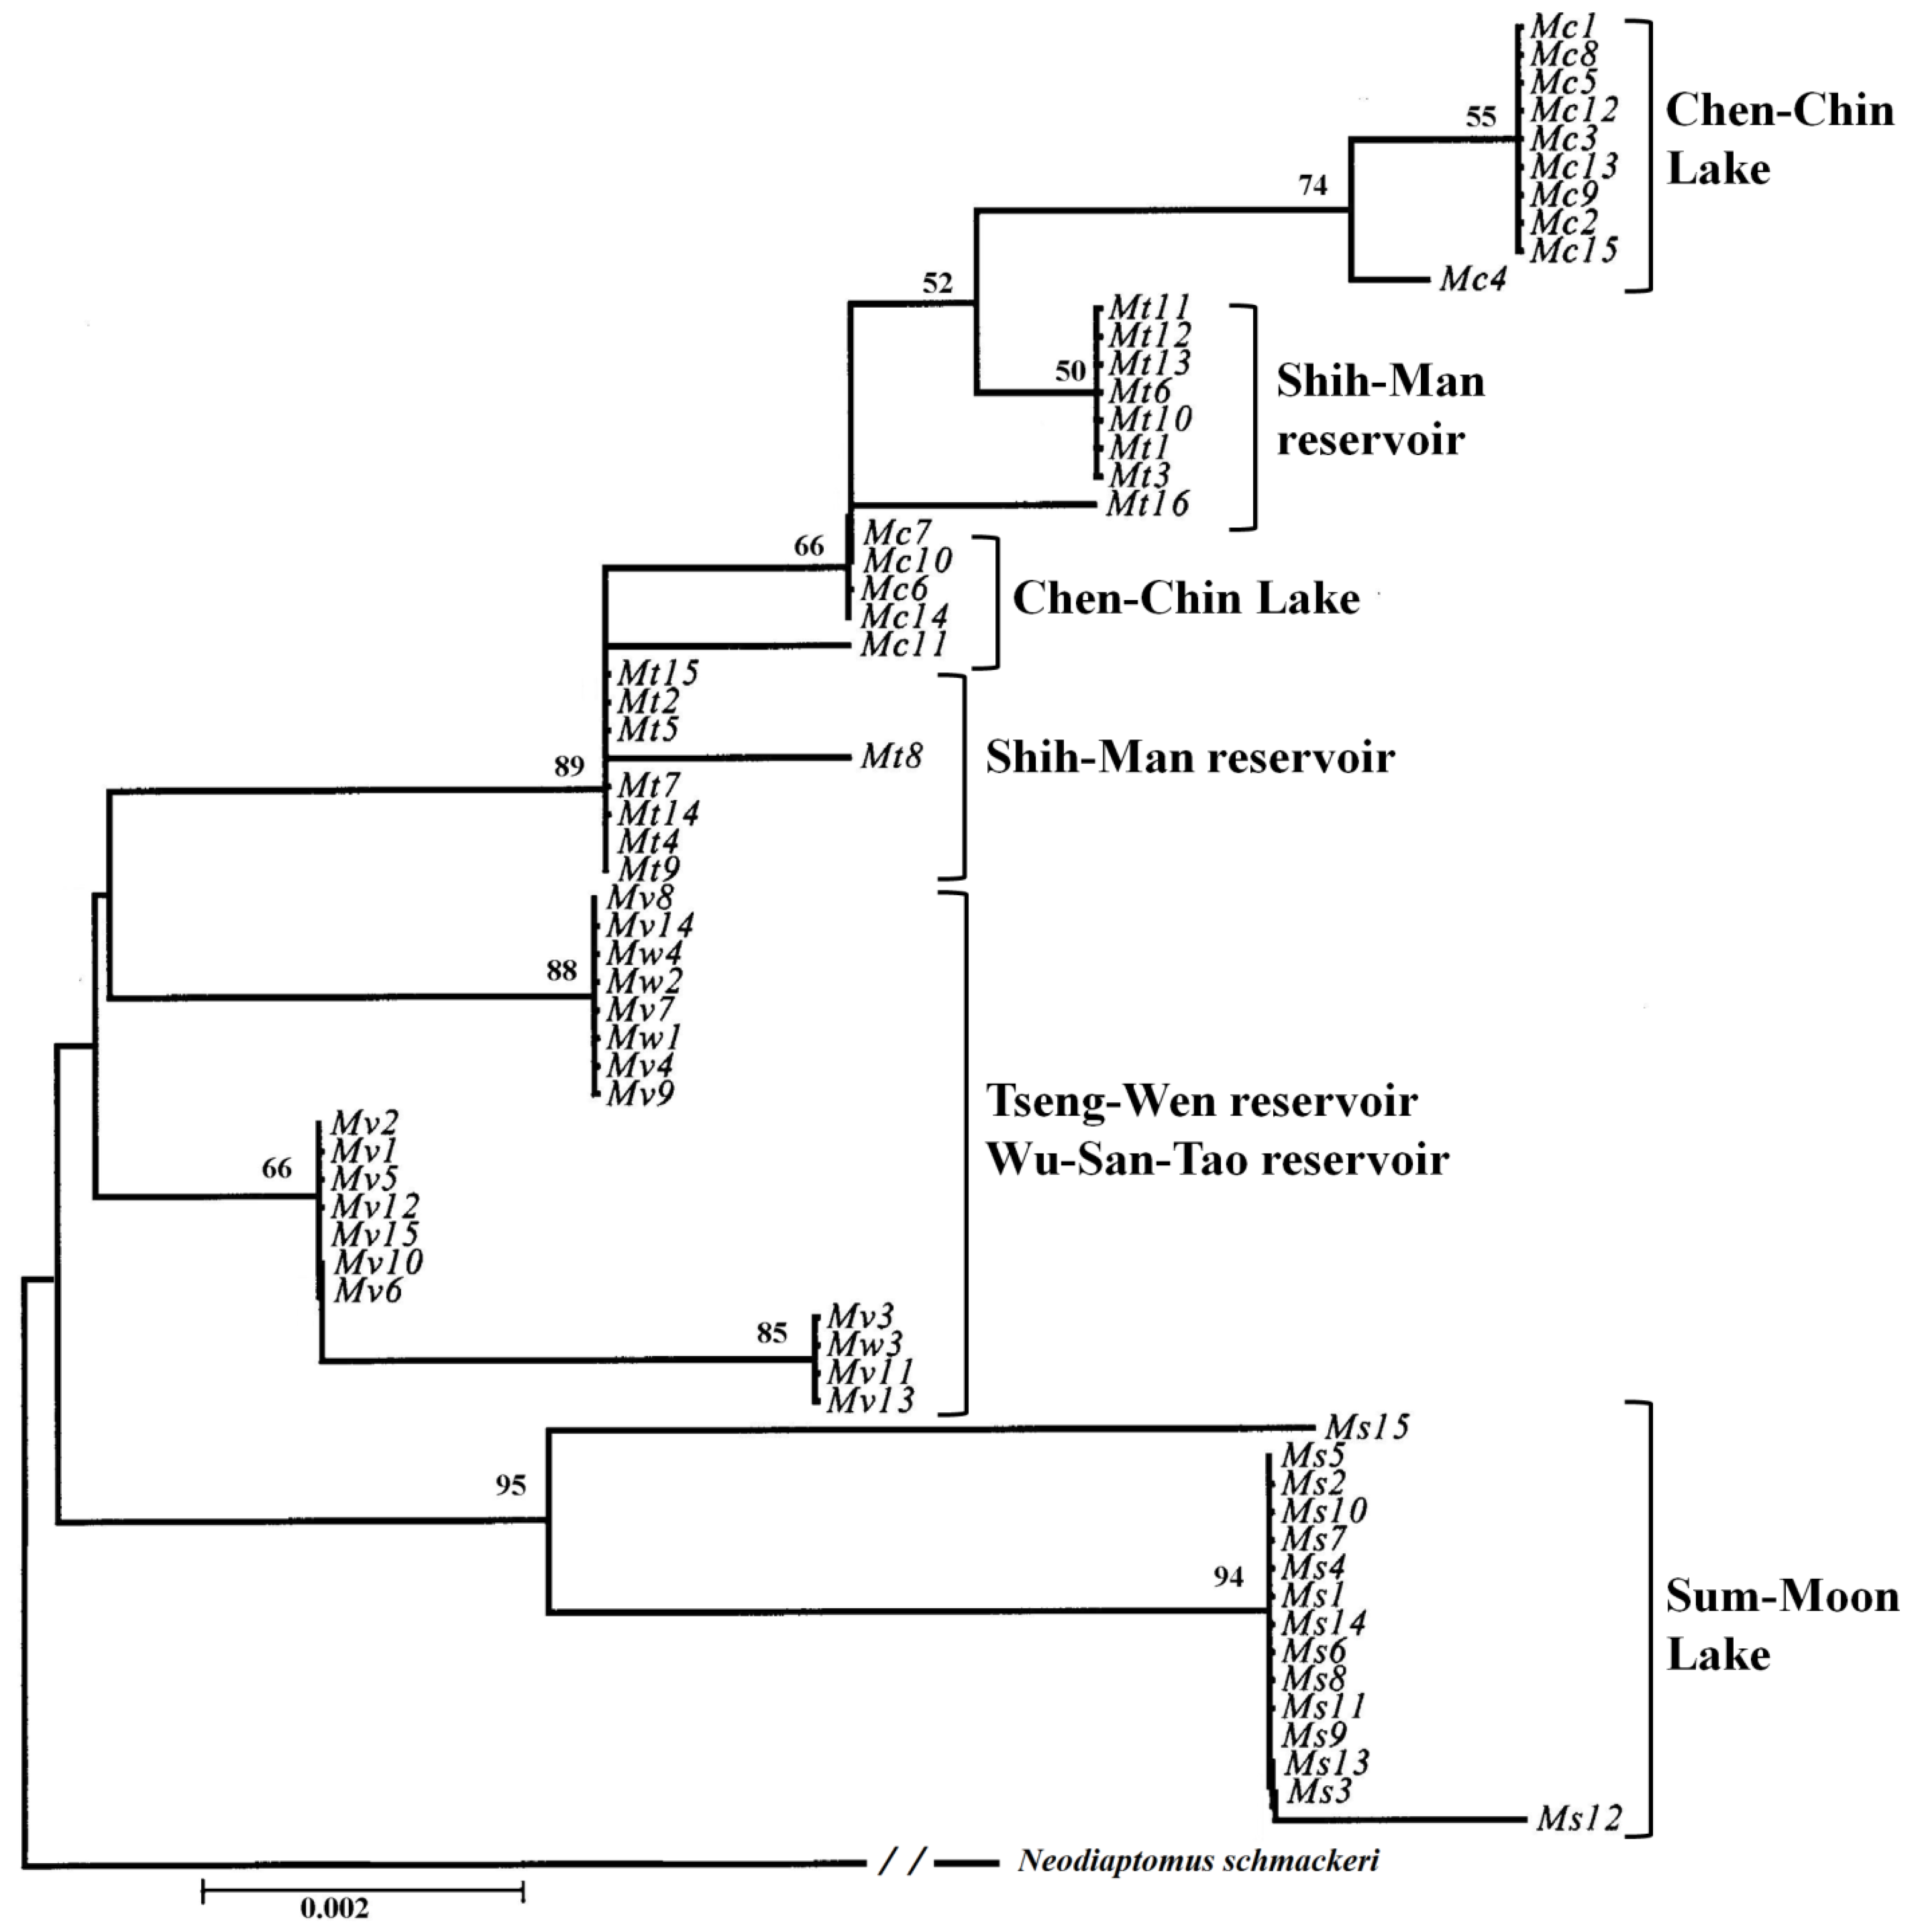
The neighbor-joining geophylogenetic tree was constructed from Kimura 2-parameter estimation of genetic distance (Figure 4). All the populations are located on the western side of Taiwan with no high-mountain-area separation. The population of Sun-Moon Lake was the most basal with the highest Fst and lowest Nm between other populations. Tseng-Wen reservoir and Wu-Sa-Tao reservoir are linked by a channel, and their populations share the same genetic characteristics. Shih-Man reservoir (northern Taiwan) and Chen-Chin Lake (southern Taiwan) are separated by a long distance, but the genetic structure of their populations were close. The minimum spanning network (MSN) had two major groups: the first was Chen-Chin Lake and Shih-Man reservoir mixed together; the second was composed of Tseng-Wen reservoir, Wu-San-Tao reservoir and Sun-Moon Lake (Figure 3). The second group was centered on Tseng-Wen reservoir (including Wu-San-Tao, as they share the same haplotype), and the longest connection length was between Tseng-Wen and Sun-Moon Lake, with two different lineages.
Figure 4. The geophylogenetic tree of Mongolodiaptomus birulai by the neighbor-joining method [23] based on the Kimura 2-parameter process with 1,000 bootstraps.
Diversity 05 00796 g004

4. Discussion

Based on the mtDNA COI gene sequence, Nei’s genetic distance between N. schmackeri and M. birulai is 0.23; this distance was smaller than that of some other groups of organisms between two different genera [28,29,30]. Thrope and Sole-Cava [30] suggested that a genetic distance of below 0.11 indicates conspecificity and one of above 0.22 corresponds to interspecific differentiation for invertebrates. For N. schmackeri, the genetic distance between each population ranged from 0.013 to 0.058 and that for M. birulai ranged from 0.004 to 0.016. Ferguson [31] suggested that the use of genetic distance to infer separate species or several populations belonging to a single species is not parsimonious. The theoretical foundations are not well understood, and this method cannot be applied over a wide range of organisms.
The nucleotide diversity (π) was calculated for all samples combined: π for N. schmackeri was 0.027, which was larger than that of M. birulai (0.008). We did not have N. schmackeri in Taiwan before 1940, based on the historical records. The higher diversity found in N. schmackeri may result by the founder effects of recent dispersion. At our sampling sites, if the dominant species was N. schmackeri, there was no M. birulai; conversely, if the dominant species was M. birulai, a minor population of N. schmackeri could coexist. The population genetic structure of M. birulai was more stable, with a larger population size, a wider distribution and a higher gene flow between subpopulations.
For N. schmackeri, Fst was 0.938 and Nm was 0.02 for all population pairs, and each population was isolated from the others, with little gene exchange. Relative to other reservoirs, Bao-Shan only had one haplotype and had the highest Fst and lowest Nm values (0.95–0.99; 0–0.01) compared with the other populations, isolated in recent years with no gene exchange. For M. birulai, Fst was 0.719 and Nm was 0.10 for all population pairs, and no population was seriously isolated from any of the others, as was the case for N. schmackeri. Sun-Moon Lake had the highest Fst (0.765–0.886) relative to the other populations. Tseng-Wen reservoir and Wu-San-Tao reservoir belong to the same river system and are linked by a canal; that could explain why they share most of the haplotypes and the greater gene flow and population differentiation with the lowest Fst (= 0.058) and highest Nm (= 4.40) values.
Freshwater zooplankton distributed in lakes or ponds are not always connected to each other, and the dispersal ability of zooplankton may vary in different groups of organisms. Recent studies have suggested that water birds could assist in the long-distance dispersal of rotifers, nematodes, mollusks, cladocerans and bryozoans [8]. Most copepods live in inland waters, and dispersal may be mediated by flooding or locally-connected water channels [32,33,34,35]. Flooding can transport individuals to a wide range of lowland areas, and some can be buried in hyporheic sediment and secondarily emerge in surface water [36]. Flooding is more common in lowland areas, and in reservoirs or highland lakes, dispersal and the establishment of populations may depend on river systems or dispersal methods other than flooding and carrying by birds. Therefore, these populations in reservoirs or lakes tend to be isolated from each other to differing degrees, owing to limited dispersal and low levels of gene flow, and the genetic structure of each population will be unique. Havel and Shurin [37] suggested that the dispersion of freshwater zooplankton between wetlands with a limited distance gap (short distance; <10 km) is more rapid than a longer distance one. Relative to wetlands, dryer habitats with a gap longer than 10 km means that more isolated water bodies may constrain the geographical range and influence of the metapopulation structure. All of our sampling sites were further than 10 km apart and were isolated by different river systems, with the exception of Tseng-Wen reservoir and Wu-San-Tao reservoir.
Limited dispersal mechanisms may not wholly account for genetic divergence. De Meester et al. [38] proposed a monopolization hypothesis to explain a dispersal-gene flow paradox for freshwater invertebrates, that despite evidence of a high dispersal capacity, restricted gene flow is observed among multiple taxa. In the monopolization hypothesis, the early colonists develop such large populations that genetic contributions from later colonists are mathematically minor. De Meester et al. [38] also emphasize the importance of the role of local adaptation, highlighted by recent studies in zooplankton evolutionary ecology.
According the geophylogenetic trees and MSNs, the groupings of different sites were not based on geographical distance, as is usually the case; they were more or less constructed as according to the length of time for which the reservoir has been in use (Table 7). Both species were centered on Wu-San-Tao reservoir (the oldest reservoir in Taiwan that is still functioning), and the terminal groups were the younger reservoirs, which came into use more recently. This could also explain how N. schmackeri in the youngest of the reservoirs, Bao-Shan, had no haplotypic and nucleotidic diversity. The transporting of individuals to form new populations may depend on human activity, and a serial linage may be caused by the movement of construction machines containing water from reservoirs previously worked on. Another medium of transportation is the fishery industry at each reservoir: humans deliver living fish to the reservoir along with water, and some plankton may be transported to the new habitat in this way.
Table 7. Collection site for each population and construction time of each reservoir.
Site of collectionTypeTime of constructionSPWater source
Lee-Yu-TanlakeunknownNSHualienchi
Wu-San-Taoreservoir1930NS, MBTsengwenchi
Sum-Moon Lakereservoir1934MBHsilochi
Chen-Chin Lakereservoir1943MBKaopingchi
Shih-Manreservoir1964NS, MBTahanchi
Ming-Derreservoir1970NSHoulungchi
Tseng-Wenreservoir1973MBTsengwenchi
Bao-Shanreservoir1985NSTouchienchi
NS, Neodiaptomus schmackeri; MB, Mongolodiaptomus birulai.

Acknowledgments

We thank the National Science Council of the Republic of China for their grant (87-2311-B-134-001) to support part of this work.

Conflicts of Interest

The authors declare no conflict of interest.

References

  1. Daniel, L.H.; Clark, A.G. Principles of Population Genetics, 4th ed.; Sinauer Associates Inc.: Sunderland, MA, USA, 2007; pp. 45–92. [Google Scholar]
  2. Hamilton, M.B. Population Genetics; Wiley Blackwell Press: Hoboken, NJ, USA, 2009; pp. 9–51. [Google Scholar]
  3. Levins, R. Some demographic and genetic consequences of environmental heterogeneity for biological control. Bull. Entomol. Soc. Am. 1969, 15, 237–240. [Google Scholar]
  4. MacArthur, R.H.; Wilson, E.O. The Theory of Island Biogeography; Princeton University Press: Princeton, NJ, USA, 1967; pp. 19–67. [Google Scholar]
  5. Hanski, I. Metapopulation dynamics. Nature 1998, 396, 41–49. [Google Scholar]
  6. Van Nouhuys, S. Metapopulation Ecology. In Encyclopedia of Life Sciences (ELS); John Wiley & Sons, Ltd.: Chichester, UK, 2009. [Google Scholar] [CrossRef]
  7. Bohonak, A.J.; Jenkins, D.G. Ecological and evolutionary significance of dispersal by freshwater invertebrates. Ecol. Lett. 2003, 6, 783–796. [Google Scholar] [CrossRef]
  8. Green, A.J.; Figuerola, J. Recent advances in the study of long-distance dispersal of aquativ invertebrates via birds. Divers. Distrib. 2005, 11, 149–156. [Google Scholar] [CrossRef]
  9. Kiefer, F. Susswassercopoden aus Ostassien, II. Neue Diaptomiden und Cyclopiden von der Insel Formosa. Zool. Anz. 1937, 119, 58–64. [Google Scholar]
  10. Kiefer, F. Freilebende Ruderfusskrebes (Crustacea Copepoda) von Formosa. Bull. Biogeogra. Soc. Jap. 1938, 8, 35–38. [Google Scholar]
  11. Young, S.S.; Shih, C.T. Freshwater calanoids (Copepoda) of Taiwan with some comments on the morphology of Neutrodiaptomus tumidus Kiefer, 1937 observed by SEM. Crustac. Mongr. 2012, 16, 545–566. [Google Scholar]
  12. Braga, E.; Zardoya, R.; Meyer, A.; Yen, J. Mitochondrial and nuclear rRNA based copepod phylogeny with emphasis on the Euchaetidae (Calanoida). Mar. Biol. 1999, 133, 79–90. [Google Scholar] [CrossRef]
  13. Bucklin, A.; Frost, B.W. Molecules versus Morphology: A Comparative View of Evolution Within and Among Calanoid Copepod Species. In Proceedings of the 8th International Conference on Copepoda, Keelung, Taiwan, 21–26 July 2002; Abstract Book. p. 23.
  14. Bucklin, A.; Kaartvedt, S.; Guarnieri, M.; Goswami, U. Population genetics of drifting (Calanus spp.) and resident (Acartia clausi) plankton in Norwegian fjords. J. Plankton. Res. 2000, 22, 1237–1251. [Google Scholar] [CrossRef]
  15. Bucklin, A.; Frost, B.W.; Kocher, T.D. Molecular systematics of six Calanus and three Metridia species (Calanoida: Copepoda). Mar. Biol. 1995, 121, 655–664. [Google Scholar] [CrossRef]
  16. Bucklin, A.; Wiebe, P.H. Low mitochondrial diversity and small effective population sizes of the copepods Calanus finmarchicus and Nannocalanus minor: Possible impact of climatic variation during recent glaciation. J. Hered. 1998, 89, 383–392. [Google Scholar] [CrossRef]
  17. Folmer, O.; Black, M.; Hoeh, W.; Lutz, R.; Vrijenhoek, R. DNA primers for amplification of mitochondrial cytochrome c oxidase subunit I from diverse metazoan invertebrates. Mol. Mar. Biol. Biotechnol. 1994, 3, 294–199. [Google Scholar]
  18. Eyun, S.I.; Soh, H.Y.; Suh, H.L.; Lee, Y.H. Molecular phylogeny of the Korean Pseudodiaptomid Copepods (Calanoida): An Assessment Based on COI Sequences. In Proceedings of the 8th International Conference on Copepoda, Keelung, Taiwan, 21–26 July 2002; Abstract Book. p. 45.
  19. Gerken, S.; Wyngaard, G.; Rocha, C.E.F. A molecular phylogeny of the cyclopinae, with a comment on possible relevance of chromation diminution on rates of speciation. In Proceedings of the 8th International Conference on Copepoda, Keelung, Taiwan, 21–26 July 2002; Abstract Book. p. 47.
  20. Tamura, K.; Dudley, J.; Nei, M.; Kumar, S. MEGA4: Molecular evolutionary genetics analysis (MEGA) software version 4.0. Mol. Biol. Evol. 2007, 24, 1596–1599. [Google Scholar] [CrossRef]
  21. Nei, M. Molecular Evolutionary Genetics; Columbia University Press: New York, NY, USA, 1987; pp. 21–132. [Google Scholar]
  22. Wright, S. Evolution and Genetics of Populations, vol. 4. Variability in and Among Natural Populations; University of Chicago Press: Chicago, IL, USA, 1978. [Google Scholar]
  23. Hudson, R.R.; Slatkin, M.; Maddison, W.P. Estimation of levels of gene flow from DNA sequence data. Genetics 1992, 132, 583–589. [Google Scholar]
  24. Saitou, N.; Nei, M. Neighbor-joining method. Mol. Biol. Evol. 1987, 4, 406–425. [Google Scholar]
  25. Schneider, S.; Roessli, D.; Excoffier, L. ARLEQUIN, A Software for Population Genetics Data Analysis, Version 2.000; Genetics and Biometry Laboratory, University of Geneva: Geneva, Switzerland, 2000. [Google Scholar]
  26. Tajima, F. Statistical method for testing the neutral mutation hypothesis by DNA polymorphism. Genetics 1989, 123, 585–595. [Google Scholar]
  27. Fu, Y.X.; Li, W.H. Statistical tests of neutrality of mutations. Genetics 1993, 133, 693–709. [Google Scholar]
  28. Shaklee, J.B.; Tamaru, C.S.; Waples, R.S. Speciation and marine fishes studied by the electrophretic anaiysis of protein. Pacif. Sci. 1982, 36, 141–157. [Google Scholar]
  29. Brussard, P.F.; Ehrlich, P.R.; Murphy, D.D.; Wilcox, B.A.; Wright, J. Genetic distances and the taxonomy of checkerspot butterflies (Nymphalidae: Nymphalinae). J. Kansas Entomol. Soc. 1985, 58, 403–412. [Google Scholar]
  30. Thrope, J.P.; Sole-Cava, A.M. The use of allozyme electrophoresis in invertebrate systematics. Zool. Scr. 1994, 23, 3–18. [Google Scholar] [CrossRef]
  31. Ferguson, J.W.H. On the use of genetic divergence for identifying species. Biol. J. Linn. Soc. 2002, 75, 509–516. [Google Scholar] [CrossRef]
  32. Forbes, A.E.; Chase, J.M. The role of habitat connectivity and landscape geometry in experimental zooplankton metacommunities. Oikos 2002, 96, 433–440. [Google Scholar] [CrossRef]
  33. Frisch, D. Dormancy, dispersal and survival of cyclopoid copepods (Cyclopida, Copepoda) in lowland fooldplain. Fresh. Biol. 2002, 47, 1269–1281. [Google Scholar] [CrossRef]
  34. Frisch, D.; Therlkeld, S.T. Flood-mediated dispersal versus hatching: Early recolonisation strategies of copepods in floodplain ponds. Fresh. Biol. 2005, 50, 323–330. [Google Scholar] [CrossRef]
  35. Michels, E.; Cottenie, K.; Neys, L.; Meester, L.D. Zooplankton on the move: First results on the quantification of dispersal of zooplankton in a set of interconnected ponds. Hydrobiol. 2001, 442, 117–126. [Google Scholar] [CrossRef]
  36. Dole-Olivier, M.J. Surface water-groundwater exchange in three dimensions on a backwater of the Rhone River. Fresh. Biol. 1998, 40, 93–109. [Google Scholar] [CrossRef]
  37. Havel, J.E.; Shurin, J.B. Mechanisms, effects and scales of dispersal in freshwater zooplankton. Limnol. Oceanogr. 2004, 49, 1229–1238. [Google Scholar] [CrossRef]
  38. De Meester, L.; Gómez, A.; Okamura, B.; Schwenk, K. The Monopolization hypothesis and the dispersal-gene flow paradox in aquatic organisms. Acta Oecol. 2002, 23, 121–135. [Google Scholar] [CrossRef]