Review

Insights into Hemoglobin Polymorphism and Related Functional Effects on Hematological Pattern in Mediterranean Cattle, Goat and Sheep

by
Elisa Pieragostini
1,*,
Ingrid Alloggio
1 and
Ferruccio Petazzi
2
1
Department of Engineering and Management of the Agricultural, Livestock and Forest Systems, University of Bari, Via Amendola, 165/A, 70126 Bari, Italy
2
Department of Public health and Animal breeding, University of Bari, Provinciale per Casamassima, Km 3. Valenzano, 70010 Bari, Italy
*
Author to whom correspondence should be addressed.
Diversity 2010, 2(4), 679-700; https://doi.org/10.3390/d2040679
Submission received: 3 March 2010 / Revised: 16 April 2010 / Accepted: 19 April 2010 / Published: 22 April 2010
(This article belongs to the Special Issue Biological Diversity Assessed by Molecular Methods)

Abstract

:
This report is a review of some of the results obtained over the course of 20 years spent investigating hemoglobin phenotypes and the related functional effects on hematological patterns in ruminant breeds. Tests included qualitative and quantitative analyses of hemoglobins and qualitative and quantitative analyses of α and β globins, as well as hemochromocytometric analysis. Understanding the adaptive significance of the hemoglobin variants was the goal of most of these investigations. The advances presented in this review and the previously unpublished findings included here provide evidence that Mediterranean breeds exhibit a fair number of positively charged variants, whose possible adaptive significance is discussed.

Graphical Abstract

1. Introduction

Southern Italy’s native farm animals are generally characterized by tolerance to diseases, tolerance to fluctuations in food and water availability, and adaptation to poor management conditions. Unfortunately, many of them have experienced a population decline and several are at risk of extinction. Being aware that the success of conservation depends on understanding the reasons for a breed to be conserved, our aim has always been to concentrate upon the characterization of these gene pools and to assess, if possible, their uniqueness. Understanding the relationship of breeds to various agricultural settings is key to appreciating and fostering performance and survival [1].
Moreover, concerns regarding animal welfare need to be taken into account when anticipating the probable characteristics of future agricultural systems and potential animal breeding strategies [2]. It is generally acknowledged that more attention should be paid to the physiological measures of welfare, which include health, tolerance to environmental conditions such as pedoclimatic aspects and enzootic parasites. According to Petazzi et al. [3], the choice of genetically adapted breeds is a prerequisite for a basic condition of well-being in whatever environment.
Blood and blood components are undoubtedly essential biological characteristics and warrant consideration for the study of a breed. Studying the hematological picture is helpful for clinical diagnostics [4,5], but it is also essential to reflect the particular evolution of a breed or a population; actually, the fact that some blood factors are related to the suitability of the breeds under particular environmental conditions has been repeatedly suggested [6,7,8,9,10].
Thanks to its accessibility and obvious biological importance, hemoglobin (Hb) has been one of the most studied polymorphisms in vertebrate species since the infancy of both population and evolutionary genetics. However, owing to the close relationship between structure and function, this complex protein remains a fascinating subject from all points of view and especially in terms of its molecular, genetic and adaptive features. Accordingly, Hb has been recently defined “an evergreen red protein” [11].
Regarding domestic animal species, research has progressively turned to focusing on molecular polymorphisms, which seem more suitable for selection and breeding strategies. Annotation of protein mutations with their relevance for phenotypic expression has thus been long neglected; but now, an apparently inverse trend seems to be taking place. Recently, growing attention has been focused on functional genetics, an area that is recurrently included amongst animal breeding research priorities. The functional effect of the Hb phenotype on hematological patterns has been demonstrated in humans as well as in mammalian species. Particularly in sheep, individuals carrying extra alpha-globin genes exhibit an overall blood picture mimicking a thalassemia-like syndrome [12], while positively charged variants have been found to be somehow related to a decreased mean corpuscular volume and hematocrit value [13].
Southern Italian native livestock are fairly polymorphic at either or both of the alpha and beta globin genes [13,14,15,16,17,18,19]; unfortunately, the variability recorded cannot be reasonably compared with the data in the literature where the results obtained reflect different performances of various analytical procedures.
Based on the above consideration, this work reports some of the results obtained regarding Hb polymorphism in ruminant Mediterranean native breeds obtained over the course of 20 years. The findings have been reviewed in the light of the functional effects of Hb and the common charged variants emphasized.

1.1 Highlights of Ruminant Hemoglobin Molecular Genetics

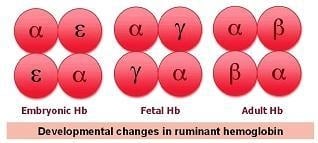
Adult Hb is composed of four subunits, two α-globin subunits and two β-globin subunits, and the interaction between these subunits dictates many oxygen binding characteristics of the protein. Unlike adults, however, embryos and fetuses cannot breathe for themselves, and thus have very different oxygen transport requirements. To accommodate this, the Hb of placental mammals has a high affinity for oxygen before birth, which is helpful for loading oxygen into the blood. After birth and the development of the cardiorespiratory system, Hb oxygen affinity decreases. This change in Hb function occurs because there are different forms of the Hb subunits, which arose from duplications of ancestral genes, and their expression changes throughout development.
According to Goodman et al. [20], the amino acid sequences of the α-globins and β-globins are approximately 50% identical, regardless of which vertebrate species is the source, arguing that these two genes are descended from a common ancestor about 450 million years ago, in the ancestral jawed vertebrate. The genes encoding the globins are clustered, with the α-like globin gene cluster on a different chromosome from the β-like globin gene cluster in birds and mammals.
It is generally acknowledged that the α-globin system in mammals is arranged in tandemly duplicated alpha globin genes, which are concurrently expressed, while the genes in the beta globin locus are arranged sequentially from 5’ to 3’: beginning with the gene expressed in embryonic development (called episolon) and ending with the adult beta globin gene. In ruminants as well as in human and in other mammalian species, the α-globin cluster is located on chromosome 25 while the β-globin cluster is positioned on chromosome 15 [21].
The α-globin gene clusters consist of two a-globin genes (HBA1 and HBA2), which are expressed at different levels: the upstream gene being the most efficient. This trend is confirmed in sheep, where extra numeral arrangements, such as α-globin gene triplication and quadruplication, are not unusual, and the α-chain output of the downstream genes progressively decreases [22,23].
Also the β-globin system of these small ruminants is worth mentioning. As a result of an unusual evolutionary history, the ovine β-globin gene cluster is differently arranged depending on the A or B haplotypes. In the A sheep as well as in goats, the β-globin locus consists of 12 genes, organized as a triplicated, developmentally expressed four-gene set. Sheep with the B haplotype have a locus arrangement consisting of a duplicated four gene set as the consequence of a recent deletion from a triplicated locus [24]. Similarly to goats, at birth the A sheep synthesize a juvenile hemoglobin C (HbC), which is produced at birth and exclusively during severe anaemia in adults. The B sheep do not synthesize HbC and continue to produce their adult Hb during anaemia. This is because B sheep lack the beta C gene as well as three other genes present both in A sheep and goats.

1.2 Cattle

Hemoglobin (Hb) was the first cattle protein polymorphism to be found with the alleles HBBA and HBBB [25,26,27]. Eight other HBB alleles have been reported; almost all of them are rare. These alleles are: HBBC [28,29], HBBD [30], HBBDZambia [31], (HBBG [32], HBBE [33], HBBI [34,35], HBBH [36], and HBBXBALI [37]) (Table 2). At the end of the last century, two new alpha and one beta globin variants were discovered in Italian Podolic cows, a Southern European grey breed that has been autochthonous to Southern Italy since the Early Middle Ages after the migration of Asian populations from the Far East to Italy. Of the new alpha globins, one was allelic to the wild-type gene HBA1 and the second to the wild type HBA2. The wild type genes encode for the same alpha globin, which has never been named. Thus, based on structure analyses and in agreement with what had been suggested in the guidelines for gene nomenclature in ruminants [38], we suggest placing the superscript on the right with the capital letter indicating the point mutation distinguishing the alleles to describe the as-yet unnamed cattle alpha genes. One of the two alpha globin variants presents a single amino acid substitution from asparagine to serine at position 131. In this position, most ruminant species exhibit an asparagine residue (N) [39], thus the wild-type has been identified with the acronym HBAN and the related variant as HBAS; accordingly, the other chain, where histidine is substituted by tyrosine at position 89 [15] has been named HBAY. An interesting polymorphism at the HBB locus was also detected in Italian Podolic cattle [16]. Structural analyses performed to provide the complete sequence of the beta globin chains and the results pointed out that the taurine HBBA globin allele identified in Hereford cattle [27] was co-present with the variant named HBBAZebu, found in Ongole and Banteng cattle [37] and characterized by the silent mutation 43Ser→Thr.
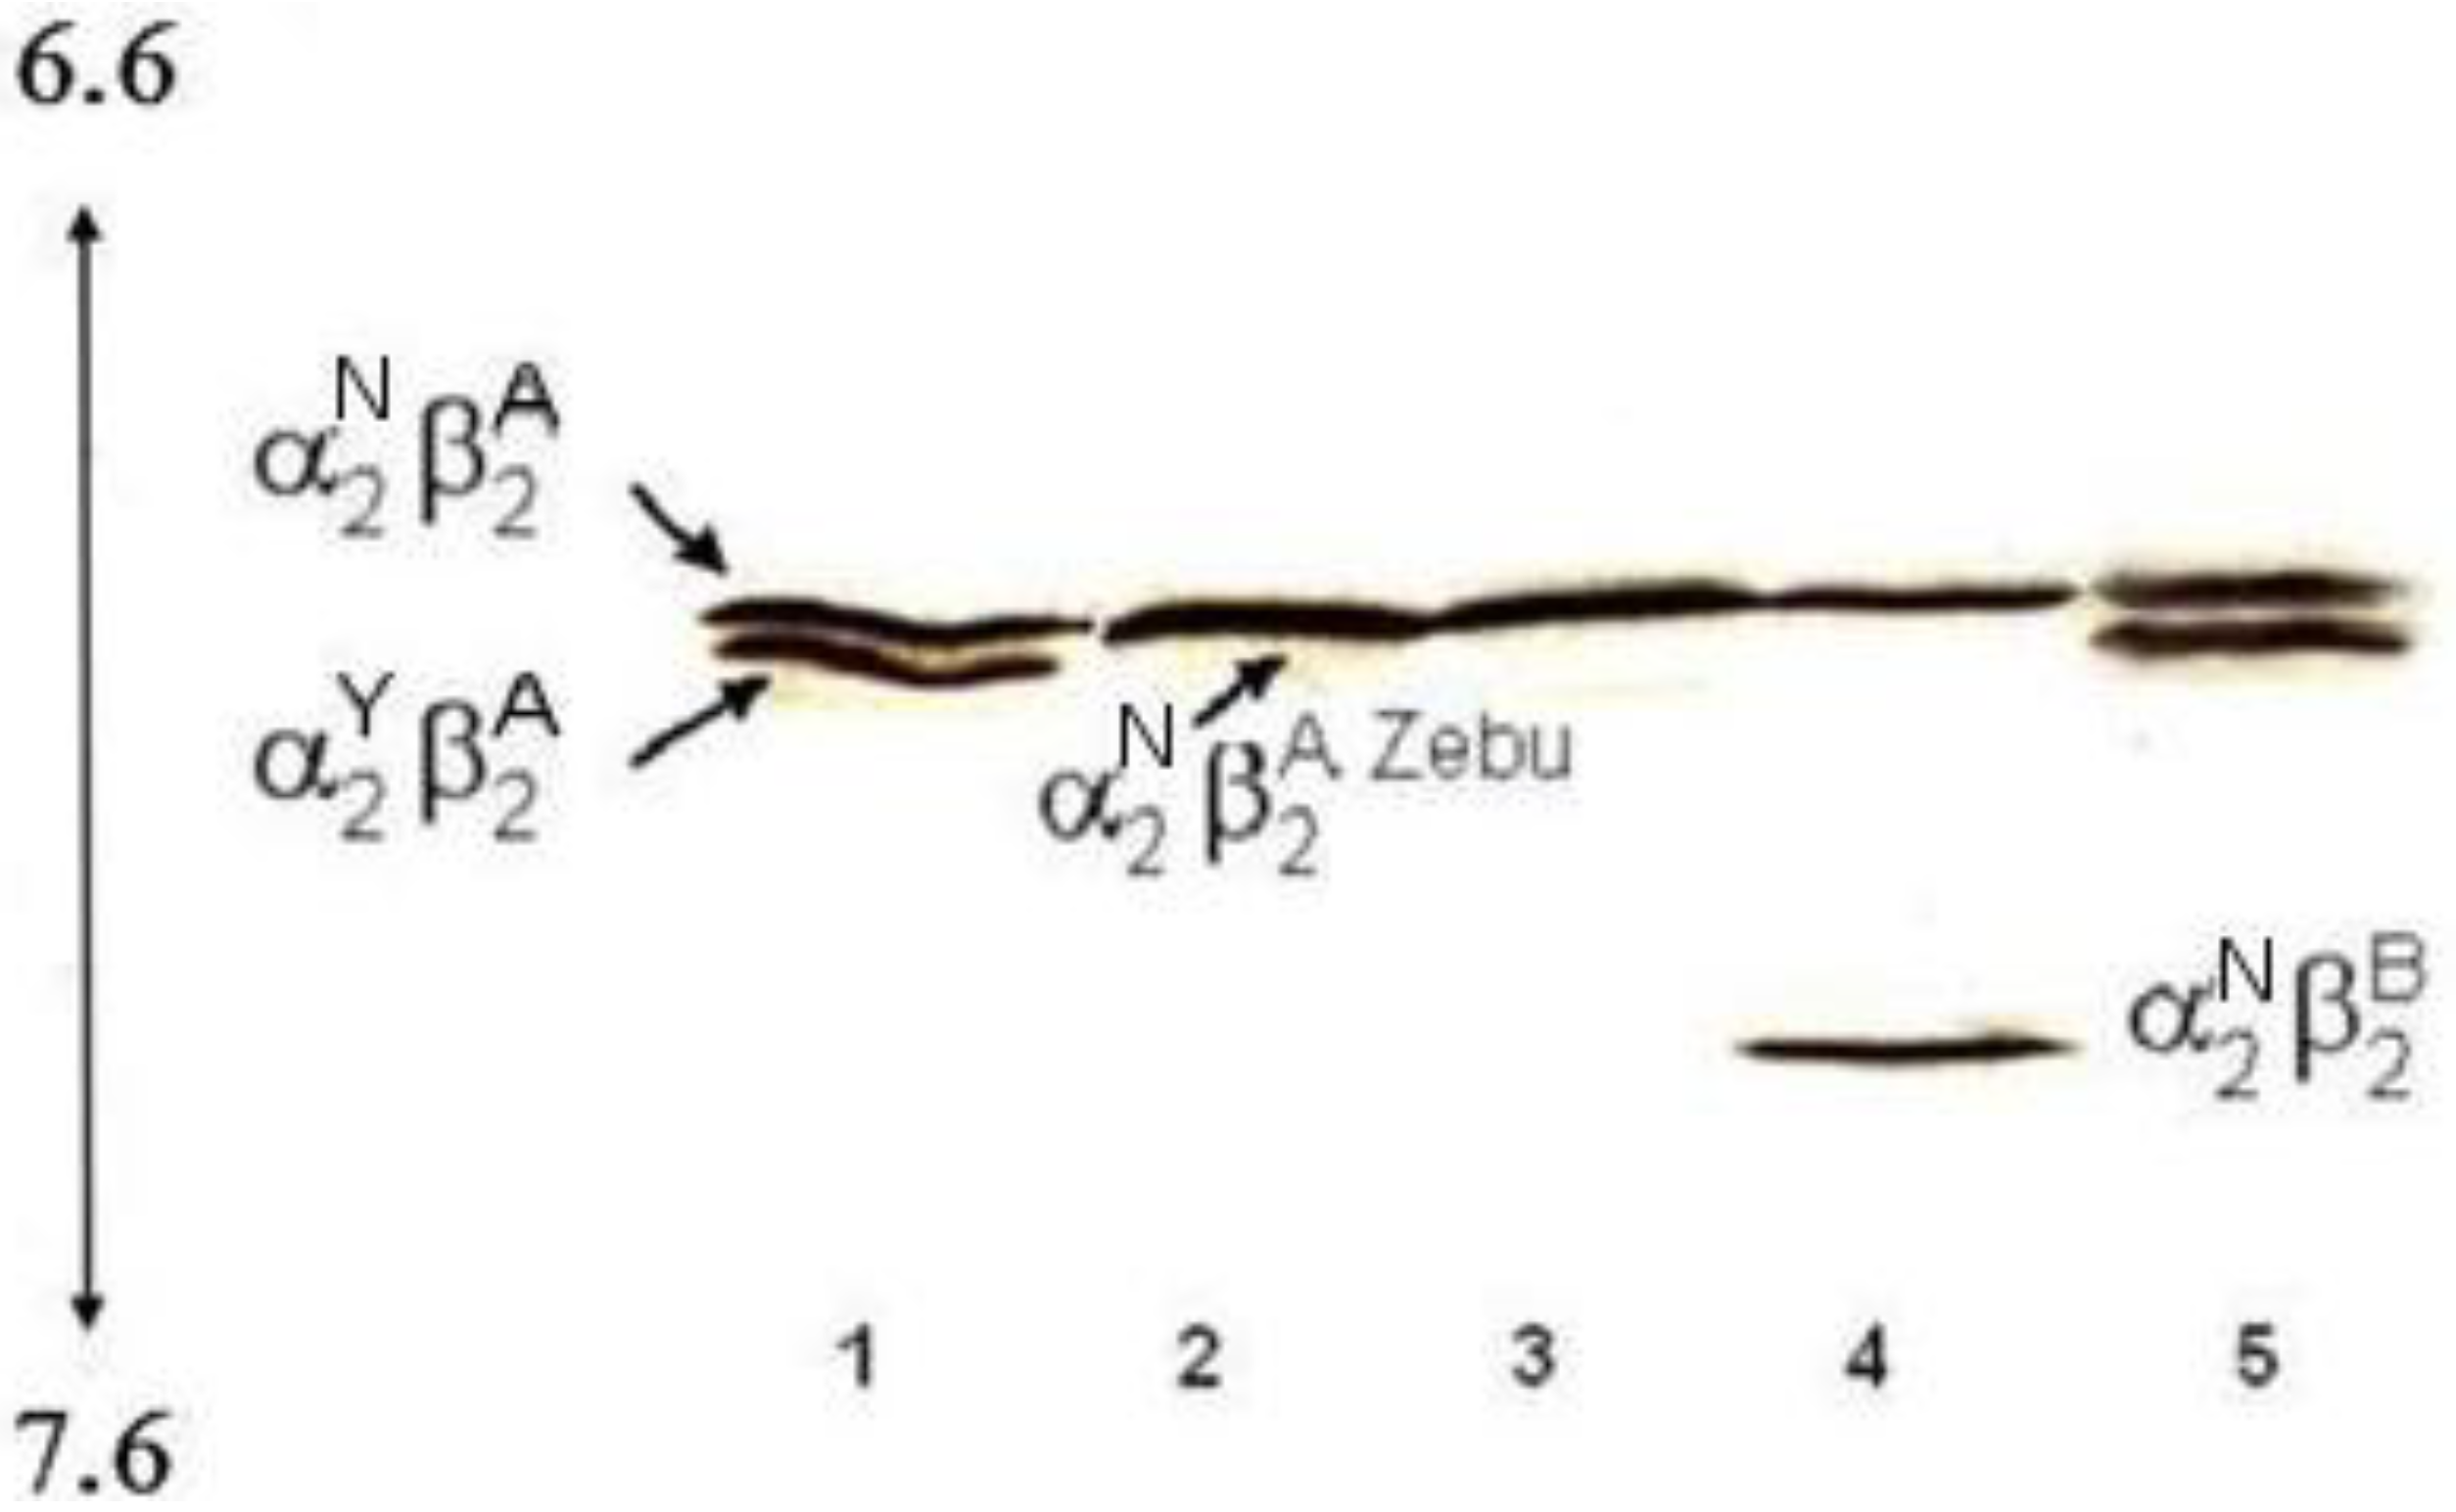
Both the HBAS and HBBAZebu encode for silent variants, which do not vary Hb electrophoretical mobility, while the hemoglobins containing the chain encoded by the HBAY are positively charged and may be electrophoretically detected (Figure 1). Table 1 and Table 2 summarize the alpha and beta globin polymorphism in cattle known so far and the related nomenclature.
Table 1. Nomenclature of alpha globin genes and products in cattle.
HBA1 LocusHBA2 Locus
Gene SymbolHBA1N HBA1YHBA2NHBA2S
Globin symbol IαNIαYIIαNIIαS
Hemoglobin nameunnamedHbYunnamedHbS
Table 2. Nomenclature of beta globin genes and products in cattle.
Gene SymbolGlobin chain responsible for the Hb nameHb nameReference
HBBAβAHbA[25,27]
HBBAZebuβAZebuHbAZebu[16,37]
HBBBβBHbB[26]
HBBCβCHbC[28,29]
HBBDβDHbD[30]
HBBDZambiaβD ZambiaHbDZambia[31]
HBBGβGHbG[32]
HBBEβEHbE[33]
HBBIβIHbI[34,35]
HBBHβHHbH[36]
HBBXBALIβX BaliHbXBali[37]
Figure 1. Polyacrylamide gel isoelectric focusing in a narrow pH range, 6.7–7.7, of cattle Hbs carrying different α and β globin chains. Lane 1: two non allelic alpha globins (the wild type IαN and the new variant IIαY) and one beta globin (βA) result in two Hb bands, αN2βA2 and αY2βA2; Lane 2: the same alpha globin encoded by non allelic genes (IαN and IIαN) and two beta globins characterized by the same electrophoretic mobility (βA and βAZebu) result in a single Hb band; Lane 3: the same alpha globin (αN) as in lane 2 and one beta globin (βA) result in single Hb band; Lane 4: the same alpha globin encoded by non allelic genes (IαN and IIαN) and two beta globins (βA and βB) result in two Hb bands, αN2βA2 and αN2βB2; Lane 5: the same as lane 1.
Diversity 02 00679 g001

1.3 Goats

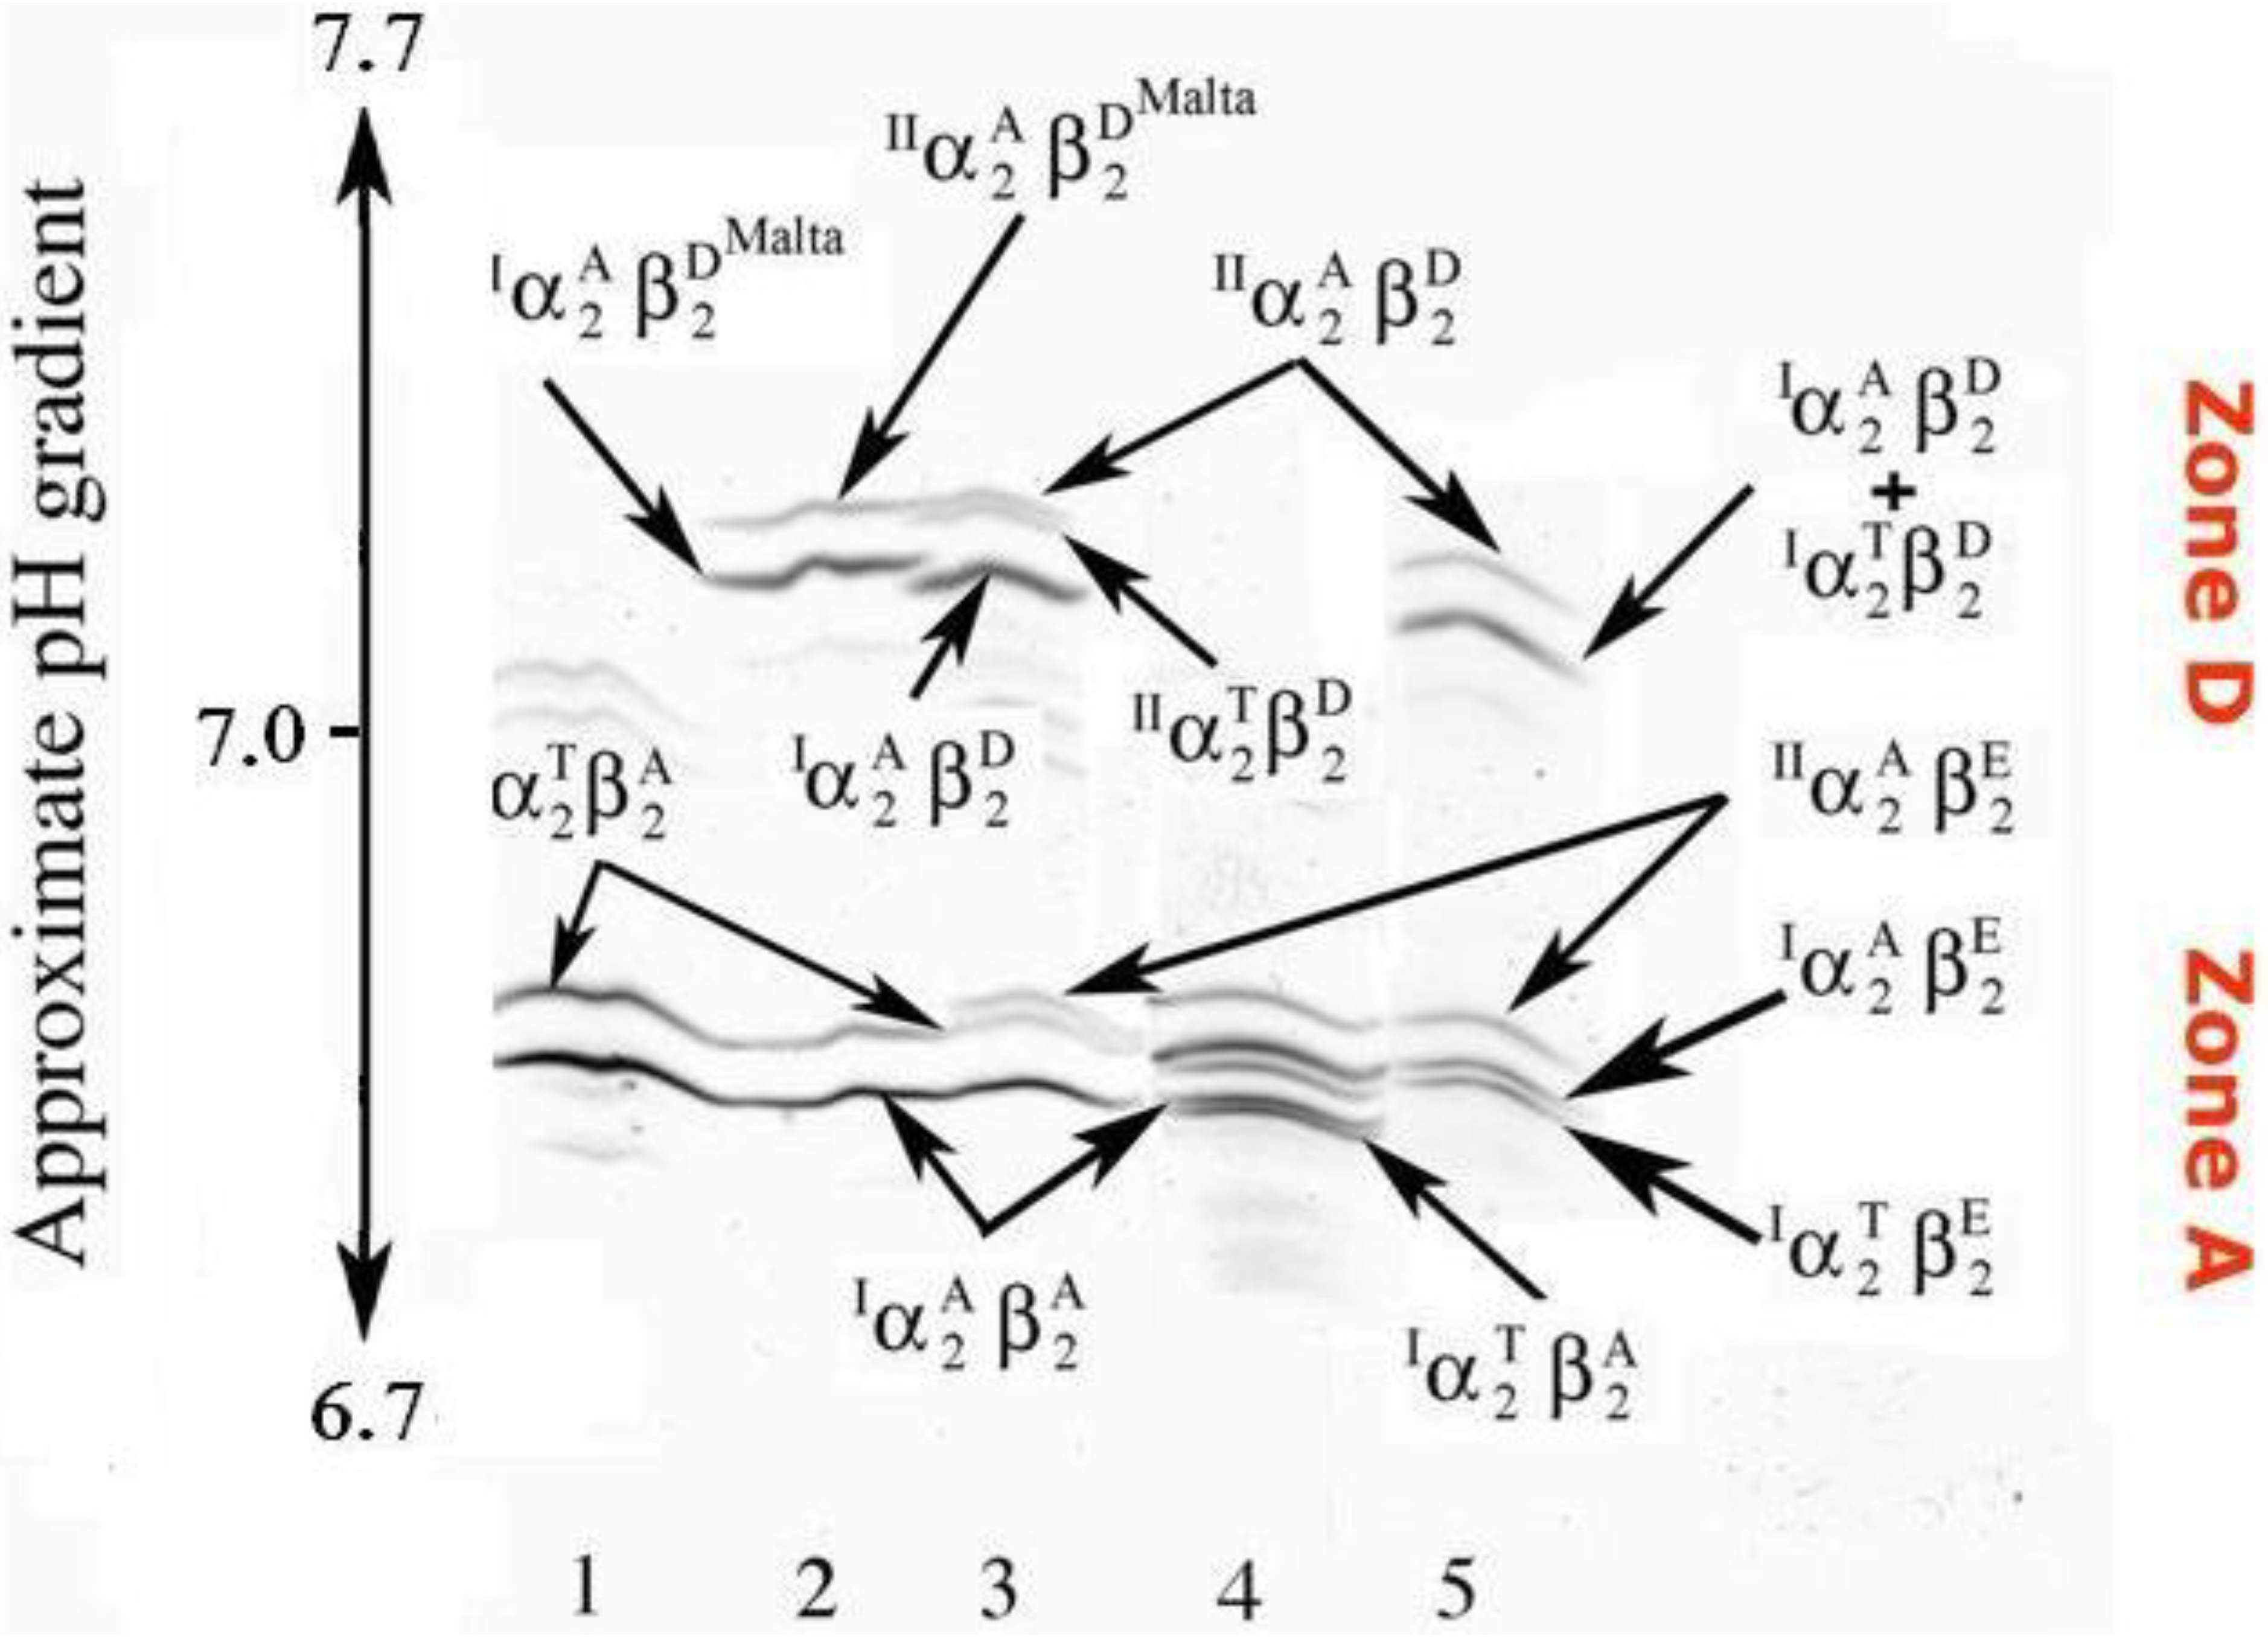
Goats exhibit a very complex Hb polymorphism due to the presence of a number of allelic and non allelic chains both in the alpha and beta globin systems [18,40,41,42,43,44,45]. Particularly, the HBB locus is highly polymorphic, while only four different alpha globin variants have been found so far: HBA1A and HBA2T, the most frequent genes (more than 0.98 and almost 0.80, respectively), followed by HBA2A (about 0.20) and HBA1B (very rare) [18]. However, all the possible tetramers resulting from combinations of the heterogeneity of alpha and beta globins resolve in two main electrophoretic zones, A and D, according to their different electrical properties (Figure 2). A group of positively charged tetramers such as HbB, HbD and HbDMalta migrate to the D zone, whose isoelectric point (pI) range is about pH 7.2 (Table 3). HbB results from an alpha chain variation due to the presence of the rare allele at the HBA1 locus whereas HbD and HbDMalta exhibit variation in the beta chain as a consequence of different point mutations at the HBB locus.
Table 3. Charged variants at the HBB locus in goats and corresponding hemoglobins with related molecular weight (MW) and isoelectric points (pI).
β-globinMutation versus βAMWHb nameHb pI
βA [40] 16,021.4HbA6.75
βD [41]20Asp > His16,043.46HbD7.17
βDMalta [44]69Asp > Gly15,963.37HbDMalta7.14
βE [41]86Gln > His; 103Lys > Arg; 124Leu > Val16,044.40HbE6.79
Figure 2. Polyacrylamide gel isoelectric (PAGIF) focusing on narrow pH range, 6.7–7.7, of goat hemoglobins carrying different α and β globin chains. Lane 1: two non allelic alpha globins (IαA and IIαT) and one beta globin (βA) resulting in two Hb bands, IαA2βA2 and IIαT2βA2; Lane 2: two non allelic alpha globins (IαA and IIαT) and two beta globins (βA and βDMalta) resulting in a twin couple of Hb bands, the former couple migrating to zone A (IαA2βA2 and IIαT2βA2) and the latter to zone D (IαA2β DMalta 2 and IIαT2β DMalta2); Lane 3: one non allelic alpha globin ( IαA), two allelic alpha globins ( IIαA and IIαT) and two beta globins (βA and βD) resulting in a twin triplet of Hb bands, with the former triplet migrating to zone A (IαA2βA2, IIαT2βA2 and IIαA2βA2) and the latter to zone D (IαA2βD2, IIαT2βA2 and IIαA2βD2); Lane 4: two allelic alpha globins (the wild type IαA and the new variant IαT), a non allelic alpha (IIαA) and two beta (βA and βE) resulting in six Hbs all migrating to zone A; Lane 5: the same alpha globins as in lane 4 (IαA, IαT and IIαA) but different beta globins (βE and βD) resulting in six Hbs, where the three tetramers containing the βE globin (IαT2βE2, IαA2βE2 and IIαA2βE2) migrate to zone A and the others containing the βD globin (IαT2βD2, IαA2βD2 and IIαA2βD2) migrate to zone D.
Diversity 02 00679 g002

1.4. Sheep

Four different α-globin [46,47,48] and eight β-globin chains [14,49,50,51,52,53,54,55] have been described in domestic sheep (Ovis aries). As for the β-globin chains, βC and βF are respectively encoded by the dormant gene HBBC [24] and by the gamma gene HBBF switched on during foetal life [55]. The remaining six globins are controlled by the HBB locus. Out of them, two are encoded by the HBBA and HBBG alleles located in the switching A haplotype while four are encoded by the HBBB, HBBE, HBBH, HBBI alleles in the B non-switching haplotype [56]. As to the α-globin chains, the qualitative polymorphism is additionally complicated by the presence of a quantitative variation related to the fact that non allelic loci produce unequal amounts of α-globin (Table 4).
Table 4. Nomenclature of alpha globin genes and products, and amino acid exchanges involved in the different variants, referred to IαL globin in sheep.
Amino Acid position
LocusAlleleGlobin815113
HBA1HBA1LIαLS (Ser)G (Gly)L (Leu)
HBA1DIαD D (Asp)
HBA1AIαAA (Ala)
HBA2HBA2LIIαL
HBA2HIIαH H (His)
HBA3HBA3LIII αL
HBA3HIIIαH H (His)
HBA4HBA4HIVαH H (His)
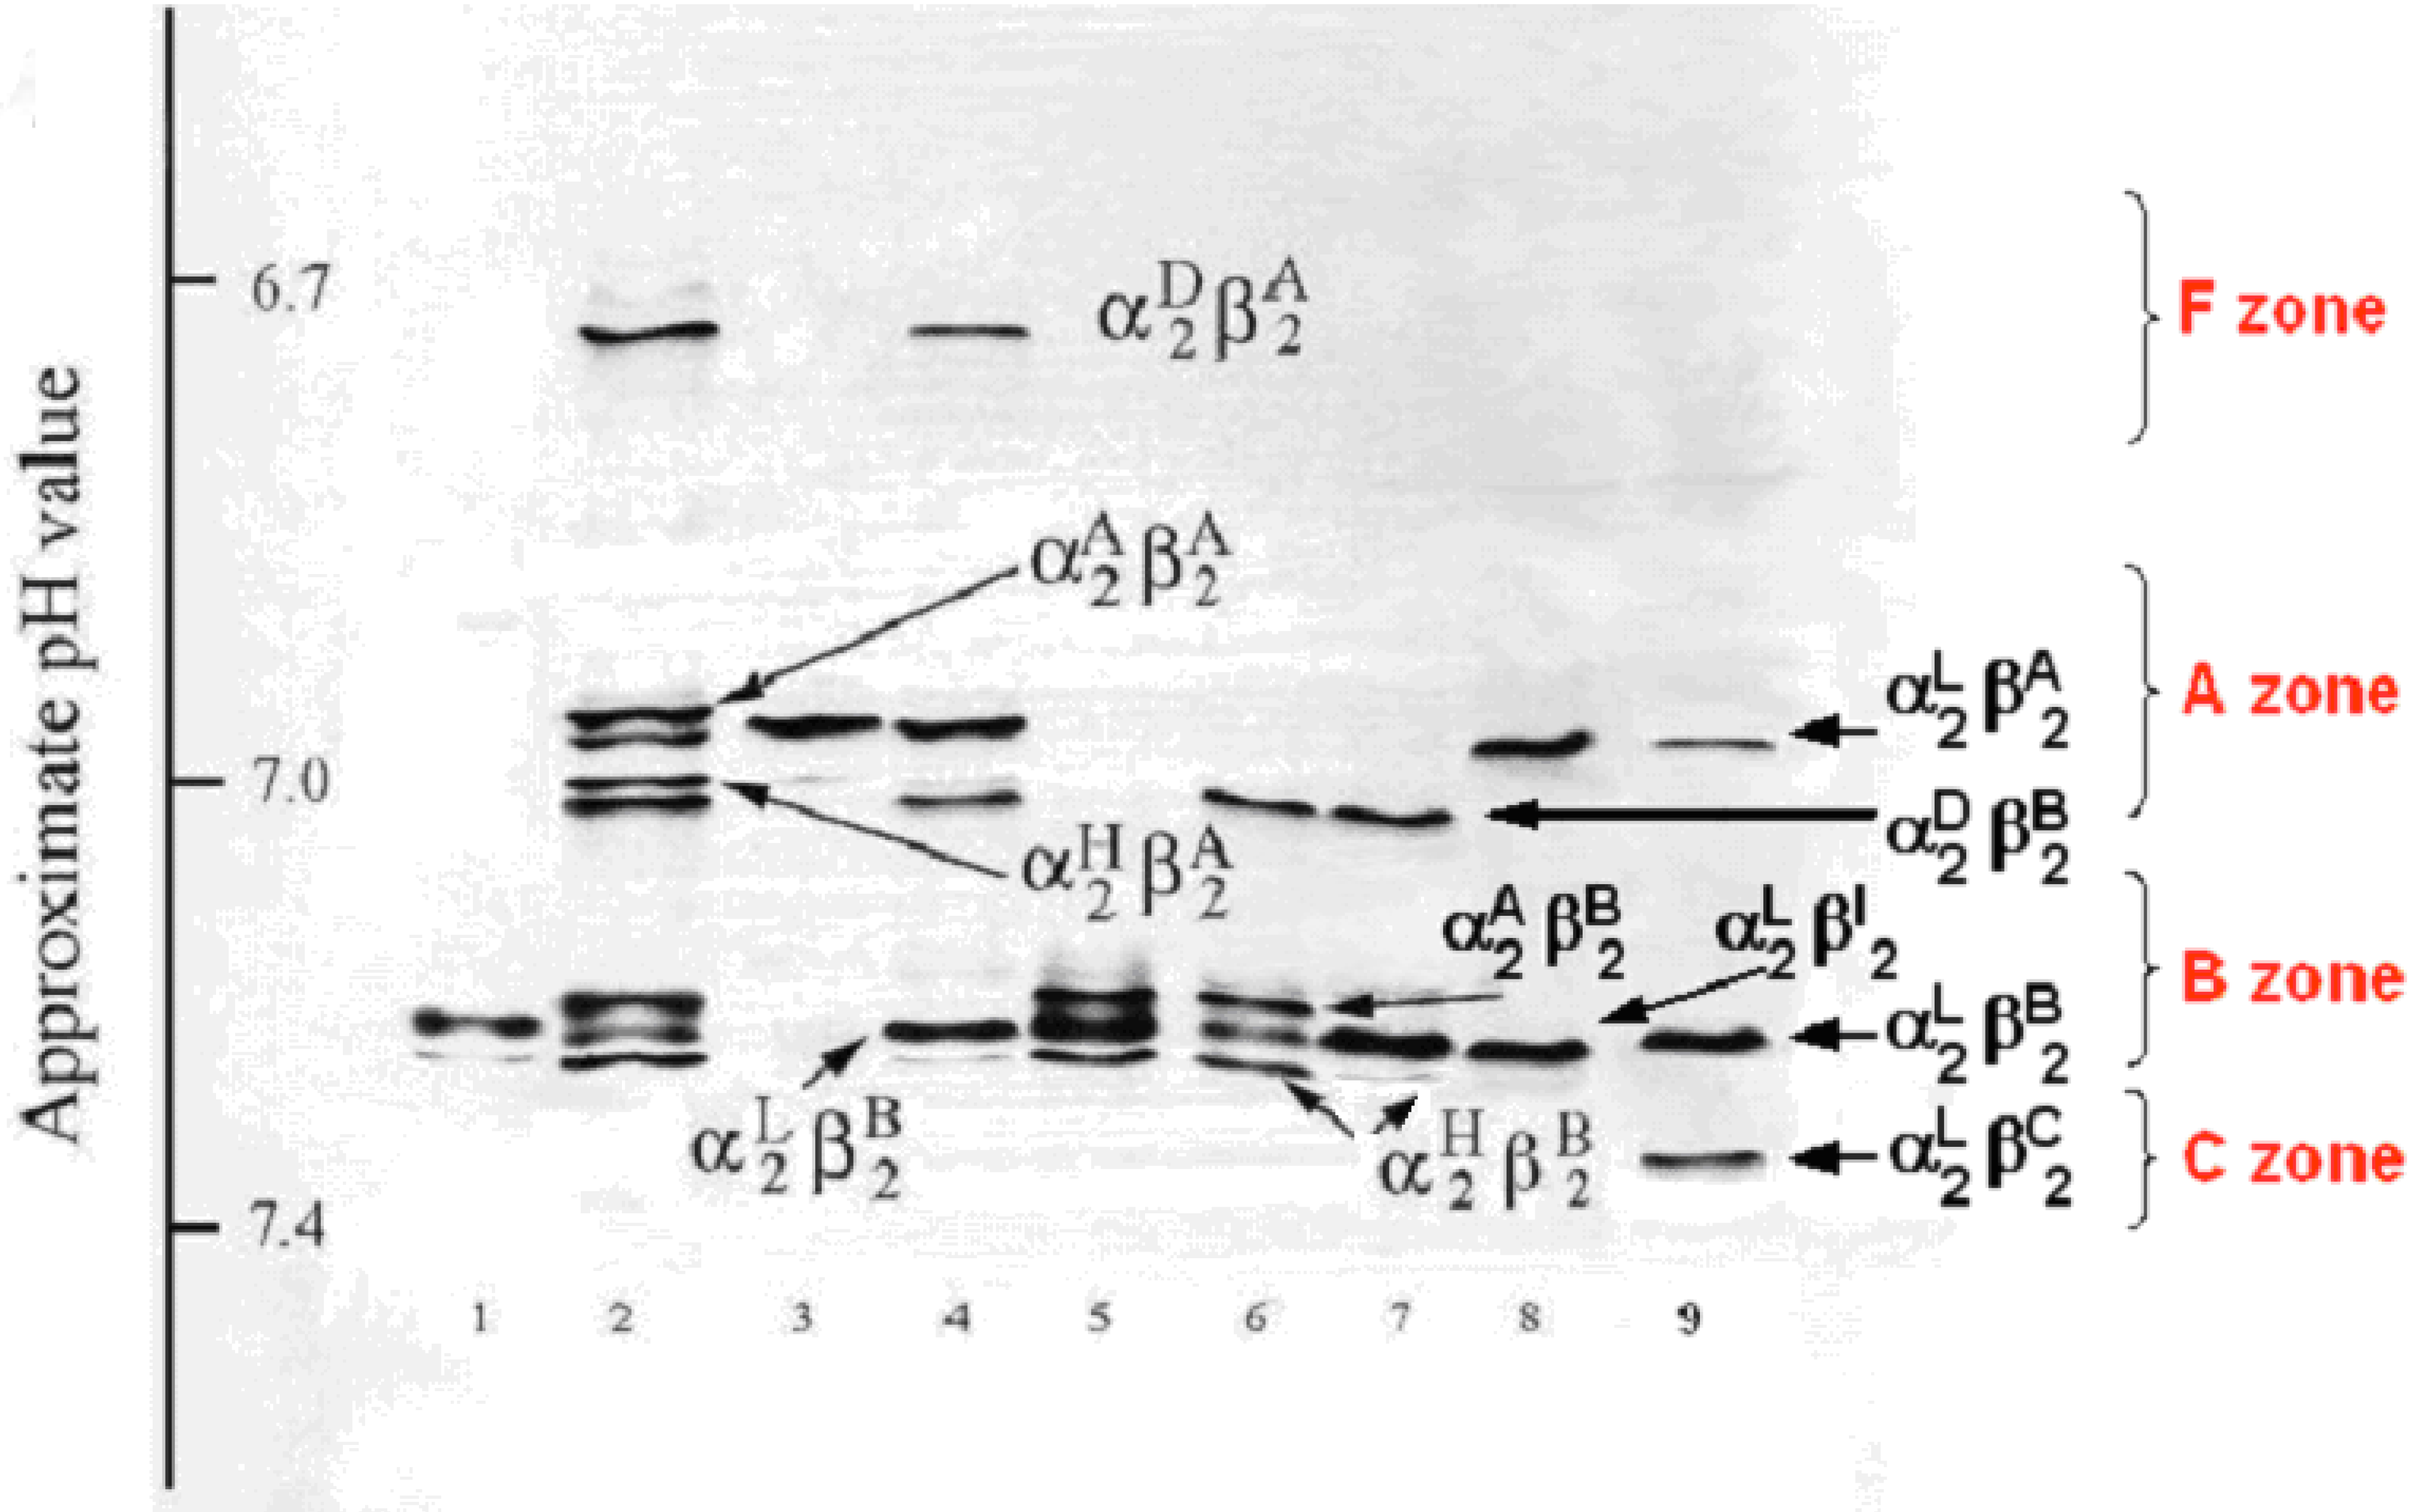
The genetic polymorphisms result in four electrophoretically separable protein zones, C, B, A, and F, according to their different electrical properties (Figure 3). The less and the most positively charged tetramers are the fetal Hb, HbF (α2γ2), and the juvenile Hb, HbC (α2Cβ2) (Figure 3, Lane 9). Most adult tetramers resulting from different variants both in the alpha and beta globin systems are found in the A or B zone, except for α2Dβ2A, which migrates to the F zone (Figure 3, Lane 2 and 4).
Figure 3. Polyacrylamide gel isoelectric focusing (PAGIF) showing adult Hb band patterns in Apulian sheep carrying different α and β globin chains. Lane 1: HBALL/LH and HBBB/B genotype. Two α (IαL, IIαH) and one β (βB) globins resulting in two bands, IIαH2βB2 and IαL2βB2.; Lane 2: HBADLH/AH and HBBA/B genotype. Four α (IαA, IαD, IIαL, II+IIIαH) and two β (βA, βB) globins resulting in eight bands, II+IIIαH2βB2, IIαL2βB2, IαA2βB2, IαD2βB2, II+IIIαH2βA2, IIαL2βA2, IαA2βA2 and IαD2βA2; Lane 3: HBALL/LLH and HBAA/A genotype. Two α (I+IIαL, IIIαH) and one β (βA) globins resulting in two bands, IIIαH2βA2 and I+IIαL2βA2; Lane 4: HBADLH/LL and HBBA/B genotype. Three α (IαD, I+IIαL, IIIαH) and two β (βA, βB) globins resulting in six bands, IIIαH2βB2, I+IIαL2βB2, IαD2βB2, IIIαH2βA2, I+IIαL2βA2 and IαD2βA2; Lane 5: HBALL/AH and HBBB/B genotype. Three α (IαA, I+IIαL, IIαH) and one β (βB) globins resulting in three bands, IIαH2βB2, I+IIαL2βB2 and IαA2βB2; Lane 6: HBADLLH/AH and HBBB/B genotype. Four α (IαA, IαD, II+IIIαL, II+IVαH) and one β (βB) globins resulting in four bands, II+IVαH2βB2, II+IIIαL2βB2, IαA2βB2 and IαD2βB2; Lane 7: HBADLLH/LL and HBBB/B genotype. Three α (IαD, IαL, IVαH) and one β (βB) globins resulting in three bands, I+II+IIIαL2βB2, IαDβB2 and IVαHβB2, the third band is very faint due to the low output of the HBA4gene; Lane 8: HBALL/LL and HBBA/I genotype. One α (I+IIαL) and two β (βA, βI) globins resulting in two bands α2Lβ2A and α2Lβ2I 2Lβ2I band overlaps with α2Lβ2B); Lane 9: HBALL/LL and HBBA/B genotype. One α (IαL) and three β (βA, βB, βC) globins resulting in three bands, αL2βA2 , αL2βB2 and αL2βC2.
Diversity 02 00679 g003

2. Experimental Section

2.1. Animals

2.1.1. Cattle

Blood samples from 219 Podolic cows reared on 6 different farms were selected and treated following standard procedures.

2.1.2. Goats

Hemolysates belonging to 80 Chamois, 183 Garganica and 166 Jonica goats reared on 12 different farms were available after two different experimental trials whose aim was to hematologically characterize Apulian native goat breeds compared to a cosmopolitan breed.

2.1.3. Sheep

Data on Hb phenotypes and blood values were available after an experimental trial where 464 samples were taken from purebred Sardinian, Comisana and Valle del Belice sheep on different farms in Apulia [3,19].

2.2. Analytical Procedures

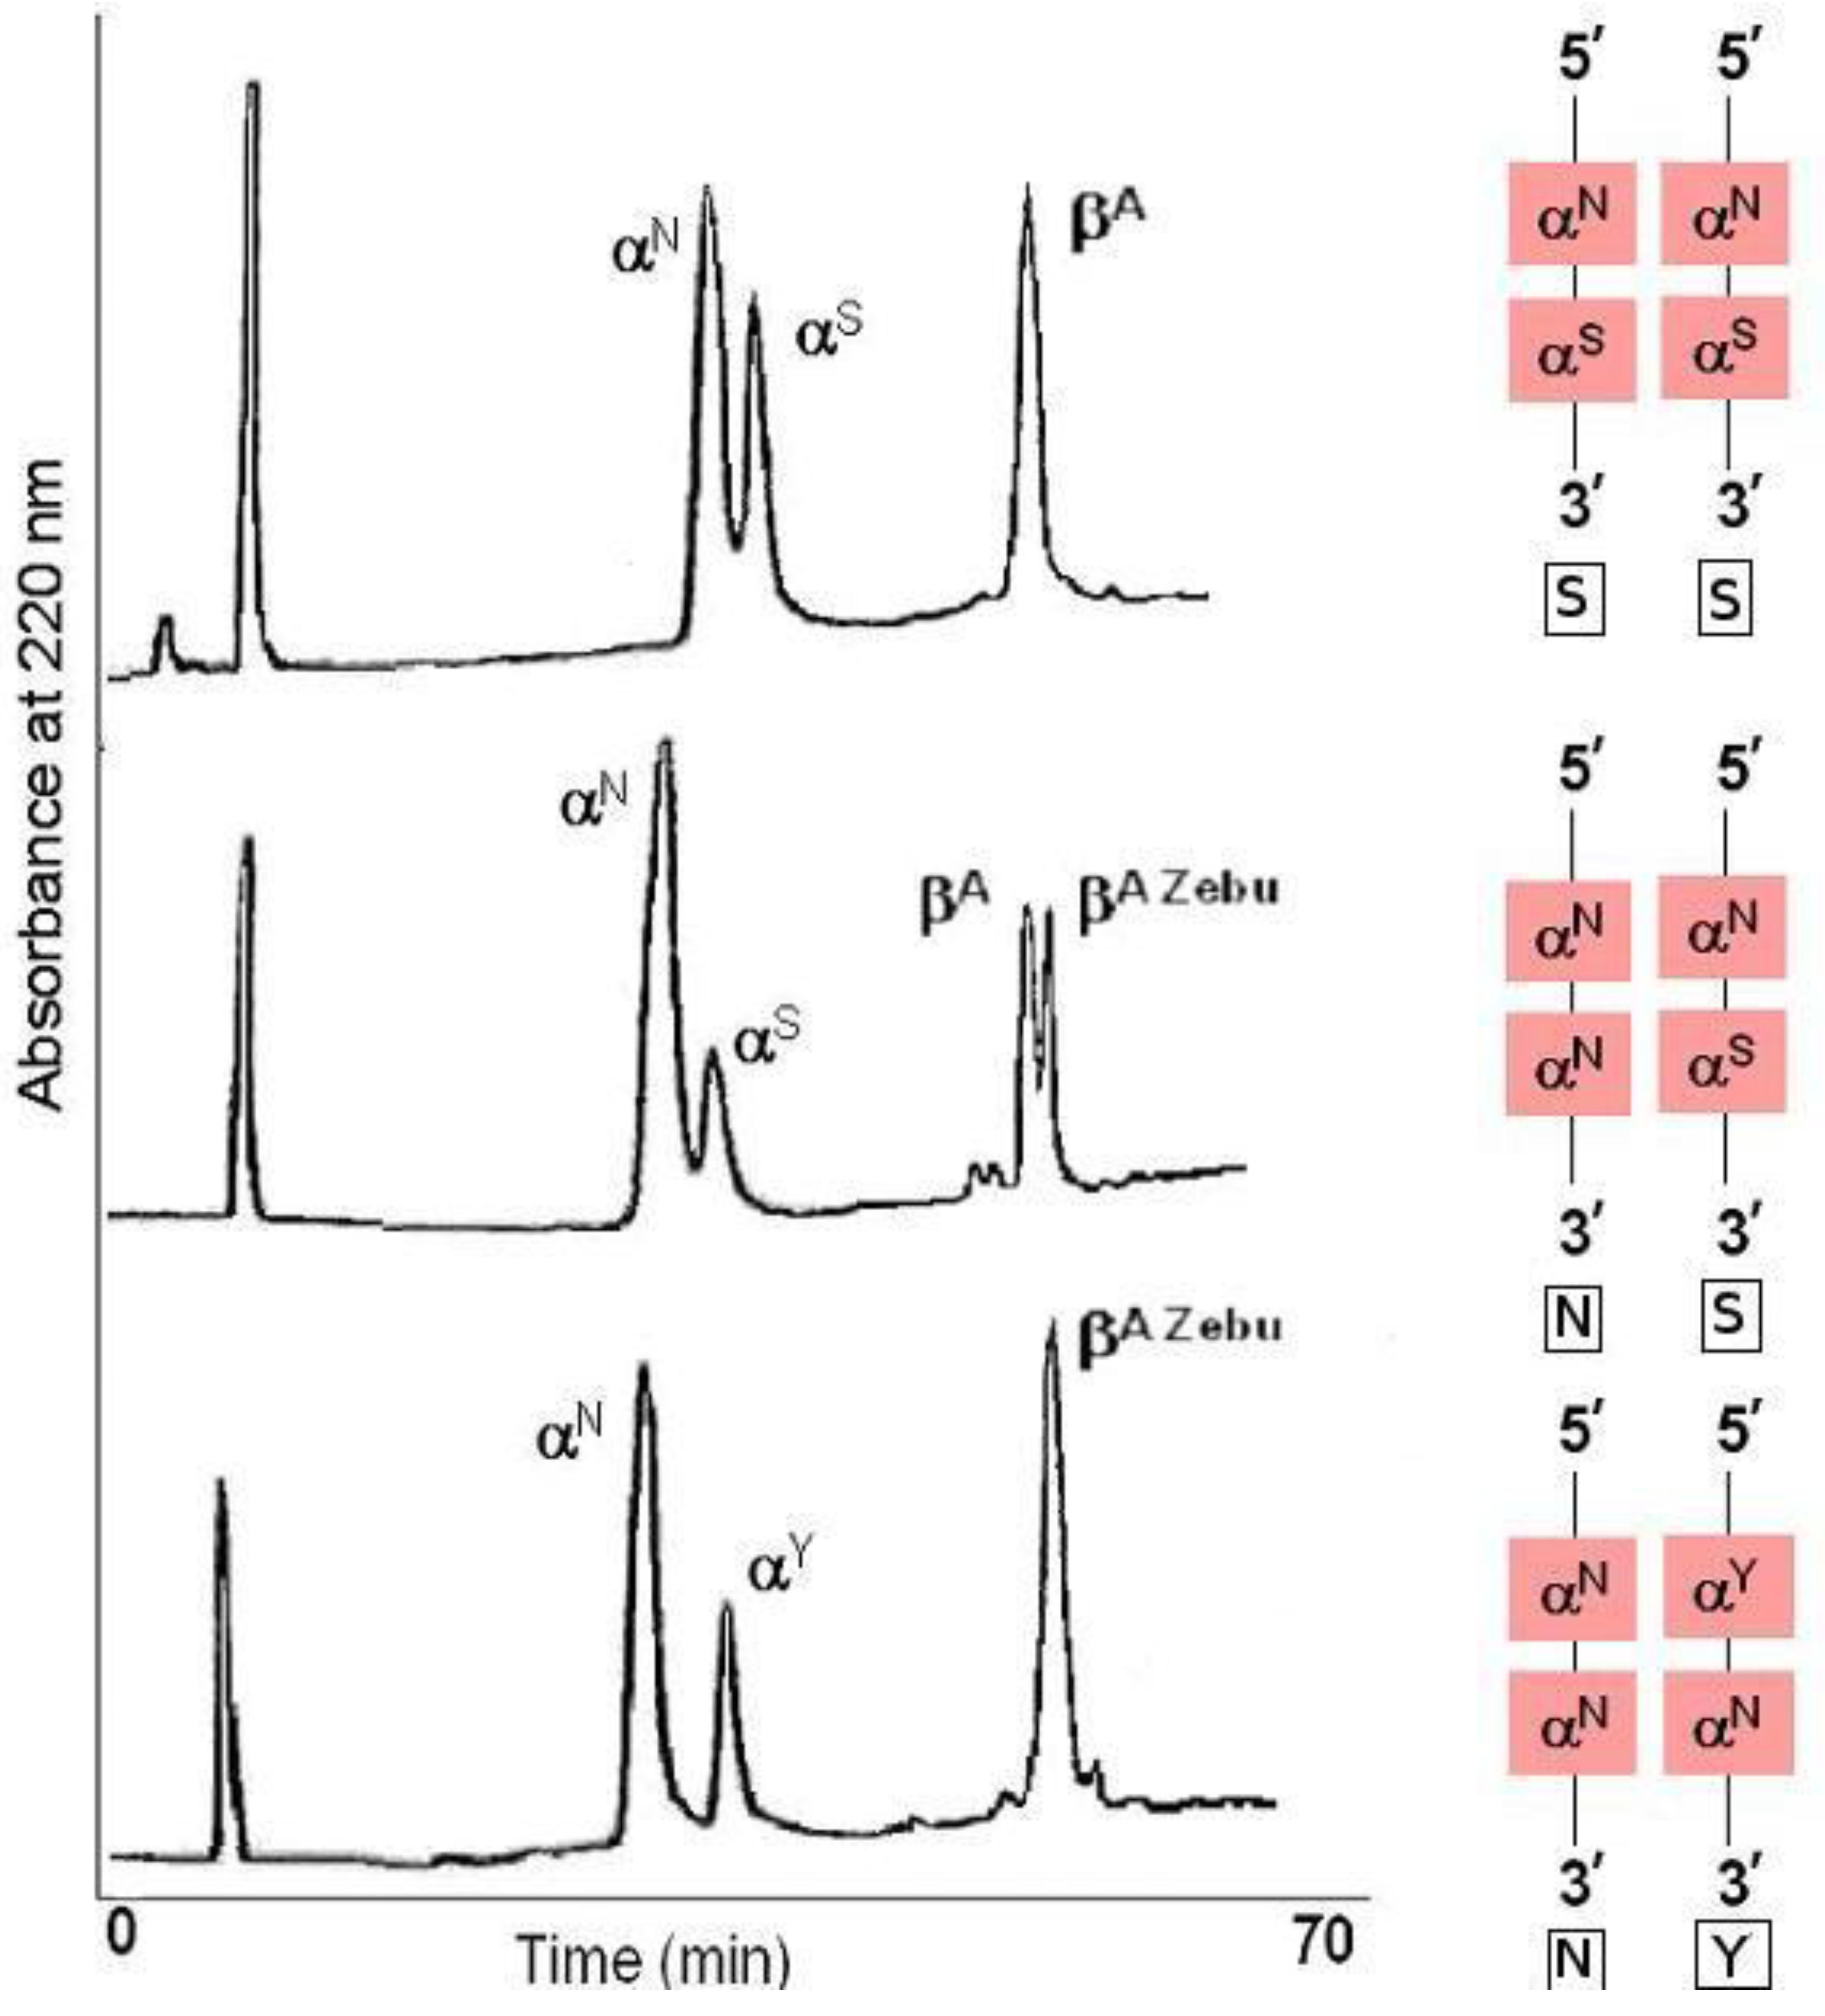
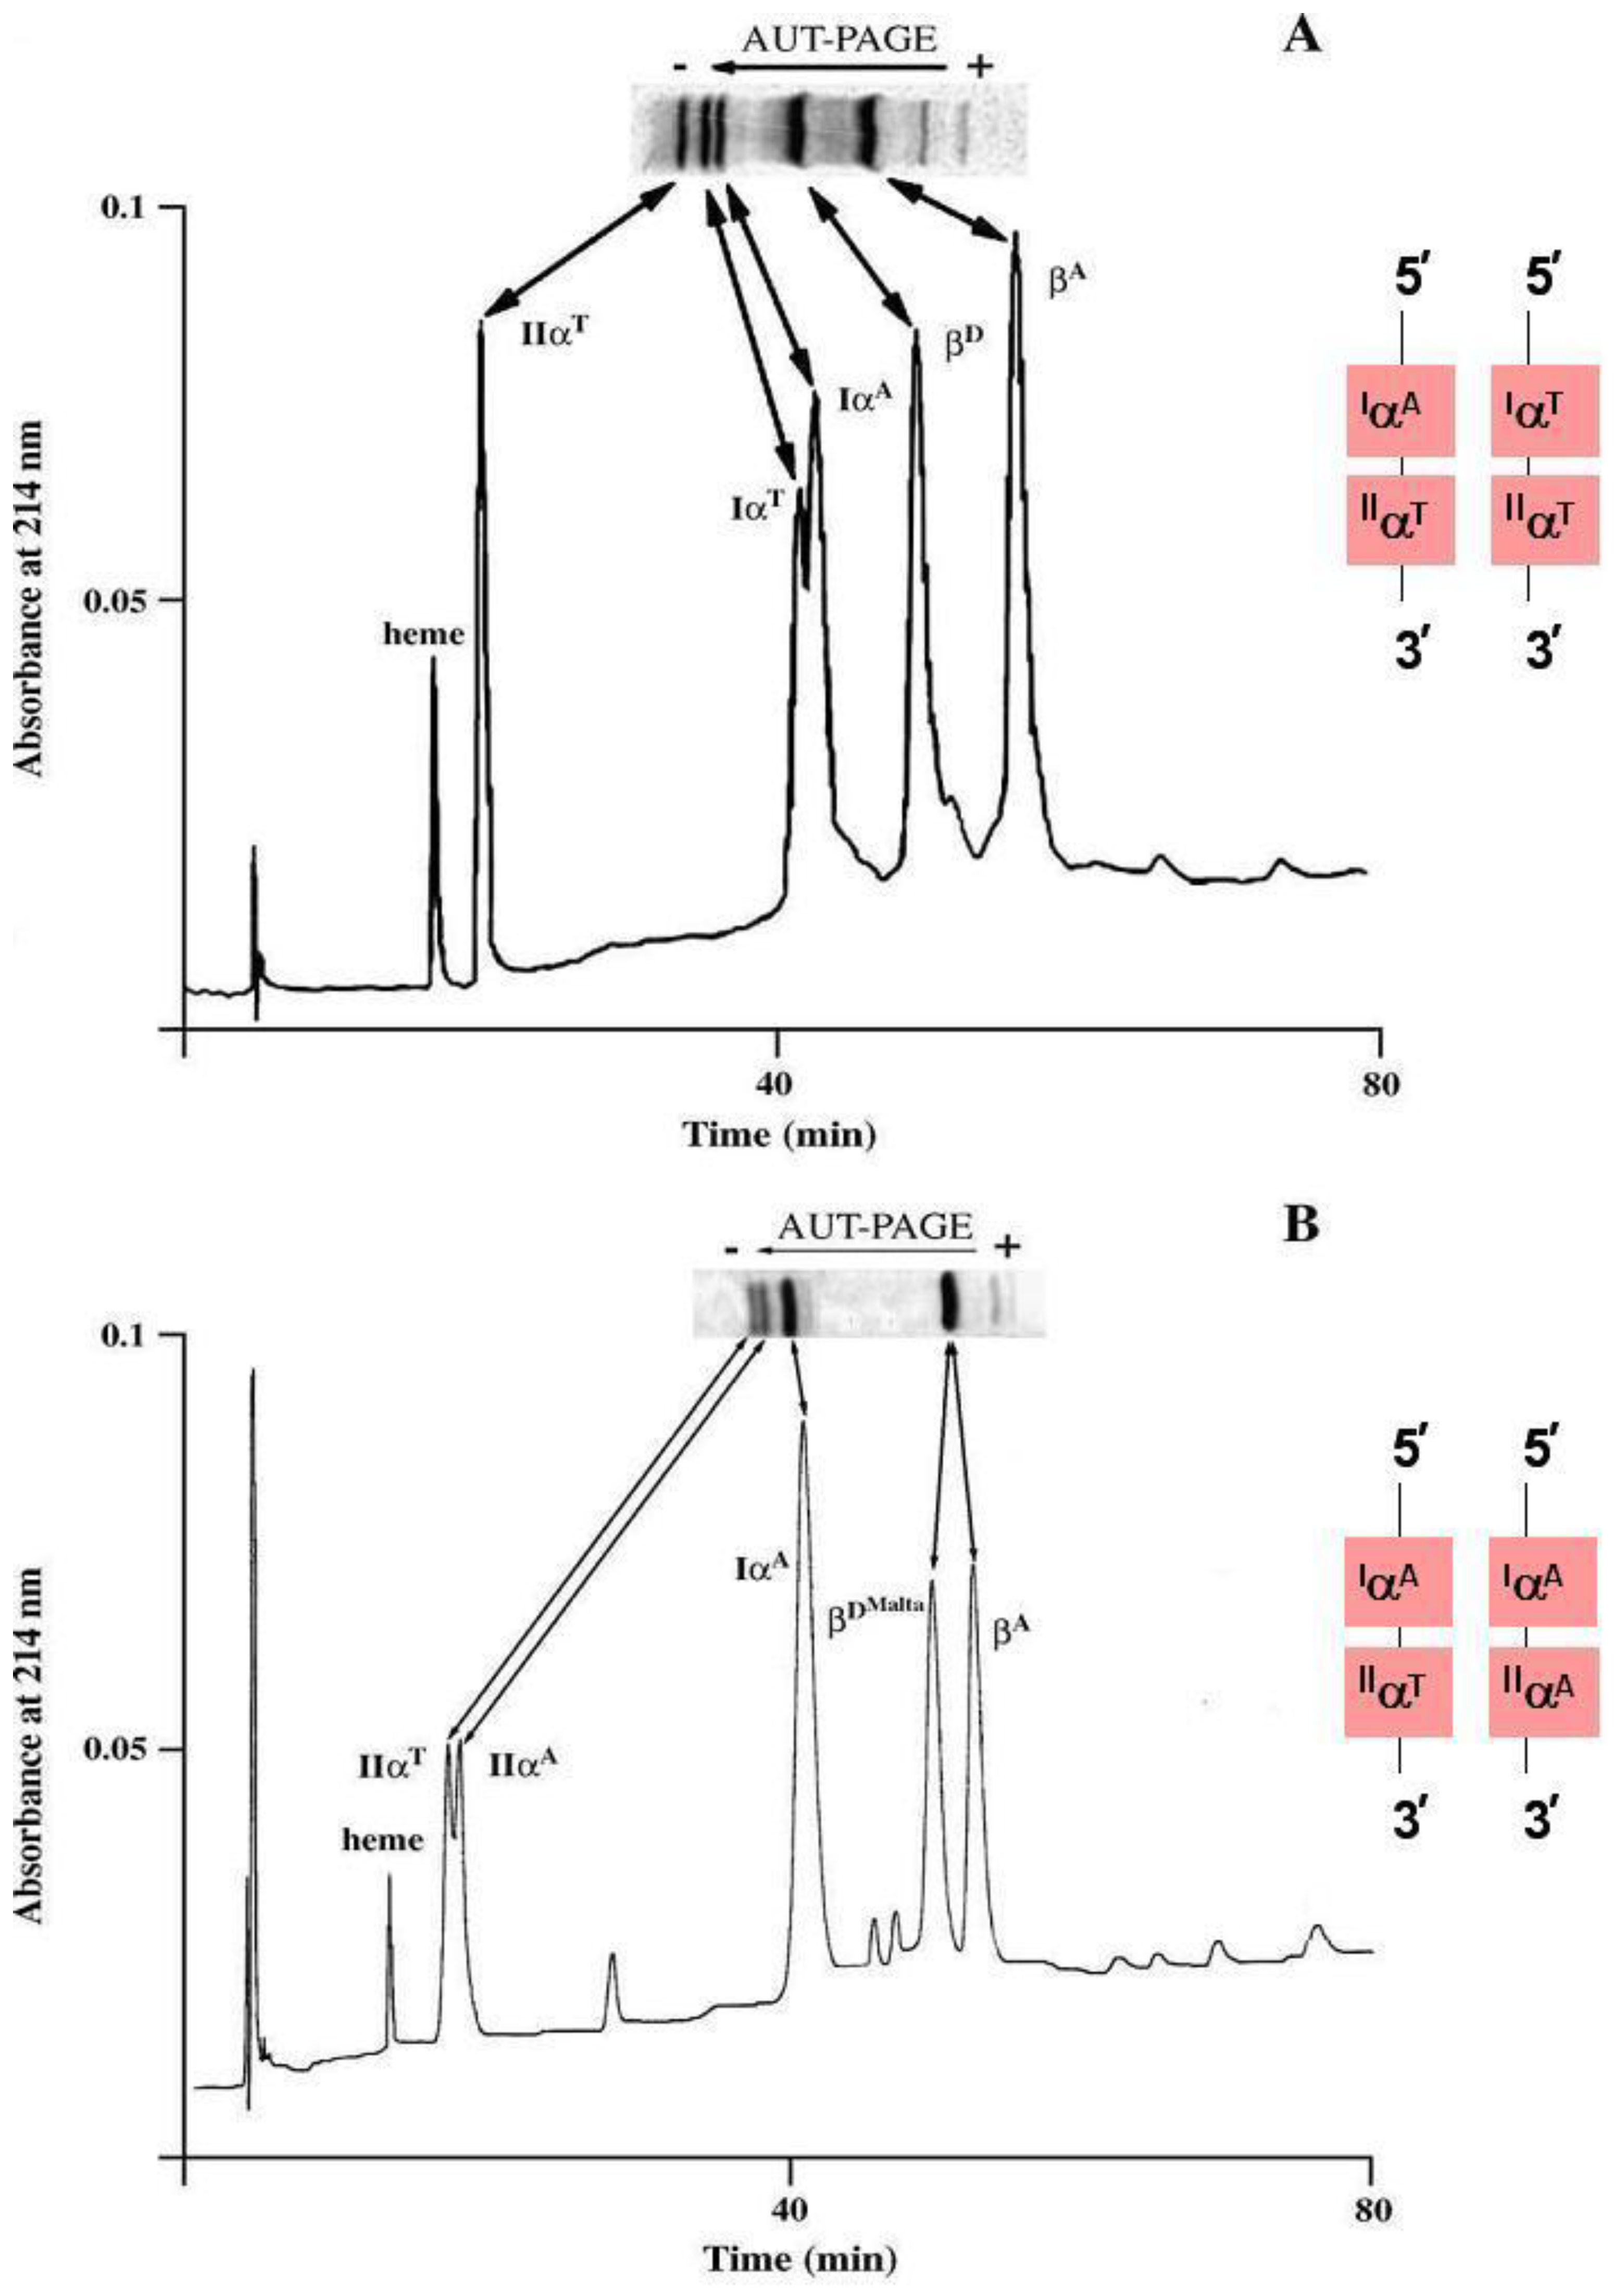
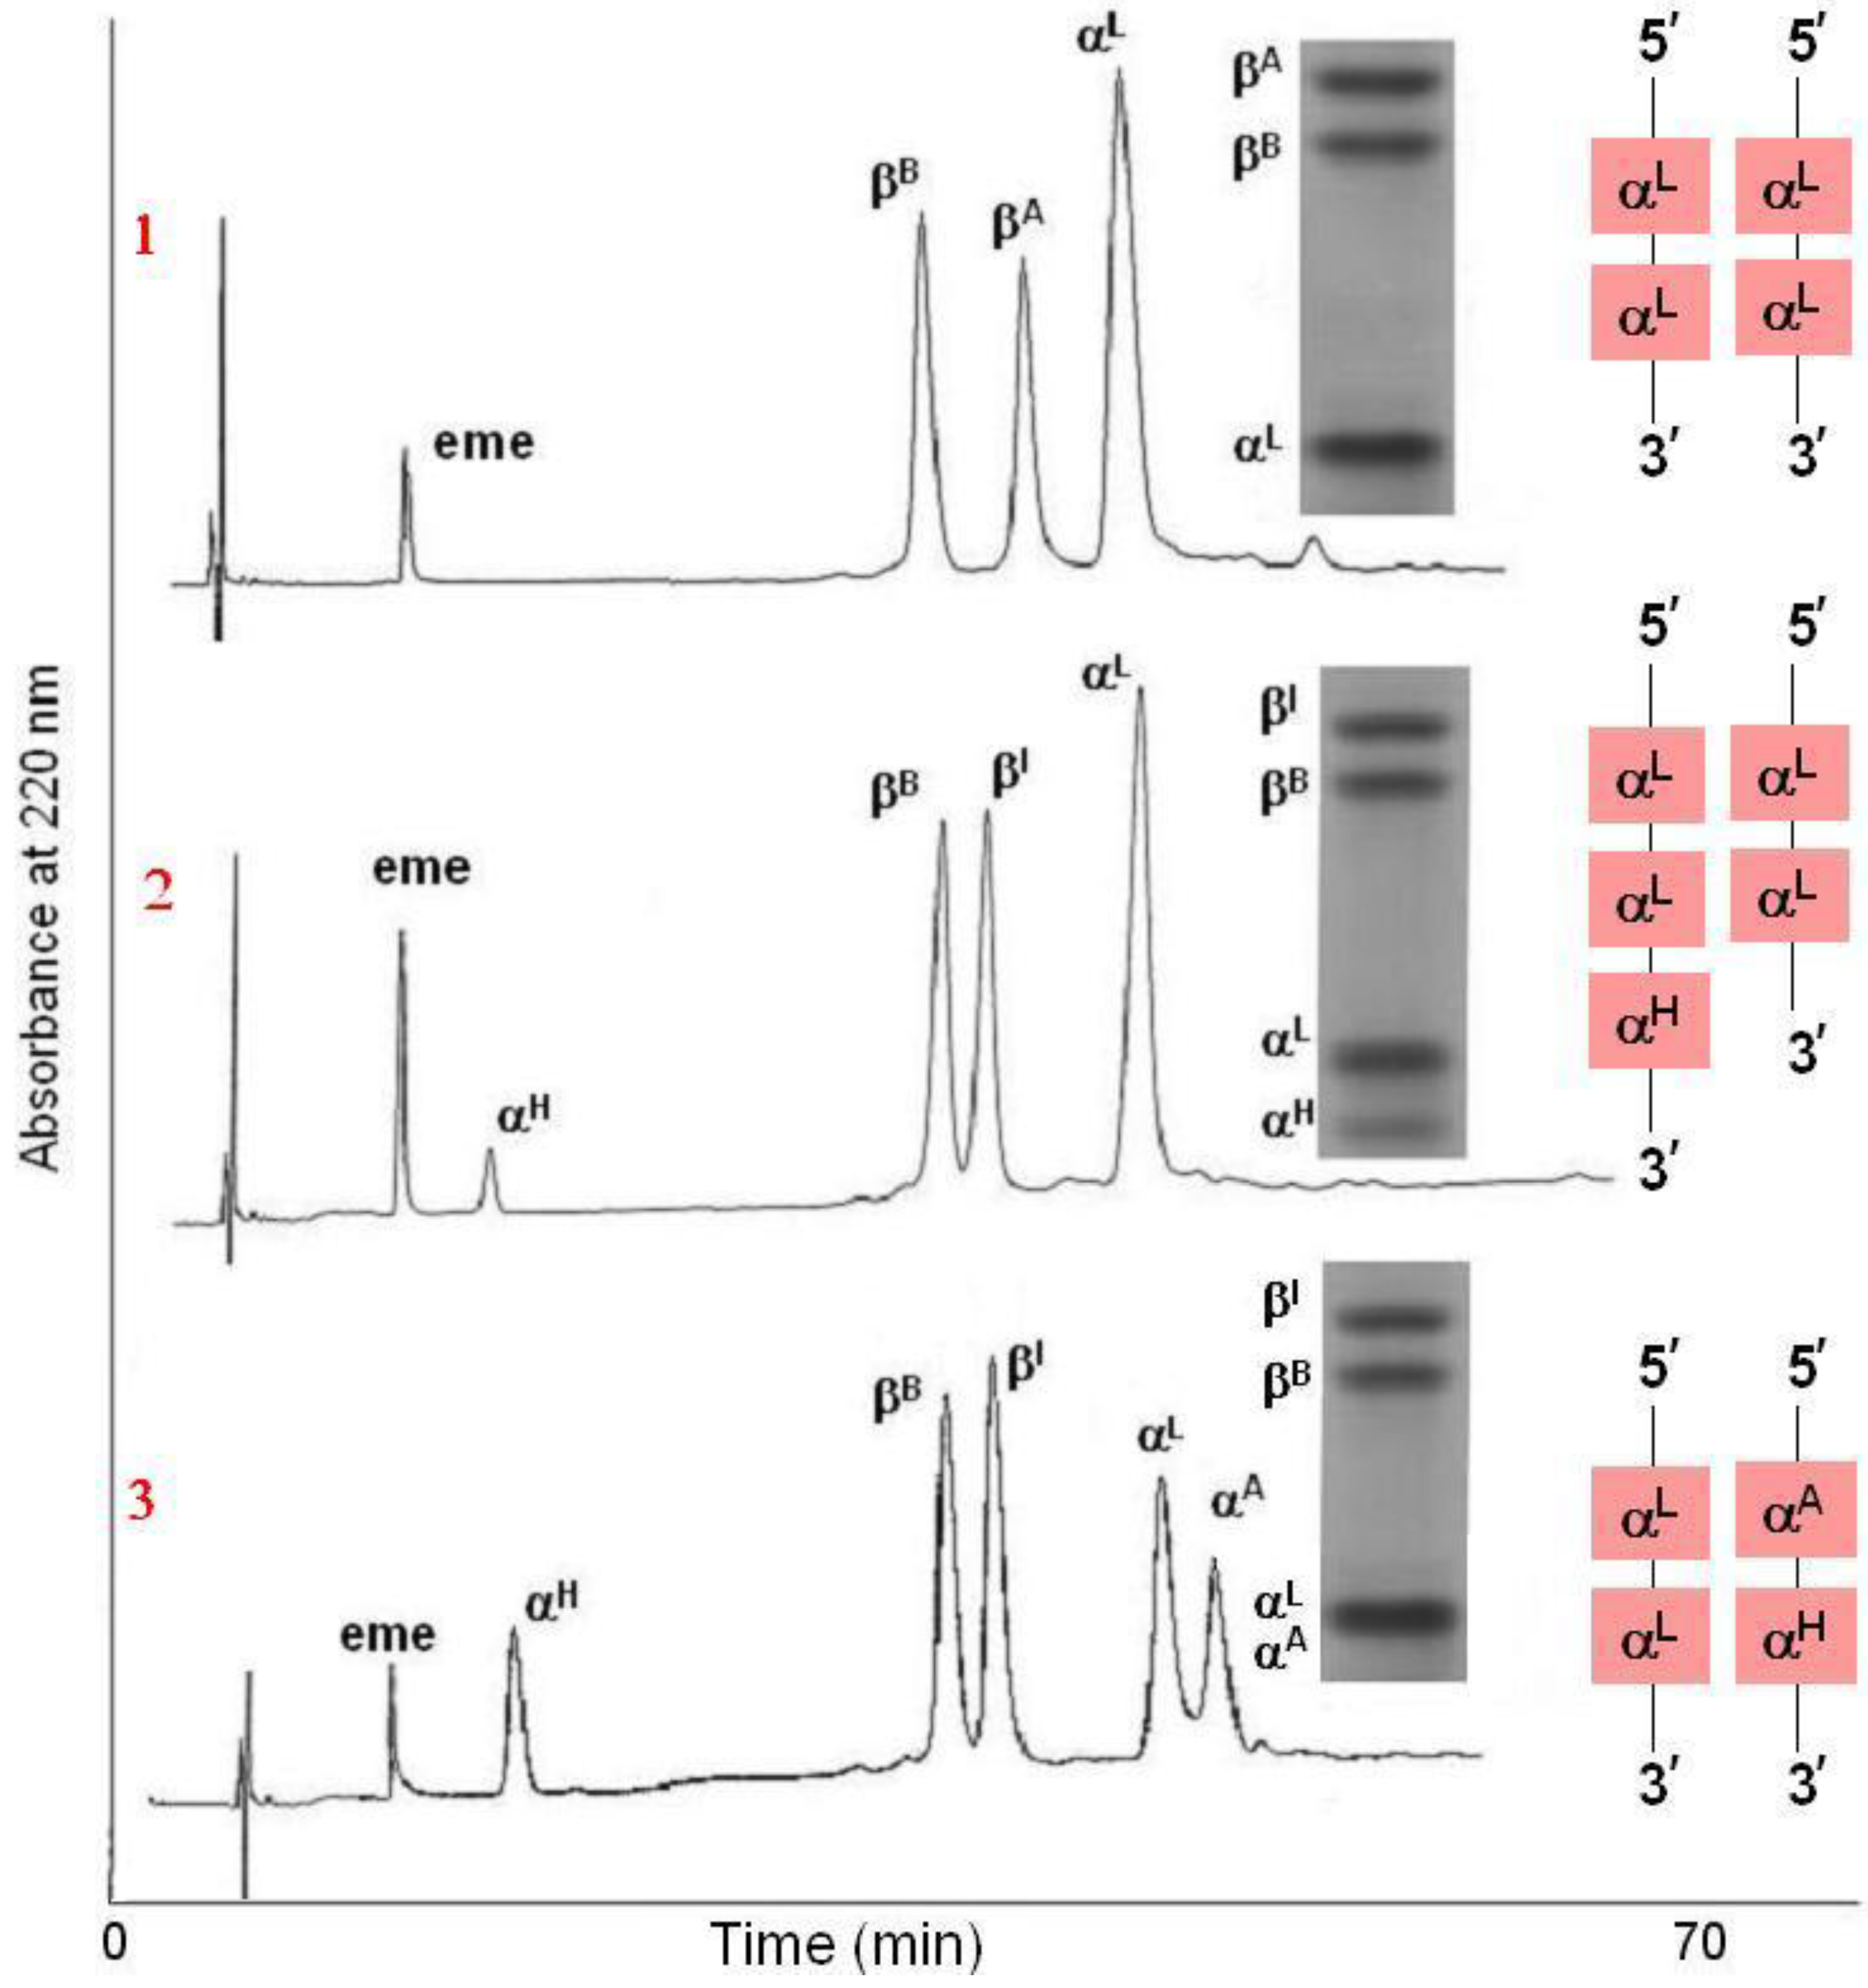
Hematological variables were evaluated using a hematology analyzer. Hb phenotypes were analyzed with isoelectric focusing in a pH range of 6.7–7.7 (PAGIF). Isocharged variants used to be identified by techniques based on hydrophobic interactions such as AUT-PAGE and RP-HPLC. RP-HPLC is also a very smart system for evaluating quantitative variations of the alpha globins and thus establishing the corresponding genotype (Figure 4, Figure 5, and Figure 6).
Figure 4. RP-HPLC of alpha and beta globin variants in Podolic cattle. Based on their hydrophobic character, the alpha chains are less hydrophobic than the beta chains and elute with the following sequence: αN, αS, αY; the beta chains elute later than the alpha chains and βAZebu is the most hydrophobic globin. The alpha genotype can be inferred from the relative peak proportions.
Diversity 02 00679 g004
Figure 5. AUT-PAGE and HPLC specific chromatographic profile of alpha and beta globin variants in goats. Panel A: one non allelic alpha globin (IIαA), two allelic alpha globins (IαA and IαT) and two beta globins (βA and βD); panel B, two allelic alpha globins (IIαT and IIαA), a non allelic alpha (IαA) and two beta (βA and βDMalta). The relative alpha globin gene arrangements are shown on the right.
Diversity 02 00679 g005
Figure 6. AUT-PAGE and HPLC chromatografic profiles of alpha and beta globin variants in sheep. Panel (1) one alpha globin (αL) and two allelic beta globins (βA, βB); in panel (2) two non allelic alpha globins (αH, αL) and two allelic beta globins (βA, βI); in panel (3) three non allelic alpha globins (αH, αL, αA,) and two allelic beta globins (βB, βI).
Diversity 02 00679 g006
The alpha chains elute with the following sequence: αH, αL, αA; the alpha globin gene arrangements, which can be deduced from the relative proportions of the peaks, are shown on the right.
  • αL = 100, individuals classified as LL/LL;
  • αLH = 93:7 , individuals classified as LL/LLH;
  • αLAH = 50:30:18 individuals classified as LL/AH.
Table 5 presents a summary list of the main methods for detecting relevant Hb and globin variants found in the investigated populations.
Table 5. Main methods for detecting relevant Hb and globin variants found in ruminant Mediterranean populations.
SpeciesMethodsΑ globinin variantsβ globinin variant References
CattlePAGIF (tetramers)αN, αYβA, βB[15,16]
AUT-PAGEαN, αY, αSβA, βB, βAZebù
RP-HPLCαN, αY, αSβA, βB, βAZebù
GoatPAGIF (tetramers)IαA, IαB, IIαA, IαT, IIαT,βA, βD, βDMalta , βE[18]
AUT-PAGEIαA, IαB, IIαA, IαT, IIαT,βA, βD, βE
RP-HPLCIαA, IαB, IIαA, IαT, IIαT,βA, βD, βDMalta , βE
SheepPAGIF (tetramers)αA, αL, αH, αD, βA, βB, (βI), βC[13]
AUT-PAGEαL, αH,βA, βB, βI
RP-HPLCαA, αL, αHβA, βB, βI

2.3. Statistics

The data were analyzed by a linear model including the effects of Hb phenotype, breed, herd, sex, and age as covariates, as well as the effect of the farm management on the hematological values. Gene frequencies were estimated by the GENEPOP program [57]. For the goat data set, the 349 individuals in the sample were divided into three main groups and classified as A, AD and D on the basis of their major band pattern, assuming that the intraband variation included functionally equivalent tetramers.

3. Results and Discussion

3.1. Gene Frequencies

3.1.1. Cattle

Table 6 shows the results obtained by screening Podolic cattle for the alpha globin gene system and the beta locus (HBB). The alpha globin gene arrangement sample sizes are reported as well as the alpha globin haplotype and the beta allele frequencies. The alpha globin Y haplotype is rather common and so is the HBBAZebu allele, both with a value of 0.2. Conversely, both the alpha globin S haplotype and the HBBB allele are rare. The alleles and genotypes in the sample were in HW equilibrium.
Table 6. Alpha globin genotypes observed, alpha globin haplotype frequency, and beta globin allele frequency obtained by screening the Podolic cattle population.
α-globin genotypes observationsHBA allele frequencyHBB allele frequency
NNNYNSYYYSSSTotalHBAN*HBA2SHBA1YHBBAHBBAZebuHBBB
125561914232190.740.070.190.7680.2270.005
*cumulated frequency = HBA1 + HBA2.

3.1.2. Goat

Table 3 shows the lists of charged variants relevant in Apulian goats and the corresponding Hbs and isoelectric point (pI). The charged rare allele HBA1B is not included as it was not found. In Table 7, the frequencies recorded in Apulian native goats are shown and compared to those of the Chamois and Maltese breeds. It is worth noticing that positively charged variants are very common both in Apulian and Maltese goats, while they have not been found in the northern Chamois breed. The alleles and genotypes in each breed sample were in Hardy-Weinberg equilibrium.
Table 7. Frequency of the positively charged variants at the HBB locus in Apulian native goat breeds compared to Chamois and Maltese breeds.
BreedNHBBDḌHBBḌMalta
Chamois8000
Garganica 18300.49 Diversity 02 00679 i001≈0.45
Jonica1660.0080.43
Maltese*327-0.30*
*estimated value based on the data reported by Bannister et al. [44].

3.1.3. Sheep

The prevalence of positively charged variants has been recorded in most Mediterranean sheep breeds both in the alpha globin system and at the beta locus [7,13,19]. Except for the negatively charged rare allele HBA1D [47], several variants in the alpha globin system do not greatly affect the charge of the Hb molecules or the mobility of Hb bands. Thus, Table 8 summarizes the information regarding beta allele frequencies in the relevant Mediterranean breeds.
Table 8. Frequency of HBB alleles in southern Italian and Mediterranean islander sheep breeds as reported in the literature.
BreedNHBBAHBBBHBBI
Altamurana [58]1260.0950.8820.083
Comisana [19]1560.0530.7840.165
Corsican [59]360.0000.985*0.015*
Gentile di Puglia [13]2940.1170.8320.051
Leccese [7]9660.1030.897**
Sardinian [19]1590.0410.8710.088
Sardinian [60]2580.0300.8900.080
Valle del Belice [19]1500.0470.7400.213
*Estimated value from Serreri et al. [59]** cumulated frequency = HBBB+ HBBI.

3.2. Globin Variant Functional Effects

None of the globin variants considered are related to pathological effects because all the hematological values recorded in the different phenogroups fall within the normal range for the species reported in the literature [57]. Thus, functional effects need to be tested on blood values in normal conditions. The issues involved are complex, because of the difficulties in fine-tuning the differences which refer to a quantitative phenomenon that can be strongly affected by the number of records. Samples should have a minimum number and a reasonable distribution, so globin variant sample size and frequency values are important. This is why only relevant phenotypes are shown in Table 9 for cattle and Table 10 for goats. The frequency data recorded in cattle and goats show that positively charged variants are common both at the alpha globin and beta globin loci, with, HBA1Y = 0.19 in Podolic (Table 6) cattle and HBBDMalta averaging 0.45 in goats (Table 7). Conversely, in sheep populations where positively charged variants represented the prevalent alleles (cumulatively averaging 0.96), the sample size was increased to have a reasonable number of genotypes containing at least a copy of the negative HBBA allele.
Table 9. Least square mean values and standard error (s.e.) of hematocrit values (Hct) and hemoglobin (Hb) for relevant globin gene arrangements in Podolic cattle. Means with different superscripts differ significantly (P < 0.05).
Alpha globin genotypesHcts.e.Hbs.e.
NN (125)30.69a0.310.58a0.12
NS (56)32.24b0.6111.06a0.26
NY (19)29.56c0.3810.16b0.15
YY (14)29.90ac0.8610.40ab0.35
A detailed analysis of the results for the three species shows a phenomenon that is very similar as to the effect of the Hb phenotype on hematological values:
(i)
in Table 9 (cattle) decreased hematocrit (Hct) and Hb values are associated (P < 0.001) with the positive IαY globin variant; owing to the sample size the effect is more significant in NY than in YY.
(ii)
in goats, a decrease in red blood cell values was recorded both in Garganica and Jonica breeds related to the greater number of HBBDMalta genes in the genotype. Hct and Hb showed similar trends with significant results, as seen in Table 10. In both breeds, a greater HBBDMalta gene number in the genotype was related to lower Hct and Hb values;
(iii)
Table 11 shows the significant gradual decrease in sheep Hct and Hb values as phenotype positive charge increased.
Table 10. Least square mean values and standard error (s.e.) of hemoglobin (Hb) and hematocrit value (Hct) for electrophoretic phenotype in Garganica goats and Jonica goats. Means with different superscripts differ significantly (P < 0.05).
Hb typeGarganicaJonica
NHct
%
s.e. Hg
g/dL
s.e.NHct
%
s.e. Hb
g/dL
s.e.
A4825.29a0.209.27a0.195426.7a0.479.58a0.16
AD9124.900.188.980.198025.1b0.518.96b0.17
D4423.75b0.218.45b0.243225.00.738.740.25
Table 11. Least-square means (LS-mean) and standard error (s.e.) of hematocrit value (Hct) and hemoglobin value (Hb) for HBB genotype in sheep. Means with different superscripts differ significantly (P < 0.05).
HBBNHct (%)Hb (g/dL)
LS-means.e.LS-means.e.
AB2932.83a0.7111.33a0.26
AI630.16b1.3610.23b0.5
BB30231.28b0.4410.97b0.16
BI11530.62c0.4710.65c0.17
II1330.69c0.9110.81c0.34
In brief, the estimated Hb phenotype effect on hematological values was statistically significant in each of the cases described above. On average, the differences between the highest and the lowest Hct and Hb values were approximately 4% in cattle, 6% in goats and 8% in sheep. This increasing trend in the three species seems to be related to the increase in intra-species pI differences between the different Hb morphs (Figure 1, Figure 2 and Figure 3).

4. Conclusions

Since the historic work of Bragg and Perutz [62], rivers of ink have been spilt over Hb structure, function and molecular, biosynthesis, genetics and phylogenetics aspects; however a broad-spanning review of the related scientific literature is now available [63,64,65,66,67]. There is also vast literature on the clinical effects of human alpha and beta hemoglobinopathies [68,69]. For domestic animals, little attention has been paid to the study of structure and function of intraspecies variants, except for the beta-globin cluster gene products which are among the most extensively studied tissue-specific and developmentally-regulated genes in humans and in animals [70].
Looking at our results, we may suggest an explanation of the phenomenon based on the relatively few pieces of specific information available and on the analogy with the behavior of human globin variants.
Bogner et al. [71] provided evidence of a link between Hb hydration and erythrocyte volumes in that an increased number of charged amino acid residues results in increased Hb hydrophilicity and greater resistance to osmotic dehydration or hyperhydration.
Pieragostini et al. [13], found that Hct reduction was related to a reduced mean corpuscular volume (MCV), but not to a proportionally reduced mean corpuscular Hb concentration, suggesting that the cause of the decreased MCV may be a reduced erythrocyte hydration. As to oxygen affinity, ruminant Hbs are customarily classified into the low intrinsic oxygen affinity Hb group, which is independent of organic phosphates [72,73]. The affinity for oxygen of positively charged HbB in cattle [74], of HbD in goat [44], and of HbB in sheep [75] was found to be lower than for the respective HbA. On the other hand, the class of human Hb variants characterized by higher oxygen affinity than normal results in a high affinity status of the red cell, expressed by clinically identifiable erythocytosis, which involves an increase in the red blood cell mass beyond the normal range [76]. Thus, pursuing the analogy, we may conclude that, as expected, the positively charged variants characterized by low oxygen affinity in ruminants are related to a decrease in the red blood cell mass resulting in low Hct values.
Lower Hct values correspond to lower blood viscosity and thus to a greater availability of water, which seems to be of particular adaptive significance in habitats characterized by an arid climate. Camel and llama Hbs contain a higher number of charged amino acid residues than do Hbs of other species. Consequently, Bogner et al. [71] suggested that this feature may represent a molecular-cellular level of defense against dehydration, in addition to physiological regulatory mechanisms, that help desert animals survive. Similarly, based on the relatively high frequency of the positively charged variants in the Mediterranean ruminant breeds screened and on the relationship between these variants and lower Hct values, we may infer that these variants may have a positive adaptive value in arid environmental conditions. Moreover the low oxygen affinity of these variants contributes to keeping a normal tissue pO2 and may be an advantage when coping with enzootic hemotropic parasites.
The effect of selection may be a fact, but comparative structural-functional analyses are required to help unveil the molecular mechanism underlying the phenomenon. Particular attention will have to be first paid to hydration of the different Hb molecules, since in the highly concentrated red cell milieu it does not differ substantially from that of nearly ideal solutions [77]. A second step will then be to study the sheep variant HBBI whose significant effect on Hct can be expected when compared to the negatively charged HBBA, but unexpected when compared to the almost isocharged positive HBBB.

Acknowledgements

I (Elisa Pieragostini) would like to thank Lorraine Pariset for inviting me to contribute a paper to this issue. I am also indebted to my dear collegue and friend Aldo Di Luccia for sharing this journey around hemoglobin polymorphism of domestic animals with me.
The Authors are truly grateful to Athina Papa for revising the English of the manuscript.

References

  1. Sponenberg, D.P.; Bixby, D.E. Managing Breeds for a Secure Future; American Livestock Breeds Conservancy: Pittsboro, NC, USA, 2007; pp. 3–4. [Google Scholar]
  2. Olesen, I.; Groen, A.F.; Gjerde, B. Definition of animal breeding goals for sustainable production systems. J. Anim. Sci. 2000, 78, 570–582. [Google Scholar] [PubMed]
  3. Petazzi, F.; Rubino, G.; Alloggio, I.; Caroli, A.; Pieragostini, E. Relationships among functional markers, management, and husbandry in sheep: a Mediterranean case study. Vet. Res. Commun. 2009, 33, 865–874. [Google Scholar] [CrossRef] [PubMed]
  4. Fedlman, B.V.; Schalm, O.W.; Zinkl, J.G.; Jain, N.C. Schalm's Veterinary Hematology, 5th ed.; Lippincott, Williams & Wilkins: Baltimore, MD, USA, 2000. [Google Scholar]
  5. Obi, T.U.; Anosa, V.O. Haematological studies of domestic animals. IV: Clinico haematological features of bovine trypanosomiasis, theileriosis, anaplasmois, epertherozoonosis and helminthiasis. Zentralbl. Veterinarmed. 1980, 27, 789–797. [Google Scholar]
  6. Cresswell, E.; Hutchings, H. A comparison of production on blood values between the Romney Marsh and the Cheviot ewes in New Zealand. Res. Vet. Sci. 1962, 3, 209–214. [Google Scholar]
  7. Pieragostini, E.; Dario, C.; Bufano, G. Haemoglobin phenotypes and hematological factors in Leccese sheep. Small Rum. Res. 1994, 13, 177–185. [Google Scholar] [CrossRef]
  8. Olayemi, F.O.; Nwandu, C.N.; Aiyed, J.O. Haematology of Sokoto Gudali Cattle as Influenced by Sex and Breed. J. Anim. Vet. Adv. 2007, 6, 816–818. [Google Scholar]
  9. Ajuwape, A.T.P.; Antia, R.E. Breed differences in haematological changes associated with trypanosome antigenaemia in Nigeria cattle. Trop. Vet. 2000, 18, 67–72. [Google Scholar]
  10. Tibbo, M.; Aragaw, K.; Abunna, F.; Woldemeskel, M.; Deressa, A.; Lemma Dechassa, M.; Rege, J.E.O. Factors affecting haematological profiles in three indigenous Ethiopian sheep breeds. Comp. Clin. Pathol. 2005, 13, 119–127. [Google Scholar] [CrossRef]
  11. Bettati, S.; Viappiani, C.; Mozzarelli, A. Hemoglobin, an “evergreen” red protein. Biochim. Biophys. Acta. 2009, 1794, 1317–1324. [Google Scholar]
  12. Pieragostini, E.; Petazzi, F.; Di Luccia, A. The relationship between the presence of extra alpha-globin genes and blood cell traits in Altamurana sheep. Genet. Sel. Evol. 2003, 35, S121–133. [Google Scholar] [CrossRef] [PubMed]
  13. Pieragostini, E.; Rubino, G.; Bramante, G.; Rullo, R.; Petazzi, F.; Caroli, A. Functional effect of hemoglobin polymorphism on the hematological pattern of Gentile di Puglia sheep. J. Anim. Breed. Genet. 2006, 123, 122–130. [Google Scholar]
  14. Manca, L.; Di Luccia, A.; Pieragostini, E.; Naitana, S.; Masala, B. Haemoglobin I: a new beta-globin chain variant found in sheep of Italian breeds. Anim. Genet. 1993, 24, 203–204. [Google Scholar] [CrossRef] [PubMed]
  15. Scaloni, A.; Pieragostini, E.; Malori, A.; Ferrara, L.; Di Luccia, A. Bovine hemoglobin alpha-globin chain polymorphism: primary structure determination of two new genetic variants by mass spectrometry and amino acid sequencing. Biochimie 1998, 80, 333–338. [Google Scholar] [CrossRef] [PubMed]
  16. Pieragostini, E.; Scaloni, A.; Rullo, R.; Di Luccia, A. Identical marker alleles in Podolic cattle (Bos taurus) and Indian zebu (Bos indicus). Comp. Biochem. Physiol. B Biochem. Mol. Biol. 2000, 127, 1–9. [Google Scholar] [CrossRef] [PubMed]
  17. Pieragostini, E.; Di Luccia, A.; Rullo, R.; Bottiglieri, C. Hemoglobin phenotyes in Murgese horse. Ital. J. Anim. Sci. 2002, 1, 159–163. [Google Scholar]
  18. Pieragostini, E.; Rullo, R.; Scaloni, A.; Bramante, G.; Di Luccia, A. The alpha chains of goat hemoglobins: old and new variants in native Apulian breeds. Comp. Biochem. Physiol. B Biochem. Mol. Biol. 2005, 142, 18–27. [Google Scholar] [CrossRef] [PubMed]
  19. Alloggio, I.; Bramante, G.; Petazzi, F.; Pieragostini, E. Alpha and beta globin polymorphism in Italian islander sheep breeds. Small Rum. Res. 2008, 80, 116–119. [Google Scholar] [CrossRef]
  20. Goodman, M.; Czelusniak, J.; Koop, B.; Tagle, D.; Slightom, J. Globins: A Case Study in Molecular Phylogeny. Cold Spring Harbor Symp.Quant.Biol. 1987, 52, 875–890. [Google Scholar] [CrossRef] [PubMed]
  21. Schibler, L.; Vaiman, D.; Oustry, A.; Giraud-Delville, C.; Cribiu, E.P. Comparative gene mapping: a fine-scale survey of chromosome rearrangements between ruminants and humans. Genome Res. 1998, 8, 901–915. [Google Scholar] [PubMed]
  22. Vestri, R.; Pieragostini, E.; Yang, F.; di Gregorio, P.; Rando, A.; Masina, P. Expression of triplicated and quadruplicated alpha globin genes in sheep. Br. J. Haematol. 1991, 77, 110–116. [Google Scholar] [CrossRef] [PubMed]
  23. Vestri, R.; Pieragostini, E.; Ristaldi, M.S. Expression gradient in sheep alpha alpha and alpha alpha alpha globin gene haplotypes: mRNA levels. Blood. 1994, 83, 2317–2322. [Google Scholar] [PubMed]
  24. Garner, K.J.; Lingrel, J.B. A comparison of the beta A-and beta B-globin gene clusters of sheep. J. Mol. Evol. 1989, 28, 175–184. [Google Scholar] [CrossRef] [PubMed]
  25. Bangham, A.D. Distribution of electrophoretically different haemoglobins among cattle breed of Great Britain. Nature 1957, 179, 467–468. [Google Scholar] [CrossRef] [PubMed]
  26. Bangham, A.D.; Blumberg, B.S. Distribution of electrophoretically different haemoglobin among some cattle breeds of Europe and Africa. Nature 1958, 181, 1551–1552. [Google Scholar] [CrossRef] [PubMed]
  27. Schroeder, W.A.; Shelton, J.R.; Shelton, J.B.; Robberson, B.; Babin, D.R. A comparison of amino acid sequences in the β-chain of adult bovine haemoglobins A and B. Arch. Biochem. Biophys. 1967, 120, 124–135. [Google Scholar] [CrossRef] [PubMed]
  28. Crockett, J.R.; Koger, M.; Chapman, H.L., Jr. Genetics variations in hemoglobins of beef cattle. J. Anim. Sci. 1963, 22, 173–176. [Google Scholar]
  29. Carr, W.R. The haemoglobins of indigenous breeds of cattle in central Africa. Rhod. J. Agric. Res. 1964, 2, 93–94. [Google Scholar]
  30. Carr, W.R. A new haemoglobin variant. Rhod. J. Agric. Res. 1965, 3, 62. [Google Scholar]
  31. Efremov, G.; Braend, M. A new hemoglobin in cattle. Acta Vet. Scand. 1965, 6, 109–111. [Google Scholar] [PubMed]
  32. Braend, M. Haemoglobin variants of cattle, Anim. Blood. Groups Biochem. Genet. 1971, 2, 15–21. [Google Scholar] [CrossRef]
  33. Khanna, N.D.; Singh, H.; Bhatia, S.S.; Bhat, P.N. A rare hemoglobin variant in Afghan cattle and crosses. Anim. Blood. Groups Biochem. Genet. 1972, 3, 59–60. [Google Scholar] [CrossRef]
  34. Osterhoff, D.R. Haemoglobin types in African cattle. J. S. Afr. Vet. Med. Assoc. 1975, 185, 185–188. [Google Scholar]
  35. Schwellnus, M.; Guerin, G. Difference between the Hb C variants in Brahman and in indigenous Southern African cattle breeds. Anim. Blood Groups Biochem. Genet. 1977, 8, 161–169. [Google Scholar] [CrossRef]
  36. Han, S.K.; Suzukis, S. Studies on hemoglobin variants in Korean cattle. Anim. Blood Groups Biochem. Genet. 1976, 7, 21–25. [Google Scholar] [CrossRef] [PubMed]
  37. Namikawa, T.; Takanaka, O.; Takhashi, K. Haemoglobin Bali (Bovine): Beta18(Bl)Lys-His: one of the ‘missing links’ between beta and betaB of domestic cattle exists in the Bali cattle (Bovinae Bos banteng). Biochem. Genet. 1983, 21, 787–796. [Google Scholar]
  38. Andresen, E.; Broad, T.E.; Brown, S.; Cooper, D.W.; Di Stasio, L.; Dolling, C.H.S.; Fleet, M.; Hill, D.F.; Lauvergne, J.J.; Lundie, R.S.; Maddox, J.; Nicholas, F.W.; Rae, A.L.; Renieri, C.; Sponenberg, D.P.; Tucker, E.M. Revised Guideline for gene nomenclature in Ruminants. Genet. Sel. Evol. 1993, 27, 89–93. [Google Scholar]
  39. Web site of Swiss-Prot Protein knowledgebase: http://www.expasy.ch/sprot/.
  40. Huisman, T.H.; Adams, H.R.; Dimmock, M.O.; Edwards, W.E.; Wilson, J.B. The structure of goat hemoglobins. I. Structural studies of the beta chains of the hemoglobins of normal and anemic goats. J. Biol. Chem. 1967, 242, 2534–2541. [Google Scholar]
  41. Huisman, T.H.J.; Brandt, G.; Wilson, J.B. The structure of goat hemoglobins. II. Structural studies of the alpha chains of the hemoglobins A and B. J. Biol. Chem. 1968, 243, 3675–3686. [Google Scholar]
  42. Adams, H.R.; Boyd, E.M.; Wilson, J.B.; Miller, A.; Huisman, T.H. The structure of goat hemoglobins. 3. Hemoglobin D, a beta chain variant with one apparent amino acid substitution 21 AspYHis. Arch. Biochem. Biophys. 1968, 127, 398–405. [Google Scholar]
  43. Wrightstone, R.N.; Wilson, J.B.; Miller, A.; Huisman, T.H. The structure of goat hemoglobins. IV. A third beta chain variant beta E with three apparent amino acid substitutions. Arch. Biochem. Biophys. 1970, 138, 451–456. [Google Scholar]
  44. Bannister, J.V.; Bannister, W.H.; Wilson, J.B.; Lam, H.; Miller, A.; Huisman, T.H. The structure of goat hemoglobins. V. A fourth beta chain variant beta-D-Malta; 69 Asp is replaced by Gly with decreased oxygen affinity and occurring at a high frequency in Malta. Hemoglobin 1979, 3, 57–75. [Google Scholar]
  45. Kleinschmidt, T.; Braunitzer, G. The primary structure of the hemoglobin gamma-chains of fetal sheep (Ovis ammon) and goat (Capra aegagrus). Hoppe-Seyler Z. Physiol. Chem. 1982, 363, 789–796. [Google Scholar]
  46. Wilson, J.B.; Brandt, G.; Huisman, T.H. The structure of sheep hemoglobins. 3. Structural studies on the alpha chain of hemoglobin A. J. Biol. Chem. 1968, 243, 3687–3692. [Google Scholar]
  47. Huisman, T.H.; Dozy, AM.; Wilson, J.B.; Efremov, G.D.; Vaskov, B. Sheep hemoglobin D, an alpha-chain variant with one apparent amino acid substutution (alpha 15 Gly→Asp). Biochim. Biophys. Acta. 1968, 160, 467–469. [Google Scholar] [CrossRef] [PubMed]
  48. Vestri, R.; Giordano, P.C.; Bernini, L.F. Duplication of the hemoglobin alpha-chain gene in sheep: characterization of a new alpha-chain variant present in animals possessing the alpha Leu and the II alpha His chains. Biochem Genet. 1983, 21, 25–35. [Google Scholar]
  49. Boyer, S.H.; Hathaway, P.; Pascasio, F.; Bordley, J.; Orton, C.; Naughton, M.A. Differences in the amino acid sequences of tryptic peptides from three sheep hemoglobin beta chains. J. Biol. Chem. 1967, 242, 2211–2232. [Google Scholar] [PubMed]
  50. Wilson, J.B.; Miller, A.; Huisman, T.H. Production of hemoglobin C in the Moufflon (Ovis musimon Pallas, 1811) and the Barbary sheep (Ammotragus lervia Pallas, 1777) during experimental anemia: amino acid composition of tryptic peptides from the beta B and bet C chains. Biochem. Genet. 1970, 4, 677–688. [Google Scholar] [CrossRef] [PubMed]
  51. Darbre, P.D.; Lehmann, H. The gamma chain of the lamb. Biochim. Biophys. Acta 1976, 446, 10–18. [Google Scholar] [CrossRef] [PubMed]
  52. John, M.E.; John, M. A new haemoglobin beta chain variant in sheep. Anim. Blood Groups Biochem. Genet. 1977, 8, 183–190. [Google Scholar] [CrossRef] [PubMed]
  53. Garrick, M.D.; Garrick, L.M. Haemoglobins and globin genes. In Red Blood Cell in Domestic Animals; Agar, N.S., Board, P.G., Eds.; Elsevier: Amsterdam, The Netherlands, 1983; pp. 165–207. [Google Scholar]
  54. Kilgour, L.; Dixon, S.C.; Tucker, E.M. Two new sheep haemoglobins, one of which is replaced by haemoglobin C in anaemia. Anim. Genet. 1990, 21, 115–121. [Google Scholar] [CrossRef] [PubMed]
  55. Kretschmer, P.J.; Coon, H.C.; Davis, A.; Harrison, M.; Nienhuis, A.W. Haemoglobin switching in sheep. Isolation of the fetal gamma-globin gene and demonstration that the fetal gamma- and adult beta A-globin genes lie within eight kilobase segments of homologous DNA. J. Biol. Chem. 1981, 256, 1975–1982. [Google Scholar]
  56. Tucker, E.M.; Di Stasio, L. Loci controlling blood and milk polymorphisms. In Mendelian Ineritance in Sheep (Mis 96); Lauvergne, J.J., Dolling, C.H.S., Renieri, C., Eds.; Cogovica/Cognasac: Clamart, France, 1996; p. 214. [Google Scholar]
  57. Raymond, M.; Rousset, F. Genepop (ver. 1.2): a population genetics software for exact. tests and ecumenicism. J. Hered. 1995, 86, 248–249. [Google Scholar]
  58. Pieragostini, E.; Di Luccia, A.; Rullo, R. Alpha and beta globin gene polymorphism in Gentile di Puglia sheep. In Proceedings of the XIVNational Conference of Association of Animal Production, Firenze, Italy, 12–15 June 2001; pp. 91–93.
  59. Serreri, E.; Cherchi, L.; Franceschi, P.; Manca, L.; Masala, B. Sheep Hb I variant, or beta13(A10)Gly→Ser, in breeds from Corsica: detection by gene sequencing. Hemoglobin 1998, 22, 525–528. [Google Scholar] [CrossRef] [PubMed]
  60. Hadjisterkotis, E.; Manca, L.; Naitana, S.; Masala, B. A comparative study on the haemoglobin polymorphism of domestic sheep of the islands of Chios Cyprus and Sardinia. Comp. Biochem. Physiol. A-Physiol. 1995, 112, 547–552. [Google Scholar]
  61. Jain, N.C. Essential of Veterinary Hematology; Lea & Febiger: Philadelphia, PA, USA, 1993; pp. 19–53. [Google Scholar]
  62. Bragg, W.L.; Perutz, M.F. The structure of haemoglobin: Fourier projections on the 010 plane. Proc. R. Soc. Lond. A 1954, 225, 315–329. [Google Scholar]
  63. Perutz, M.F.; Wilkinson, A.J.; Paoli, M.; Dodson, G.G. The stereochemical mechanism of the cooperative effect in haemoglobin revisited. Ann. Rev. Biophys. Biomol. Struct. 1998, 27, 1–34. [Google Scholar] [CrossRef]
  64. Bunn, H.F.; Forget, B.G. Hemoglobin: Molecular, Genetic, and Clinical Aspects; W.B. Saunders Co: Philadelphia, PA, USA, 1986; pp. 1–690. [Google Scholar]
  65. Garrick, M.D.; Garrick, L.M. Hemoglobins and globin genes. In Red Blood Cells of Domestic Animals; Agar, N.S., Board, P.G., Eds.; Elsevier Science Publisher B.V.: Amsterdam, The Netherlands, 1983; pp. 165–207. [Google Scholar]
  66. Goodman, M.; Czelusniak, J.; Koop, B.; Tagle, D.; Slightom, J. Globins: A case study in molecular phylogeny. Cold Spring Harb. Symp. Quant. Biol. 1987, 52, 875–890. [Google Scholar] [CrossRef] [PubMed]
  67. Hardison, R. Evolution of the Haemoglobins. In Encyclopedia of Genetics; Reeve, E., Ed.; Fitzroy Dearborn: London, UK, 2001; pp. 401–411. [Google Scholar]
  68. Genetically Abnormal Red Cells; Nagel, R.L. (Ed.) CRC press: Boca Raton, FL, USA, 1988; Volume I and II.
  69. Weatherall, D.J.; Clegg, J.B.; Higgs, D.R.; Wood, W.G. Hemoglobinopathies. In The Metabolic and Molecular Bases of Inherited Disease, 8th ed.; McGraw Hill: New York, NY, USA, 2001; pp. 4571–4636. [Google Scholar]
  70. Garrick, M.D. Hemoglobin switching. In Red Blood Cells of Domestic Animals; Agar, N.S., Board, P.G., Eds.; Elsevier Science Publisher B.V.: Amsterdam, The Netherlands, 1983; pp. 209–223. [Google Scholar]
  71. Bogner, P.; Csutora, P.; Cameron, I.L.; Wheatley, D.N.; Miseta, A. Augmented water binding and low cellular water content in erythrocytes of camel and camelids. Biophys. J. 1998, 75, 3085–3091. [Google Scholar] [CrossRef] [PubMed]
  72. Bunn, H.F. Regulation of Hemoglobin Function in Mammals. Am. Zool. 1980, 20, 199–211. [Google Scholar]
  73. Perutz, M.F.; Imai, K. Regulation of oxygen affinity of mammalian haemoglobins. J. Mol. Biol. 1980, 136, 183–191. [Google Scholar] [CrossRef] [PubMed]
  74. Di Vito, A.; Schwantes, A.R.; Schwantes, M.L.B. Functional properties of the three hemoglobin phenotypes of Nelore cattle. Genet. Mol. Biol. 2002, 25, 135–138. [Google Scholar] [CrossRef]
  75. Huisman, T.H.J.; Kitchens, J. Oxygen equilibria studies of the hemoglobins from normal and anemic sheep and goats. Am. J. Physio. 1968, 215, 140–146. [Google Scholar]
  76. Nagel, R.L. Red Cells with high oxygen affinity hemoglobins: Erythrocytosis. In Genetically Abnormal Red Cells; Nagel, R.L., Ed.; CRC press: Boca Raton, FL, USA, 1988; Volume II, pp. 31–76. [Google Scholar]
  77. Kister, J.; Marden, M.C.; Bohn, B.; Poyart, C. Functional properties of hemoglobin in human red cells: II. Determination of the Bohr effect. Resp. Physiol. 1988, 73, 363–378. [Google Scholar] [CrossRef]