Article

Genetic Diversity and Differentiation of Oreochromis mossambicus (Peters, 1852) Inferred from Combined Mitochondrial DNA Markers (COI + D-Loop) in Limpopo Province, South Africa


by
Evelyn Mokgadi Raphalo
Aquaculture Research Unit, School of Agricultural and Environmental Sciences, University of Limpopo, Turfloop Campus, Private Bag X1106, Sovenga 0727, Limpopo, South Africa
Diversity 2026, 18(8), 491; https://doi.org/10.3390/d18080491
Submission received: 12 April 2026 / Revised: 8 May 2026 / Accepted: 14 May 2026 / Published: 18 August 2026
(This article belongs to the Section Phylogeny and Evolution)

Abstract

The native Mozambique tilapia (Oreochromis mossambicus) serves as a cornerstone for aquaculture development in Limpopo Province, South Africa. Its adaptability to diverse culture systems, including backyard farming, highlights its potential to address food insecurity and poverty in rural communities. However, the long-term sustainability of this initiative depends on the genetic health and management of the cultured populations. This study investigated the evolutionary history, genetic diversity, and differentiation of O. mossambicus across five localities in Limpopo Province (Cordier reservoir, Nandoni reservoir, Mall of the North pond, University of Limpopo pond, and Polokwane Farm) using the combined mitochondrial DNA (COI + D-loop) dataset. Phylogenetic analysis revealed monophyly, with three well-supported clades. There was evidence of genetic affinities among some individuals within the five localities, supported by low genetic variation among populations and a common haplotype shared across all five localities. The Mall of the North population showed no genetic variation (Hd = 0.00; π = 0.00), indicating high homogeneity, whereas Nandoni exhibited the highest diversity (Hd = 0.83; π = 0.01), suggesting its potential as a primary broodstock source. These findings provide an important genetic baseline for farmed O. mossambicus, offering essential information for sustainable aquaculture management and conservation planning in the province.

1. Introduction

Mozambique tilapia, Oreochromis mossambicus is one of the most widely introduced tilapia species and has established feral populations in many regions where it has been introduced [1,2,3]. However, native populations of O. mossambicus are considered genetically endangered and vulnerable by the IUCN, primarily due to hybridization and competition for food and habitat with introduced congeners [4,5,6,7,8]. Due to the close genetic relatedness among tilapia species, hybridization is common among congeners. While hybridization among native congeners may occur naturally, hybridization with introduced species can replace natural genetic diversity with admixed populations, thereby compromising the conservation and management of wild genetic resources [9,10,11]. This phenomenon occurs because hybrids may exhibit higher fitness than parental strains [12] in the F1 generation, but also reduced long-term fitness because of breakdown of co-adapted gene complexes [10]. Oreochromis niloticus is one of the most widely introduced aquaculture species and is known to hybridize with O. mossambicus within its native range. Hybridization between O. niloticus and native Oreochromis spp. has been extensively documented [2,9,13,14,15]. However, the extent of hybridization and its impact on aquaculture production remain poorly understood. It is therefore imperative to assess the genetic health of both wild and cultured populations.
In South Africa, Oreochromis mossambicus is the only native tilapia species widely used in aquaculture due to its favourable biological characteristics, including early maturity, high fecundity, rapid growth, good meat quality, and tolerance to extreme environmental conditions. These traits allow the species to be cultured across a range of systems, from subsistence “backyard” ponds to more intensive hatchery operations. Tilapia is referred to as the poor man’s fish, as it plays a vital role in food security and livelihoods. In Limpopo Province, most aquaculture activities are small-scale and subsistence-based, with production primarily intended for household or community consumption. Farmers typically operate in rural areas and practice aquaculture as a secondary livelihood activity using simple pond systems. Despite its suitability and local acceptance, production has not yet reached commercial scale, largely due to constraints such as the high cost of commercial feeds and overpopulation due to precocious sexual maturity [16].
A key but often overlooked constraint is the lack of access to high-quality seed [17,18]. The quality of fingerlings is critical to aquaculture success, as poor-quality seed can negatively affect the entire production cycle, from stocking to harvest [19,20,21]. In response to these challenges, the South African government, through the Department of Forestry, Fisheries and the Environment (DFFE), launched initiatives such as Operation Phakisa to promote aquaculture development. As part of this initiative, government hatcheries, including the Turfloop hatchery in Limpopo Province, were established to supply affordable fingerlings to local farmers.
However, access to seedstock from these hatcheries remains limited for many small-scale farmers due to financial and logistical constraints. Consequently, most farmers often rely on wild-caught fingerlings and broodstock sourced from nearby rivers and reservoirs, which impact biodiversity and wild stocks. From these, a small number of high-performing individuals are selected based on phenotypic traits and used as founder stock. In a highly fecund species such as O. mossambicus, this practice increases the risk of inbreeding, as a limited number of individuals contribute excessively to subsequent generations. Over time, this reduces genetic variability and may lead to inbreeding depression, negatively affecting growth performance, survival, and overall fitness [22,23,24,25].
In addition, tilapia species in the wild readily hybridize, producing offspring that are difficult to distinguish morphologically [9,26,27,28]. As a result, wild-sourced broodstock may consist of hybrids, potentially influencing aquaculture performance depending on hybrid fitness and possible hybrid breakdown in subsequent generations. Although it is known that farmers use wild O. mossambicus as broodstock, the genetic relationship between wild and farmed populations remains unclear. Furthermore, poor hatchery and farm management practices, such as a lack of broodstock records, absence of pedigree information, mixing of stocks, unregulated breeding, introduction of unimproved wild fish into stocks, and escape of cultured fish into the wild can exacerbate genetic deterioration [17]. With the commercial potential of O. mossambicus in Limpopo Province and its acceptance by the communities, there is a pressing need to continuously assess the genetic diversity of cultured populations before it is further compromised for successful sustainable aquaculture.
Genetic markers are useful to determine whether populations from different localities are genetically differentiated from each other by assessing the level of genetic diversity, structure, variation, and differentiation within and among populations [29]. Genetic characterization not only supports conservation efforts but also informs selective breeding programmes aimed at improving aquaculture productivity [30,31].
The genetic integrity of farmed O. mossambicus populations in South Africa remains poorly understood. Therefore, this study aims to assess and compare the genetic diversity and differentiation of cultured and wild Oreochromis mossambicus populations in Limpopo Province using mitochondrial DNA markers (COI and D-loop), and to infer the evolutionary history of cultured populations. In this study, mitochondrial DNA markers, the cytochrome c oxidase subunit I (COI) gene and the D-loop control region, were used due to their maternal inheritance and relatively high mutation rates, making them suitable for population genetic analyses [32]. Mitochondrial DNA (mtDNA) has been extensively used as a molecular marker in ecology, evolutionary biology, and population genetics.
The findings of this study will contribute to aquaculture by informing broodstock selection for sustainable production and will also support conservation efforts by improving understanding of the species’ genetic diversity, evolutionary history, and population structure [33].

2. Materials and Methods

2.1. Study Localities

Cordier reservoir is a privately owned irrigation reservoir located at the ZZ2 plantations. It is used by local farmers for fishing, angling and irrigation. The reservoir currently contains Oreochromis niloticus, Oreochromis mossambicus and their hybrids. According to the manager, the fish stocked in the reservoir were collected from the middle Letaba River by means of angling. Nandoni reservoir was constructed on the Luvuvhu River by the Department of Water affairs and serves as an important source of water for domestic, agricultural, and industrial purposes in the region. The reservoir hosts a variety of freshwater fish species, making it suitable for fisheries. Additionally, the reservoir supports local livelihoods through fishing and other water-related activities. The Mall of the North pond was established for recreational purposes and was initially stocked with six individuals of Oreochromis mossambicus; no additional fish have been introduced into the pond. The source of the fish in this pond is unknown. The University of Limpopo pond is located within the university premises. However, the pond is not formally regulated, and there are no available records regarding its establishment, management history, or the original source of the fish populations. The pond currently contains Oreochromis mossambicus and Clarias gariepinus, which are commonly used by students for research and practical activities. Due to the lack of regulation and monitoring, fish previously used in research projects are sometimes reintroduced into the pond. The pond was selected for this study because excess fish are occasionally distributed to local farmers when the pond becomes overpopulated. Polokwane Farm consists of four aquaculture ponds stocked with Oreochromis mossambicus. The farm is primarily used for fish production to supply local farmers and supermarkets within the surrounding communities. According to the current farm owner, the property was purchased from a previous owner who did not provide historical information regarding the establishment of the ponds, the origin of the founder stock, or breeding records.

2.2. Sample Collection

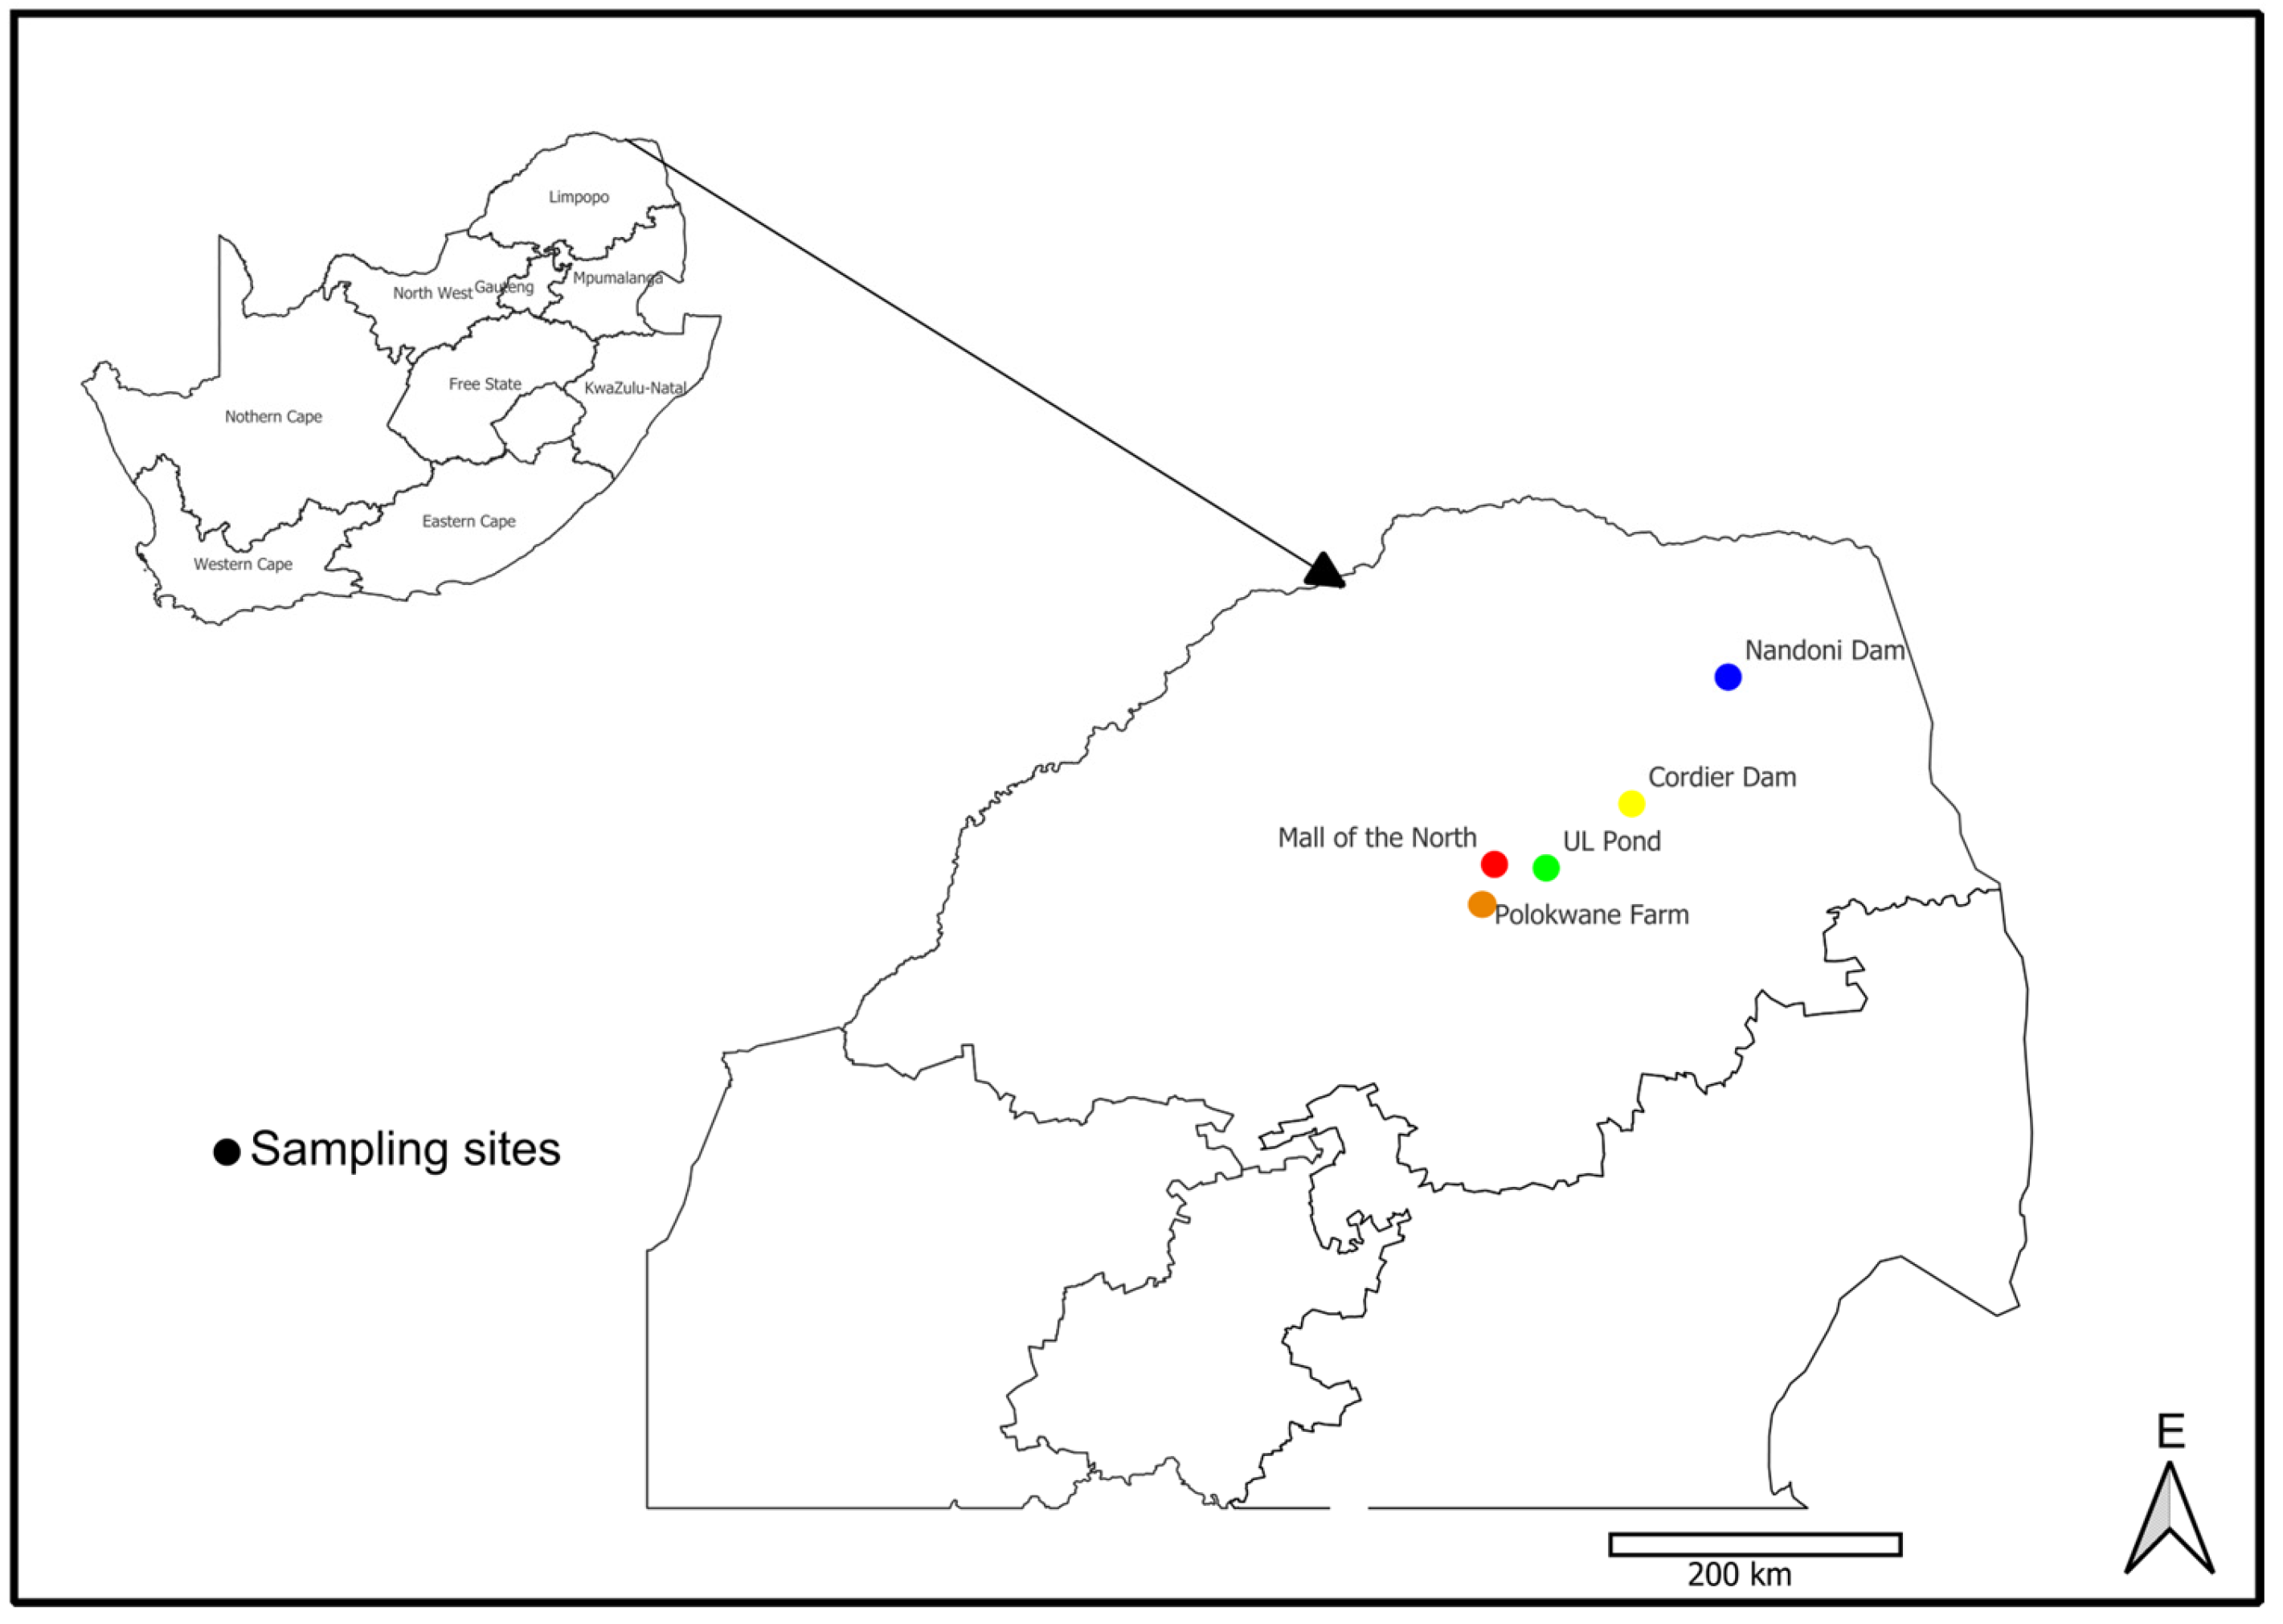
Oreochromis mossambicus fish samples were collected from Cordier reservoir (−23.57909, 30.14240), Nandoni reservoir (−22.98011, 30.59801), Mall of the North pond (−23.86892, 29.49722), University of Limpopo pond (−23.88870, 29.73901), and Polokwane Farm (−23.97742, 29.41365) (Figure 1; Table 1). The samples were collected twice, in the summers of 2021 and 2022 (Permit No: ZA/LP/116078), using sein nets (10 mm and 30 mm, 2 m × 4 m in length); the sample sites were chosen randomly based on accessibility. To avoid sampling individuals from the same population, samples were collected randomly at different sites of each locality. The fish were placed in an open drum with oxygen stones and transported to the Aquaculture Research Unit at the University of Limpopo, where they were acclimatized for two weeks, fed with commercial fishmeal pellet at 10% of the body weight, twice a day. Small tissue biopsies were cut from the collected individuals and preserved in 95% ethanol for DNA extraction.

2.3. DNA Extraction, Polymerase Chain Reaction, and Sequencing

Genomic DNA was extracted from the preserved tissue biopsy using the MACHEREY-NAGEL GmbH & Co. KG, Valencienner Str. 11 (Duren, Germany) NucleoSpin Tissue DNA extraction kit, following the manufacturer’s specifications. The quality and quantity of the extracted DNA were evaluated using 1% gel electrophoresis and a nanodrop spectrophotometer, Thermo Fisher Scientific, 168 Third Avenue, Waltham, (MA, USA), respectively. The extracted DNA was stored at −20 °C until required for polymerase chain reaction (PCR) amplification. The PCRs were conducted using two mitochondrial primer pairs; the Cytochrome c oxidase I (COI) FishF1 (5′-TCAACCAACCACAAAGACATTGGCAC-3′) and FishR1 (5′-TAGACTTCTGGGTGGCCAAAGAATCA-3′) [41] and the D-loop control region ORMT-F (5′-CTAACTCCCAAAGCTAGGAATTCT-3′) and ORMT-R (5′-CTTATGCAAGCGTCGATGAAA-3′) [42]. The PCR cocktail consisted of 12 µL of the One Taq- Quick-load 2X master mix with standard buffer, New England Biolabs, 240 County Road, Ipswich, (MA, USA), 1 µL of forward primer, 1 µL of reverse primer from 10 µM of the working stock, 8 µL of PCR water, and 3 µL of 8 ng/µL undiluted DNA from each sample, for a total volume of 25 µL. PCR cycling was performed in Thermo Fisher thermocycler, Thermo Fisher Scientific, 168 Third Avenue, Waltham, (MA, USA), using an initial denaturation step at 95 °C for 15 min, followed by 35 cycles of denaturation at 94 °C for 45 s, annealing temperature (Ta: D-loop = 55 °C and Ta: COI = 50 °C) for 45 s, and extension at 72 °C for 1 min. The process concluded with a final extension at 72 °C for 10 min. The PCR products were examined by 1.5% agarose gel electrophoresis in 1 × TAE buffer loaded into the Electrophoresis System for 30 min at 120 V and visualized under ultraviolet light. Sixty successfully amplified amplicons for both COI and D-loop gene fragments (Table 1) were sent for sequencing at Inqaba Biotechnical Industries, 525 Justice Mahomed Street, Muckleneuk, (Pretoria, South Africa).

2.4. Data Analyses

A total of 60 raw DNA sequences for each marker received from Inqaba Biotechnical Industries were edited and cleaned in Chromas software, version 2.6.6, Technelysium Pty Ltd., Unit 707, 45 Boundary Street, (South Brisbane, Australia). The sequences for each gene were then individually confirmed using the BLAST search algorithm (https://blast.ncbi.nlm.nih.gov/Blast.cgi, accessed: 15 July 2023) in GenBank. The cleaned sequences were aligned using ClustalW, and trimmed to equal size in BioEdit version 7.2.5 [43]. The two sequence datasets were concatenated into the combined mtDNA dataset using SeaView version 4 [44] to be used in the analyses. Since COI and D-loop genes evolve at different rates, the combined mtDNA dataset was partitioned into four partitions, comprising three COI codons (codon1, codon2, and codon3) and the D-loop control region. The substitution model parameters were estimated for each partition separately in IQ-TREE version 3.0.1 [45], using the Partition Analysis Model for multi-gene alignments [46] based on the Akaike information criterion (AIC).

2.5. Phylogenetic Analysis and Genetic Distance Estimation

The phylogenetic tree was inferred in MrBayes version 3.2.7 [47]. Oreochromis niloticus and O. aureus (Table 1) sequences from GenBank were included in the analysis as outgroups. MrBayes was run with default parameters using four Monte Carlo Markov chains (MCMC) initiated with a randomly chosen starting tree topology. Each analysis consisted of two separate runs for 10 million generations, sampling each chain every 1000th generation. The first 25% of the sampled trees were discarded as burn-in. Nodes with posterior probability values ≤ 0.95 were regarded as poorly resolved. A 50% majority-rule consensus tree was generated from trees retained from each run as part of the output. The final phylogenetic tree was visualized and edited in FigTree version 1.4.3 [48]. Inter- and intra-population genetic divergence were estimated using the pairwise distance model in MEGA X [49]. Additionally, the mean sequence divergence between and within locality type (reservoir vs. pond) was estimated.

2.6. Genetic Diversity and Genetic Differentiation

Genetic diversity indices, including haplotype diversity (Hd), number of haplotypes (h), and nucleotide diversity (π), were estimated for the overall dataset and for each population using DnaSP version 6.12 software [50]. The relationship among the haplotypes retrieved in the current study was inferred using Bayesian Inference in MrBayes and the TCS network [51]. A haplotype network was constructed using a TCS network based on 95% statistical parsimony, implemented in PopART [52]. Sites with gaps were excluded from the analysis. MrBayes was run with the same parameter settings as the phylogenetic tree above. Genetic differentiation of O. mossambicus populations was estimated using Analysis of Molecular Variance (AMOVA) with 10,000 permutations in Arlequin version 3.5 [53].

2.7. Neutrality Test and Mismatch Distribution Analyses

Demographic history and neutrality [Tajima’s D [54] and Fu’s Fs [55]] tests were performed using Arlequin version 3.5 [53], running 1000 simulations under a selective neutrality model.

3. Results

3.1. Phylogenetic Analysis and Genetic Distance

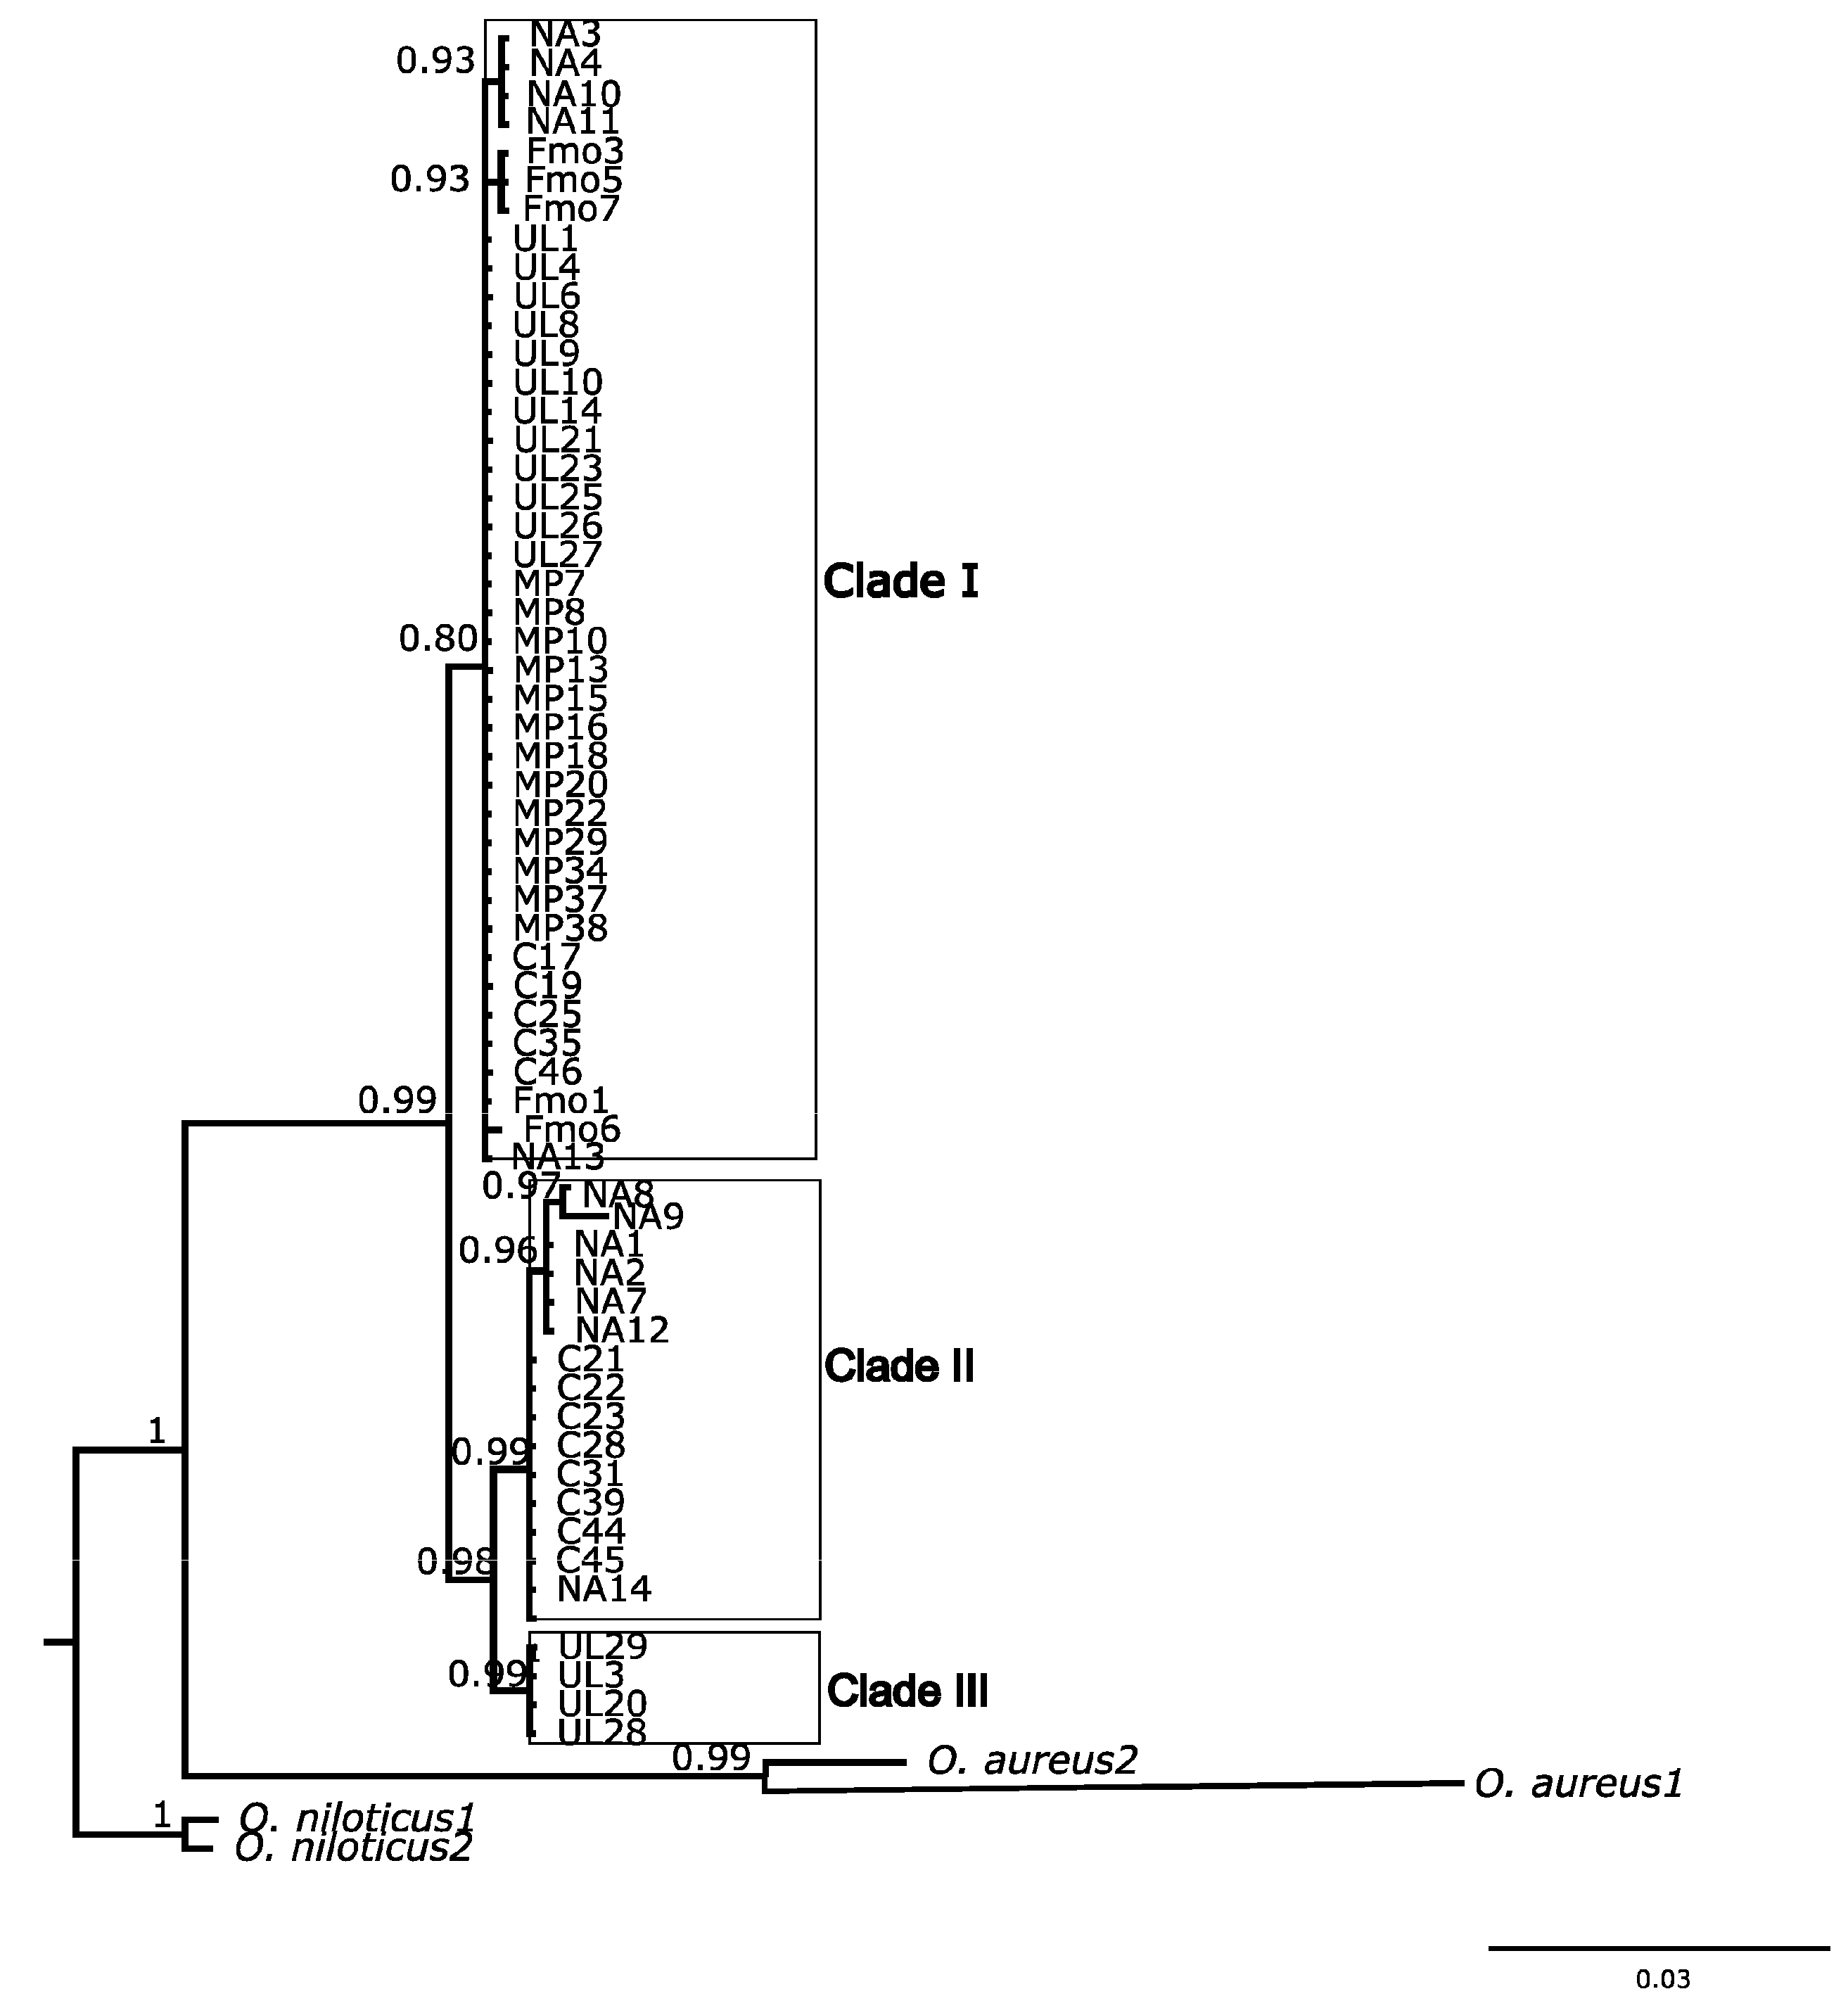
A total of 494bp (COI) and 382bp (D-loop) of clean sequences were concatenated into an 876bp mtDNA dataset. The Hasegawa–Kishio–Yano (HKY) model with gamma was determined as the best-fit model for the four partitions. The combined mtDNA sequence recovered O. mossambicus populations used in the current study as monophyletic, based on Bayesian inference. The five O. mossambicus populations were clustered into three major clades with strong statistical support (Pp ≥ 0.95; Figure 2). Clade I was split into three poorly resolved subclades, comprising populations from Nandoni reservoir, Polokwane Farm, and the third subclade containing individuals from all locations clustered together. Clade II was divided into a subclade (Pp > 0.95) comprising some individuals from Nandoni and the second subclade (Pp > 0.95) comprising sequences from Nandoni and Cordier reservoirs clustered together. Clade III (Pp > 0.95) was unique to individuals from UL Pond. The pairwise genetic distance analysis revealed a lack of variation within and among populations, with the exception of Cordier and Nandoni reservoirs (Table 2). Among population pairwise distance analysis revealed slight genetic distinctiveness (0.01) of Cordier reservoir and Nandoni reservoir from the rest of the populations, and lack of variation among populations from UL, MP, and Fmo. The pairwise genetic divergence within groups (reservoirs and ponds) was 0.01 and 0.00, respectively, while the genetic distance between these groups was 0.01.

3.2. Genetic Diversity and Differentiation

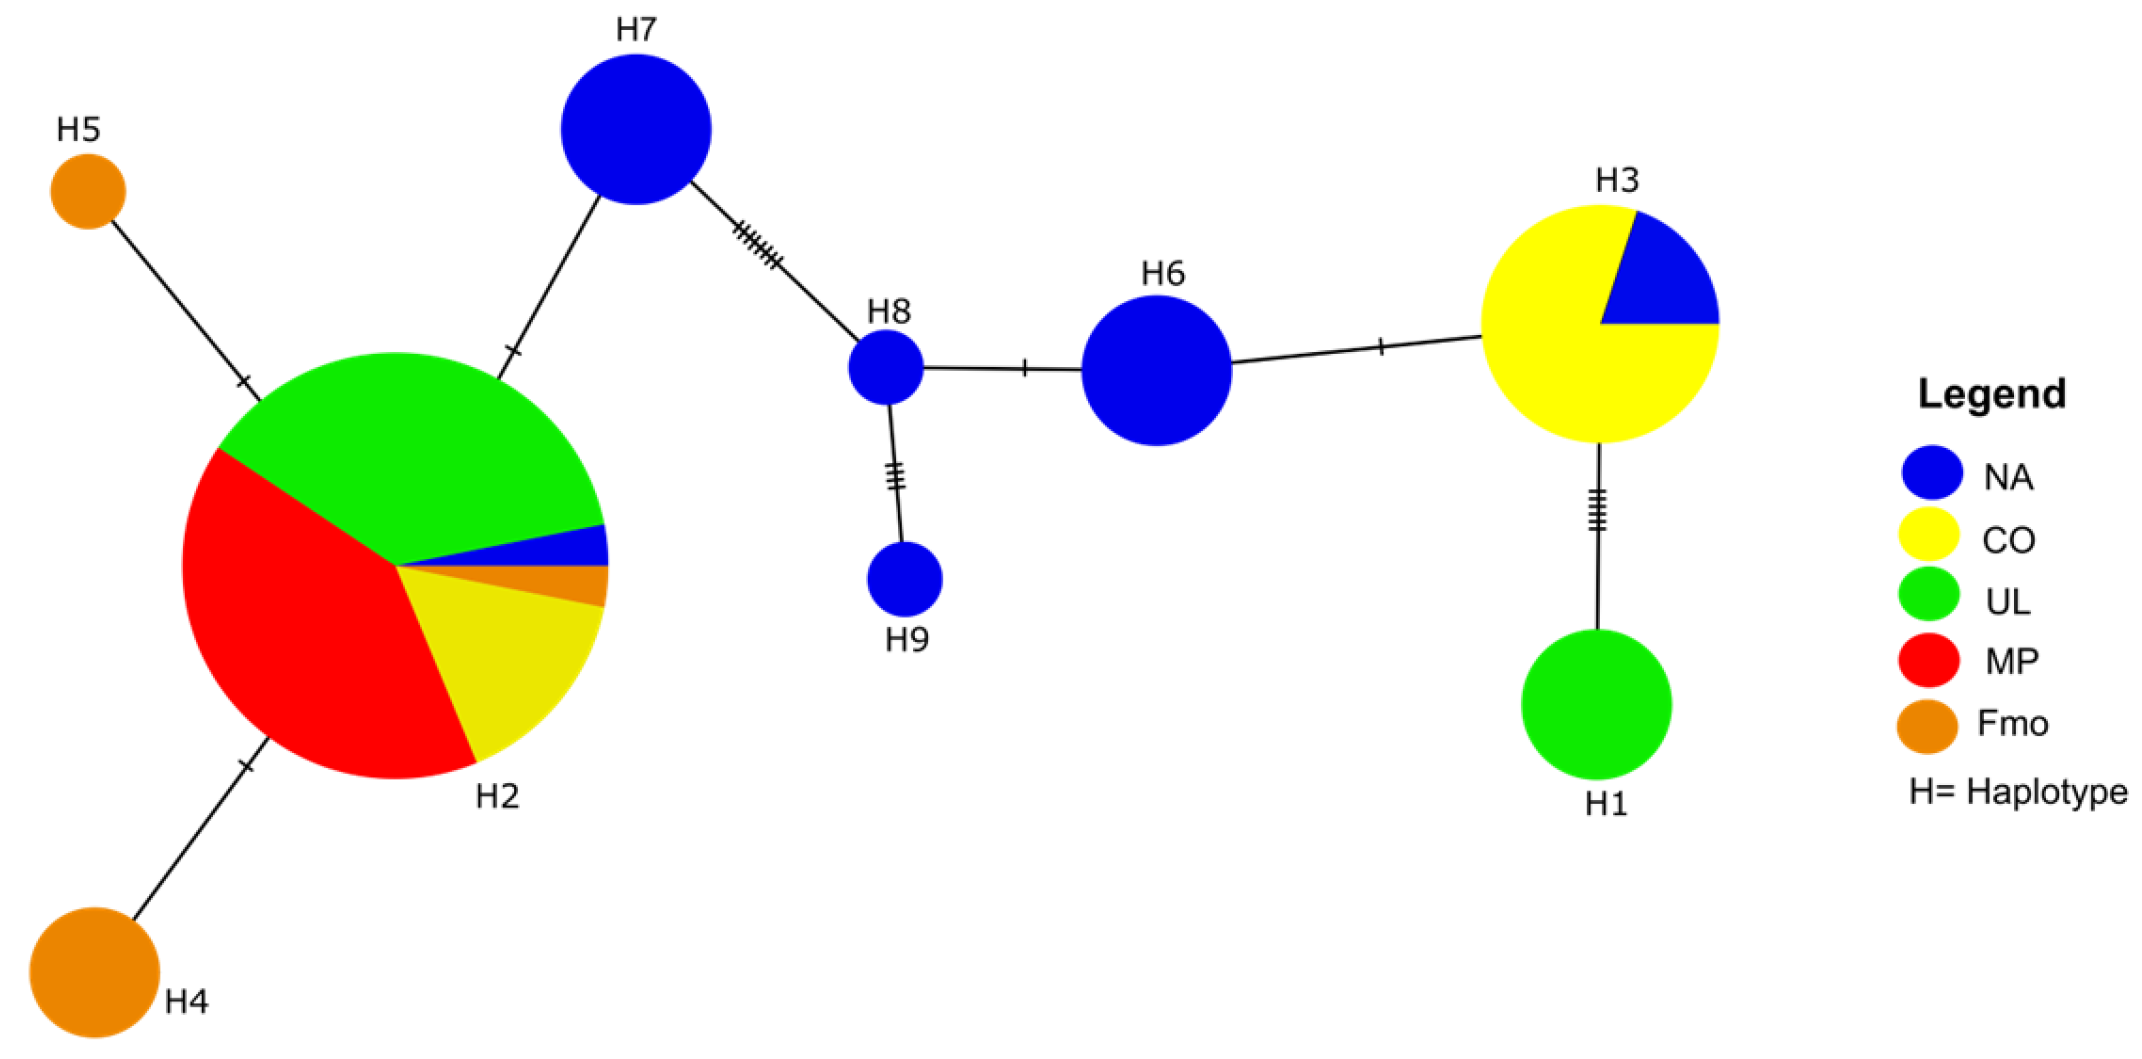
The number of haplotypes, number of polymorphic sites, the estimated values of haplotype diversity and nucleotide diversity within each population and the combined populations of O. mossambicus investigated in this study are presented in Table 3. The haplotype diversity (Hd) and nucleotide diversity (π) for the overall dataset were 0.68 and 0.01, respectively, with 19 segregating sites (S). The results indicated a lack of genetic diversity in the MP population (Hd = 0.00 and π = 0.00), with no variable sites. The Nandoni population showed the highest values with an Hd of 0.833, followed by Fmo (Hd = 0.70) and then Cordier population (0.51), and a low π of 0.01 in all localities.
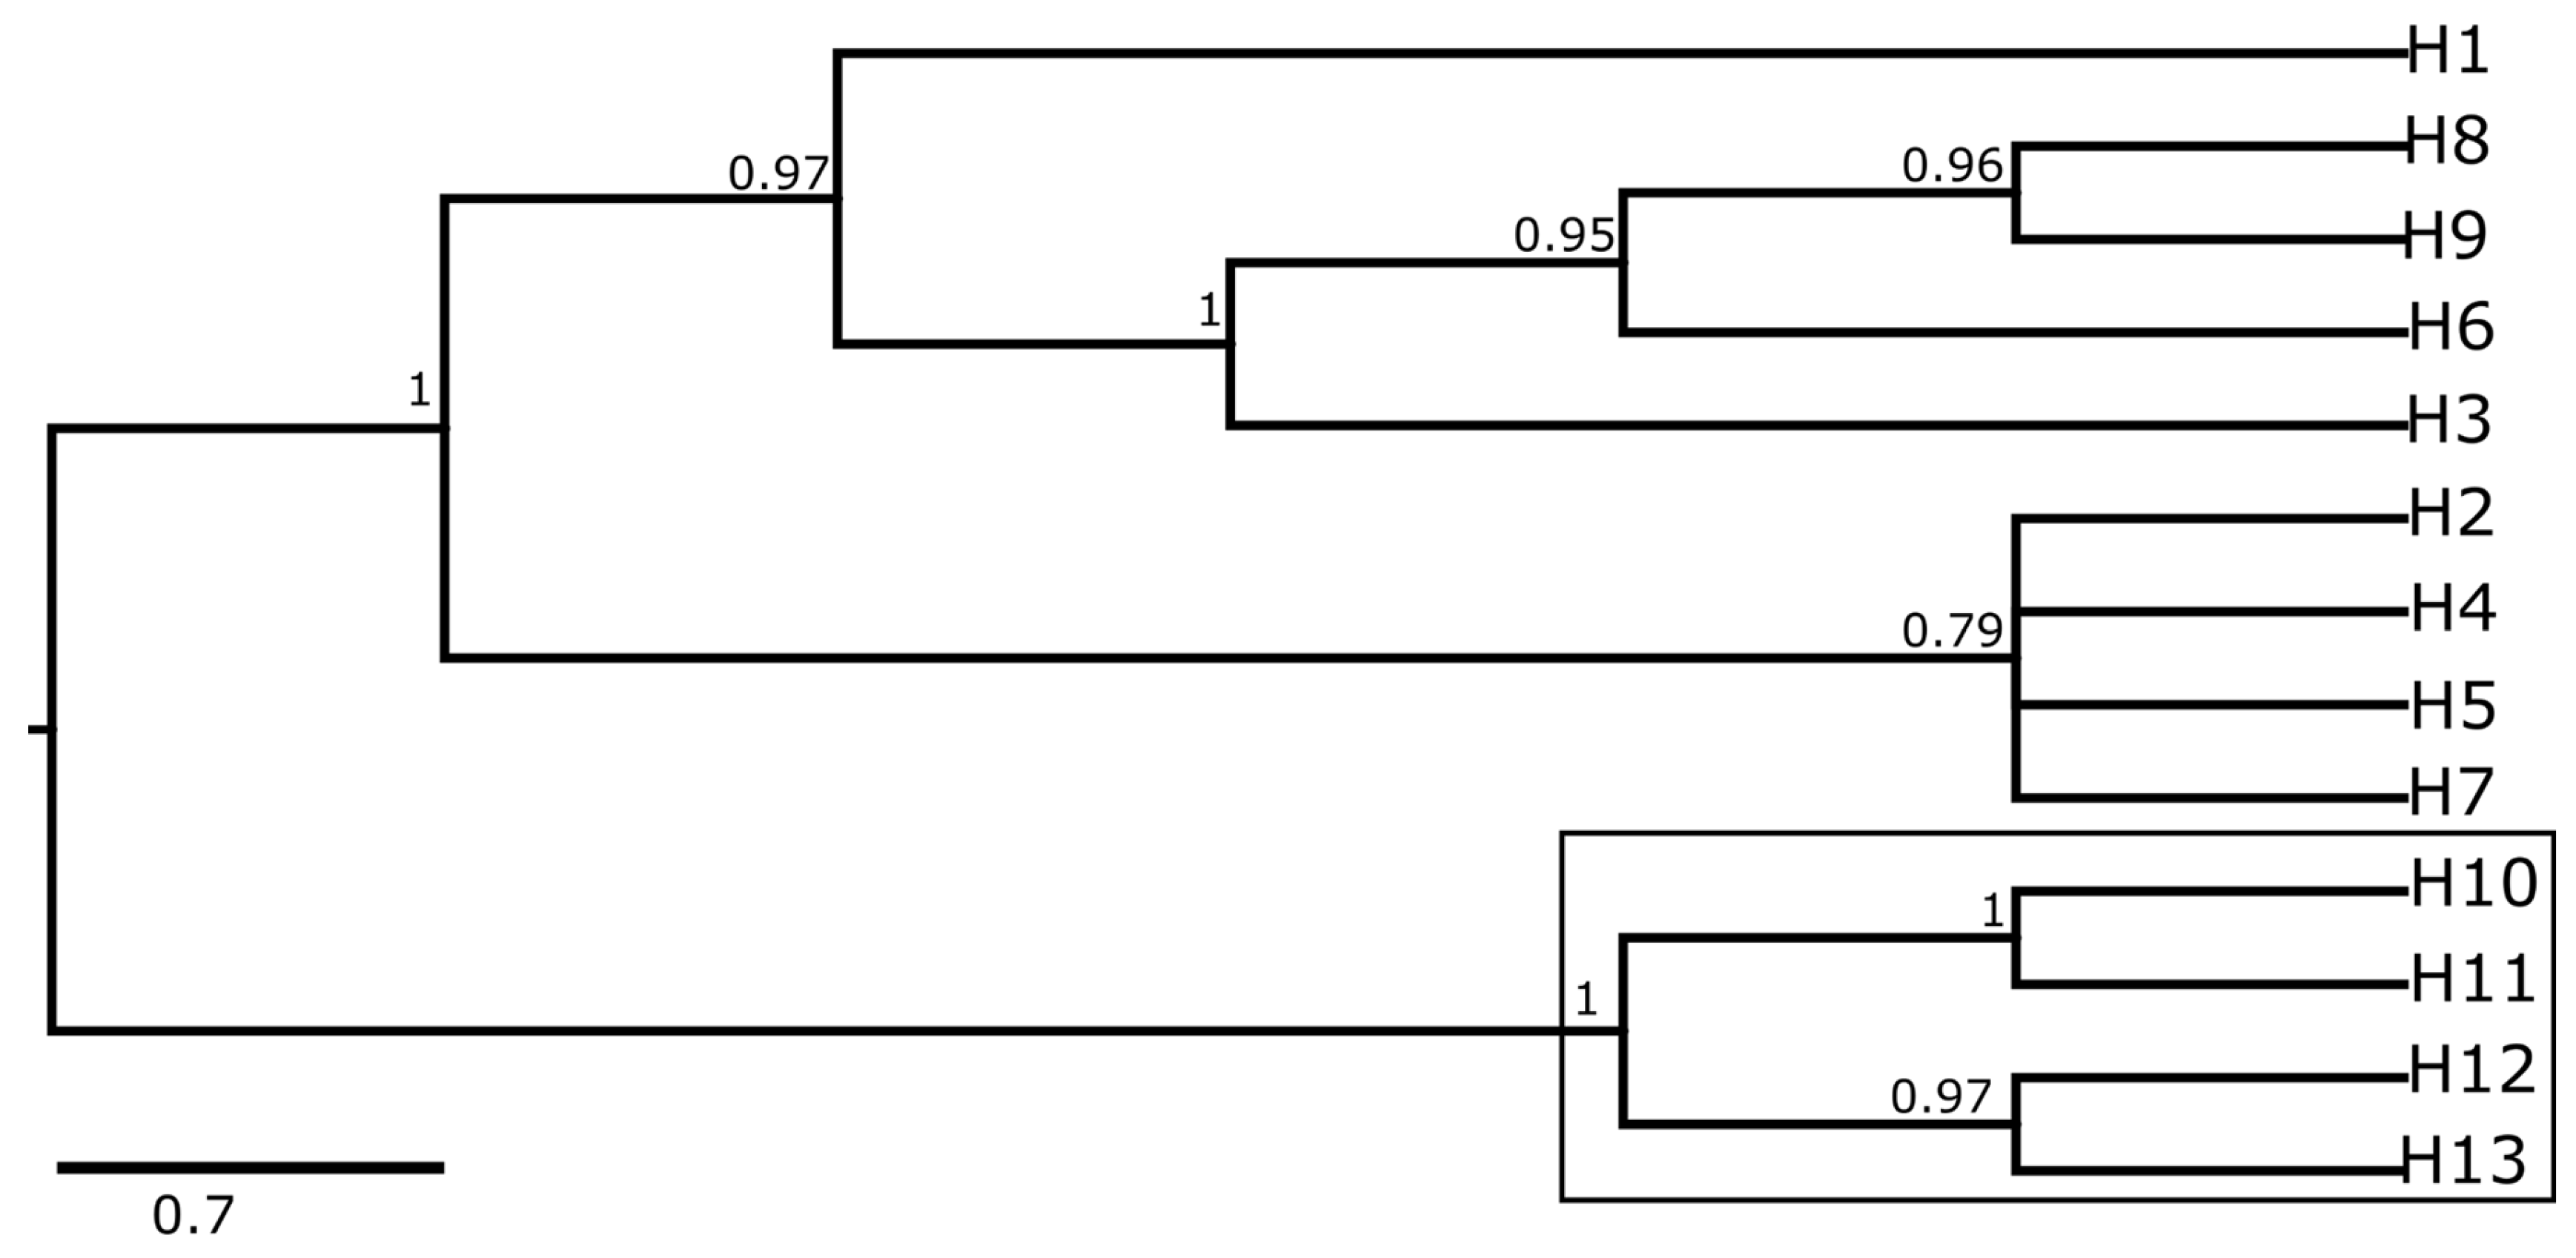
The median-joining network retrieved nine haplotypes comprising seven haplotypes unique to a given population and two shared among populations (Figure 3), connected by multiple mutational steps. This may be due to loss of haplotypes over time [56] or missing sample sites between the current localities. Haplotype 1 was unique to the UL pond and haplotypes 4 and 5 were restricted to Polokwane farm, while haplotypes 6–9 were restricted to the Nandoni population. Haplotype 2 was the most prevalent, occurring in all five populations of O. mossambicus; haplotype 3 was shared between some individuals from Nandoni and Cordier. On the other hand, individuals from MP exhibited the dominant haplotype 2 only. The results from this study suggest a shared maternal ancestor among the five populations and that haplotype 2 might be an ancestral haplotype. The haplotype topology (Figure 4) divided the haplotypes into two clades, with haplotype 1, unique to the UL pond, as the sister subclade to a subclade comprising Haplotypes 3, 6, 8 and 9. The haplotype tree topology supported the relationship presented by the haplotype network and the Bayesian topology. The results of the AMOVA analysis showed that the highest percentage of genetic variation occurred within populations (51.22%; Fst = 0.48 **), followed by 43.53% (Fct = 0.43 **) among groups (grouped into reservoir versus pond), and the lowest genetic variation of 5.25% (Fsc = 0.09) was observed among populations within groups (Table 4).

3.3. Neutrality Test

The estimated Tajima’s D values were positive and not significantly different from a model of neutral evolution in all populations and the overall O. mossambicus population, except in the population from Cordier, which showed a positive and significant value (Table 3). On the other hand, Fu’s Fs values were positive and not significant in all populations except for UL and CO populations, which were positive and significant, while negative and insignificant in Polokwane Farm.

4. Discussion

This study investigated the genetic diversity and differentiation of one of the most economically important aquaculture species in South Africa, the Mozambique tilapia, from selected reservoirs and ponds in the Limpopo Province based on the combined mitochondrial DNA dataset. Genetic diversity is one of the most important bases of biodiversity as it provides the potential for species or populations to adapt to environmental changes [57,58]. These environmental changes threaten biodiversity and the species’ potential to adapt to future environments [59]. Understanding the genetic diversity of Mozambique tilapia populations is crucial for the selection of good quality broodstock for aquaculture, effective management and conservation strategies, as the species is recorded as Vulnerable on the IUCN checklist [6]. The phylogenetic analysis recovered the five populations of Oreochromis mossambicus as monophyletic with significantly high posterior probability values. Comparison of intra-species genetic diversity based on D-loop and COI regions revealed higher genetic diversity in D-loop than in COI sequences. Similar observations have been reported in other fish species [60,61,62,63]. These differences may be attributed to the mutation rate, evolutionary rate and the level of variability of the two mitochondrial regions [56,64,65,66]. The evolution rate of the D-loop control region has been reported to be more than four times faster than other mtDNA genes [60]. This suggests that the D-loop control region can be an efficient marker for population genetics studies and stock management of Oreochromis mossambicus. The COI gene region has been widely used for species identification as a standard DNA barcoding marker [67,68]. To avoid bias (over- or under-) interpretation of the results, the findings of this study were based on the combined mtDNA dataset.
Phylogenetic analysis and pairwise genetic distance:
The BI analysis recovered three highly resolved (Pp = 0.99) clades. Clade I was divided into two poorly resolved subclades comprising populations from NA, Fmo and an unresolved third subclade comprising individuals from all the localities clustered together, indicating common ancestry among populations. Clade II was divided into a subclade (Pp > 0.95) comprising some individuals from NA and the second subclade (Pp > 0.95) comprising sequences from NA and CO reservoirs clustered together. This suggests that the population from Cordier shares some unique genetic materials with the population from Nandoni. Clade III (Pp > 0.95) was unique to some individuals from the UL pond, suggesting that these individuals may have diverged from the original population or originated from a different source. The UL pond is not regulated and the source of the fish in the pond is unknown. These results suggest that some individuals in the populations investigated in the current study may have originated from one locality, which is Nandoni reservoir. This was supported by low levels of sequence divergence within and among populations. Within population values ranged from 0.000 in the MP population to 0.006 in NA and among population values ranged from 0.001 between MP and Fmo to 0.008 between NA and UL and Fmo. Pairwise genetic divergence between and within groups (reservoirs and ponds) was very low, further suggesting genetic relatedness between reservoirs and ponds. These results should be interpreted with caution; the number of localities used in the current study is not a full representation of the species in South Africa, let alone the Limpopo Province. Oreochromis mossambicus is widely distributed in the country from the East Coast Rivers, south-western Cape to rivers and reservoirs inland in the Northern part of the country.
Genetic diversity and population differentiation:
The combined mtDNA sequence analysis revealed high haplotype diversity (Hd) and low nucleotide (π) for the overall population of O. mossambicus and within sample localities except in MP. High haplotype diversity and low nucleotide diversity highlights expansion of a population that might have gone through a reduction as a result of a bottleneck caused by founder effect [69] emanating from a small founder stock. Contrary to other populations, MP had Hd and π values of 0.00, which was supported by the phylogenetic tree, where all the sequences from MP were clustered together and lacked genetic variation among sampled individuals. The lack of genetic variation indicates lack of genetic polymorphism in a population [61]. The low levels of haplotype diversity may be attributed to a bottleneck by founder effect [70], where a population in a locality originated from a limited gene pool. This may have been the case for the MP population; the pond was initially stocked with six Mozambique tilapia for recreational purposes. Currently, the pond is filled with individuals produced from the six broodstock; there was no introduction of new stock to date, which can lead to inbreeding, which will subsequently eliminate variation in a population. The owner does not keep track of the number of generations in the pond. Due of the lack of recombination in the mtDNA, genetic variation within populations is as a result of mutation of the genes. However, the results from this study suggest that the populations are not old enough for the effect of mutation to be evident. The mitochondrial DNA markers are used in population genetics studies due to their faster mutation rates as compared to the nuclear DNA markers. Without this variation, it is difficult for a population to adapt to environmental changes, which therefore makes it more prone to extinction [33]. The NA population exhibited higher levels of genetic diversity compared to the rest of the populations investigated in this study. This may be due to the size of the reservoir and the fact that it comprises wild stocks of O. mossambicus.
Overall, the results of this study revealed a relatively low level of genetic diversity and a lack of population differentiation in Mozambique tilapia population from the sampled localities. Low genetic diversity is influenced by many factors, such as habitat degradation, anthropogenic activity, founder effects, and bottleneck effects. Using microsatellite loci, Mashaphu [31] reported relatively low levels of genetic diversity within several populations and significant population differentiation of Mozambique tilapia in South Africa. The results showed low levels of genetic diversity in the studied populations, potential inbreeding in the farmed populations and low levels of genetic differentiation between the wild and cultured populations. The low levels of genetic diversity observed in the current study are in agreement with the findings by Mashaphu [71], where they reported low genetic diversity in farmed O. mossambicus populations from KwaZulu-Natal and Mpumalanga provinces as compared to their wild counterparts from the same provinces. Similarly, Ukenye and Megbowon [72], based on microsatellites, reported low genetic differentiation between wild (unidentified wild tilapias) and farmed (O. niloticus) cichlids and also observed evidence of inbreeding and reduced genetic diversity indices in farmed populations. Robledo [73], reported high genetic diversity and low inbreeding coefficient across populations of farmed and wild populations of Nile tilapia in Uganda based on genome-wide SNP markers.
The results of this study shows implication for aquaculture and conservation of O. mossambicus in the five localities. The lack of genetic diversity and differentiation within and among the five selected populations may suggest reduced maternal lineage diversity in the cultured populations. This could result from the prolonged use of the same broodstock over multiple generations without introducing new maternal lineages, thereby reducing mitochondrial haplotype variation. However, because mitochondrial DNA is maternally inherited and does not undergo recombination, it is difficult to directly infer inbreeding levels from mitochondrial markers alone. Therefore, the observed patterns should be interpreted cautiously, as they are based solely on combined mitochondrial (COI + D-loop) sequence data. Nuclear markers would provide a more reliable assessment of inbreeding and population structure. The Oreochromis mossambicus farmers in the Limpopo Province do not have genetic characterization or pedigrees of their stocks in farms.
Estimated Tajima’s D and Fu’s values were insignificantly negative and positive, respectively (p > 0.05), for the Fmo population, suggesting that this population is influenced by overdominant selection, which will result in fewer haplotypes [61]. The calculated neutrality tests (Tajima’s D and Fu’s Fs) for the overall sequences of O. mossambicus were both positive and insignificant. A combination of positive Tajima’s D and Fu’s Fs indicates evidence of population contraction following the deficiency of rare genes [61], suggesting that the observed genetic variation is not consistent with the neutral evolution processes [74,75]. Negative and insignificant values indicate deviations from neutral evolutionary processes.
Additional samples and the use of nuclear markers are needed to comprehensively investigate the overall genetic diversity and differentiation of Oreochromis mossambicus populations in Limpopo Province, especially in farmed populations. Stocking density, water quality parameters and husbandry practices are also known to influence genetic variation in farmed populations [76]. Therefore, a combination of the two genome markers will complement each other and shed more light on the conservation status of Oreochromis mossambicus in the province. Inbreeding is common in farmed populations, which can cause a reduction in heterogeneity and genetic diversity. It is therefore important to analyze the level of genetic variation and differentiation in farmed populations in order to create effective management and conservation strategies. However, due to the non-recombinant nature of the maternally inherited mtDNA, the suggested occurrence of inbreeding in the current study needs to be investigated further using the biparentally inherited nuclear markers such as microsatellites. Therefore, the information gathered in the current study should serve as a baseline for more studies on the effect of aquaculture practices on the genetic diversity of O. mossambicus and aid in monitoring against inbreeding, loss of genetic resources and for the implementation of genetic improvement programmes of the species. For better management practices, it is recommended that farmers use a large population size, monitor mating and keep precise records of their stocks. For genetic conservation purposes and improvement of tilapia culture production, there is an urgent need for a countrywide genetic assessment and awareness of the importance of record keeping and regulated breeding in Aquaculture practices.

Funding

This study was supported by the University of Limpopo through the budget provisioned for the Aquaculture Research Unit.

Institutional Review Board Statement

The study was approved by the University of Limpopo’s Animal Research Ethics Committee (AREC), Project number: AREC/27/2023: PG. Approved: 5 April 2023.

Data Availability Statement

The sequences used in this study have been deposited into GenBank (https://www.ncbi.nlm.nih.gov/genbank/about/ Accessed: 27 October 2023) and are available to the public.

Acknowledgments

I would like to sincerely thank the University of Limpopo, Aquaculture Research Unit, for funding the study. To Gavin Geldenhuys for assisting with sample collection and NAG Moyo for proof reading the manuscript.

Conflicts of Interest

The author declares no conflicts of interest.

References

  1. Lever, C. Naturalized Fishes of the World; Academic Press: San Diago, CA, USA, 1996. [Google Scholar]
  2. Canonico, G.C.; Arthington, A.; McCrary, J.K.; Thieme, M.L. The effects of introduced tilapias on native biodiversity. Aquat. Conserv. Mar. Freshw. Ecosyst. 2005, 15, 463–483. [Google Scholar] [CrossRef] [Scilit]
  3. Russell, D.J.; Thuesen, P.A.; Thomson, F.E. A review of the biology, ecology, distribution and control of Mozambique tilapia, Oreochromis mossambicus (Peters 1852) (Pisces: Cichlidae) with particular emphasis on invasive Australian populations. Rev. Fish. Biol. Fish. 2012, 22, 533–554. [Google Scholar] [CrossRef] [Scilit]
  4. Van der Waal, B.C.W.; Bills, R. Oreochromis niloticus (Teleostei: Cichlidae) now in the Limpopo River system. S. Afr. J. Sci. 2000, 96, 47–48. [Google Scholar] [CrossRef] [Scilit]
  5. Hilsdorf, A.W.S.; Hallerman, E. Conservation genetics of tilapias: Seeking to define appropriate units for management. Isr. J. Aquacult. Bamidgeh 2014, 66, 20769. [Google Scholar] [CrossRef] [Scilit]
  6. Bills, R. The IUCN Red List of Threatened Species 2019: Oreochromis mossambicus (Errata Version Published in 2020). Available online: https://www.iucnredlist.org/species/63338/174782954#external-data (accessed on 16 June 2025).
  7. Zengeya, T.A.; Booth, A.J.; Chimimba, C.T. Broad niche overlap between invasive Nile tilapia Oreochromis niloticus and indigenous congenerics in southern Africa: Should we be concerned? Entropy 2015, 17, 4959–4973. [Google Scholar] [CrossRef] [Scilit]
  8. Zengeya, T.A.; Robertson, M.P.; Booth, A.J.; Chimimba, C.T. A qualitative ecological risk assessment of the invasive Nile tilapia, Oreochromis niloticus in a sub-tropical African river system (Limpopo River, South Africa). Aquat. Conserv. Mar. Freshw. Ecosyst. 2013, 23, 51–64. [Google Scholar]
  9. D’Amato, M.E.; Esterhuyse, M.M.; Van Der Waal, B.C.; Brink, D.; Volckaert, F.A. Hybridization and phylogeography of the Mozambique tilapia Oreochromis mossambicus in southern Africa evidenced by mitochondrial and microsatellite DNA genotyping. Conserv. Genet. 2007, 8, 475–488. [Google Scholar]
  10. Deines, A.M.; Bbole, I.; Katongo, C.; Feder, J.L.; Lodge, D.M. Hybridisation between native Oreochromis species and introduced Nile tilapia O. niloticus in the Kafue River, Zambia. Afr. J. Aquat. Sci. 2014, 39, 23–34. [Google Scholar] [CrossRef] [Scilit]
  11. Geraerts, M.; Vangestel, C.; Artois, T.; Fernandes, J.M.D.O.; Jorissen, M.W.; Chocha Manda, A.; Mizani, C.D.; Smeets, K.; Snoeks, J.; Sonet, G.; et al. Population genomics of introduced Nile tilapia Oreochromis niloticus (Linnaeus, 1758) in the Democratic Republic of the Congo: Repeated introductions since colonial times with multiple sources. Mol. Ecol. 2022, 31, 3304–3322. [Google Scholar] [CrossRef] [Scilit] [PubMed]
  12. Kamal, A.H.M.M.; Mair, G.C. Salinity tolerance in superior genotypes of tilapia, Oreochromis niloticus, Oreochromis mossambicus and their hybrids. Aquaculture 2005, 247, 189–201. [Google Scholar] [CrossRef] [Scilit]
  13. Firmat, C.; Alibert, P.; Losseau, M.; Baroiller, J.F.; Schliewen, U.K. Successive invasion-mediated interspecific hybridizations and population structure in the endangered cichlid Oreochromis mossambicus. PLoS ONE 2013, 8, e63880, Erratum in PLoS ONE 2013, 8. https://doi.org/10.1371/annotation/6a9a9d59-8c24-4c3b-b125-2efba2db4d45. [Google Scholar] [CrossRef] [Scilit] [PubMed]
  14. Wasonga, A.G.; Daniel, W.A.; Brian, O. Interspecific hybridization of tilapiines in Lake Victoria, Kenya. J. Fish. Livest. Prod. 2017, 5, 235. [Google Scholar]
  15. Mojekwu, T.O.; Cunningham, M.J.; Bills, R.I.; Pretorius, P.C.; Hoareau, T.B. Utility of DNA barcoding in native Oreochromis species. J. Fish Biol. 2021, 98, 498–506. [Google Scholar] [PubMed]
  16. Moyo, N.A.; Rapatsa, M.M. A review of the factors affecting tilapia aquaculture production in Southern Africa. Aquaculture 2012, 535, 736386. [Google Scholar]
  17. Brummett, R.E.; Angoni, D.E.; Pouomogne, V. On-farm and on-station comparison of wild and domesticated Cameroonian populations of Oreochromis niloticus. Aquaculture 2004, 242, 157–164. [Google Scholar] [CrossRef] [Scilit]
  18. Mwanja, W.W.; Nyandat, B. Challenges and issues facing small-scale aquaculture producers: Perspectives from Eastern Africa. In Enhancing the Contribution of Small-Scale Aquaculture to Food Security, Poverty Alleviation and Socio-Economic Development; FAO: Rome, Italy, 2013. [Google Scholar]
  19. Echessa, J.B. Fish Seed Production for National Development in Kenya: Current Status, Challenges, Quality Control and Innovative Strategies for Commercialization. In Aquaculture Industry-Recent Advances and Applications; IntechOpen: London, UK, 2024. [Google Scholar]
  20. Mofokeng, M.B. The Appropriateness and Sufficiency of Public Support to Small-Scale Aquaculture Producers in Gauteng Province, South Africa. Master’s Thesis, University of Pretoria, Pretoria, South Africa, 2024. Available online: https://repository.up.ac.za/server/api/core/bitstreams/8bc6a5cf-6973-44fc-8489-3de62e2d6a72/content (accessed on 2 February 2026).
  21. Hasimuna, O.J.; Mphande, J.; Maulu, S.; Chibesa, M.; Siankwilimba, E.; Mumbula, I.; Bwalya, H.; Mbewe, J.; Lundu, B.; Nawanzi, K.; et al. The status, challenges, and potential opportunities of fish seed production in Zambia. Aquac. Int. 2025, 33, 399. [Google Scholar] [CrossRef] [Scilit]
  22. Brummett, R.E.; Ponzoni, R.W. Concepts, alternatives, and environmental considerations in the development and use of improved strains of tilapia in African aquaculture. Rev. Fish. Sci. 2009, 17, 70–77. [Google Scholar] [CrossRef] [Scilit]
  23. Akinoshun, K.M. Quantifying the Effect of Inbreeding on the Growth and Yield of Mozambique Tilapia (Oreochromis mossambicus) Over Three Generations of Repeated Full-Sib Mating. Doctoral Dissertation, Stellenbosch University, Matieland, South Africa, 2015. Available online: https://scholar.sun.ac.za/items/a6b791f2-e141-4fed-b685-d0ed9230e201 (accessed on 5 March 2026).
  24. Hillen, J.E.J.; Coscia, I.; Vandeputte, M.; Herten, K.; Hellemans, B.; Maroso, F.; Vergnet, A.; Allal, F.; Maes, G.; Volckaert, F. Estimates of genetic variability and inbreeding in experimentally selected populations of European sea bass. Aquaculture 2017, 479, 742–749. [Google Scholar] [CrossRef] [Scilit]
  25. El-Sayed, A.F.M.; Fitzsimmons, K. From Africa to the world—The journey of Nile tilapia. Rev. Aquac. 2023, 15, 6–21. [Google Scholar] [CrossRef] [Scilit]
  26. Van der Bank, F.H.; Deacon, A.R. Increased backcrossing has reduced the usefulness of morphological and allozyme data for identifying Oreochromis niloticus, O. mossambicus (Teleostei: Cichlidae) and their hybrids in the Pafuri reach of the Luvuvhu River in the Kruger National Park, South Africa. Afr. J. Aquat. Sci. 2007, 32, 193–196. [Google Scholar] [CrossRef] [Scilit]
  27. Bradbeer, S.J.; Harrington, J.; Watson, H.; Warraich, A.; Shechonge, A.; Smith, A.; Tamatamah, R.; Ngatunga, B.P.; Turner, G.F.; Genner, M.J. Limited hybridization between introduced and Critically Endangered indigenous tilapia fishes in northern Tanzania. Hydrobiologia 2019, 832, 257–268. [Google Scholar] [PubMed]
  28. Mojekwu, T.O.; Hoareau, T. Mozambique Tilapia Oreochromis mossambicus (Peters 1852) and the threat from Oreochromis niloticus (Linnaeus 1758) in South Africa: A review. Agric. Food Nat. Resour. J. 2024, 3, 88–100. [Google Scholar]
  29. Muneer, P.A. Application of microsatellite markers in conservation genetics and fisheries management: Recent advances in population structure analysis and conservation strategies. Genet. Res. Int. 2014, 1, 691759. [Google Scholar] [CrossRef] [Scilit]
  30. Guo, L.; Zhang, N.; Yang, J.W.; Guo, H.Y.; Zhu, K.C.; Liu, B.S.; Liu, T.T.; Zhang, D.C. Comprehensive assessment of the genetic diversity and population structure of cultured populations of golden pompano, Trachinotus ovatus (Linnaeus, 1758), by microsatellites. Aquac. Int. 2018, 26, 1445–1457. [Google Scholar] [CrossRef] [Scilit]
  31. Mashaphu, M.F.; Downs, C.T.; Burnett, M.; O’Brien, G.; Willows-Munro, S. Genetic diversity and population dynamics of wild Mozambique tilapia (Oreochromis mossambicus) in South Africa. Glob. Ecol. Conserv. 2024, 54, e03043. [Google Scholar] [CrossRef] [Scilit]
  32. Avise, J.C.; Arnold, J.; Ball, R.M.; Bermingham, E.; Lamb, T.; Neigel, J.E.; Reeb, C.A.; Saunders, N.C. Intraspecific phylogeography: The mitochondrial DNA bridge between population genetics and systematics. Annu. Rev. Ecol. Syst. 1987, 18, 489–522. [Google Scholar] [CrossRef] [Scilit]
  33. Fortuna, M.A.; Albaladejo, R.G.; Fernández, L.; Aparicio, A.; Bascompte, J. Networks of spatial genetic variation across species. Proc. Natl. Acad. Sci. USA 2009, 106, 19044–19049. [Google Scholar] [CrossRef] [Scilit] [PubMed]
  34. Yang, L.; Lu, M.; Ye, X.; Zhu, H.; Gao, F.; Mo, Y.; Huang, Z. Complete Mitochondrial Genome DNA of the Nile Tilapia Oreochromis niloticus and Phylogenetic Analysis, Pearl River Fisheries Research Institute, Chinese Academy of Fishery Sciences, Guangzhou, China. 2009; unpublished sequences.
  35. Chen, W.; Li, C.; Yang, J.; Zhu, S.; Li, J.; Li, Y.; Li, X. Temporal species-level composition of larvae resources in the lower Pearl River drainage and implications for species’ reproductive cycles. Gene 2021, 776, 145351. [Google Scholar] [CrossRef] [Scilit] [PubMed]
  36. Li, P.; Liu, C.W.; Liu, L.; Tan, W. Oreochomis niloticus Isolate NL-2 D-loop, Complete Sequences, Fisheries College, Guangdong Ocean University, Zhanjiang, China. 2009; directly submitted to GenBank.
  37. He, A.; Luo, Y.; Yang, H.; Liu, L.; Li, S.; Wang, C. Complete mitochondrial DNA sequences of the Nile tilapia (Oreochromis niloticus) and Blue tilapia (Oreochromis aureus): Genome characterization and phylogeny applications. Mol. Biol. Rep. 2011, 38, 2015–2021. [Google Scholar] [PubMed]
  38. Vences, M.; Stutzer, D.; Rasoamampionona, R.N.; Ziegler, T. Towards a preliminary DNA barcode library for Madagascar's threatened ichthyofauna. PLoS ONE 2022, 17, e0271400. [Google Scholar] [CrossRef] [Scilit] [PubMed]
  39. Zou, Z.; Yang, H.; Wu, C. Oreochromis aureus Clone D4-5 D-loop, Partial Sequence, Freshwater Fisheries Research Center, Chinese Academy of Fishery Sciences, Guangzhou, China. 2010; directly submitted to GenBank.
  40. Santibanez, D.; Cruz, P. Oreochromis aureus Isolate MexicanBCSLP_LPU7 D-loop, Partial Sequence, Aquaculture Genetics Laboratory, Centro de Investigaciones Biologicas del Noroeste, La Paz, Baja California Sur, Mexico. 2019; directly submitted to GenBank.
  41. Ward, R.D.; Zemlak, T.S.; Innes, B.H.; Last, P.R.; Hebert, P.D. DNA barcoding Australia’s fish species. Phil. Trans. R. Soc. B 2005, 360, 1847–1857. [Google Scholar] [CrossRef] [Scilit] [PubMed]
  42. Wu, L.; Yang, J. Identifications of captive and wild tilapia species existing in Hawaii by mitochondrial DNA control region sequence. PLoS ONE 2012, 7, e51731. [Google Scholar] [CrossRef] [Scilit] [PubMed]
  43. Smith, M. BioEdit: Biological Sequence Alignment Editor for Windows 95/98/NT/2000/XP; Ibis Therapeutics: Carlsbad, CA, USA, 2005; Volume 7, pp. 9–12. [Google Scholar]
  44. Gouy, M.; Guindon, S.; Gascuel, O. SeaView version 4: A multiplatform graphical user interface for sequence alignment and phylogenetic tree building. Mol. Biol. Evol. 2010, 27, 221–224. [Google Scholar] [PubMed]
  45. Wong, T.K.; Ly-Trong, N.; Ren, H.; Demotte, P.; Baños, H.; Roger, A.J.; Susko, E.; Bielow, C.; De Maio, N.; Goldman, N.; et al. IQ-TREE 3: Phylogenomic inference software using complex evolutionary models. Mol. Biol. Evol. 2026, 43, msag117. [Google Scholar] [CrossRef] [Scilit] [PubMed]
  46. Chernomor, O.; Von Haeseler, A.; Minh, B.Q. Terrace aware data structure for phylogenomic inference from supermatrices. Syst. Biol. 2016, 65, 997–1008. [Google Scholar] [CrossRef] [Scilit] [PubMed]
  47. Ronquist, F.; Teslenko, M.; Van Der Mark, P.; Ayres, D.L.; Darling, A.; Höhna, S.; Larget, B.; Liu, L.; Suchard, M.A.; Huelsenbeck, J.P. MrBayes 3.2: Efficient Bayesian phylogenetic inference and model choice across a large model space. Syst. Biol. 2012, 61, 539–542. [Google Scholar] [CrossRef] [Scilit] [PubMed]
  48. Rambaut, A. FigTree v1.4.3, A Graphical Viewer of Phylogenetic Trees and a Program for Producing Publication-Ready Figures. 2016. Available online: http://tree.bio.ed.ac.uk/software/figtree/ (accessed on 15 November 2025).
  49. Tamura, K.; Stecher, G.; Kumar, S. MEGA11: Molecular evolutionary genetics analysis version 11. Mol. Biol. Evol. 2021, 38, 3022–3027. [Google Scholar] [CrossRef] [Scilit] [PubMed]
  50. Rozas, J.; Ferrer-Mata, A.; Sánchez-DelBarrio, J.C.; Guirao-Rico, S.; Librado, P.; Ramos-Onsins, S.E.; Sánchez-Gracia, A. DnaSP 6: DNA sequence polymorphism analysis of large data sets. Mol. Biol. Evol. 2017, 34, 3299–3302. [Google Scholar] [CrossRef] [Scilit] [PubMed]
  51. Clement, M.; Snell, Q.; Walker, P.; Posada, D.; Crandall, K. TCS: Estimating gene genealogies. Parallel Distrib. Process. Symp. Int. Proc. 2002, 2, 184. [Google Scholar]
  52. Leigh, J.W.; Bryant, D.; Nakagawa, S. POPART: Full-feature software for haplotype network construction. Methods Ecol. Evol. 2015, 6, 1110–1116. [Google Scholar] [CrossRef] [Scilit]
  53. Excoffier, L.; Lischer, H. An Integrated Software Package for Population Genetics Data Analysis; Arlequin: Paris, France, 2011. [Google Scholar]
  54. Tajima, F. Statistical method for testing the neutral mutation hypothesis by DNA polymorphism. Genetics 1989, 123, 585–595. [Google Scholar] [CrossRef] [Scilit] [PubMed]
  55. Fu, Y.X. Statistical tests of neutrality of mutations against population growth, hitchhiking and background selection. Genetics 1997, 147, 915–925. [Google Scholar] [CrossRef] [Scilit] [PubMed]
  56. Phukuntsi, M.A.; Du Plessis, M.; Dalton, D.L.; Jansen, R.; Cuozzo, F.P.; Sauther, M.L.; Kotze, A. Population genetic structure of the thick-tailed bushbaby (Otolemur crassicaudatus) from the Soutpansberg Mountain range, northern South Africa, based on four mitochondrial DNA regions. Mitochondrial DNA Part A 2020, 31, 1–10. [Google Scholar]
  57. Guo, S.S.; Zhang, G.R.; Guo, X.Z.; Wei, K.J.; Yang, R.B.; Wei, Q.W. Genetic diversity and population structure of Schizopygopsis younghusbandi Regan in the Yarlung Tsangpo River inferred from mitochondrial DNA sequence analysis. Biochem. Syst. Ecol. 2014, 57, 141–151. [Google Scholar] [CrossRef] [Scilit]
  58. Zhang, G.; Chen, C.; Lu, W.; Li, J.; Fang, T.; Yang, K.; Zhao, X.; Gao, N.; Liang, Y. Genetic diversity and phylogeography of Taenioides cirratus in five geographical populations based on mitochondrial COI and Cytb gene sequences. J. Appl. Ichthyol. 2023, 2023, 4459823. [Google Scholar] [CrossRef] [Scilit]
  59. Bernatchez, L. On the maintenance of genetic variation and adaptation to environmental change: Considerations from population genomics in fishes. J. Fish Biol. 2016, 89, 2519–2556. [Google Scholar] [CrossRef] [Scilit] [PubMed]
  60. Xu, H.; Zhang, Y.; Xu, D.; Lou, B.; Guo, Y.; Sun, X.; Guo, B. Genetic population structure of miiuy croaker (Miichthys miiuy) in the Yellow and East China Seas base on mitochondrial COI sequences. Biochem. Syst. Ecol. 2014, 54, 240–246. [Google Scholar] [CrossRef] [Scilit]
  61. Fatsi, P.S.K.; Hashem, S.; Kodama, A.; Appiah, E.K.; Saito, H.; Kawai, K. Population genetics and taxonomic signatures of wild Tilapia in Japan based on mitochondrial DNA control region analysis. Hydrobiologia 2020, 847, 1491–1504. [Google Scholar] [CrossRef] [Scilit]
  62. Zhao, F.; Liu, Y.; Wang, Z.; Lu, J.; Cao, L.; Zeng, C. Genetic diversity and connectivity of Ocypode ceratophthalmus in the east and South China Seas and its implications for conservation. Biology 2023, 12, 437. [Google Scholar] [CrossRef] [Scilit] [PubMed]
  63. Yan, T.; Wang, X.; Li, S.; He, Z.; Luo, J.; Zhang, Q.; Yang, D.; He, Z. Genetic analysis of wild Ancherythroculter nigrocauda in tributaries and the main stream of the upper Yangtze River basin of China. Mitochondrial DNA Part A 2020, 31, 17–24. [Google Scholar]
  64. Gallagher, J.; Finarelli, J.A.; Jonasson, J.P.; Carlsson, J. Mitochondrial D-loop DNA analyses of Norway lobster (Nephrops norvegicus) reveals genetic isolation between Atlantic and East Mediterranean populations. J. Mar. Biol. Assoc. UK 2019, 99, 933–940. [Google Scholar]
  65. Fang, D.A.; Luo, H.; He, M.; Mao, C.; Kuang, Z.; Qi, H.; Xu, D.; Tan, L.; Li, Y. Genetic diversity and population differentiation of naked carp (Gymnocypris przewalskii) Revealed by cytochrome oxidase subunit I and d-loop. Front. Ecol. Evol. 2022, 10, 827654. [Google Scholar] [CrossRef] [Scilit]
  66. Hebert, P.D.; Ratnasingham, S.; De Waard, J.R. Barcoding animal life: Cytochrome c oxidase subunit 1 divergences among closely related species. Proc. R. Soc. Lond. Ser. B Biol. Sci. 2003, 270, S96–S99. [Google Scholar] [CrossRef] [Scilit]
  67. Mir, R.A.; Bhat, K.A.; Rashid, G.; Ebinezer, L.B.; Masi, A.; Rakwal, R.; Shah, A.A.; Zargar, S.M. DNA barcoding: A way forward to obtain deep insights about the realistic diversity of living organisms. Nucleus 2021, 64, 157–165. [Google Scholar]
  68. Department of Water Affairs and Forestry (DWAF). Nandoni Dam Zoning Plan. In Report for DWAF by Van Riet and Louw Landscape Architects; Department of Water Affairs and Forestry (DWAF): Pretoria, South Africa, 2001. [Google Scholar]
  69. Machado, L.F.; de Souza Damasceno, J.; Bertoncini, A.A.; Tosta, V.C.; Farro, A.P.C.; Hostim-Silva, M.; Oliveira, C. Population genetic structure and demographic history of the spadefish, Chaetodipterus faber (Ephippidae) from Southwestern Atlantic. J. Exp. Mar. Biol. Ecol. 2017, 487, 45–52. [Google Scholar] [CrossRef] [Scilit]
  70. Del Pazo, F.; Sánchez, S.; Posner, V.; Sciara, A.A.; Arranz, S.E.; Villanova, G.V. Genetic diversity and structure of the commercially important native fish pacu (Piaractus mesopotamicus) from cultured and wild fish populations: Relevance for broodstock management. Aquac. Int. 2021, 29, 289–305. [Google Scholar] [CrossRef] [Scilit]
  71. Mashaphu, M.F.; O’Brien, G.C.; Willows-Munro, S. Genetic assessment of farmed Oreochromis mossambicus populations in South Africa. PeerJ 2025, 13, e18877. [Google Scholar] [CrossRef] [Scilit] [PubMed]
  72. Ukenye, E.A.; Megbowon, I. Comparison of genetic diversity of farmed Oreochromis niloticus and wild unidentified tilapia (Wesafu) using microsatellite markers. Biodiversitas J. Biol. Divers. 2023, 24. [Google Scholar] [CrossRef] [Scilit]
  73. Robledo, D.; Ogwang, J.; Byakora, E.; Nascimento-Schulze, J.C.; Benda, K.K.; Fraslin, C.; Salisbury, S.; Solimo, M.; Mayega, J.F.; Peter, B.; et al. Genetic diversity and population structure of farmed and wild Nile tilapia (Oreochromis niloticus) in Uganda: The potential for aquaculture selection and breeding programs. Genomics 2024, 116, 110781. [Google Scholar] [CrossRef] [Scilit] [PubMed]
  74. Ming, L.; Siren, D.; Yi, L.; Hai, L.; He, J.; Ji, R. Mitochondrial DNA variation and phylogeography of Old World camels. Anim. Biosci. 2021, 34, 525–532. [Google Scholar] [CrossRef] [Scilit] [PubMed]
  75. Joshi, J.; Salar, R.K.; Banerjee, P.; Tantia, M.S.; Vijh, R.K. Genetic variation and phylogenetic relationships of Indian buffaloes of Uttar Pradesh. Asian-Australas. J. Anim. Sci. 2013, 26, 1229. [Google Scholar] [CrossRef] [Scilit] [PubMed]
  76. Danish, M.; Badoni, P.; Rinya, K.; Maity, S.; Chowdhury, A.; Khanra, T.S. Evaluation of genetic pollution and genetic diversity in natural fisheries and aquaculture through molecular tools. J. Entomol. Zool. Stud. 2021, 9, 2204–2211. [Google Scholar]
Figure 1. A map showing localities where samples used in the current study were collected. The small circles represent GPS coordinates of each locality, the colours correspond with the colours allocated for each locality on the haplotype network.
Diversity 18 00491 g001
Figure 2. Phylogenetic tree showing the inferred evolutionary relationships among the five populations of Orecrhomis mossambicus populations investigated in the current study based on the combined (COI and D-loop) sequences. Nodes with posterior probability (Pp) values ≥ 0.95.
Diversity 18 00491 g002
Figure 3. A median-joining network of Oreochromis mossambicus haplotypes retrieved from the five populations investigated in the current study. The size of the circle indicates the relative frequency of the haplotype, and the colours represent the corresponding.
Diversity 18 00491 g003
Figure 4. The haplotype phylogenetic topology constructed using the haplotype sequences retrieved from the combined mtDNA dataset with outgroups. Haplotypes H10–H13 are outgroups used to root the tree. Nodes with posterior probability (Pp) values ≥ 0.95 were considered statistically significant and well resolved, while those with posterior probability (Pp) values ≤ 0.95 were considered poorly resolved.
Diversity 18 00491 g004
Table 1. List of the localities, abbreviation of populations, number of successfully amplified sequences in each population (NS) and GenBank Accession numbers for each locus (COI and D-loop). The sequences from this study were deposited in GenBank (https://www.ncbi.nlm.nih.gov/genbank/about/ Accessed: 27 October 2023). Ten samples were collected from Fmo, only five were successfully amplified.
LocationNSAccession NumberReferences
COID-Loop
University of Limpopo PondUL16PP264627-PP264644 PP764675- PP764690Current Study
Mall of the North PondMP13PP264645-PP264661 PP764691- PP764703 Current Study
Cordier reservoirCO13PP264662-PP264674PP764704- PP764716Current Study
Nandoni reservoirNA13PP342542-PP342550,
PP145894-PP145897
PP350705- PP350724 Current Study
Polokwane FarmFmo5PP486281-PP486285PP764717- PP764721Current Study
Oreochromis niloticusGenBank2NC013663 [34]
MT805385[35]
FJ664206[36]
FJ664215
Oreochromis aureusGenBank2NC013750 [37]
ON604291[38]
GU980720[39]
MN384753[40]
Table 2. Pairwise genetic divergence among populations (below diagonal) and within populations (highlighted in grey) estimated using the combined mtDNA (COI + D-Loop) sequences of Oreochromis mossambicus from five localities in Limpopo Province, South Africa.
PopulationsULMPCOFmoNA
UL0.00
MP0.000.00
CO0.010.010.01
Fmo0.000.000.010.00
NA0.010.010.010.010.01
Table 3. Genetic diversity indices values estimated for Oreochromis mossambicus populations based on the combined mtDNA (Cytochrome c oxidase I and D-loop loci) including, the Number of sequences (N), segregating sites (S), number of haplotypes (h), haplotype diversity (Hd), and nucleotide diversity (π). And the Neutrality analysis (Tajima’s D and Fu’s Fs tests). * p < 0.05, (significant levels). NS = not significant (p > 0·05); NA = not applicable.
LocationGenetic DiversityNeutrality Test
NShHdπTajima’s DFu’s Fs
Combined populations601990.680.010.55 NS2.94
UL16920.400.001.20 NS7.66 *
MP13010.000.00NA0.00 NS
CO13920.510.012.32 *8.27 *
NA131460.8330.011.04 NS1.63 NS
Fmo5230.700.000.24 NS−0.45 NS
Table 4. Analysis of molecular variance (AMOVA) estimated in Arlequin programme for Oreochromis mossambicus populations. The groups are reservoirs versus ponds. df: degree of freedom; ** statistically significant.
Source of VariancedfSum of SquaresVariance ComponentPercentage of Variation (%)Significancep Values
Among groups1398.0812.35443.53Fct = 0.43 **p < 0.001
Among populations within groups393.881.4895.25Fsc = 0.09p > 0.05
Among populations55799.4314.53551.22Fst = 0.48 **p < 0.001
Total591291.428.379100
Disclaimer/Publisher’s Note: The statements, opinions and data contained in all publications are solely those of the individual author(s) and contributor(s) and not of MDPI and/or the editor(s). MDPI and/or the editor(s) disclaim responsibility for any injury to people or property resulting from any ideas, methods, instructions or products referred to in the content.