Article

Understanding the Genetic Diversity and Differentiation of Cycas Species in the Guangxi Region: Implications for Conservation and Management


1
Guangxi Key Laboratory of Plant Functional Substances and Resources Sustainable Utilization, Guangxi Institute of Botany, Guilin 541006, China
2
South China Botanical Garden, Chinese Academy of Sciences, Guangzhou 510650, China
3
Guangxi Yachang Orchid National Nature Reserve Management Center, Baise 533200, China
*
Authors to whom correspondence should be addressed.
These authors have contributed equally to this work.
Diversity 2026, 18(6), 340; https://doi.org/10.3390/d18060340
Submission received: 17 May 2026 / Revised: 2 June 2026 / Accepted: 3 June 2026 / Published: 4 June 2026
(This article belongs to the Section Plant Diversity)

Abstract

Cycas is one of the most ancient extant seed plant lineages on Earth, with a fossil record and evolutionary history dating back to the Carboniferous period. In this study, six screened SSR primer pairs were used to analyze the genetic diversity and population structure of 640 samples from 41 populations representing eight Cycas species collected from Guangxi, with the aim of providing a theoretical basis for the conservation of wild cycad resources in this region. The results showed that the average number of alleles (Na) across the eight species ranged from 1.945 to 3.643, the average effective number of alleles (Ne) ranged from 1.548 to 2.245, Shannon’s information index (I) ranged from 0.446 to 0.824, observed heterozygosity (Ho) ranged from 0.222 to 0.453, and expected heterozygosity (He) ranged from 0.293 to 0.443, indicating a moderate overall level of genetic diversity. Among the species, C. sexseminifera exhibited the highest genetic diversity (I = 0.824, He = 0.443), whereas C. guizhouensis showed the lowest (I = 0.446, He = 0.293). In addition, the interspecific genetic differentiation coefficient (Fst) ranged from 0.047 to 0.354, and gene flow (Nm) ranged from 0.456 to 5.094. Except for C. guizhouensis, relatively high levels of gene flow were detected among species. Principal Coordinates Analysis (PCoA) revealed that the 640 samples could be divided into three genetic clusters, which were not strictly consistent with species boundaries. AMOVA further indicated that 78% of the total genetic variation was distributed within populations, including 60% within individuals and 18% among individuals within populations. These findings provide important insights into the genetic diversity and differentiation patterns of Cycas species distributed in Guangxi and offer a theoretical foundation for their introduction, ex situ conservation, and scientific management of genetic resources.

1. Introduction

Cycas L. is among the most ancient relict seed plant lineages on Earth, with a fossil record and evolutionary history dating back to the Carboniferous period [1,2]. At present, more than 360 cycad species are recognized worldwide, belonging to 2 families and 10 genera [3]. Among them, the family Cycadaceae Pers. comprises a single genus, Cycas, which includes approximately 120 species characterized by a discontinuous distribution across tropical and subtropical regions of Asia, Africa, Oceania, and the Americas [4]. China is one of the countries with the richest Cycas resources, with about 22 species, accounting for nearly 20% of the global total, mostly concentrated in the southwest and along the southeastern coast. As one of the most primitive extant seed plant groups, Cycas species hold great scientific, ornamental, and medicinal value [5,6]. However, increasing anthropogenic pressures, including habitat destruction, overexploitation, and illegal trade, have led to rapid declines in wild populations. These threats are further exacerbated by biological characteristics such as small population sizes and limited natural regeneration capacity, placing many Cycas species at high risk of extinction [7,8]. Consequently, all known Cycas species have been listed as conservation priorities on the IUCN Red List and included in the appendices of the Convention on International Trade in Endangered Species of Wild Fauna and Flora. In China, Cycas species have also been designated as nationally protected wild plants since 1999 [9,10].
Accumulating evidence suggests that southwestern China represents an important center for the divergence and diversification of extant Cycas species, characterized by both high species richness and a large proportion of endemic taxa [8]. Guangxi Zhuang Autonomous Region, located at the junction of southwestern and southern China, is characterized by its world-renowned karst landscapes and rich plant resources. To date, numerous taxonomically doubtful species remain within the genus Cycas. In the limestone regions of Guangxi, 24 species of Cycas have been recorded, of which as many as 14 species were described solely from Baise City. The taxonomy of the genus in this region remains confused, and several problematic taxonomic units urgently require further study and conservation [11]. During field surveys of plant resources in Guangxi, our research team identified eight confirmed Cycas species, accounting for approximately 36% of all Cycas species in China [12]. Among them, Cycas debaoensis Y. C. Zhong & C. J. Chen and Cycas bifida (Dyer) K. D. Hill are distributed in both limestone and hilly areas; Cycas sexseminifera F. N. Wei and Cycas ferruginea F. N. Wei mainly occur in limestone regions; Cycas segmentifida D. Yue Wang & C. Y. Deng, Cycas guizhouensis K. M. Lan & R. F. Zou, and Cycas balansae Warb. are distributed in shrub communities of river valleys and under seasonal rainforests; while wild individuals of Cycas dolichophylla K. D. Hill are extremely rare, with scattered distributions, mostly growing under montane rainforests and seasonal rainforests in limestone mountains [13].
Genetic diversity reflects the evolutionary potential of species to respond to environmental change and is a critical factor for the long-term persistence of endangered plants [14]. Studying the genetic diversity of endangered plants helps to understand intraspecific genetic variation, reveal their evolutionary mechanisms and causes of endangerment, and provide a theoretical basis for germplasm conservation, elite line selection, and the formulation of conservation strategies. Simple Sequence Repeat (SSR) markers possess multiple advantages, including multiallelism, codominance, high stability and reproducibility, low cost, and widespread occurrence in prokaryotic and eukaryotic genomes, making them an important tool for studying plant genetic diversity. They have been widely applied in crop genetic diversity analysis, marker-assisted breeding, germplasm identification, and genetic diversity assessment [15,16,17]. At present, SSR molecular marker technology has been successfully applied to construct plant DNA fingerprints and study genetic diversity in C. taiwaniana [18], C. balansae [19], C. szechuanensis [20], and other Cycas species. Feng et al. [21,22,23] used SSR markers to investigate the genetic diversity of 14 populations of C. segmentifida in Guangxi and Guizhou, 11 populations of C. guizhouensis in Guizhou, and 5 populations of C. dolichophylla in Guangxi and Yunnan. The average Shannon index (I) and expected heterozygosity (He) were 0.874 and 0.436 for C. segmentifida, 0.855 and 0.419 for C. guizhouensis, and 1.213 and 0.543 for C. dolichophylla, respectively. Zheng et al. [24] analyzed 13 natural populations of C. dolichophylla from Vietnam and Yunnan, China, and obtained a mean Shannon diversity index (I) of 0.949 together with an expected heterozygosity (He) of 0.466. The reported values demonstrate that levels of genetic diversity differ among Cycas species and across populations while overall remaining within a moderate range. This suggests that despite long-term environmental pressures and human disturbances, Cycas species retain a certain degree of genetic variation, although some species or populations have already exhibited declining trends in genetic diversity. The conservation of endangered plants is a long-term and continuous process. Existing evidence indicates that with the ongoing expansion of human activities and persistent changes in natural environments, their genetic diversity is gradually declining [25,26]. The loss of genetic diversity not only weakens species’ adaptive capacity to environmental changes but may also increase their risk of endangerment.
Although considerable research has been conducted on plants of the genus Cycas, the genetic diversity of some species has not yet been systematically evaluated. This knowledge gap limits a comprehensive understanding of the overall genetic structure of the genus and, to some extent, compromises the scientific basis and effectiveness of conservation strategies for endangered species, posing substantial challenges for the conservation of Cycas plants. Systematic assessment of genetic diversity in Cycas is of fundamental and irreplaceable importance, as it enables evaluation of adaptive potential and evolutionary capacity, supports the prioritization of conservation efforts, and facilitates the optimization of ex situ conservation and germplasm preservation strategies. Therefore, this study employed simple sequence repeat (SSR) molecular markers, which are widely used in plant genetic analysis, to systematically investigate different Cycas species and their populations in Guangxi. The objectives were to comprehensively assess the genetic diversity and genetic differentiation of eight Cycas species in Guangxi, provide a theoretical basis for identifying priority conservation populations and formulating scientifically sound conservation strategies, and offer scientific guidance for the conservation and sustainable utilization of Cycas resources in Guangxi and the karst biodiversity hotspot regions of southwestern China.

2. Materials and Methods

2.1. Plant Material and Sampling Strategy

During field investigations, species of Cycas were primarily identified based on morphological characteristics, including the morphology of male and female cones, the structure of sporophylls or seed scales, the color and texture of the seed testa, the form of pinnate leaves, and trunk base features, in order to minimize misidentification [23]. Meanwhile, all collected specimens were subjected to rigorous taxonomic identification. This process involved consulting authoritative literature, referencing the Flora of China and related monographs, and final verification by the renowned cycad expert Fa-Nan Wei.
This study was conducted under permits obtained from forestry authorities and relevant nature reserve management agencies. Field sampling was carried out across Guangxi. Based on the natural distribution patterns of the species, spatially isolated yet continuously distributed groups of individuals were defined as populations. In total, all eight extant Cycas species in Guangxi were surveyed, encompassing 41 populations and 640 individuals. Among them, the six populations CB-KPY, CHY-ZWS, DB-ZWS, SS-ZWS, KY-ZWS, and XM-ZWS were ex situ-conserved populations.
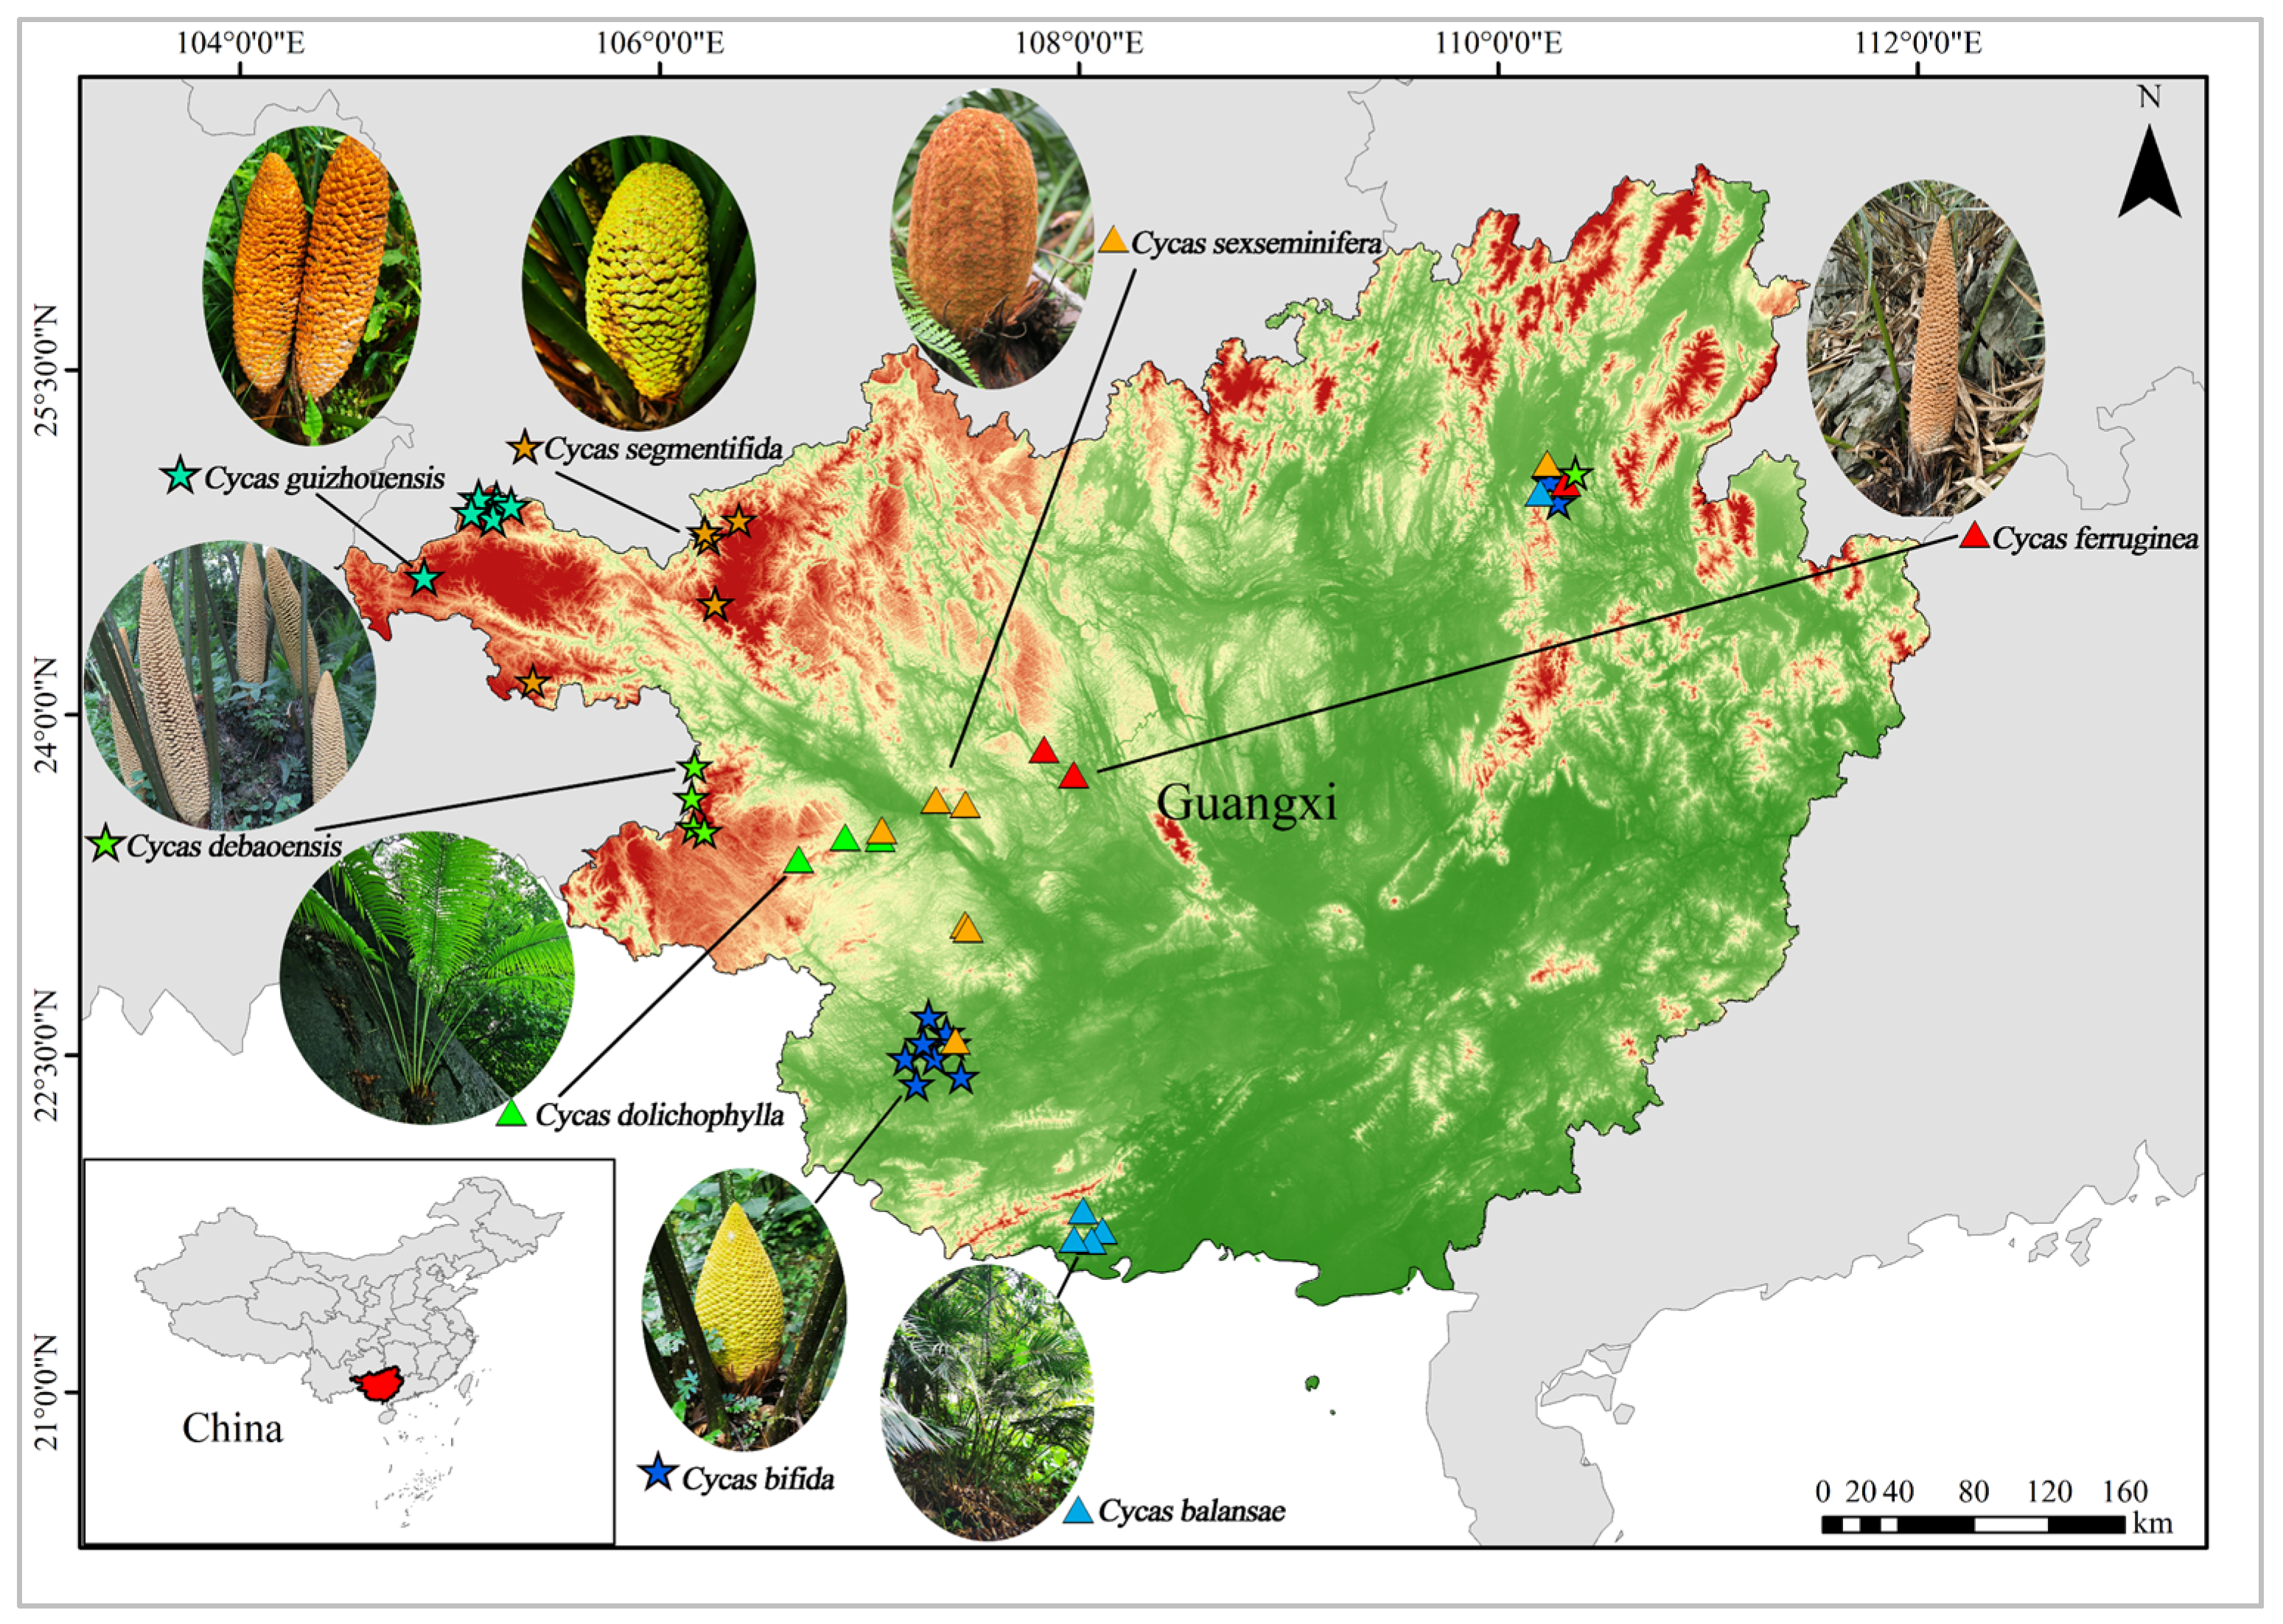
Within each population, a combination of random sampling and spatial dispersion was employed, with 3–30 individuals sampled per population. To avoid collecting closely related individuals, a minimum distance of 30 m was maintained between sampled individuals. Only healthy, mature individuals without obvious signs of pests or diseases were selected. During sampling, geographic coordinates, elevation, and population codes were recorded for each sampling site (Figure 1 and Table S1). Approximately 100 g of fresh, healthy leaf tissue was collected from each individual, immediately placed into sealed molecular sampling bags, and rapidly desiccated in the field using sufficient silica gel. Upon return to the laboratory, samples were freeze-dried and stored at −20 °C for subsequent DNA extraction and molecular analyses.

2.2. DNA Extraction, SSR Primer Screening, and Genotyping

Genomic DNA was extracted from leaf samples using a magnetic bead-based method (Omega Bio-Tek, Norcross, GA, USA). Leaf tissues were thoroughly homogenized in an automatic grinder (Omega Bio-Tek, Norcross, GA, USA) in the presence of lysis buffer and RNase A, followed by incubation at 70 °C for cell lysis. After centrifugation, the supernatant was mixed with isopropanol to facilitate binding between DNA and magnetic beads. Ethanol washing and DNA elution were subsequently completed using an automated nucleic acid extraction system (NanoMagBio S-96, Hangzhou Bioer Technology Co., Ltd., Hangzhou, China). DNA quality was evaluated by electrophoresis on 1% agarose gels, while DNA concentration and purity were determined using a NanoDrop 8000 spectrophotometer (Thermo Fisher Scientific, Waltham, MA, USA). DNA samples meeting quality standards were stored at −20 °C for subsequent analyses.
A total of 96 SSR primer pairs associated with the genus Cycas were obtained from previously published studies [18,19,20,27,28,29,30]. As described in our previous study [31], we used the Schuelke [32] and Shershov et al. [33] method for fluorescent labeling. SSR amplification and fluorescent fragment analysis were performed with minor modifications: Cycad species are rich in secondary metabolites, polyphenols, and polysaccharides, among other compounds, which can easily interfere with genomic DNA extraction and subsequent PCR amplification. Furthermore, the cross-species transferability and amplification stability of SSR markers among different Cycas species are relatively limited. To ensure the comparability of genetic analysis results across the eight Cycas species, this study prioritized the selection of SSR loci that could be stably amplified across different species and populations, exhibited distinct band patterns, demonstrated good reproducibility, and possessed high polymorphism. After two rounds of screening, six pairs of SSR primers suitable for amplification in all samples were ultimately obtained and used for subsequent population genetic analysis (Table 1).
PCR amplifications were performed on a Veriti 384 thermal cycler (Applied Biosystems, Foster City, CA, USA). Each 10 μL reaction mixture contained 5 μL of 2× Taq PCR Master Mix (TIANGEN Biotech, Beijing, China), 1 μL of template DNA (30 ng/μL), 0.5 μL each of forward and reverse primers (10 pmol/μL), and 3 μL of ddH2O. The PCR program consisted of an initial denaturation at 95 °C for 5 min; followed by 10 touchdown cycles of 95 °C for 30 s, annealing at 62–52 °C for 30 s with a decrease of 1 °C per cycle, and extension at 72 °C for 30 s; followed by 25 cycles of 95 °C for 30 s, 52 °C for 30 s, and 72 °C for 30 s; with a final extension at 72 °C for 20 min and storage at 4 °C. Fluorescent PCR products were diluted to a uniform concentration and subjected to fluorescent capillary electrophoresis, followed by SSR genotyping on an ABI 3730xl DNA Analyzer (Applied Biosystems, Foster City, CA, USA). SSR genotypes were scored using GeneMapper v4.1 software on the ABI 3730xl DNA Analyzer.

2.3. Data Analysis

Genetic diversity at SSR loci and across populations was evaluated using GenAlEx 6.501, including metrics such as the number of observed alleles (Na), effective alleles (Ne), Shannon’s information index (I), polymorphic information content (PIC), observed heterozygosity (Ho), expected heterozygosity (He), and the inbreeding coefficient (Fis). The genetic differentiation coefficient (Fst) and gene flow (Nm) were calculated, with gene flow estimated according to Wright [34] as Nm = 0.25 (1 − Fst)/Fst. Pairwise Nei’s standard genetic distances (D) were computed with PowerMarker, and populations were clustered using the UPGMA method with circular dendrograms illustrating the relationships. Population structure was inferred for 640 Cycas individuals using STRUCTURE 2.3.4, with K values ranging from 1 to 20, a burn-in period of 10,000, and 100,000 MCMC iterations, repeated 20 times per K. The most probable number of genetic clusters (ΔK) was identified using STRUCTURE HARVESTER, and assignment plots were generated accordingly. STRUCTURE outputs were further processed and visualized with CLUMPP and DISTRUCT. Based on the inferred structure, within- and among-population variation was quantified in GenAlEx 6.501, with significance evaluated via 999 permutations. In this study, genetically important populations were identified based on an integrated assessment of genetic diversity (He and I) and population structure analyses [35].

3. Results

3.1. Evaluation of Microsatellite Marker Transfer and Polymorphism

Across the 640 samples, the six primer pairs amplified a total of 58 alleles, with the number of alleles per locus ranging from 3 to 17 and averaging 9.67 (Table 2). The total number of effective alleles (Ne) ranged from 1.403 (GZST013) to 5.488 (GZST088), with an average of 3.114 per locus. Shannon’s information index (I) varied between 0.551 (GZST013) and 1.978 (GZST088), averaging 1.290. Observed heterozygosity (Ho) spanned 0.005 (GZST002) to 0.563 (GZST088), with a mean of 0.388, whereas expected heterozygosity (He) ranged from 0.287 (GZST013) to 0.818 (GZST088), averaging 0.602. Polymorphic information content (PIC) values were between 0.266 (GZST013) and 0.797 (GZST088), with an average of 0.566.

3.2. Genetic Diversity Among Populations

Based on the results presented in Table S2, substantial variation in genetic diversity parameters was observed both among Cycas species and among their populations. Overall, the mean number of alleles (Na) ranged from 1.945 to 3.643, the effective number of alleles (Ne) from 1.477 to 2.245, and Shannon’s information index (I) from 0.446 to 0.824, indicating a generally moderate-to-low level of genetic diversity with pronounced interspecific differences. Among the eight species, C. sexseminifera exhibited the highest level of genetic diversity (Na = 3.643, Ne = 2.245, I = 0.824), followed by C. balansae (I = 0.710) and C. debaoensis (I = 0.685). In contrast, C. guizhouensis showed the lowest genetic diversity (Na = 1.945, Ne = 1.548, I = 0.446), and C. ferruginea also exhibited relatively low diversity (I = 0.536). In terms of heterozygosity, observed heterozygosity (Ho) ranged from 0.222 to 0.453, while expected heterozygosity (He) ranged from 0.293 to 0.443. Among the species, C. balansae (Ho = 0.453) and C. guizhouensis (Ho = 0.444) showed relatively high observed heterozygosity, despite the overall low allelic diversity observed in C. guizhouensis, whereas C. ferruginea had the lowest value (Ho = 0.222). For expected heterozygosity, C. sexseminifera had the highest value (He = 0.443), while C. guizhouensis had the lowest (He = 0.293). It is important to note that an insufficient sample size may fail to detect rare alleles, leading to underestimates of allele frequency and the number of effective alleles.
The fixation index (F) further revealed clear differences in heterozygote patterns among species. Some species exhibited heterozygote deficiency (F > 0), such as C. dolichophylla (F = 0.288) and C. ferruginea (F = 0.194). In contrast, C. segmentifida (F = −0.124), C. guizhouensis (F = −0.427), and C. balansae (F = −0.151) showed varying degrees of heterozygote excess. It is worth noting that all populations of C. guizhouensis exhibit strong negative values. We recognize that SSR markers may be affected by null alleles, which could contribute to deviations from HWE and inflation of F-statistics. At the population level, genetic diversity also varied within species. For example, in C. sexseminifera, the SS-ZWS population exhibited the highest genetic diversity (I = 1.025, Ne = 2.918), whereas populations of C. guizhouensis consistently showed low and relatively uniform diversity (I = 0.410–0.484). Overall, Cycas species exhibited clear patterns of genetic differentiation both among species and within populations.

3.3. Genetic Differentiation and Distribution of Variation

As presented in Table 3, genetic differentiation and gene flow varied among SSR loci at the genus level. The Fst values ranged from 0.118 to 0.428, with a mean of 0.220, indicating a moderate level of genetic differentiation among populations overall. In terms of gene flow (Nm), values ranged from 0.335 to 1.864, with a mean of 1.077, suggesting a moderate level of gene exchange among populations. Among the loci, GZST055 exhibited the highest Nm value (1.864), indicating relatively frequent gene flow, whereas GZST002 (0.335) and GZST088 (0.808) had Nm values below 1, implying restricted gene flow and a greater susceptibility to genetic drift at these loci. The inbreeding coefficient (Fis) showed considerable variation across loci, ranging from −0.418 to 0.985, with a mean of 0.133, indicating a slight overall deficiency of heterozygotes within populations. Notably, GZST002 (Fis = 0.985) exhibited a pronounced heterozygote deficiency, while GZST013 (−0.418) and GZST019 (−0.351) showed heterozygote excess. The overall inbreeding coefficient (Fit) ranged from −0.155 to 0.992, with a mean of 0.292, further suggesting the presence of some degree of inbreeding or non-random mating across the dataset. Overall, Cycas species exhibited moderate genetic differentiation, moderate gene flow, and a slight tendency toward inbreeding at the genus level, with notable variation among loci.
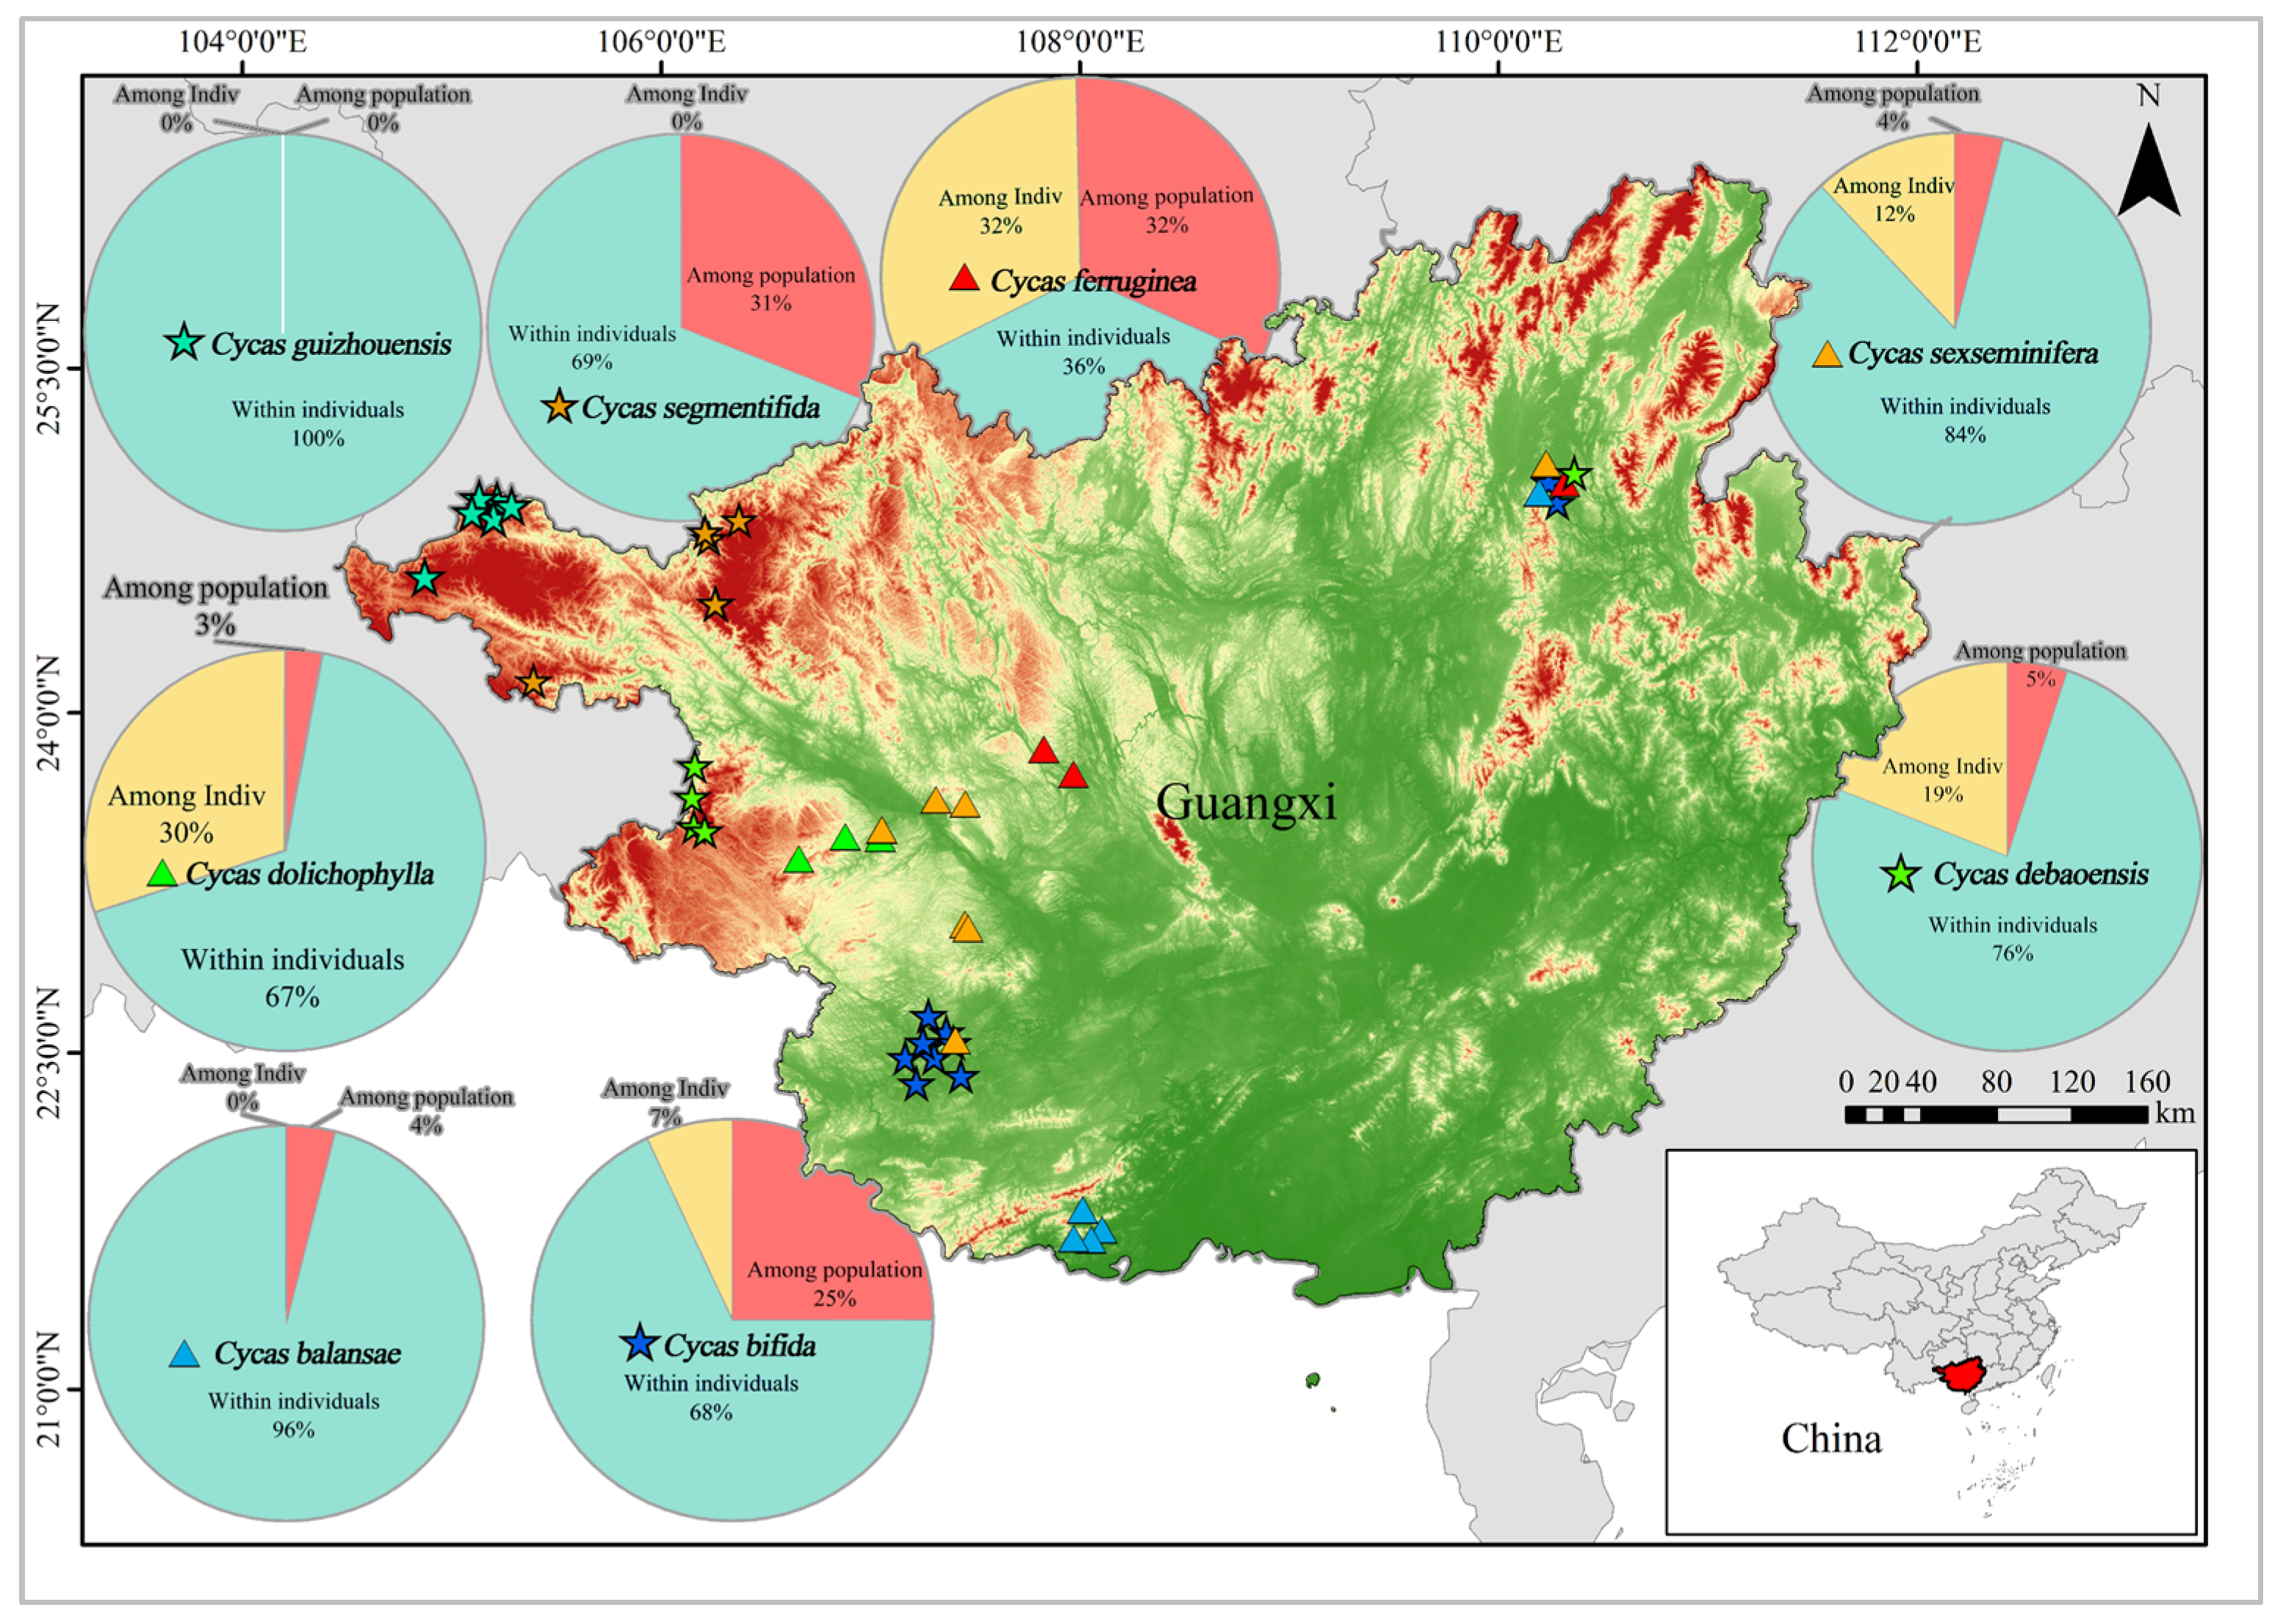
Analysis of molecular variance (AMOVA) is a quantitative framework that evaluates the distribution of genetic variation by incorporating evolutionary distances among haplotypes or genotypes (Table 4, Figure 2). AMOVA analysis revealed that 22% of the total genetic variation was distributed among populations, whereas 78% was partitioned within populations, including 60% within individuals and 18% among individuals, indicating that most genetic variation was attributable to variation within individuals rather than among populations. For C. segmentifida, 31% of variation existed among populations, 7% among individuals, and 69% within individuals, suggesting that although within-individual variation was high, there was still notable genetic differentiation among populations. C. dolichophylla exhibited only 3% among populations, 30% among individuals, and 67% within individuals, indicating that genetic diversity was primarily concentrated within individuals, with almost no differentiation among populations. C. bifida showed 25% variation among populations, 7% among individuals, and 68% within individuals, similar to C. segmentifida, with some population differentiation but most variation retained within individuals. C. debaoensis exhibited 5% variation among populations, 19% among individuals, and 76% within individuals, indicating that variation was highly concentrated within individuals, with minimal differences among populations. For C. guizhouensis, both among-population and among-individual variation were 0%, and 100% of variation existed within individuals, suggesting that populations were almost genetically uniform with extremely homogeneous structure. C. sexseminifera displayed 4% variation among populations, 12% among individuals, and 84% within individuals, showing that genetic diversity was mainly concentrated within individuals, with minimal inter-population differentiation. In C. balansae, 4% of variation occurred among populations, none among individuals, and 96% within individuals, indicating that almost all genetic variation was concentrated within individuals, with negligible differences among populations. In contrast, C. ferruginea exhibited a relatively balanced pattern, with 32% variation among populations, 32% among individuals, and 36% within individuals, suggesting a more dispersed population structure and evident population differentiation. Overall, genetic variation in Cycas species is primarily concentrated within populations, with the largest proportion attributable to variation within individuals, while differentiation among populations remains moderate.

3.4. Genetic Diversity Among Species

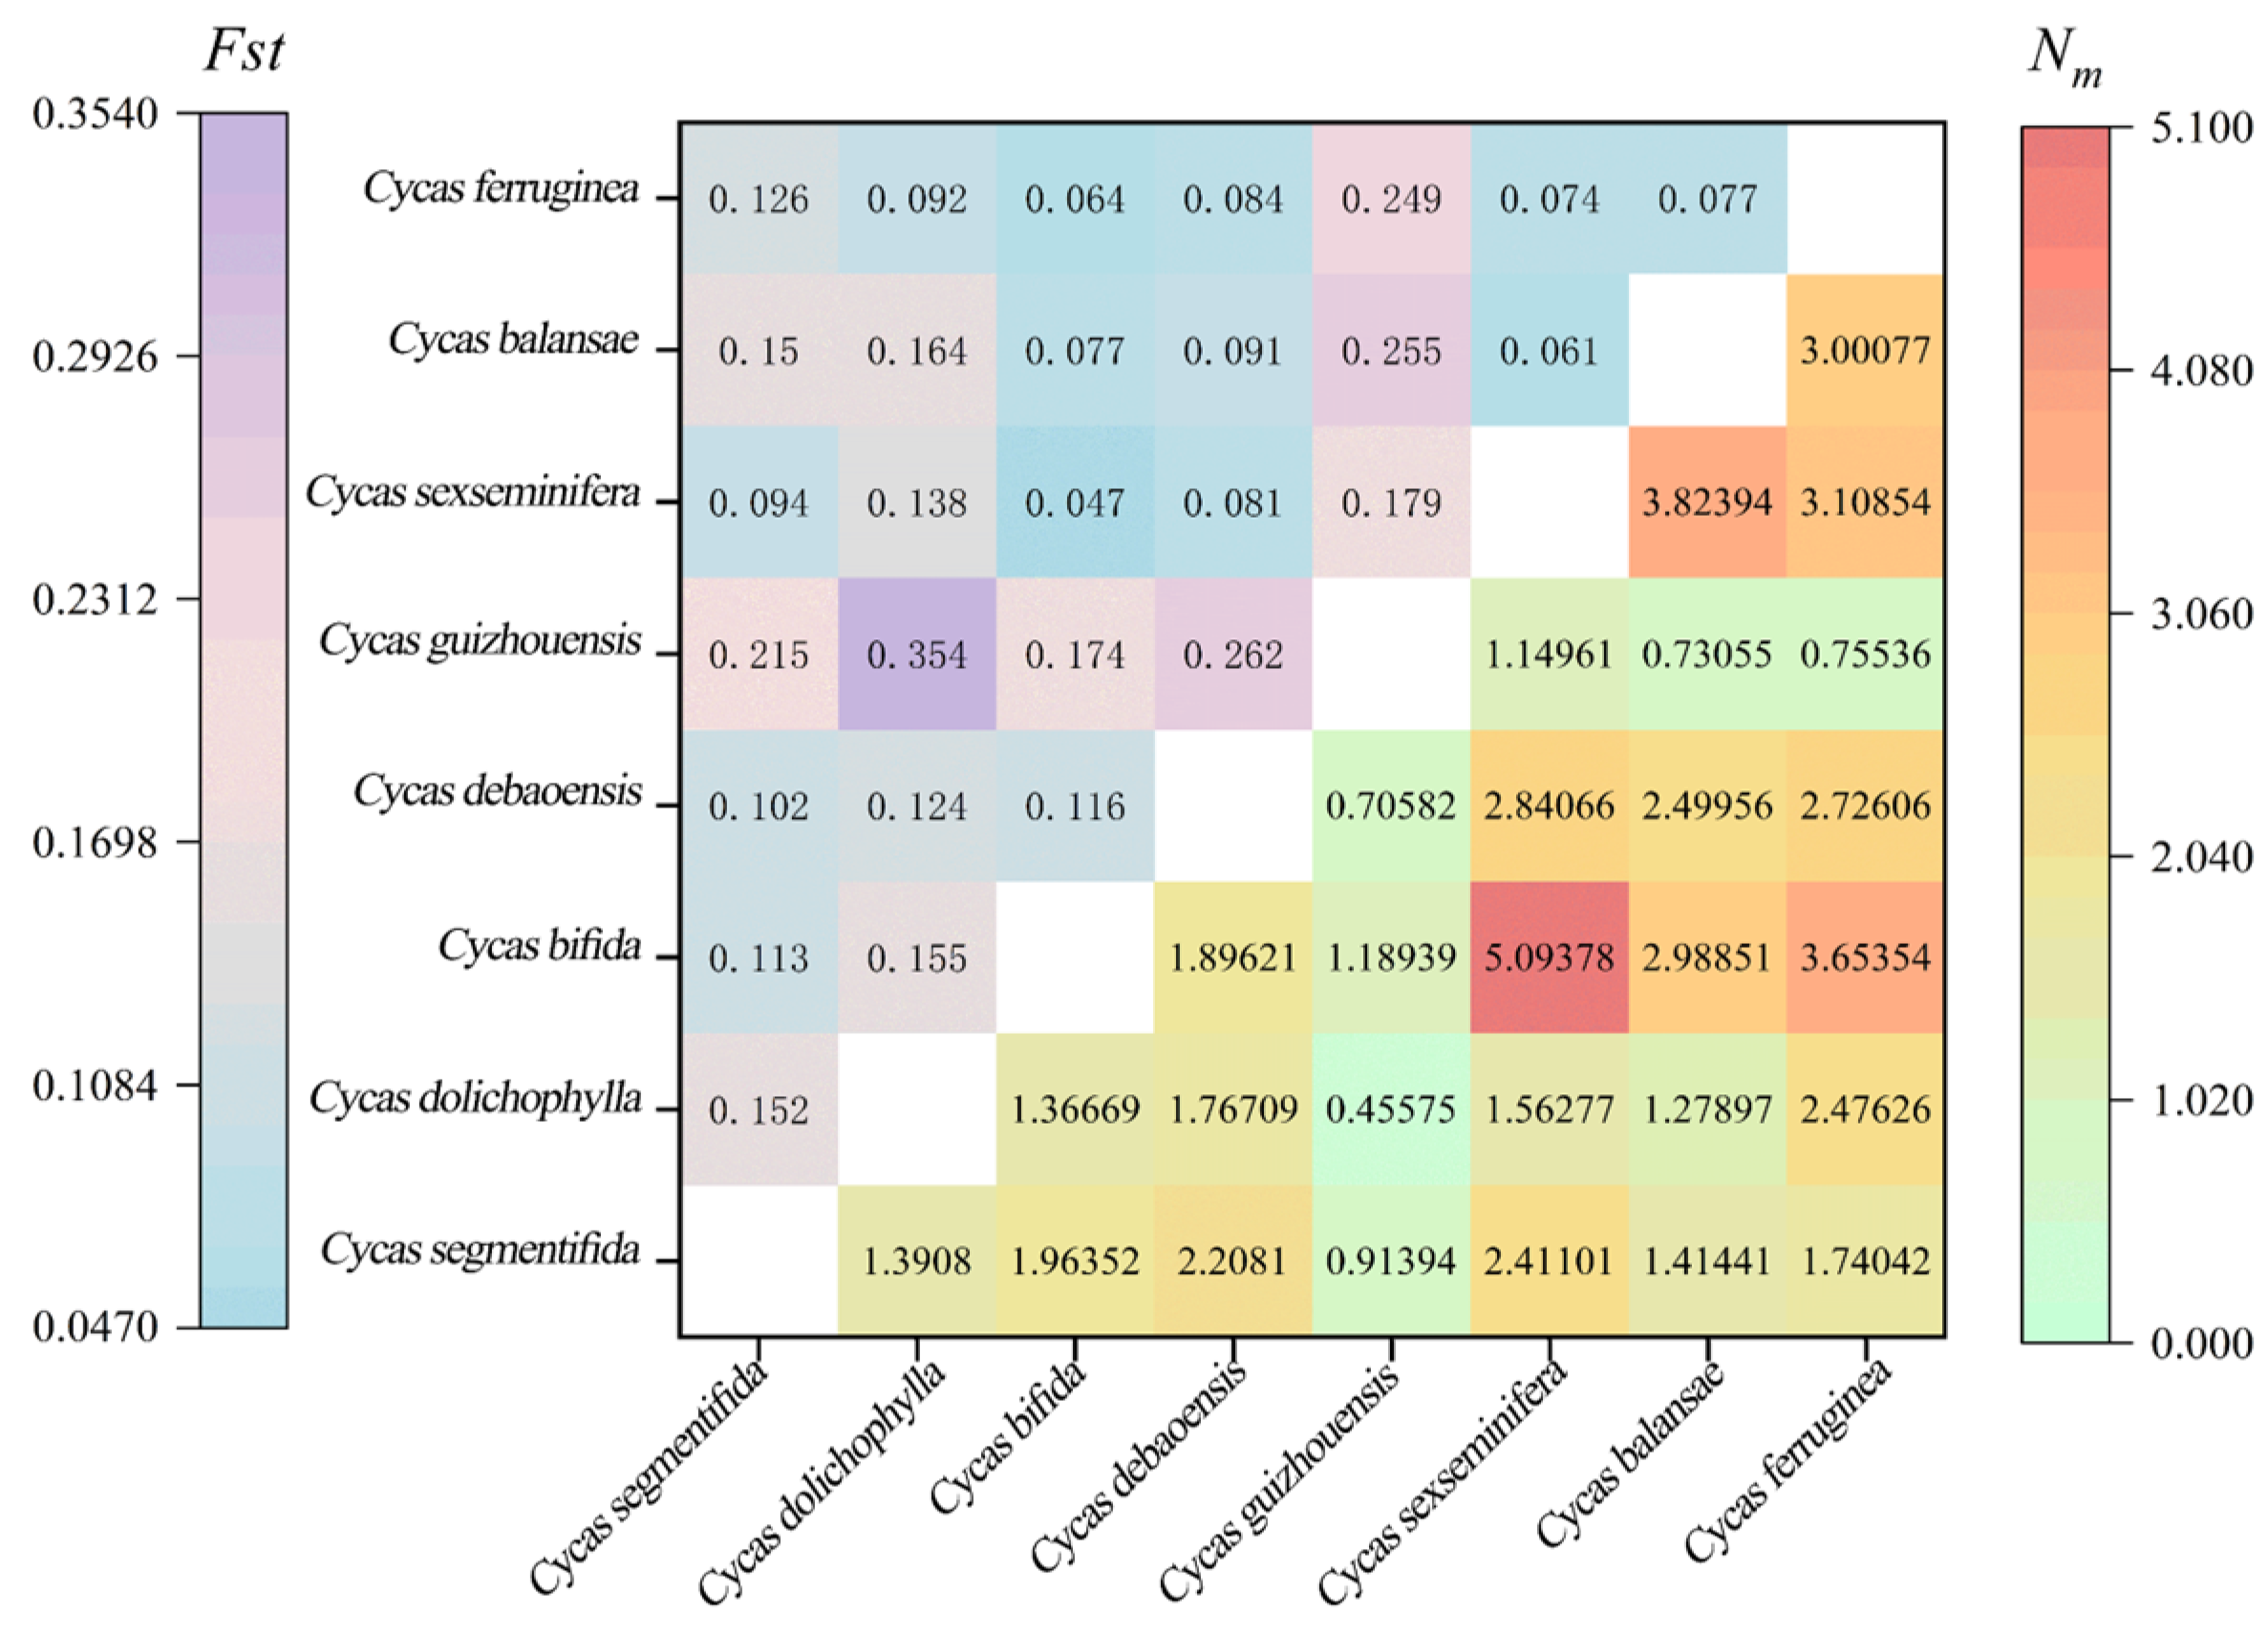
As shown in Figure 3, the Fst values among the eight Cycas species in Guangxi ranged from 0.047 to 0.354, indicating significant differences. C. bifida and C. sexseminifera exhibited minimal genetic differentiation, with an Fst of only 0.047. Most genetic differentiation was moderate, such as between C. segmentifida and C. dolichophylla (0.152), and between C. guizhouensis and C. ferruginea (0.249). Notably, C. guizhouensis showed relatively high genetic differentiation with C. dolichophylla (Fst = 0.354) and C. debaoensis (Fst = 0.262). Gene flow (Nm) among the eight Cycas species ranged from 0.456 to 5.094. Gene flow between populations of Cycas was unevenly distributed; most population pairs had Nm > 1, indicating relatively sufficient gene exchange, which could partially alleviate the effects of genetic drift. Overall, Fst values were negatively correlated with Nm, i.e., populations with adequate gene flow showed lower differentiation, whereas populations with restricted gene flow exhibited higher differentiation.

3.5. Genetic Structure and Cluster Analysis

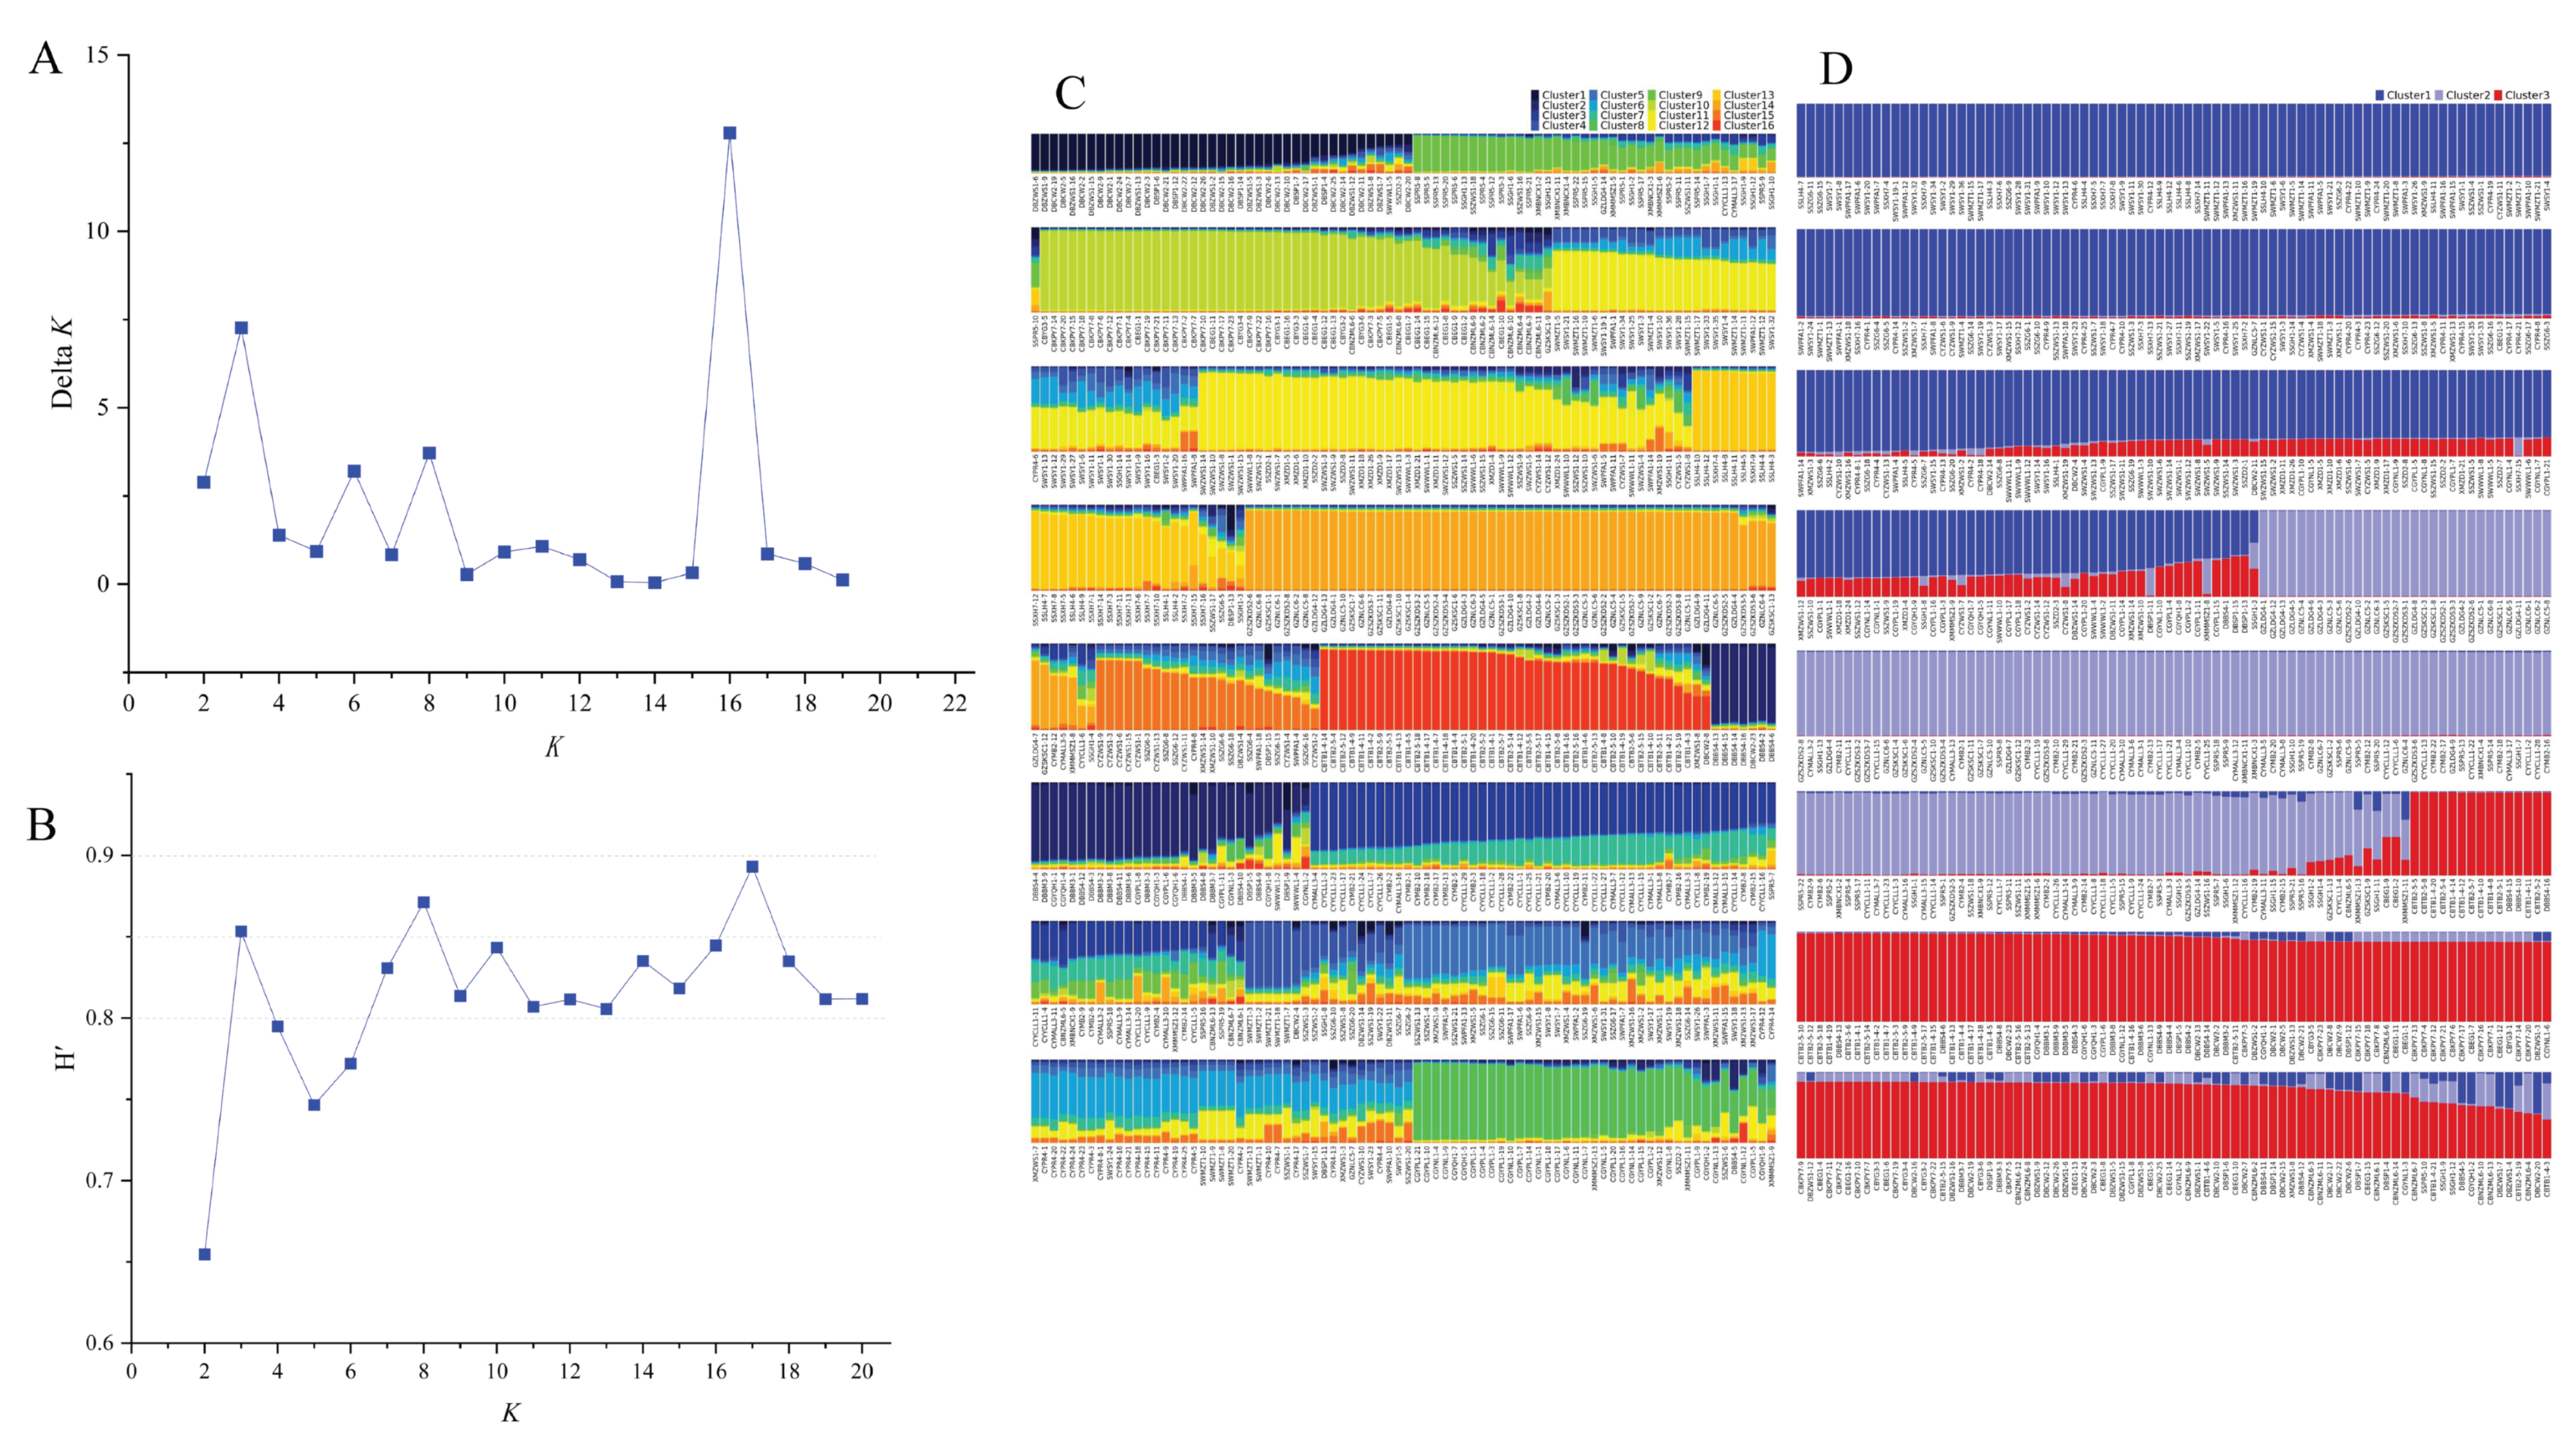
Bayesian clustering analysis of 640 Cycas individuals was conducted using STRUCTURE, and the most likely number of genetic clusters was evaluated using the Evanno method (Figure 4A). The ΔK statistic reached its maximum at K = 16, with a secondary peak observed at K = 3, indicating the presence of hierarchical genetic structure within the dataset. CLUMPP analyses showed (Figure 4B) generally high consistency among replicate STRUCTURE runs across most K values (H′ > 0.80). The highest stability was observed at K = 17 (H′ = 0.893), while the stability at K = 3 (H′ = 0.853) was slightly higher than that at K = 16 (H′ = 0.845). According to the Evanno method, K = 16 represents the statistically strongest level of genetic subdivision among populations. However, this higher K value mainly reflects finer-scale differentiation among populations and species. In contrast, K = 3 captured the major genetic lineages and showed better concordance with the PCoA clustering results, providing a more biologically interpretable representation of the overall genetic structure. Therefore, K = 3 was selected as the primary clustering level for downstream interpretation and discussion, whereas K = 16 was considered to represent additional hierarchical substructure within the dataset.
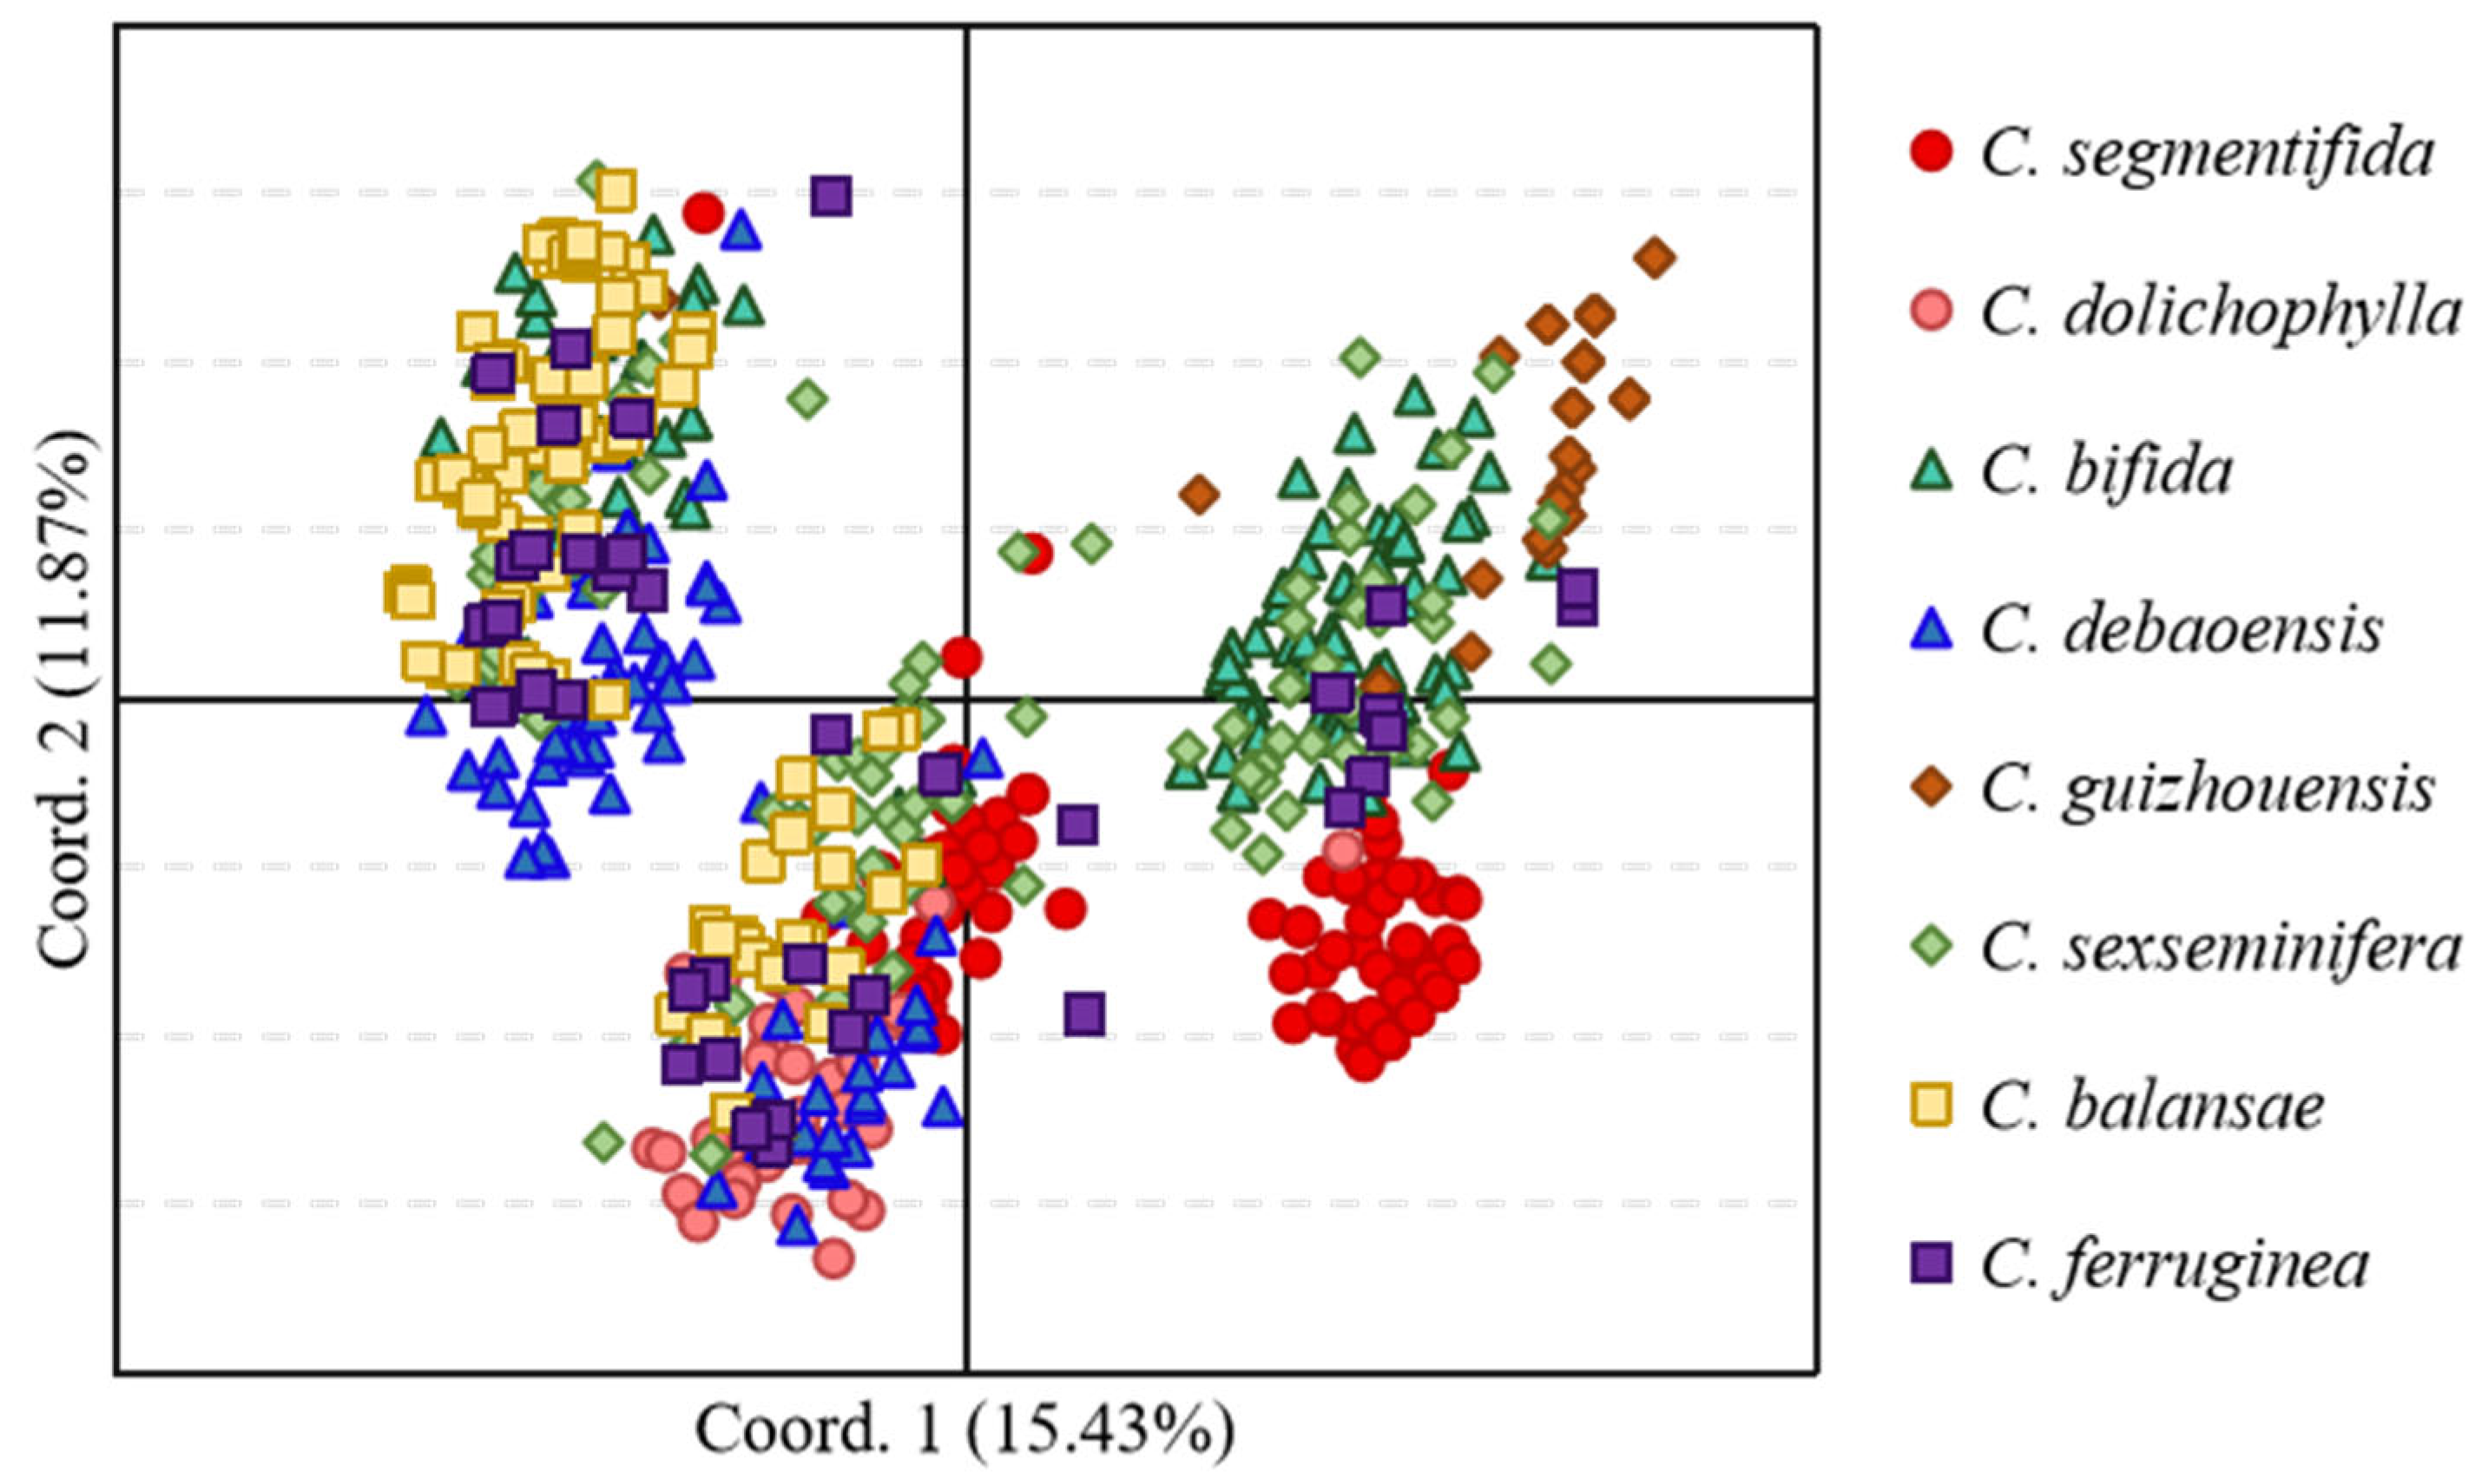
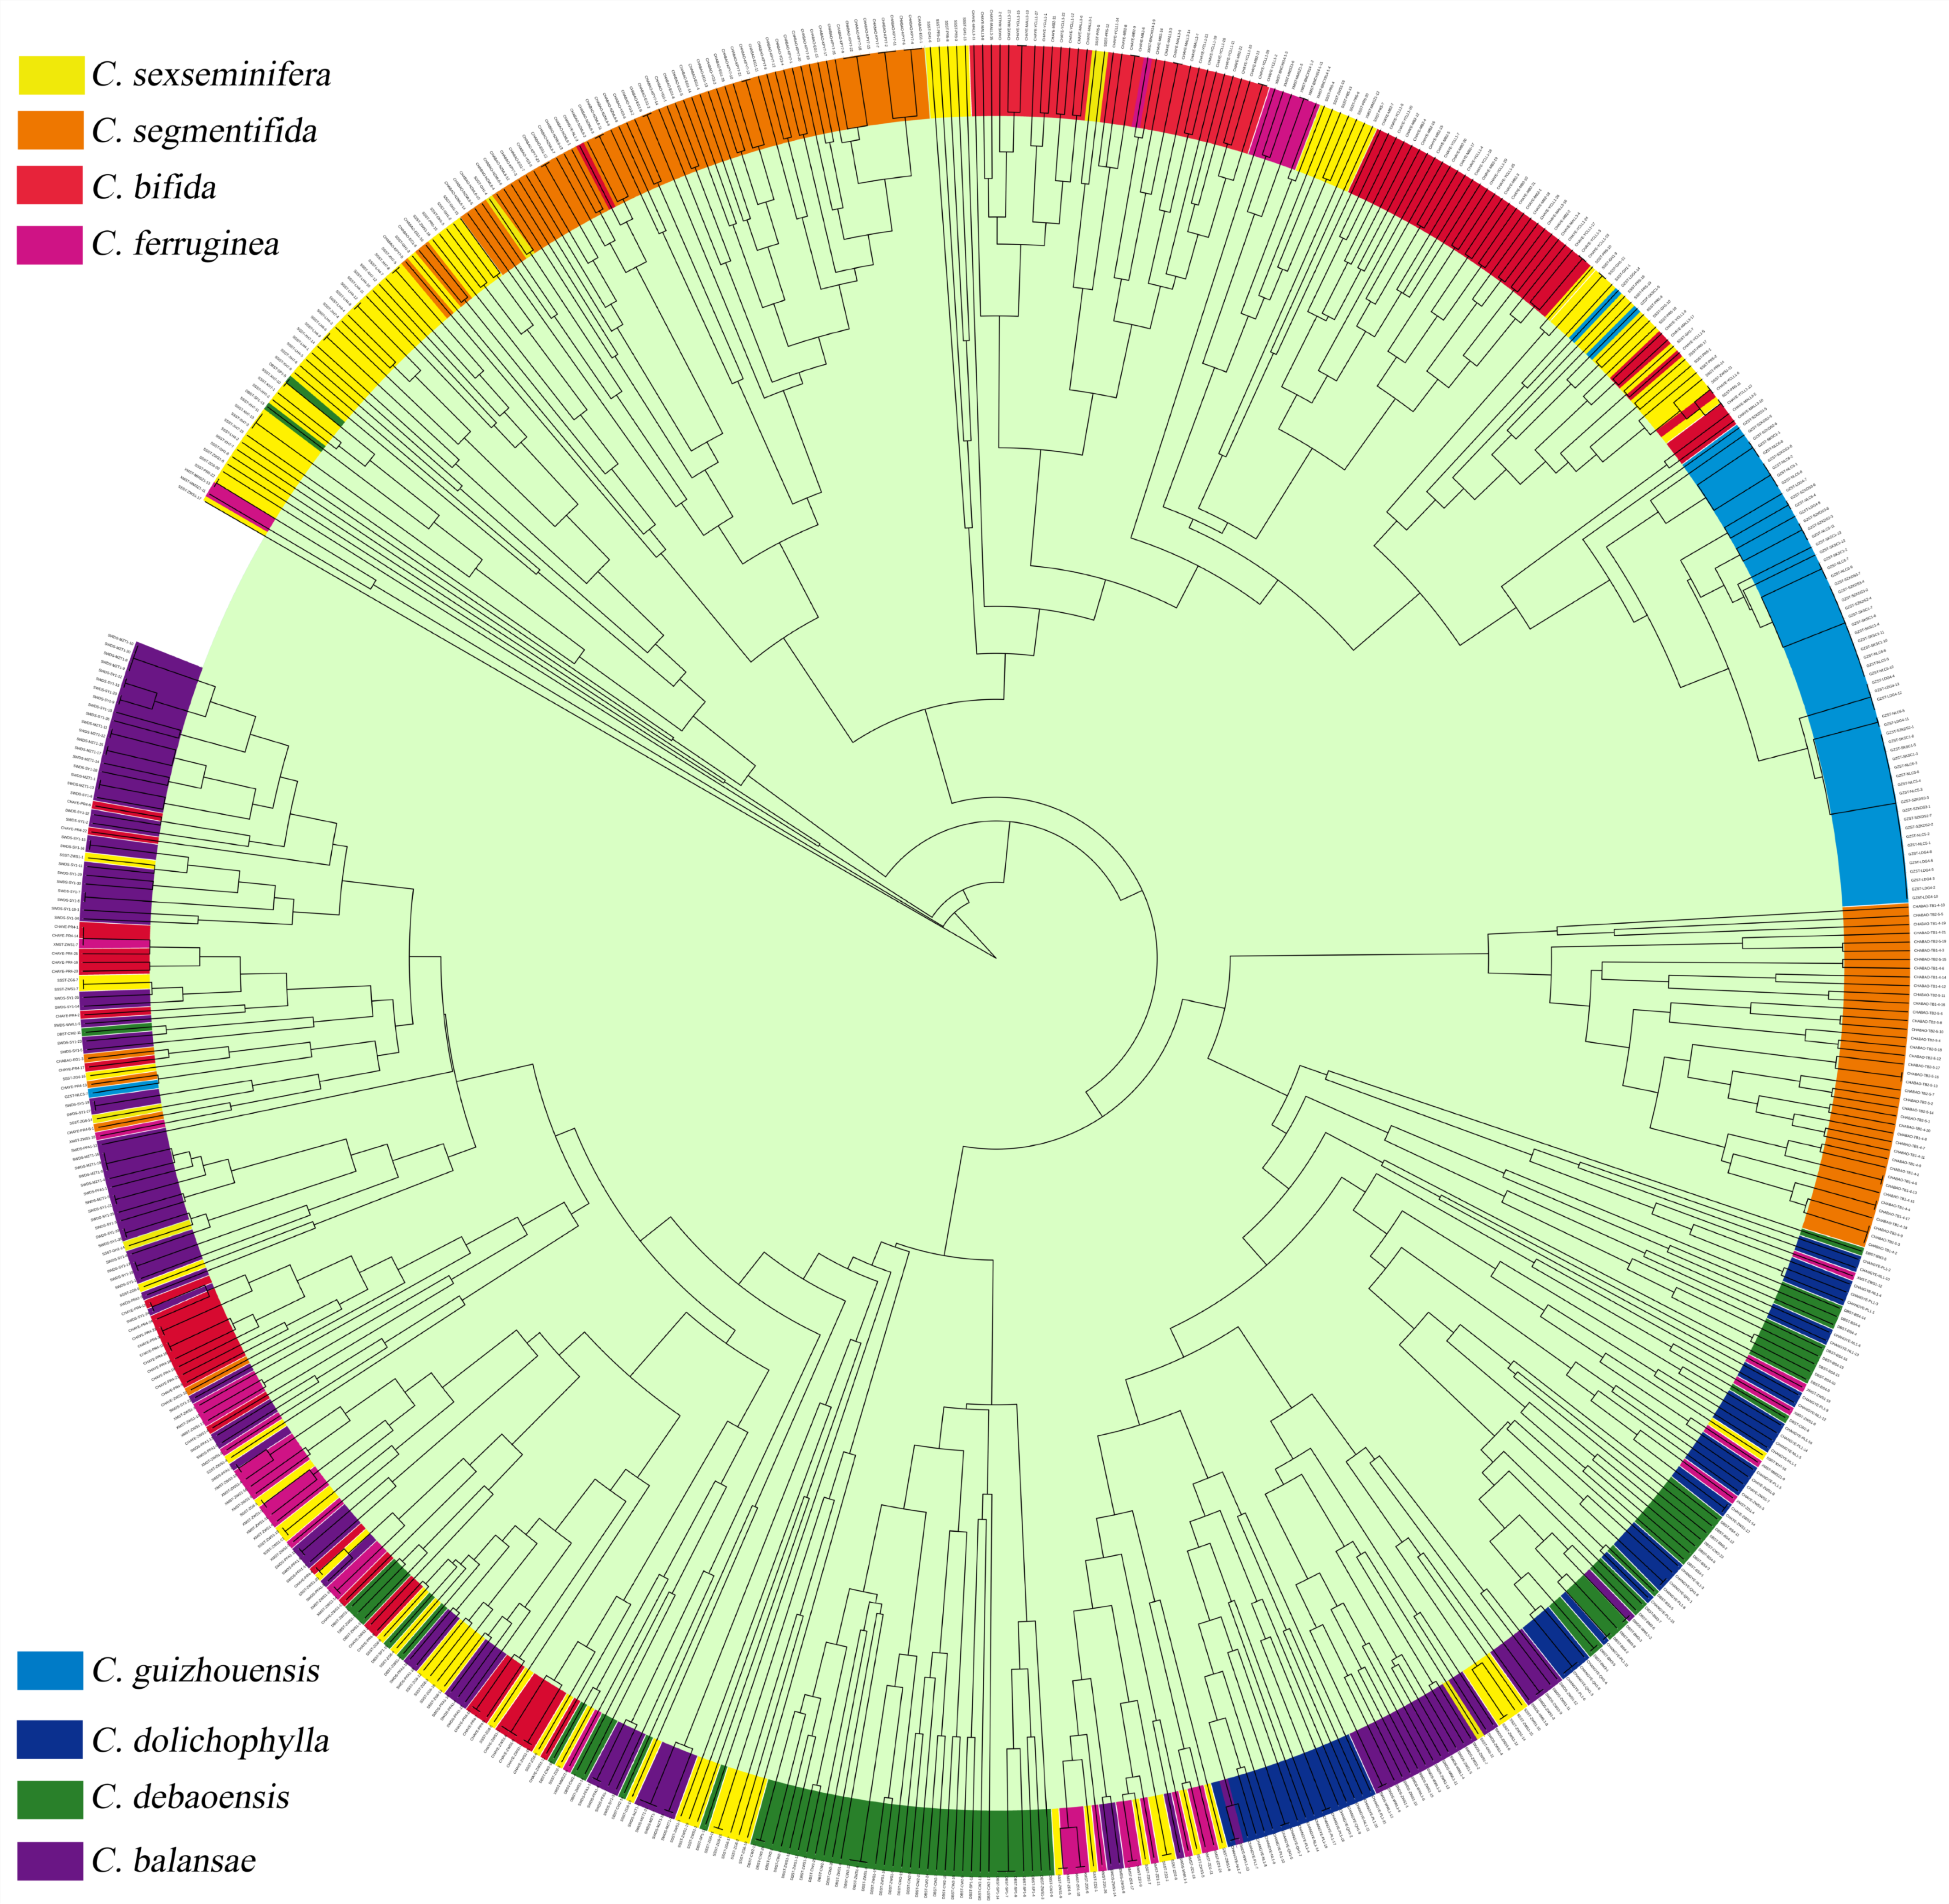
Principal coordinates analysis (PCoA) (Figure 5) showed that the first two coordinates explained 15.43% and 11.83% of the total variation, respectively, accounting for 27.26% cumulatively. Except for C. guizhouensis, which was mainly concentrated in the first quadrant, the remaining samples exhibited varying degrees of overlap in the coordinate space. The UPGMA clustering analysis (Figure 6) further supported the major genetic groupings inferred by STRUCTURE and PCoA, although the boundaries among clusters were not completely distinct. Among them, only C. guizhouensis formed a species-specific cluster, whereas all other species exhibited varying degrees of interspecific clustering. The first major branch included all populations of C. guizhouensis, together with partial populations of C. segmentifida (CB-EG, CB-KPY, CB-NZML, and CB-YG), C. dolichophylla (CHY-MALL, CHY-MB, and CHY-YCLL), C. sexseminifera (SS-GH, SS-LH, SS-PR, and SS-XH), and C. ferruginea (XM-BNCX and XM-MMSZ). The second major branch mainly comprised the TB populations of C. segmentifida (CB-TB1 and CB-TB2), all populations of C. bifida (CAY-NL, CAY-PL, and CAY-QH), partial populations of C. debaoensis (DB-BM, DB-BS, and DB-CW), the XM-ZD population of C. ferruginea, and the KY-WWL population of C. balansae. The third major branch included the CHY-PR population of C. dolichophylla, the DB-SP population of C. debaoensis, the SS-ZD and SS-ZG populations of C. sexseminifera, and the KY-MZT, KY-PFA, and KY-SY populations of C. balansae.

3.6. Analysis of Genetic Distance and Geographic Distance

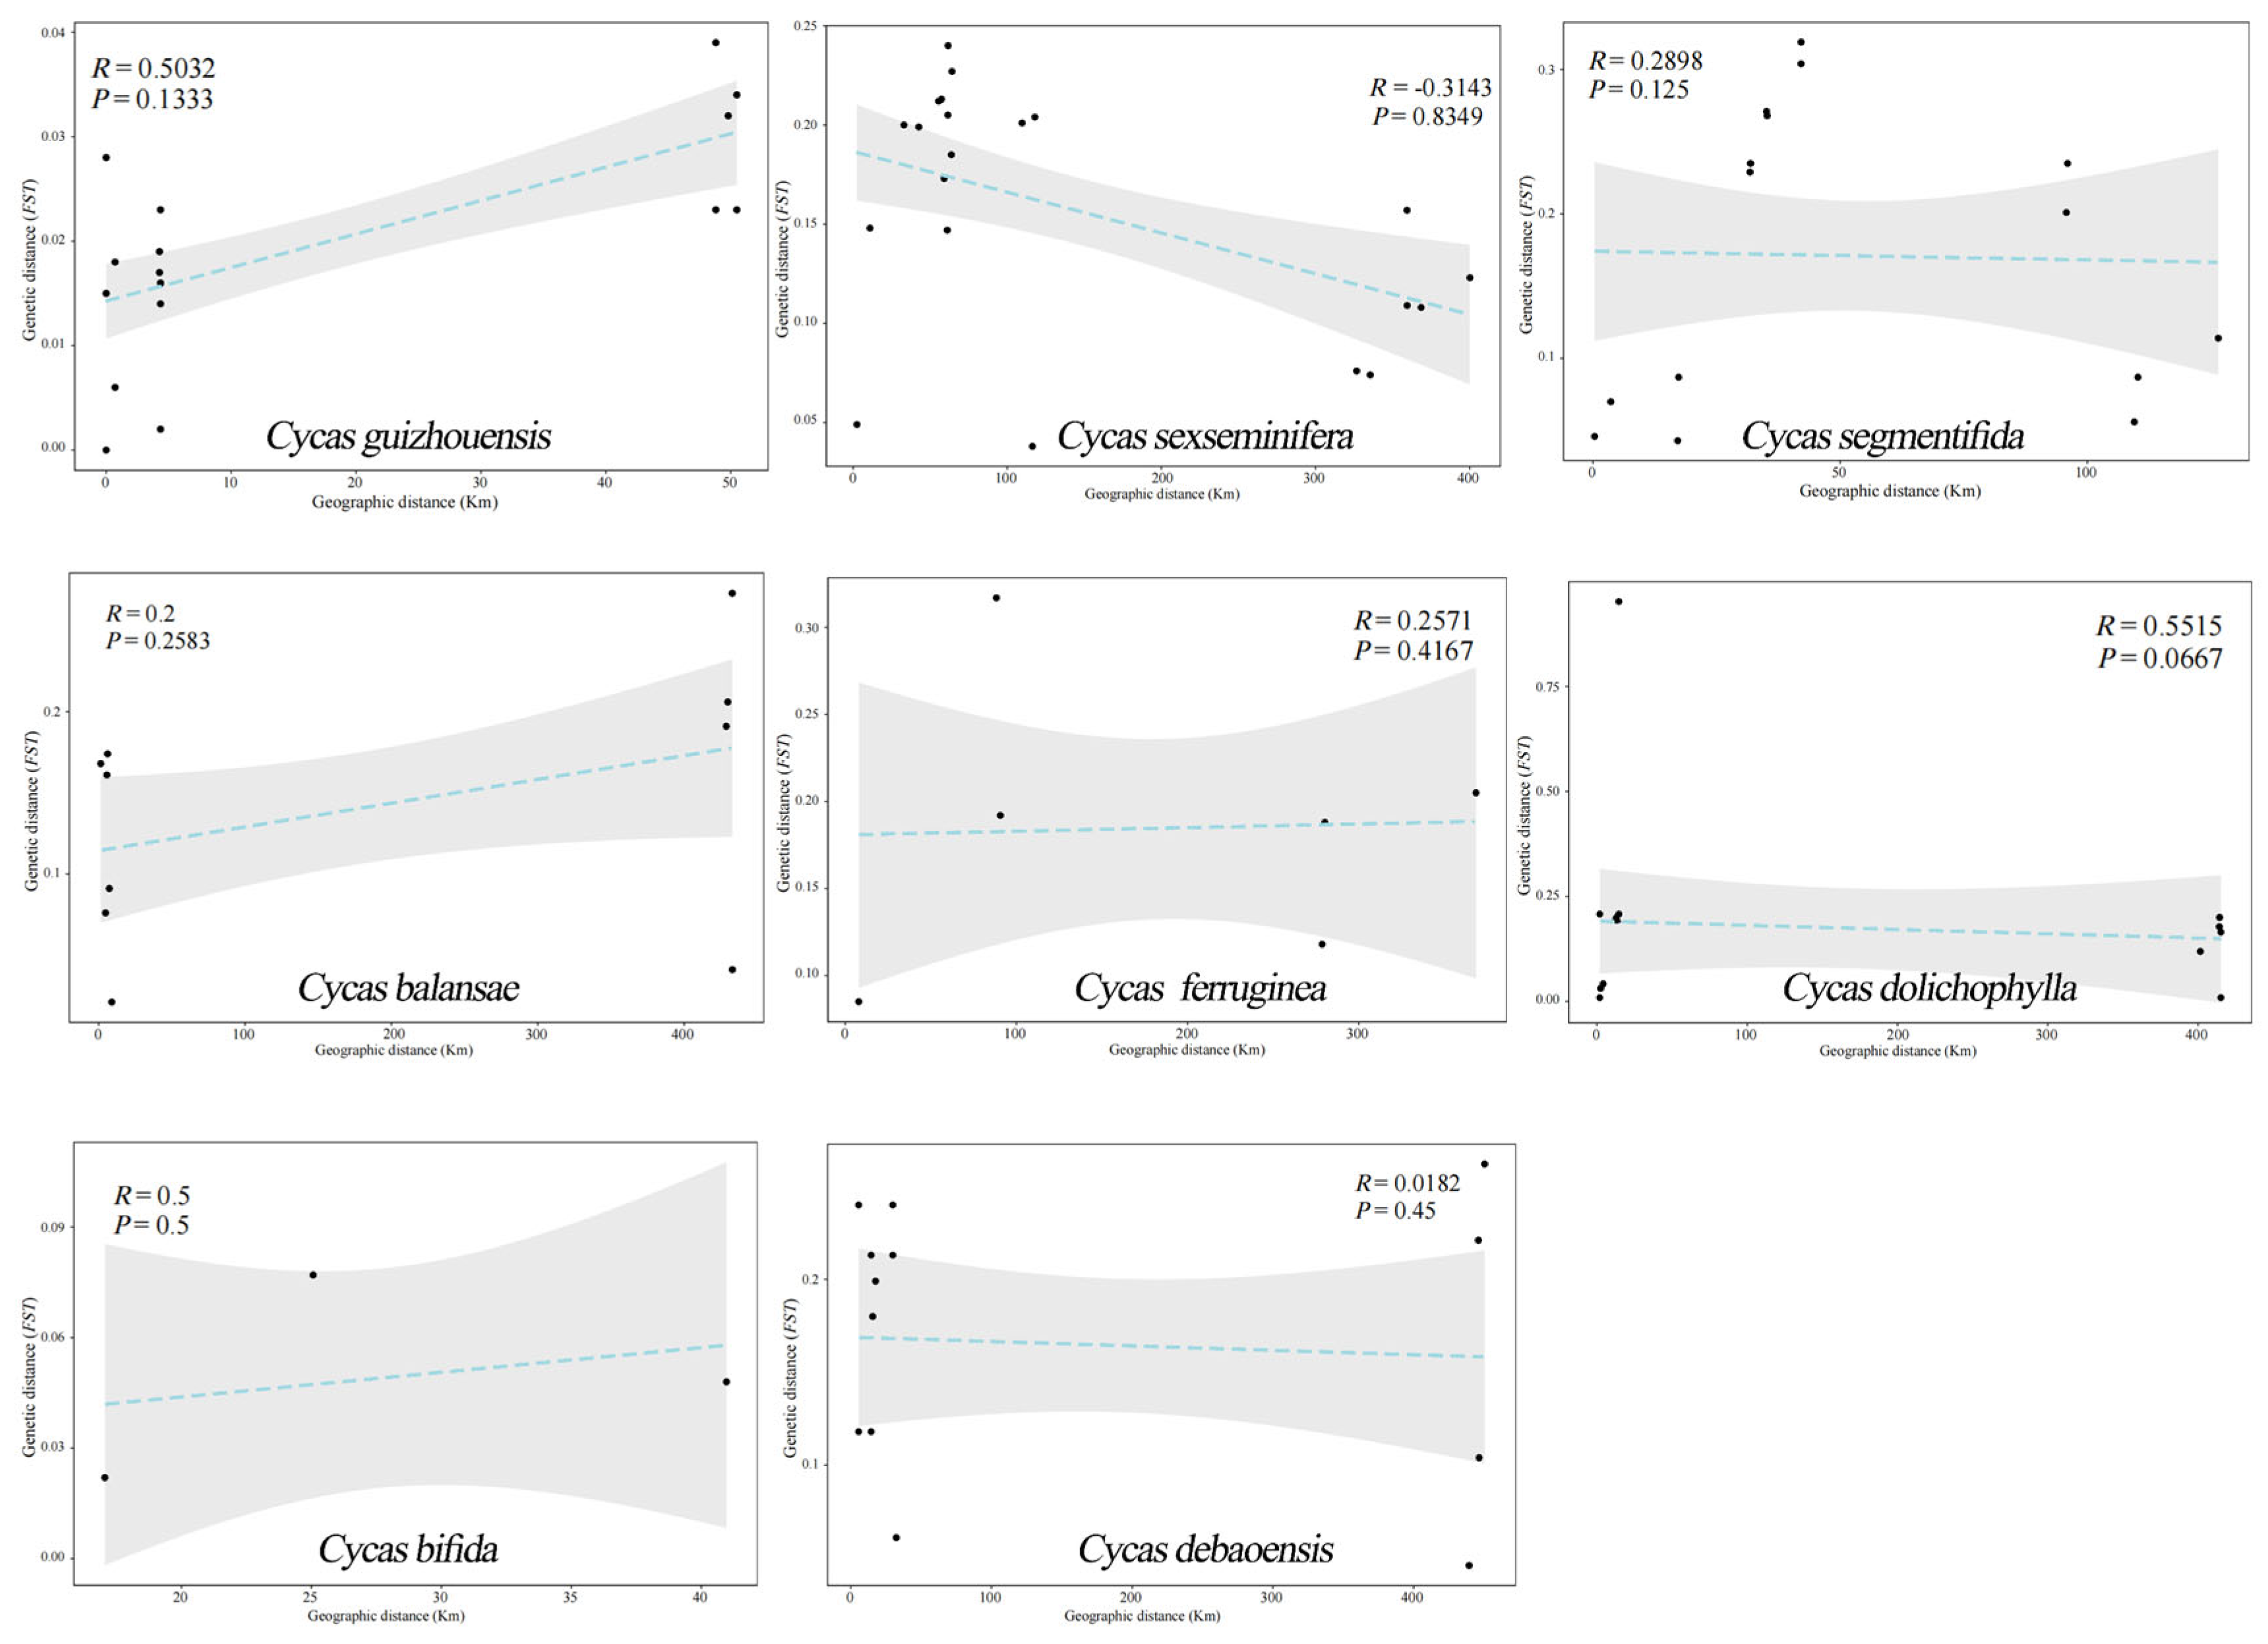
Figure 7 presents the results of the Mantel test examining the relationship between genetic distance and geographic distance among populations of the eight Cycas species. The analysis revealed no significant association between genetic differentiation and geographic separation or distribution patterns in any of the species. This suggests that genetic differentiation among these populations does not correspond directly to geographic spatial distribution and that the observed genetic differences are likely driven primarily by other ecological, evolutionary, or anthropogenic factors.
Figure 7. Analysis of genetic distance and geographic distance among Cycas populations.
Diversity 18 00340 g007

4. Discussion

Genetic diversity and population structure are commonly used to explain the evolutionary potential of endangered species and the causes of their endangerment. They also play an important role in the genetic improvement of plant germplasm resources and are key factors determining the adaptive evolutionary potential of populations [36,37]. In general, the higher the level of genetic diversity of a species, the stronger its adaptability to environmental changes. From an evolutionary perspective, the lifespan of individuals is limited, and their contribution to evolution is mainly realized through participation in populations or population systems. The genetic diversity and genetic structure maintained by endangered species are the result of their long-term adaptation and response to the environment, and they also influence their future survival and developmental trajectories [38,39].
This study employed six highly polymorphic SSR primer pairs to systematically analyze the genetic diversity of 640 Cycas samples from different regions of Guangxi, China. Although this study retained only six SSR loci, the average Shannon information index (I) for these six primer pairs was 1.2895, with an average expected heterozygosity (He) of 0.6015 and an average observed heterozygosity (Ho) of 0.3882. and the average PIC value was 0.566, indicating that these primers exhibit high polymorphism and generated 58 alleles among 640 individuals, suggesting sufficient discriminatory power for large-scale assessment of genetic diversity and population structure. In this study, significant differences were observed among different Cycas species. C. sexseminifera showed a relatively high level of genetic diversity, whereas the other seven species maintained moderate levels of genetic diversity. However, the genetic diversity of C. segmentifida, C. bifida, C. guizhouensis, and C. dolichophylla in this study was lower than that reported by Feng et al. [21,22,23] and Zheng et al. [24]. Moreover, the genetic diversity of the eight Cycas species in this study was lower than that of C. multipinnata (I = 0.994, He = 0.497) [40] and C. taiwaniana (I = 1.094, He = 0.542) [41], which may be related to differences in the molecular marker techniques used and population sampling strategies. In the present study, several populations exhibited relatively low effective numbers of alleles (Ne), including all populations of C. guizhouensis, as well as CAY-QH of C. dolichophylla, DB-SP of C. debaoensis, and XM-ZD of C. ferruginea. Low effective numbers of alleles generally indicate limited effective genetic variation and uneven allele frequency distributions within populations, making them more susceptible to genetic drift and consequently leading to further loss of genetic diversity. In general, rare and endangered plants, especially plant species with extremely small populations (PSESP), tend to exhibit low levels of genetic diversity [42]. Therefore, the current level of genetic diversity in Cycas is unlikely to be the primary cause of its endangerment. Analysis of the inbreeding coefficient (F) showed that the mean F values of C. segmentifida, C. guizhouensis, and C. balansae were all negative, indicating a certain degree of heterozygote excess within these populations. Among them, all populations of C. guizhouensis exhibited strongly negative F values (ranging from −0.342 to −0.624), a pattern that is relatively uncommon in natural plant populations. In addition to possible biological explanations such as bottleneck effects, random allele loss caused by genetic drift, or selective advantages of heterozygotes, technical factors including SSR scoring errors, null alleles, or sampling effects cannot be excluded. Therefore, the interpretation of heterozygote excess in C. guizhouensis should be treated with caution and requires further verification using additional molecular markers and larger sample sizes. In contrast, the mean F values of C. dolichophylla and C. ferruginea were 0.288 and 0.194, respectively, indicating a certain degree of heterozygote deficiency and suggesting the presence of inbreeding within these populations. Inbreeding may increase the probability of homozygous expression of deleterious recessive alleles, thereby reducing population adaptability and potentially leading to inbreeding depression [43].
Genetic differentiation (Fst) and gene flow (Nm) are important indicators for exploring speciation and phylogenetic relationships [44,45]. In this study, the Fst values among eight Cycas species ranged from 0.047 to 0.354, indicating substantial variation in genetic differentiation among species. The highest differentiation was observed between C. guizhouensis and C. dolichophylla (0.354), while the lowest was between C. sexseminifera and C. bifida (0.047). The Nm values ranged from 0.456 to 5.094. Except for C. bifida and C. sexseminifera, the Nm values between C. guizhouensis and other Cycas species were all < 1, suggesting clear genetic isolation between C. guizhouensis and the other species. In contrast, the Nm values among the remaining seven Cycas species were all > 1, indicating generally strong gene exchange among Cycas species distributed in Guangxi. Considering the sampling context, these relatively high Nm values may be attributed to multiple factors and are influenced by landscape features operating across spatial and temporal scales [46]. First, there may be unsampled intermediate populations in the study area, which could increase genetic connectivity among species. Second, historical introgression (ghost introgression) may have occurred during species divergence, meaning that gene flow took place among species in the past; even if such gene flow has ceased, genomic signatures may still persist [47]. This pattern is consistent with the findings of Chang et al. [48] in C. revoluta. In addition, shared ancestral polymorphism may also result in relatively low differentiation among species [49]. AMOVA results showed that, at the species level, except for C. ferruginea, more than 67% of genetic variation in the other seven Cycas species occurred within individuals, with C. bifida and C. guizhouensis reaching 96% and 100%, respectively. At the genus level, 60% of the total genetic variation among the eight Cycas species was found within individuals, while 22% occurred among populations. The high proportion of within-individual variation may reflect the long lifespan, predominantly outcrossing reproductive system, and retention of ancestral polymorphisms in Cycas species during long-term evolution, while the degree of differentiation among populations remains relatively low. Therefore, attention should be paid to populations that are too small or excessively isolated, as genetic drift and inbreeding may threaten their long-term persistence [50].
Interactions between plants and their environment may shape the spatial distribution of genetic variation [51]. Geographic distance, as well as ecological or environmental differences, can lead to genetic isolation among populations, thereby reducing the rates of successful migration and gene flow [52]. For example, in endangered endemic species of China such as Cephalotaxus oliveri [53] and Yulania stellata [54], genetic differentiation is significantly influenced by geographic distance and environmental heterogeneity. In this study, the results of the isolation by distance (IBD) test, based on Mantel correlation analysis, indicated that none of the eight Cycas species showed significant geographic isolation. The weakening of the IBD pattern is typically attributed to the combined effects of multiple factors, including high levels of gene flow, historical demographic processes (such as bottlenecks and expansions), environmental selection pressures (isolation by environment, IBE), and habitat fragmentation. These factors may alter the spatial distribution of genetic structure, thereby masking the influence of geographic distance on genetic differentiation.
As one of the oldest extant groups of gymnosperms on Earth and an endangered plant lineage, elucidating the phylogenetic relationships among Cycas species and revealing evolutionary patterns within the genus are of great significance for taxonomic identification and germplasm conservation of wild populations. In this study, population structure analysis of eight Cycas species distributed in Guangxi was conducted using SSR molecular markers. The results showed that the 640 samples exhibited the highest peak at K = 16, with a secondary peak observed at K = 3. Moreover, both UPGMA clustering and principal coordinate analysis (PCoA) indicated that clustering within Cycas did not strictly follow current species boundaries. Except for C. guizhouensis, populations of the remaining species exhibited varying degrees of admixture across clusters. Cycads are characterized by long life spans and slow evolutionary rates, and incomplete lineage sorting is therefore common in this group, particularly among recently diverged taxa. Consequently, genetic clustering may not fully correspond to species delimitations based on traditional morphological classification systems. Similar cases in which multiple species are grouped into relatively few genetic clusters have been reported in other plant taxa. For example, Yan et al. used SSR markers to divide 18 species of Melilotus into only three genetic subgroups [55]. Such discordance may be attributed to several factors, including the retention of ancestral polymorphisms, recent or ongoing divergence among species, and possible historical hybridization or introgression, all of which may result in the aggregation of multiple species into fewer molecular clusters. These findings suggest that genetic differentiation among some Cycas species remains limited, and additional evidence from broader genomic datasets will be required to further clarify the underlying genetic mechanisms.
Comparisons between ex situ populations (ZWS populations) and corresponding wild populations revealed that ex situ conservation populations did not show a uniform genetic pattern across species. Some ex situ populations maintained relatively high levels of genetic diversity, whereas others exhibited heterozygote deficiency or excess, suggesting that the genetic composition of ex situ populations may have been influenced by founder effects, artificial propagation, mixed germplasm sources, and non-random mating during long-term cultivation and conservation management. For example, SS-ZWS of C. sexseminifera exhibited relatively high genetic diversity (He = 0.533; I = 1.025) together with a positive fixation index (F = 0.236), which may indicate the introduction of multiple germplasm sources and the presence of substructure within the ex situ population. In contrast, KY-ZWS of C. balansae showed strong heterozygote excess (F = −0.393), possibly reflecting artificial mixing or sampling effects. These results suggest that although ex situ populations may preserve substantial genetic variation, their genetic structure may not fully represent natural population patterns. Therefore, genetic management should be emphasized during ex situ conservation of Cycas species, including the maintenance of sufficient founder individuals, documentation of germplasm origins, and long-term genetic monitoring to minimize potential genetic erosion and artificial genetic structure.
The results of this study revealed substantial differences in genetic diversity among Cycas species distributed in Guangxi. Therefore, conservation strategies for Cycas species may need to be adjusted according to the genetic differentiation patterns of different species. Based on the observed genetic patterns, parallel situ conservation could be considered as a potential supplementary conservation approach, whereby ex situ conservation programs are designed to maintain genetic connectivity between natural and ex situ populations through pollen-mediated gene flow. The effectiveness of this strategy may depend on species-specific assessments of pollen flow dynamics and the design of conservation nurseries [56]. In addition, populations with relatively high genetic diversity, such as SS-ZWS, SS-XH, and SS-PR of C. sexseminifera, as well as DB-CW of C. debaoensis, may represent important genetic resources and could be considered as priority candidates for in situ conservation. Appropriate collection of reproductive materials for ex situ conservation and introduction into homologous botanical gardens may also help preserve genetic variation while reducing potential risks associated with relying solely on a single conservation strategy. In addition, in the context of conservation, managing pollen-mediated gene flow may represent a feasible supplementary strategy for maintaining genetic connectivity among fragmented Cycas populations, particularly for geographically adjacent populations with reduced natural gene exchange. Measures such as assisted pollination, habitat corridor restoration, and controlled germplasm exchange may help alleviate the loss of genetic diversity caused by genetic drift and long-term isolation. However, the implementation of such strategies should take into account species-specific reproductive biology, flowering synchrony, and the potential risk of outbreeding depression.
For populations that may face a higher risk of genetic drift and have relatively low genetic diversity—particularly the C. guizhouensis population, as well as the C. dolichophylla CAY-QH, C. debaoensis DB-SP, and C. ferruginea XM-ZD populations—natural regeneration should be appropriately promoted on the basis of strengthened in situ conservation to maintain or increase effective population size. For isolated populations with low seed-setting rates, artificial assisted pollination and moderate gene flow between geographically adjacent populations may help enhance gene flow, thereby mitigating the decline in genetic diversity caused by genetic drift. In addition, measures such as ex situ conservation, germplasm preservation, and long-term genetic monitoring should be implemented to maximize the preservation of genetic variation and provide a genetic foundation for future adaptive studies. It should also be noted that genetic risks in ex situ conservation may seriously affect the reintroduction and restoration of rare and endangered plant species. Therefore, genetic management should be emphasized during introduction and conservation practices to minimize or avoid potential genetic risks associated with ex situ conservation [57].
The results of this study indicate that genetic diversity of Cycas species in Guangxi varies significantly among species. The ranking of genetic diversity is as follows: C. sexseminifera > C. dolichophylla > C. bifida > C. debaoensis > C. balansae > C. segmentifida > C. ferruginea > C. guizhouensis. Among them, C. sexseminifera exhibited the highest genetic diversity (I = 0.824, He = 0.443), whereas C. guizhouensis showed the lowest (I = 0.446, He = 0.293). In addition, C. guizhouensis displayed clear genetic isolation from other species, while the remaining seven Cycas species showed relatively strong gene exchange among each other. The IBD test indicated that geographic isolation is not the primary factor driving genetic differentiation in Cycas. In future studies of Cycas species in southwestern China, higher-resolution genomic approaches should be employed to achieve a more refined characterization of genetic structure among different species and populations, as well as to further assess potential gene flow, historical hybridization, and lineage divergence processes. At the same time, long-term field monitoring data should be integrated to systematically evaluate the effects of habitat fragmentation, population regeneration capacity, and anthropogenic disturbance on genetic patterns. Such efforts will facilitate the development of conservation and management strategies that balance the maintenance of genetic diversity with population recovery, thereby providing a stronger theoretical foundation for the scientific conservation and sustainable utilization of Cycas resources in southwestern China.

Supplementary Materials

The following supporting information can be downloaded at: https://www.mdpi.com/article/10.3390/d18060340/s1. Table S1. Collecting information from a total of 41 populations of 8 wild Cycas plants; Table S2 Genetic diversity between populations.

Author Contributions

J.T.: Conceptualization, Methodology, Software, Writing—original draft, and Writing—review & editing. X.L.: Conceptualization, Methodology, Software, Writing—original draft. G.H. and Z.D.: Investigation, Data curation and Supervision. R.Z.: Investigation, Data curation and Formal analysis. L.L.: Investigation, Data curation and Formal analysis. Y.J.: Data curation and Supervision. T.C.: Data curation and Supervision. Y.L.: Investigation and Supervision. Z.W.: Investigation and Supervision. T.D.: Conceptualization, Funding acquisition, Supervision, and Writing—review & editing. X.W.: Conceptualization, Funding acquisition, Investigation, Supervision, and Writing—review & editing. All authors have read and agreed to the published version of the manuscript.

Funding

This work was supported by the National Natural Science Foundation of China (Grant No. 32560330), the Guangxi Natural Science Foundation (Grant Nos. 2020GXNSFAA259029 and 2024GXNSFAA010452), the Business Expense Fund of the Guangxi Institute of Botany (Project No. Gui Zhi Ye 2500-2/8/9), the National Key Research and Development Program (No. 2022YFF1300703), the Chinese Academy of Sciences “Light of West China” Program (2022), the Guangxi Forestry Science and Technology Promotion Demonstration Project (Grant Nos. 2024GLKX10, 2023LYKJ03, [2022]GT23), the Guangxi Key Laboratory of Plant Functional Phytochemicals Research and Sustainable Utilization (No. ZRJJ2024-3/4/11), and the Hechi Science and Technology Foundation and Talent Project (Heke AC231113).

Institutional Review Board Statement

Not applicable.

Informed Consent Statement

Not applicable.

Data Availability Statement

The original contributions presented in this study are included in the article/Supplementary Material. Further inquiries can be directed to the corresponding authors.

Acknowledgments

We are extremely grateful to Shengyuan Liu and Fanan Wei for the sampling support and assistance in the field. We also thank Shengfeng Chai for assistance in the laboratory and Xiao Wei for helpful discussions and suggestions during data analyses.

Conflicts of Interest

The authors declare no conflicts of interest.

References

  1. Treutlein, J.; Wink, M. Molecular Phylogeny of Cycads Inferred from rbcL Sequences. Naturwissenschaften 2002, 89, 221–225. [Google Scholar] [CrossRef] [Scilit]
  2. Schneider, D.; Wink, M.; Sporer, F.; Lounibos, P. Cycads: Their Evolution, Toxins, Herbivores and Insect Pollinators. Naturwissenschaften 2002, 89, 281–294. [Google Scholar] [CrossRef] [Scilit] [PubMed]
  3. Peter, H.R.; Ray, F.E.; Susan, E.E. Biology of Plants, 7th ed.; Macmillan: New York, NY, USA, 2005. [Google Scholar]
  4. Osborne, R. The World Cycad Census and a Proposed Revision of the Threatened Species Status for Cycad Taxa. Biol. Conserv. 1995, 71, 1–12. [Google Scholar] [CrossRef] [Scilit]
  5. Liu, Y.J.; Huang, Y.L.; Xu, Y.; Fu, J.Y. Research Progress on the Chemical Constituents and Active Constituents of Cycas revoluta Thunb. Chin. Pharm. J. 2020, 55, 1492–1498. [Google Scholar] [CrossRef]
  6. Moawad, A.; Hetta, M.; Zjawiony, J.K.; Jacob, M.R.; Hifnawy, M.; Marais, J.P.J.; Ferreira, D. Phytochemical Investigation of Cycas Circinalis and Cycas Revoluta Leaflets: Moderately Active Antibacterial Biflavonoids. Planta Med. 2010, 76, 796–802. [Google Scholar] [CrossRef] [Scilit]
  7. Yao, Z.; Guo, J.; Jin, C.Z.; Liu, Y.B. Endangered Mechanisms of Wild Plant Populations Included in China’s First-Class Protection List. Biodiversity 2021, 29, 394–408. [Google Scholar] [CrossRef] [Scilit]
  8. Xi, H.H.; Wang, Y.Q.; Pan, Y.Z.; Xu, T.; Zhan, Q.Q.; Liu, J.; Feng, X.Y.; Gong, X. The Resources and Conservation of Cycas Species in China. Biodiversity 2022, 30, 73–85. [Google Scholar] [CrossRef] [Scilit]
  9. Tang, J.M.; Wei, X.; Chai, S.F.; Zou, R.; Ding, T.; Wu, L.F.; Deng, L.L. Guangxi National Key Protected Wild Plants; China Forestry Publishing House: Beijing, China, 2023; pp. 340–375. [Google Scholar]
  10. Yang, Y. Endangered mechanisms for the first-class protected Wild Plants with Extremely Small Populations in China. Biodiversity 2021, 29, 1599–1606. [Google Scholar] [CrossRef] [Scilit]
  11. Zhang, G.G.; Li, D.Q.; Luo, B.; Chen, D.W.; He, T.P.; Peng, D.R.; Wen, X.F.; Chen, B.Z. Wild Cycas resources and their conservation in Baise, Guangxi. Guangxi Agric. Biol. Sci. 2008, 27, 230–234. [Google Scholar]
  12. Zheng, Y.; Liu, J.; Feng, X.Y.; Gong, X. The Distribution, Diversity, and Conservation Status of Cycas in China. Ecol. Evol. 2017, 7, 3212–3224. [Google Scholar] [CrossRef] [Scilit] [PubMed]
  13. Tang, J.M.; Li, D.X.; Wei, X.; Zou, R.; Xu, T. Conservation and Utilization of Cycadaceae Species in South China; China Forestry Publishing House: Beijing, China, 2024. [Google Scholar]
  14. Su, Z.H.; Richardson, B.A.; Zhuo, L.; Jiang, X.L.; Li, W.J.; Kang, X.S. Genetic Diversity and Structure of an Endangered Desert Shrub and the Implications for Conservation. AoB Plants 2017, 9, plx016. [Google Scholar] [CrossRef] [Scilit] [PubMed]
  15. Hayden, M.J.; Sharp, P.J. Targeted Development of Informative Microsatellite (SSR) Markers. Nucleic Acids Res. 2001, 29, e44. [Google Scholar] [CrossRef] [Scilit] [PubMed]
  16. Antanynienė, R.; Šikšnianienė, J.B.; Stanys, V.; Frercks, B. Fingerprinting of Plum (Prunus Domestica) Genotypes in Lithuania Using SSR Markers. Plants 2023, 12, 1538. [Google Scholar] [CrossRef] [Scilit]
  17. Itoo, H.; Shah, R.A.; Qurat, S.; Jeelani, A.; Khursheed, S.; Bhat, Z.A.; Mir, M.A.; Rather, G.H.; Zargar, S.M.; Shah, M.D.; et al. Genome-Wide Characterization and Development of SSR Markers for Genetic Diversity Analysis in Northwestern Himalayas Walnut (Juglans regia L.). 3 Biotech. 2023, 13, 136. [Google Scholar] [CrossRef] [Scilit] [PubMed]
  18. Fu, R.K.; Qi, H.S.; Liang, D.M.; Liu, Y.; Chen, X.; Quan, B.; Yang, J. Analysis of Genetic Diversity of Endangered Species Cycas hainanensis Populations Based on Fluorescent SSR Markers. China Wild Plant Resour. 2025, 44, 71–77. [Google Scholar] [CrossRef]
  19. Qin, H.Z.; Yang, X.D.; Tang, J.M.; Zou, R.; Zhu, C.H.; Wei, X.; Jiang, Y.S.; Xiong, Z.C.; Tang, F.L. Establishment of SSR and ISSR Reaction Systems and Primer Screening in Minimal Populations Wild Plant Cycas shiwandashanica. Mol. Plant Breed. 2022, 20, 2689–2698. [Google Scholar] [CrossRef]
  20. Wang, Y.H.; Li, N.; Chen, T.; Deng, H.X. Screening of microsatellite loci by cross-species amplification and their use in Cycas fairylakea (Cyeadaceae). Guangxi Plants 2014, 34, 608–613. [Google Scholar]
  21. Feng, X.Y.; Zheng, Y.; Gong, X. Middle-Upper Pleistocene Climate Changes Shaped the Divergence and Demography of Cycas Guizhouensis (Cycadaceae): Evidence from DNA Sequences and Microsatellite Markers. Sci. Rep. 2016, 6, 27368. [Google Scholar] [CrossRef] [Scilit]
  22. Feng, X.Y.; Liu, J.; Chiang, Y.C.; Gong, X. Investigating the Genetic Diversity, Population Differentiation and Population Dynamics of Cycas Segmentifida (Cycadaceae) Endemic to Southwest China by Multiple Molecular Markers. Front. Plant Sci. 2017, 8, 839. [Google Scholar] [CrossRef] [Scilit]
  23. Feng, X.Y.; Gong, Y.Q.; Nguyen, K.S.; Nguyen, H.T.; Liu, Y.B.; Liu, J.; Gong, X. Speciation and Conservation Genetic Assessment of Two Endangered Cycad Species. J. Syst. Evol. 2024, 62, 739–757. [Google Scholar] [CrossRef] [Scilit]
  24. Zheng, Y.; Liu, J.; Gong, X. Tectonic and Climatic Impacts on the Biota within the Red River Fault, Evidence from Phylogeography of Cycas dolichophylla (Cycadaceae). Sci. Rep. 2016, 6, 33540. [Google Scholar] [CrossRef] [Scilit] [PubMed]
  25. Leigh, D.M.; Hendry, A.P.; Vázquez-Domínguez, E.; Friesen, V.L. Estimated Six per Cent Loss of Genetic Variation in Wild Populations since the Industrial Revolution. Evol. Appl. 2019, 12, 1505. [Google Scholar] [CrossRef] [Scilit] [PubMed]
  26. He, Z.Z.; Shao, W.W.; Honnay, O.; Liao, H.; Chen, H.; Liu, J.; Dong, S.-S.; Li, D.; Fan, G.-Z.; Zhao, Y.; et al. Temporal Dynamics of Genetic Diversity in Protected and Unprotected Wild Rice (Oryza Rufipogon) Populations: Implications for Conservation. Mol. Ecol. 2025, 34, e17750. [Google Scholar] [CrossRef] [Scilit] [PubMed]
  27. Xiao, L.-Q.; Ge, X.-J.; Gong, X.; Hao, G.; Zheng, S.-X. ISSR Variation in the Endemic and Endangered Plant Cycas Guizhouensis (Cycadaceae). Ann. Bot. 2004, 94, 133–138. [Google Scholar] [CrossRef] [Scilit]
  28. Cibrián-Jaramillo, A.; Marler, T.E.; DeSalle, R.; Brenner, E.D. Development of EST-Microsatellites from the Cycad Cycas Rumphii, and Their Use in the Recently Endangered Cycas micronesica. Conserv. Genet. 2008, 9, 1051–1054. [Google Scholar] [CrossRef] [Scilit]
  29. Wang, Z.-F.; Ye, W.-H.; Cao, H.-L.; Li, Z.-C.; Peng, S.-L. Identification and Characterization of EST-SSRs and cpSSRs in Endangered Cycas hainanensis. Conserv. Genet. 2008, 9, 1079–1081. [Google Scholar] [CrossRef] [Scilit]
  30. Yang, Y.; Li, Y.; Li, L.-F.; Ge, X.-J.; Gong, X. Isolation and Characterization of Microsatellite Markers for Cycas debaoensis Y. C. Zhong et C. J. Chen (Cycadaceae). Mol. Ecol. Resour. 2008, 8, 913–915. [Google Scholar] [CrossRef] [Scilit]
  31. Tang, J.M.; Zou, R.; Wei, X.; Li, D.P.; Ishimaru, K. Genetic Diversity and Genetic Structure of the Rare and Endangered Relict Plant Cycas shiwandashanica. Appl. Ecol. Environ. Res. 2023, 21, 3521–3531. [Google Scholar] [CrossRef] [Scilit]
  32. Schuelke, M. An Economic Method for the Fluorescent Labeling of PCR Fragments. Nat. Biotechnol. 2000, 18, 233–234. [Google Scholar] [CrossRef] [Scilit]
  33. Shershov, V.E.; Lapa, S.A.; Kuznetsova, V.E.; Spitsyn, M.A.; Guseinov, T.O.; Polyakov, S.A.; Stomahin, A.A.; Zasedatelev, A.S.; Chudinov, A.V. Comparative Study of Novel Fluorescent Cyanine Nucleotides: Hybridization Analysis of Labeled PCR Products Using a Biochip. J. Fluoresc. 2017, 27, 2001–2016. [Google Scholar] [CrossRef] [Scilit]
  34. Wright, S. Evolution in Mendelian Populations. Genetics 1931, 16, 97–159. [Google Scholar] [CrossRef] [Scilit]
  35. Funk, W.C.; McKay, J.K.; Hohenlohe, P.A.; Allendorf, F.W. Harnessing Genomics for Delineating Conservation Units. Trends Ecol. Evol. 2012, 27, 489–496. [Google Scholar] [CrossRef] [Scilit] [PubMed]
  36. Singh, K.H.; Singh, L.; Parmar, N.; Kumar, S.; Nanjundan, J.; Singh, G.; Thakur, A.K. Molecular Characterization and Genetic Diversity Analysis in Indian Mustard (Brassica juncea L. Czern & Coss.) Varieties Using SSR Markers. PLoS ONE 2022, 17, e0272914. [Google Scholar] [CrossRef] [Scilit]
  37. Wu, Q.C.; Zang, F.Q.; Ma, Y.; Zheng, Y.Q.; Zang, D.K. Analysis of Genetic Diversity and Population Structure in Endangered Populus wulianensis Based on 18 Newly Developed EST-SSR Markers. Glob. Ecol. Conserv. 2020, 24, e01329. [Google Scholar] [CrossRef] [Scilit]
  38. Fu, Y.Y.; Li, S.Y.; Ma, B.Y.; Liu, C.L.; Qi, Y.K.; Pang, C.H. Genetic Diversity Analysis and Core Collection Construction of Ancient Sophora japonica L. Using SSR Markers. Int. J. Mol. Sci. 2024, 25, 12776. [Google Scholar] [CrossRef] [Scilit] [PubMed]
  39. Cidón, C.F.; Turchetto-Zolet, A.C.; Bajay, M.M.; Zucchi, M.I.; Konzen, E.R. Phenotypic and Molecular Basis for Genetic Variation in Jelly Palms (Butia Sp.): Where Are We Now and Where Are We Headed To? Genet. Mol. Biol. 2023, 46, e20230145. [Google Scholar] [CrossRef] [Scilit]
  40. Gong, Y.Q.; Zhan, Q.Q.; Nguyen, K.S.; Nguyen, H.T.; Wang, Y.H.; Gong, X. The Historical Demography and Genetic Variation of the Endangered Cycas multipinnata (Cycadaceae) in the Red River Region, Examined by Chloroplast DNA Sequences and Microsatellite Markers. PLoS ONE 2015, 10, e0117719. [Google Scholar] [CrossRef] [Scilit]
  41. Wu, L.X.; Xu, H.Y.; Jian, S.G.; Gong, X.; Feng, X.Y. Geographic Factors and Climatic Fluctuation Drive the Genetic Structure and Demographic History of Cycas taiwaniana (Cycadaceae), an Endemic Endangered Species to Hainan Island in China. Ecol. Evol. 2022, 12, e9508. [Google Scholar] [CrossRef] [Scilit] [PubMed]
  42. Charlesworth, D.; Willis, J.H. The Genetics of Inbreeding Depression. Nat. Rev. Genet. 2009, 10, 783–796. [Google Scholar] [CrossRef] [Scilit]
  43. Gao, Q.-B.; Li, Y.; Gengji, Z.-M.; Gornall, R.J.; Wang, J.-L.; Liu, H.-R.; Jia, L.-K.; Chen, S.-L. Population Genetic Differentiation and Taxonomy of Three Closely Related Species of Saxifraga (Saxifragaceae) from Southern Tibet and the Hengduan Mountains. Front. Plant Sci. 2017, 8, 1325. [Google Scholar] [CrossRef] [Scilit] [PubMed]
  44. Wang, M.C.; Zhang, L.; Zhang, Z.Y.; Li, M.M.; Wang, D.Y.; Zhang, X.; Xi, Z.X.; Keefover-Ring, K.; Smart, L.B.; DiFazio, S.P.; et al. Phylogenomics of the Genus Populus Reveals Extensive Interspecific Gene Flow and Balancing Selection. New Phytol. 2020, 225, 1370–1382. [Google Scholar] [CrossRef] [Scilit]
  45. Petit, R.J.; Excoffier, L. Gene Flow and Species Delimitation. Trends Ecol. Evol. 2009, 24, 386–393. [Google Scholar] [CrossRef] [Scilit] [PubMed]
  46. Lenormand, T. Gene Flow and the Limits to Natural Selection. Trends Ecol. Evol. 2002, 17, 183–189. [Google Scholar] [CrossRef] [Scilit]
  47. Ma, Y.Z.; Wang, J.; Hu, Q.J.; Li, J.L.; Sun, Y.S.; Zhang, L.; Abbott, R.J.; Liu, J.Q.; Mao, K.S. Ancient Introgression Drives Adaptation to Cooler and Drier Mountain Habitats in a Cypress Species Complex. Commun. Biol. 2019, 2, 213. [Google Scholar] [CrossRef] [Scilit] [PubMed]
  48. Chang, J.T.; Nakamura, K.; Chao, C.E.T.; Luo, M.X.; Liao, P.C. Ghost Introgression Facilitates Genomic Divergence of a Sympatric Cryptic Lineage in Cycas revoluta. Ecol. Evol. 2023, 13, e10435. [Google Scholar] [CrossRef] [Scilit]
  49. Muir, G.; Schlötterer, C. Evidence for Shared Ancestral Polymorphism Rather than Recurrent Gene Flow at Microsatellite Loci Differentiating Two Hybridizing Oaks (Quercus Spp.). Mol. Ecol. 2005, 14, 549–561. [Google Scholar] [CrossRef] [Scilit] [PubMed]
  50. Bijlsma, R.; Loeschcke, V. Genetic Erosion Impedes Adaptive Responses to Stressful Environments. Evol. Appl. 2012, 5, 117–129. [Google Scholar] [CrossRef] [Scilit]
  51. Wang, I.J.; Bradburd, G.S. Isolation by Environment. Mol. Ecol. 2014, 23, 5649–5662. [Google Scholar] [CrossRef] [Scilit] [PubMed]
  52. Bradburd, G.S.; Ralph, P.L.; Coop, G.M. Disentangling the Effects of Geographic and Ecological Isolation on Genetic Differentiation. Evolution 2013, 67, 3258–3273. [Google Scholar] [CrossRef] [Scilit]
  53. Liu, H.J.; Wang, Z.; Zhang, Y.L.; Li, M.H.; Wang, T.; Su, Y.J. Geographic Isolation and Environmental Heterogeneity Contribute to Genetic Differentiation in Ephalotaxus oliveri. Ecol. Evol. 2023, 13, e9869. [Google Scholar] [CrossRef] [Scilit]
  54. Tamaki, I.; Setsuko, S.; Tomaru, N. Genetic Variation and Differentiation in Populations of a Threatened Tree, Magnolia stellata: Factors Influencing the Level of within-Population Genetic Variation. Heredity 2008, 100, 415–423. [Google Scholar] [CrossRef] [Scilit] [PubMed]
  55. Yan, Z.Z.; Wu, F.; Luo, K.; Zhao, Y.F.; Yan, Q.; Zhang, Y.F.; Wang, Y.R.; Zhang, J.Y. Cross-Species Transferability of EST-SSR Markers Developed from the Transcriptome of Melilotus and Their Application to Population Genetics Research. Sci. Rep. 2017, 7, 17959. [Google Scholar] [CrossRef] [Scilit] [PubMed]
  56. Feng, C.; Zhang, J.; Huang, H.W. Parallel situ conservation: A new plant conservation strategy to integrate in situ and ex situ conservation of plants. Biodivers. Sci. 2023, 31, 23184. [Google Scholar] [CrossRef] [Scilit]
  57. Kang, M.; Ye, Q.; Huang, H. Genetic Risks in Plant Ex Situ Conservation. Heredity 2005, 27, 160–166. [Google Scholar] [CrossRef]
Figure 1. Biological characteristics, populations and geographic locations of 8 Cycas species in Guangxi.
Diversity 18 00340 g001
Figure 2. Results of hierarchical AMOVA testing from the populations. Pie charts at the sampling sites of each species show the proportion of genetic variation estimated by AMOVA, including within individuals, among individuals within populations, and among populations, with the percentage of each component indicated on the charts.
Diversity 18 00340 g002
Figure 3. Pairwise genetic differentiation (Fst, upper triangle) and gene flow (Nm, lower triangle) among Cycas species.
Diversity 18 00340 g003
Figure 4. Structure and clustering analyses of Cycas. (A) Variation in K values inferred using the ΔK method implemented in the STRUCTURE 2.3.4. software; (B) Q-matrix stability under different K values; (C) STRUCTURE analysis at K = 16, where different colors represent different genetic components; (D) STRUCTURE analysis at K = 3, where different colors represent different genetic components.
Diversity 18 00340 g004
Figure 5. Principal Coordinates Analysis (PCoA).
Diversity 18 00340 g005
Figure 6. Circular dendrogram of UPGMA clustering based on Nei’s genetic distance.
Diversity 18 00340 g006
Table 1. Six pairs of primer information.
Primer No.Repeat UnitForward PrimerReverse PrimerAllelic Interval
GZST002(GA)6TGTGGAACGTGGAATGGTAAAGGAATCCCGAAGGAAGAAA158–160
GZST019(ATAA)5GATGAGGAAGCCTACGCAGTGAAAGACCTCACCATCCGAG212–221
GZST055(AT)6TCATGAAGATGGCAACCAACTCCCTTCCAAGCAAATGTCT161–184
GZST013(GAG)5ACCGGTCGACTAGATGGATGAGGTCCGAAGCTTTCCTCTC252–265
GZST088(AG)7TGGCTTTCGATTTCCACACTGAACGCTCGCTCTCTCTCTC136–159
GZST065(CGA)5GCTTGGCTGTACCGTTCTTTCGCCATTGACAACAACAGAC157–174
Table 2. Polymorphism of 6 pairs SSR primers.
LocusNaNeIHoHeFPICSignif
GZST00263.4721.3760.0050.7120.9930.661***
GZST01331.4030.5510.330.287−0.1470.266***
GZST01991.6970.8030.4640.411−0.1310.368***
GZST055172.8041.4820.430.6430.3310.606***
GZST065103.821.5470.5370.7380.2720.697***
GZST088135.4881.9780.5630.8180.3120.797***
Mean9.66673.11401.28950.38820.60150.27170.5658 -
St Dev4.9666 1.50290.52290.20510.20720.4154--
Note: Na, observed number of alleles; Ne, effective number of alleles; I, Shannon’s information index; Ho, observed heterozygosity; He, expected heterozygosity; F, fixation index; PIC, polymorphism information content; Signif, significance test for deviation from Hardy–Weinberg equilibrium (HWE). *** p < 0.001.
Table 3. Inbreeding coefficients and gene flow of 6 primer pairs.
LocusFisFitFstNm
GZST0020.9850.9920.4280.335
GZST013−0.418−0.1550.1861.095
GZST019−0.351−0.0920.1921.054
GZST0550.3070.3890.1181.864
GZST0650.1240.2650.1611.305
GZST0880.1500.3510.2360.808
Mean0.1330.2920.2201.077
Note: Fis denotes the inbreeding coefficient within populations; Fit represents the overall inbreeding coefficient; Fst refers to the genetic differentiation coefficient; Nm indicates gene flow, calculated as Nm = 0.25 (1 − Fst)/Fst.
Table 4. Molecular Analysis of Variance (AMOVA).
SourcedfSSMSEst. Var.%
Among Pops7465.47566.4960.41122%
Among Indiv6321160.9461.8370.34918%
Within Indiv640729.5001.1401.14060%
Total12792355.921——1.899100%
Source: df, degrees of freedom; SS, sum of squares; MS, mean squares; Est. Var., estimated variance; %, proportion of variation; Among Pops, variation among populations; Among Indiv, variation among individuals; Within Indiv, variation within individuals. Variation within individuals arises from heterozygous alleles, and its magnitude depends on the number of heterozygous loci per individual, providing a measure of the individual’s genetic diversity.
Disclaimer/Publisher’s Note: The statements, opinions and data contained in all publications are solely those of the individual author(s) and contributor(s) and not of MDPI and/or the editor(s). MDPI and/or the editor(s) disclaim responsibility for any injury to people or property resulting from any ideas, methods, instructions or products referred to in the content.