Article

Plant Species Diversity and Dominant Plant Functional Types Control Productivity in a Reclaimed Mineland Prairie


1
School of Environment and Natural Resources, The Ohio State University, Columbus, OH 43210, USA
2
Richland County Park District, Mansfield, OH 44907, USA
3
Root & Spiral, Cleveland, OH 44094, USA
4
Department of Agriculture, Falkland Islands Government, Stanley FIQQ 1ZZ, Falkland Islands
*
Author to whom correspondence should be addressed.
Diversity 2026, 18(2), 101; https://doi.org/10.3390/d18020101
Submission received: 17 September 2024 / Revised: 31 July 2025 / Accepted: 31 July 2025 / Published: 6 February 2026
(This article belongs to the Section Plant Diversity)

Abstract

Tallgrass prairie ecosystems in North America sustain globally important plant and animal biodiversity while providing ecosystem services, including biomass production, forage for livestock, and carbon sequestration. Land use change has left less than 1% of North American prairies intact, and opportunities are needed for their restoration. There has been increasing interest in the establishment of prairies on degraded former minelands, where significant challenges exist in reestablishing historic vegetation communities. We examined how the productivity and diversity of mineland prairies were influenced by varying restoration treatments that had been applied nearly a decade previously. We utilized an existing prairie research plot network established using seed mixes containing from one to seven different species and differing fertilization and tillage treatments. We calibrated a non-destructive method to assess prairie biomass and used it to assess the productivity and diversity across 312 research plots. The results showed that, with the exception of C4 grasses, few originally seeded species were present. Significant differences in species richness existed as a function of the interacting effects of seed mix type and fertilization treatment. Unfertilized plots generally had a higher species richness, particularly where larger numbers of species were included in the mixes. Prairie biomass was significantly greater in seed mixes containing big bluestem (Andropogon gerardii) and was also significantly related to Shannon diversity. Our results suggest that the establishment of (Andropogon gerardii) is fundamental to maximizing the diversity and productivity of mineland prairies, especially in the absence of follow-up management. The results also suggest that caution should be exercised when considering the use of fertilizer, as this may reduce the diversity of native species by favoring competitive non-native species such as some C3 grasses.

1. Introduction

Restoring and assessing the diversity and productivity of grassland plant communities is critical, as they are closely linked to the delivery of key ecosystem services, as well as overall biodiversity. Tallgrass prairie ecosystems have severely declined in extent, primarily due to the conversion of land for agriculture [1,2]. In North America, less than 1% of tallgrass prairies remain [1], making the restoration of these native grasslands critical. Tallgrass prairies provide habitats for native birds, wildlife, and insects [3,4]. The deep rooting systems of native grass species enhance hydrologic function above and below ground [4], prevent soil erosion, support soil aggregation [3], and can sequester carbon [3,5]. Grassland restoration goals vary widely from restoring community assemblages that reflect native prairie ecosystems [6] to establishing native grasslands on degraded lands for biofuel production [5]. Prairies can also be used to initiate succession and improve function on sites that are so heavily degraded that the historical ecotype is no longer viable under the current conditions [7]. Prairie restoration often aims to enhance diversity across a site because diverse plant communities are expected to be more resilient in the face of disturbance, more resistant to invasion, and generally more stable over time [8].
Although diversity is generally accepted to have a positive effect on ecosystem function [9], there is ongoing debate around the relationships at play between plant diversity and productivity in restored prairie ecosystems. Currently, two broad opinions underpin the discussion. The first states that increased plant diversity leads to higher productivity [10,11,12]. This could be explained by niche complementarity, which results from the variation in resource requirements within a mix of species [10]. Compared to a monoculture, a polyculture is expected to capitalize on resources more effectively, ultimately allowing the diverse stand to be more productive. In long-term prairie restoration projects, seeding with a variety of species leads to higher productivity and diversity [6,10]. A review of more than 40 grassland experiments found that a mixture of species achieved higher productivity than the average of species monocultures 79% of the time [12]. In long-term studies, high-diversity plots have also been shown to be more productive than the best-performing monoculture [10].
The effect of plant diversity was historically thought to only contribute minor benefits to above-ground productivity [13]. It has, thus, been hypothesized that diversity’s effects on productivity are weak, and productivity is driven more by the presence of dominant, highly productive species. The mass ratio hypothesis [13] states that even in species-rich vegetation, a small number of dominant species contribute most of the plant biomass, and, therefore, these species likely drive ecosystem function more so than less dominant species [13,14,15]. Finally, selection effects (also referred to as “sampling effects”) state that any positive influence of diversity on productivity can primarily be attributed to the increased likelihood of one or more dominant, highly productive species being present in diverse vegetation plots [11]. In prairie ecosystems, the dominant species are often perennial C4 grasses. Biomass production has been found to increase as perennial grass abundance increases [15]. At the same time, species richness and functional richness have been shown to decrease as perennial grass abundance increases [15]. Although some studies have shown evidence for transgressive overyielding [10], others have found that a few polycultures of grassland species were able to produce more biomass than the most productive species of that polyculture grown in monoculture [12]. Additionally, where high productivity is a result of the dominance of non-native invasive species, there can be significant impacts on plant community diversity and richness [16].
Such debates, as well as the broad uncertainty about productivity–diversity relationships, can have significant application implications. This is particularly the case in the context of grassland restoration, where the existing vegetation and soil seedbanks can impact native vegetation establishment and survivorship [17]. Establishing native species on degraded lands experiencing highly altered biotic and abiotic conditions can be particularly challenging. Areas of the mid-western United States formerly subjected to surface mining are a good example. Although the mineland reclamation requirements introduced in the 1970s aimed to improve water quality, soil pH, and soil stability, the vegetation established often created grasslands dominated by non-native, cool-season grasses in areas that were previously forested [18]. Surface mine reclamation policies also required topography to be restored (to an extent), and many sites were heavily compacted during the regrading process, making reforestation difficult to achieve [17]. Planting tallgrass prairie on these mine sites may yield a range of ecological benefits, as it contributes to native plant conservation [7] and can provide other ecosystem benefits such as improved wildlife and pollinator habitats [19,20], carbon sequestration [21], and soil health [22]. Site treatments including tillage, herbicide application, and fertilization are common ways to prepare reclaimed mine sites for prairie restoration seeding [23].
Choices made during restoration can lead to trade-offs between varying ecological goals such as balancing the extent to which treatments enhance biodiversity versus productivity. Native C4 grasses like big bluestem (Andropogon gerardii), switchgrass (Panicum virgatum), and Indian grass (Sorghastrum nutans) can often become dominant during restoration projects, and big bluestem has been shown to perform particularly strongly in degraded soils [24]. Along with certain dominant forbs such as yellow coneflower (Ratibida pinnata) and prairie dock (Silphium terebinthinaceum), many prairie plants are thought to have a wide range of ecological tolerances, allowing them to establish across environmental gradients [25]. They are also better suited to compete with existing weedy species [25]. However, competitive C4 grasses can also compete with desirable, native forb species included in seed mixes and become highly dominant—one or two species can account for 40 to 80% of vegetation cover in prairies [7,25,26]. As a result, even plots seeded with a mix of species could eventually become mostly homogenous stands of warm-season grasses [6,23,25], especially without regular disturbance. In remnant tallgrass prairies, forbs are the most diverse group of plants. In parts of the remnant Konza in Kansas, forbs can constitute 60% of the plant species [27]. A lack of forb establishment, repeatedly observed in different restoration projects, may be one reason why managed prairie ecosystems inherently lack structural diversity compared to remnant prairies [25,27].
Developing a better understanding of the diversity–productivity relationships in restored grassland ecosystems will not only address ongoing ecological debates, but will also provide practical information to guide management decisions. Our overarching aim was, thus, to understand the relationships between plant diversity and productivity, and the effects of restoration treatments on both, across an unmanaged eight-year-old prairie reclamation experiment. Our specific objectives were to (i) calibrate a non-destructive method to estimate prairie biomass; (ii) quantify variations in diversity and biomass in relation to historic restoration treatments, including varying seed mix, fertilization, and tillage applications; and (iii) evaluate the evidence for diversity and composition effects on plot-level productivity.

2. Materials and Methods

Species nomenclature and trait information follow the USDA Plants Database [28].

2.1. Site Description

The study site consisted of a ca. 8 hectare experimental prairie reclamation experiment at the Wilds, Ohio (39.829° N, 81.7374° W). The Wilds is a private, non-profit conservation center located on >4000 hectares of reclaimed mineland in southeastern Ohio. Historical vegetation at the site would have consisted primarily of mixed mesophytic hardwood forests. The site is within the unglaciated, dissected Allegheny Plateau, with underlying bedrock consisting mainly of sandstone, siltstone, clay shale, and limestone, all derived from the Mississippian, Pennsylvanian, and Early Permian periods [29,30]. The original soil at the site was classified as Morristown series (typically loamy skeletal, mixed, active, calcareous, mesic Typic Udorthents) [30]. The reclaimed soil consists of an approximately 20 cm surface layer of alkaline silty clay loam overburden [18,30]. The site exhibits a mean summer temperature of 22.5 °C and mean summer precipitation of 284.5 mm, and a mean winter temperature of 11.3 °C with mean winter precipitation of 196.6 mm [31]. The site was surface-mined for coal for a period of about 40 years up until the 1980s. Reclamation practices varied dramatically across the area occupied by the Wilds due to significant changes in state and federal surface mining reclamation requirements throughout the time that mining was in operation. The area of our study was regraded and re-vegetated following the requirements of the Surface Mining Control Act (SMCRA, 1977) [18]. Similarly to many reclaimed minelands, the regrading of our study site has resulted in heavily compacted soils of a generally poor quality [7]. According to reclamation records, the herbaceous species seeded included bird’s-foot trefoil (Lotus corniculatus), tall fescue (Schedonorus arundinaceus), alfalfa (Medicago sativa), red clover (Trifolium pratense), rye grass (Lolium perenne), Kentucky blue grass (Poa pratensis), and Chinese lespedeza (Lespedeza cuneata) [18].

2.2. Experimental Design

We utilized a pre-existing, long-term prairie reclamation experiment established in 2008. The goal of the original experiment was to evaluate the potential of reclaimed minelands to produce biomass feedstocks and sequester carbon. There was, thus, a strong emphasis on identifying treatments that maximized productivity. For the experiment, approximately 8 hectares was delineated into 11 blocks. Each block was further divided so that a total of 312 experimental plots were created across the site (Figure S1). Each plot measured 15 × 20 m. Within each block, half of the plots were tilled, and the other half were tilled and deep ripped (subsoiled and disked). Six seeding treatments were applied within each block. Four of these treatments were single-species seedings and two were seed mixes (Table 1). The seed treatments were applied at a density of 430–500 seeds m−2. Five full blocks were selected at random to be fertilized and received a single application of di-ammonium phosphate at 112 kg ha−1. The site received no further fertilizer applications or other management or monitoring prior to the point that vegetation surveys were completed in 2016. A summary of the replication within each treatment combination is provided in Table S1.

2.3. Field Data Collection

All 322 plots were monitored to determine vegetation structure, composition, and diversity [32]. Monitoring was completed between July and September 2016. Two 14 m point-intercept transects were run down the length of each plot. The transects were set 10 m apart from each other and 5 m from the edge of the plot. An abbreviated version of the FuelRule methodology [33] was used to collect vegetation structure and composition data. The FuelRule methodology provides a simple, quick, and non-destructive way of measuring structure and above-ground biomass in the field. The FuelRule, a 2 m tall stick with alternating white and yellow bands marked every 10 cm, was inserted vertically into the vegetation every 1 m along the length of the transect (Figure S2). All species directly touching the stick were recorded. Basic structural measures, including the tallest band fully obscured by vegetation, the tallest band partially obscured, and the maximum height of vegetation touching the stick, were also recorded. Species cover per plot was calculated based on the number of times the species was recorded touching the FuelRule over the total possible number of occurrences (n = 28). The point-intercept data was supplemented with a 10-min constant-effort walk around survey [30]. This walk around accounted for less frequent species found within the plot but not intersected along the transects. Such species were assigned a cover of 1%.
Biomass samples were collected between September and October of 2021 when the biomass of the prairie species was expected to be at its peak. In the field, a 1 m2 quadrat was placed within a stratified randomly selected set of thirty plots chosen to represent the range of plant community types defined by [32]. Within each quadrat, vegetation structural characteristics were measured using the full “FuelRule” methodology, with nine readings per quadrat. The full method adds additional detail to the abbreviated method, described above, by also recording the percentage of each FuelRule band obscured. The litter layer depth and height and cover of plant functional types were also recorded. Standing biomass within the quadrat was then destructively sampled and collected in one bag. The litter layer was carefully removed down to the A horizon and placed in a separate bag. In the laboratory, vegetation for each quadrat was first sorted into live and dead material, where, for C3 grasses, a subsample was taken to sort live and dead material more efficiently. Dead material was combined with the litter layer sample. Subsequently, the live material was separated into four–six plant functional types (forbs, legumes, woody plants, and grasses—for a subset of quadrats, grasses were separated into C4 and C3 species). The sorted samples were then dried at 65 °C for 24 h and weighed.

2.4. Data Analysis

All data analysis was completed using R 4.2.1 [34]. Allometric equations to predict biomass were developed from the FuelRule observations and destructive sampling data. FuelRule observations were entered into an existing software “PObscured” [33]. Briefly, PObscured fits a logistic regression through the relationship between the FuelRule band heights and the percentage of each band obscured. This allows several vegetation structure indices to be calculated (Table S2). The indices can be calculated based on standing biomass only or based on the total depth of biomass, including the litter layer. Best-subsets regression analysis was run using the package “leaps” Version 3.1 [35]. The regression analyzed the relationship between the actual biomass measured from the harvested quadrats and the PObscured structural indices. This analysis produced equations that included from one up to all eight of the indices. The final equations were selected on the basis of model parsimony and adjusted R2 values. The resulting allometric equations were then used to estimate the biomasses for all 322 plots using the structural information collected in 2016.
Species diversity and richness were calculated via the package “vegan” version 2.6-2 [36] using the functions “diversity” and “specnumber”. Species richness and Shannon diversity were calculated for all 322 plots based on the 2016 vegetation surveys. Separate linear mixed-effects models were used to evaluate the relationship between species diversity or richness and the restoration treatments. We used the “lmer” function in the package “lme4” version 1.1-10 [37], and models were used to test the individual and interacting effects of treatments (seed mix, fertilized/not fertilized, tilled/deep ripped). Block was designated as a random effect in all the models. Subsequently, two mixed-effects models were used to test the effects of the treatments and the individual effects of species richness or Shannon diversity on biomass. The “Anova” function in the package “car” version 3.1-3 [36,38] was used to estimate p-values for the models using a Type III sum-of-squares. Estimated marginal means, package “emmeans” version 1.8.1-1 [39], were used to perform post hoc pairwise comparisons of significant treatments/interactions. Marginal and conditional R2 values were obtained for each model using a pseudo-R-squared for generalized mixed-effect models function “r.squaredGLMM” in the package “MuMin” version 1.47.1 [40].
We examined how species and plant functional type composition related to productivity using Non-Metric Multidimensional Scaling (NMDS). Two NMDS ordinations were produced—first for species composition and second for plant functional type composition. NMDS analyses were completed using the “metaMDS” function in the “vegan” package. We utilized the Bray–Curtis dissimilarity matrix based on the untransformed (i.e., raw) vegetation abundance data. Analyses were run using a minimum of 20 and maximum of 999 iterations and we fitted 2–4 dimensions, selecting a final solution on the basis of dimensional parsimony and the minimization of solution stress. Relationships between composition and productivity were tested using the “envfit” and “ordisurf” functions, which allow for the evaluation of, respectively, linear and non-linear gradients in productivity across the ordination of composition.

3. Results

3.1. Predicting Prairie Biomass

Across 29 harvested quadrats, the total harvested biomass ranged from 0.62 kg m−2 to 2.39 kg m−2 (mean ± 1 SD = 1.16 ± 0.46 kg m−2). There was also a substantial range in the key structural attributes recorded with the FuelRule. The mean sward height (contact height with the stick) ranged from 29 cm to 184 cm, the maximum height of the stick partially obscured ranged from 30 cm to 189 cm, and the height totally obscured by vegetation ranged from 0 cm to 20 cm. The dominant plant functional groups in the harvested quadrats included C3 and C4 grasses (112.89 ± 102.60 kg m−2 and 279.78 ± 364.50 kg m−2, respectively), forbs (181.13 ± 185.09 kg m−2), and legumes (0.11 ± 0.11 kg m−2). The proportion of live material in the quadrats ranged from 0.26 to 0.79 (mean = 0.59 ± 0.12).
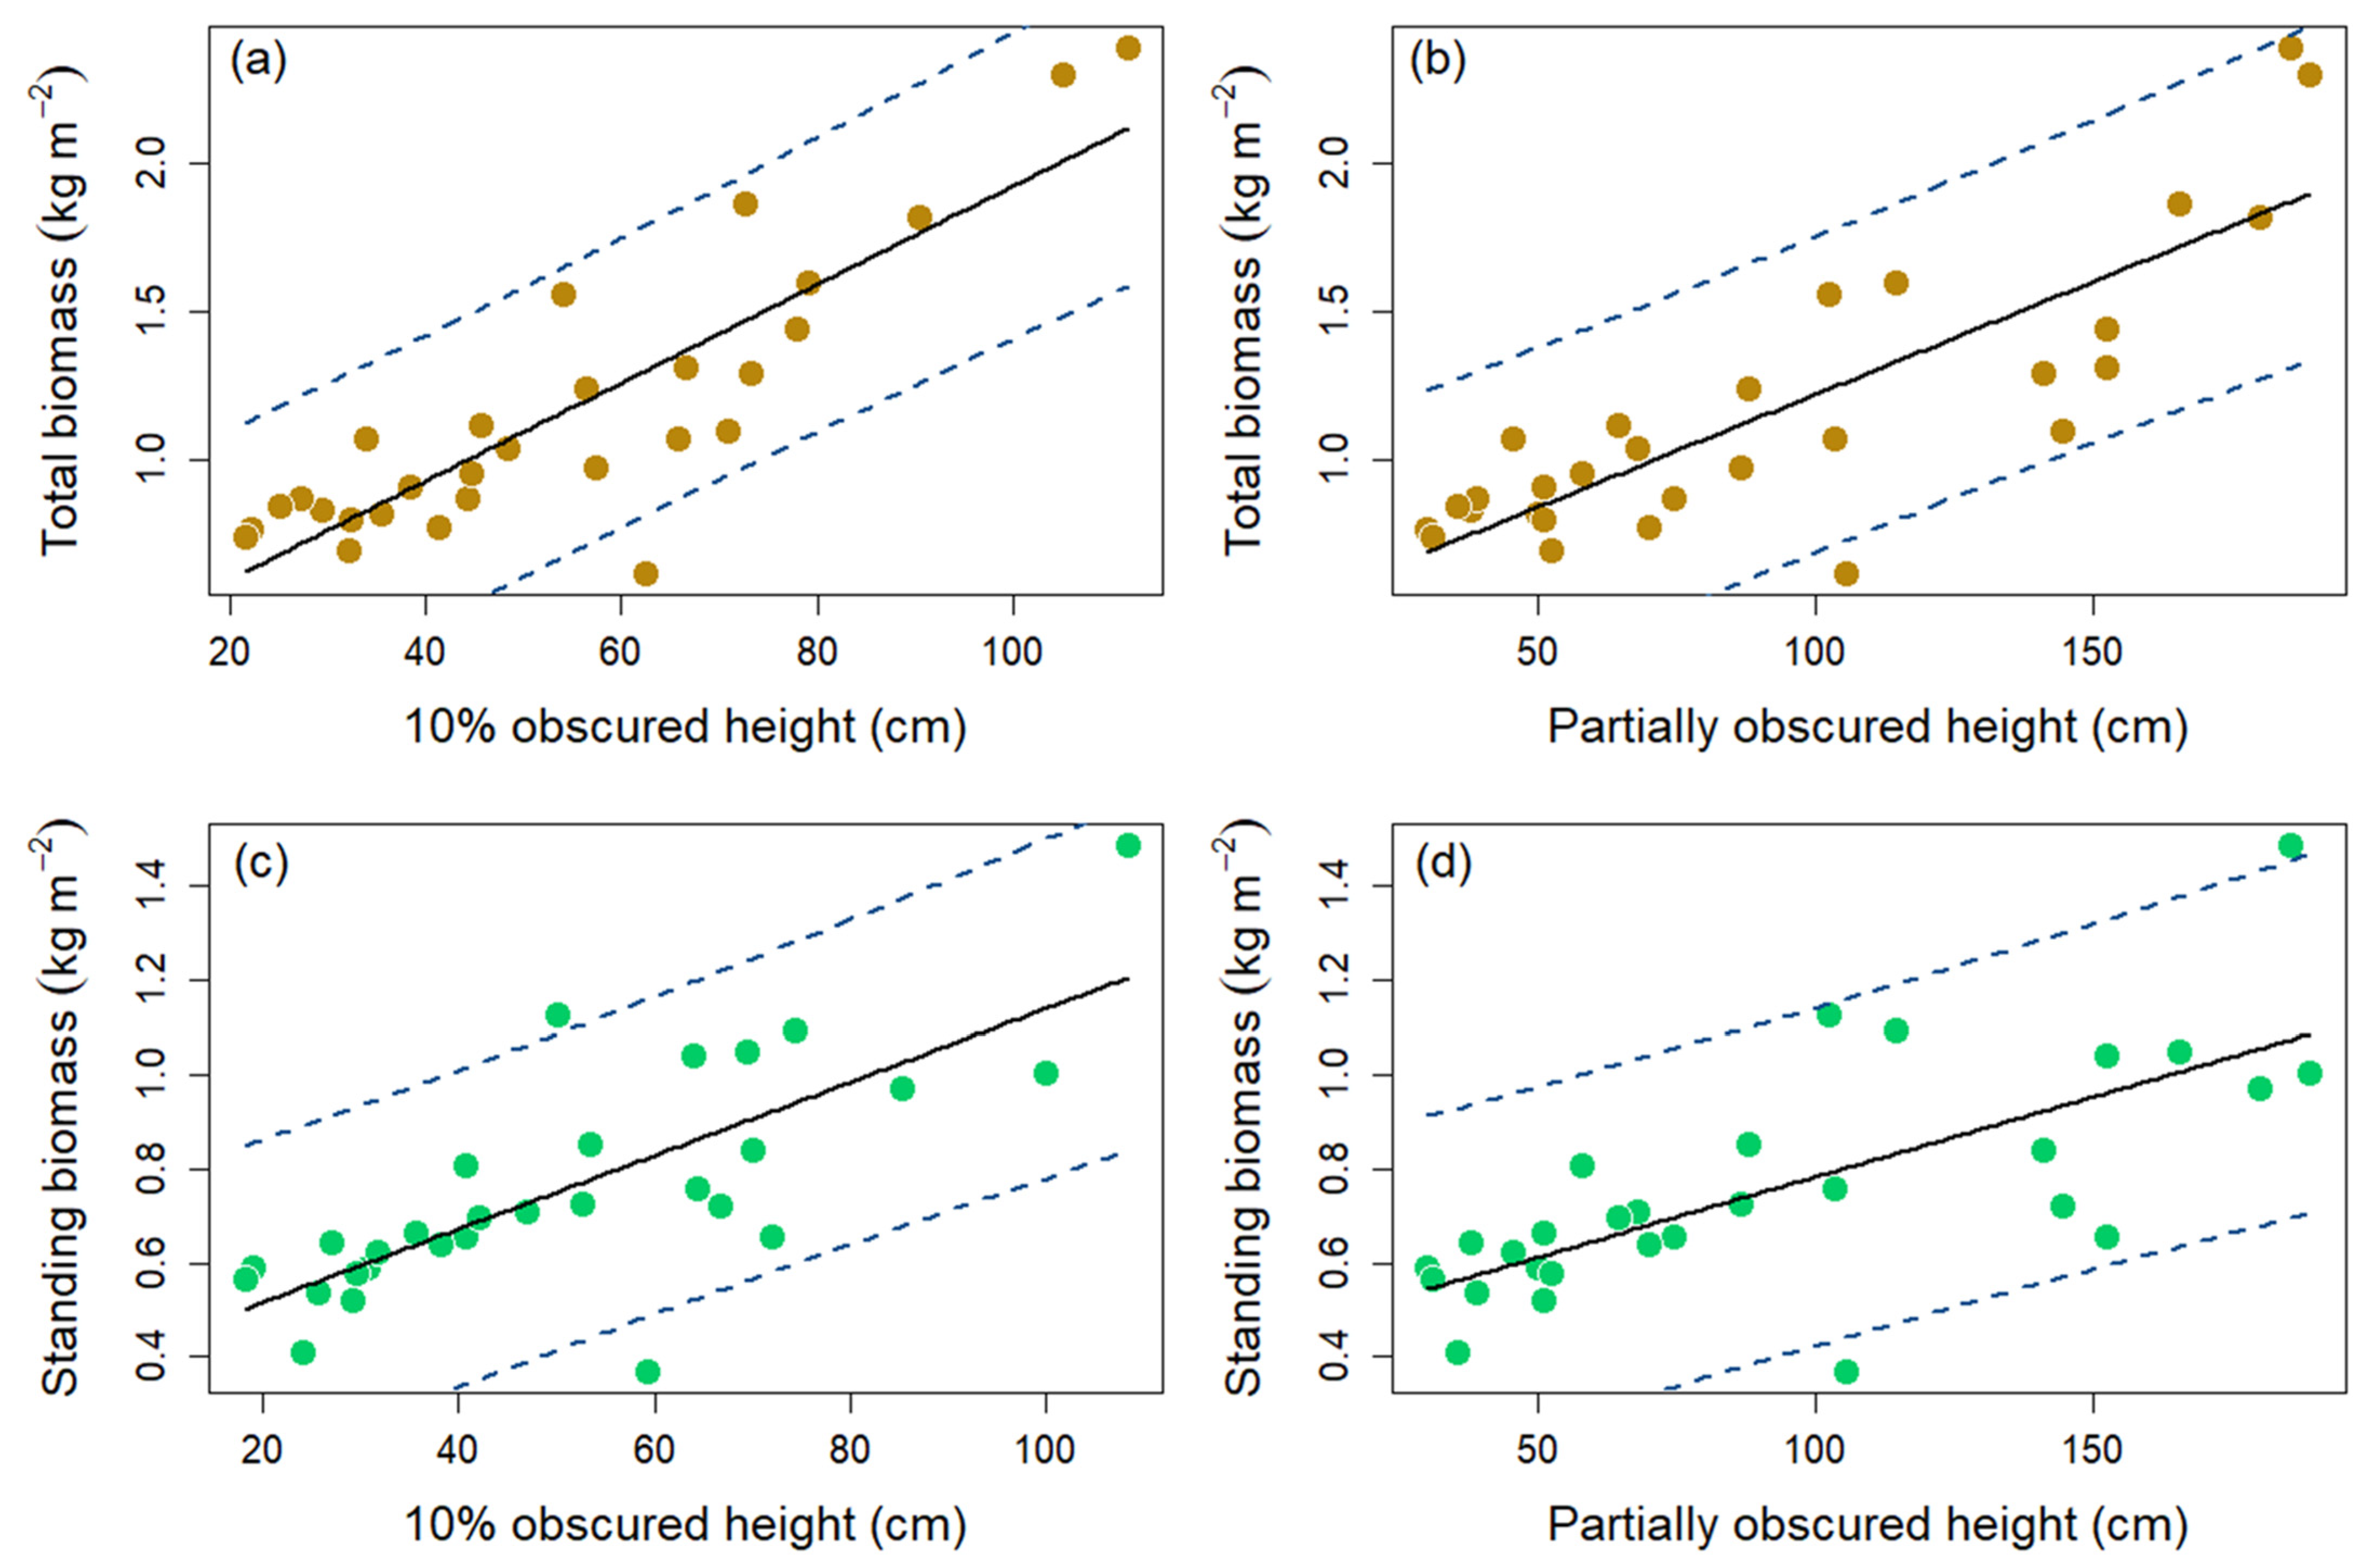
Best-subsets regression analysis resulted in the development of several strong allometric equations for predicting prairie biomass from FuelRule indicators. When examining all eight indicators from the full FuelRule procedure, 10% height was the best indicator of both total biomass and standing biomass (Figure 1 and Table 2). The best indicator from among those collected using the abbreviated FuelRule methodology was partially obscured height (PartObs) (Table 2). A single predictor was selected in all instances, as additional predictors resulted in a more complex equation without any meaningful increase in adjusted R2 values. Both 10% height and partially obscured height were positively associated with biomass—a greater biomass was found in taller stands.

3.2. Variation in Species Diversity Across the Restoration Experiment

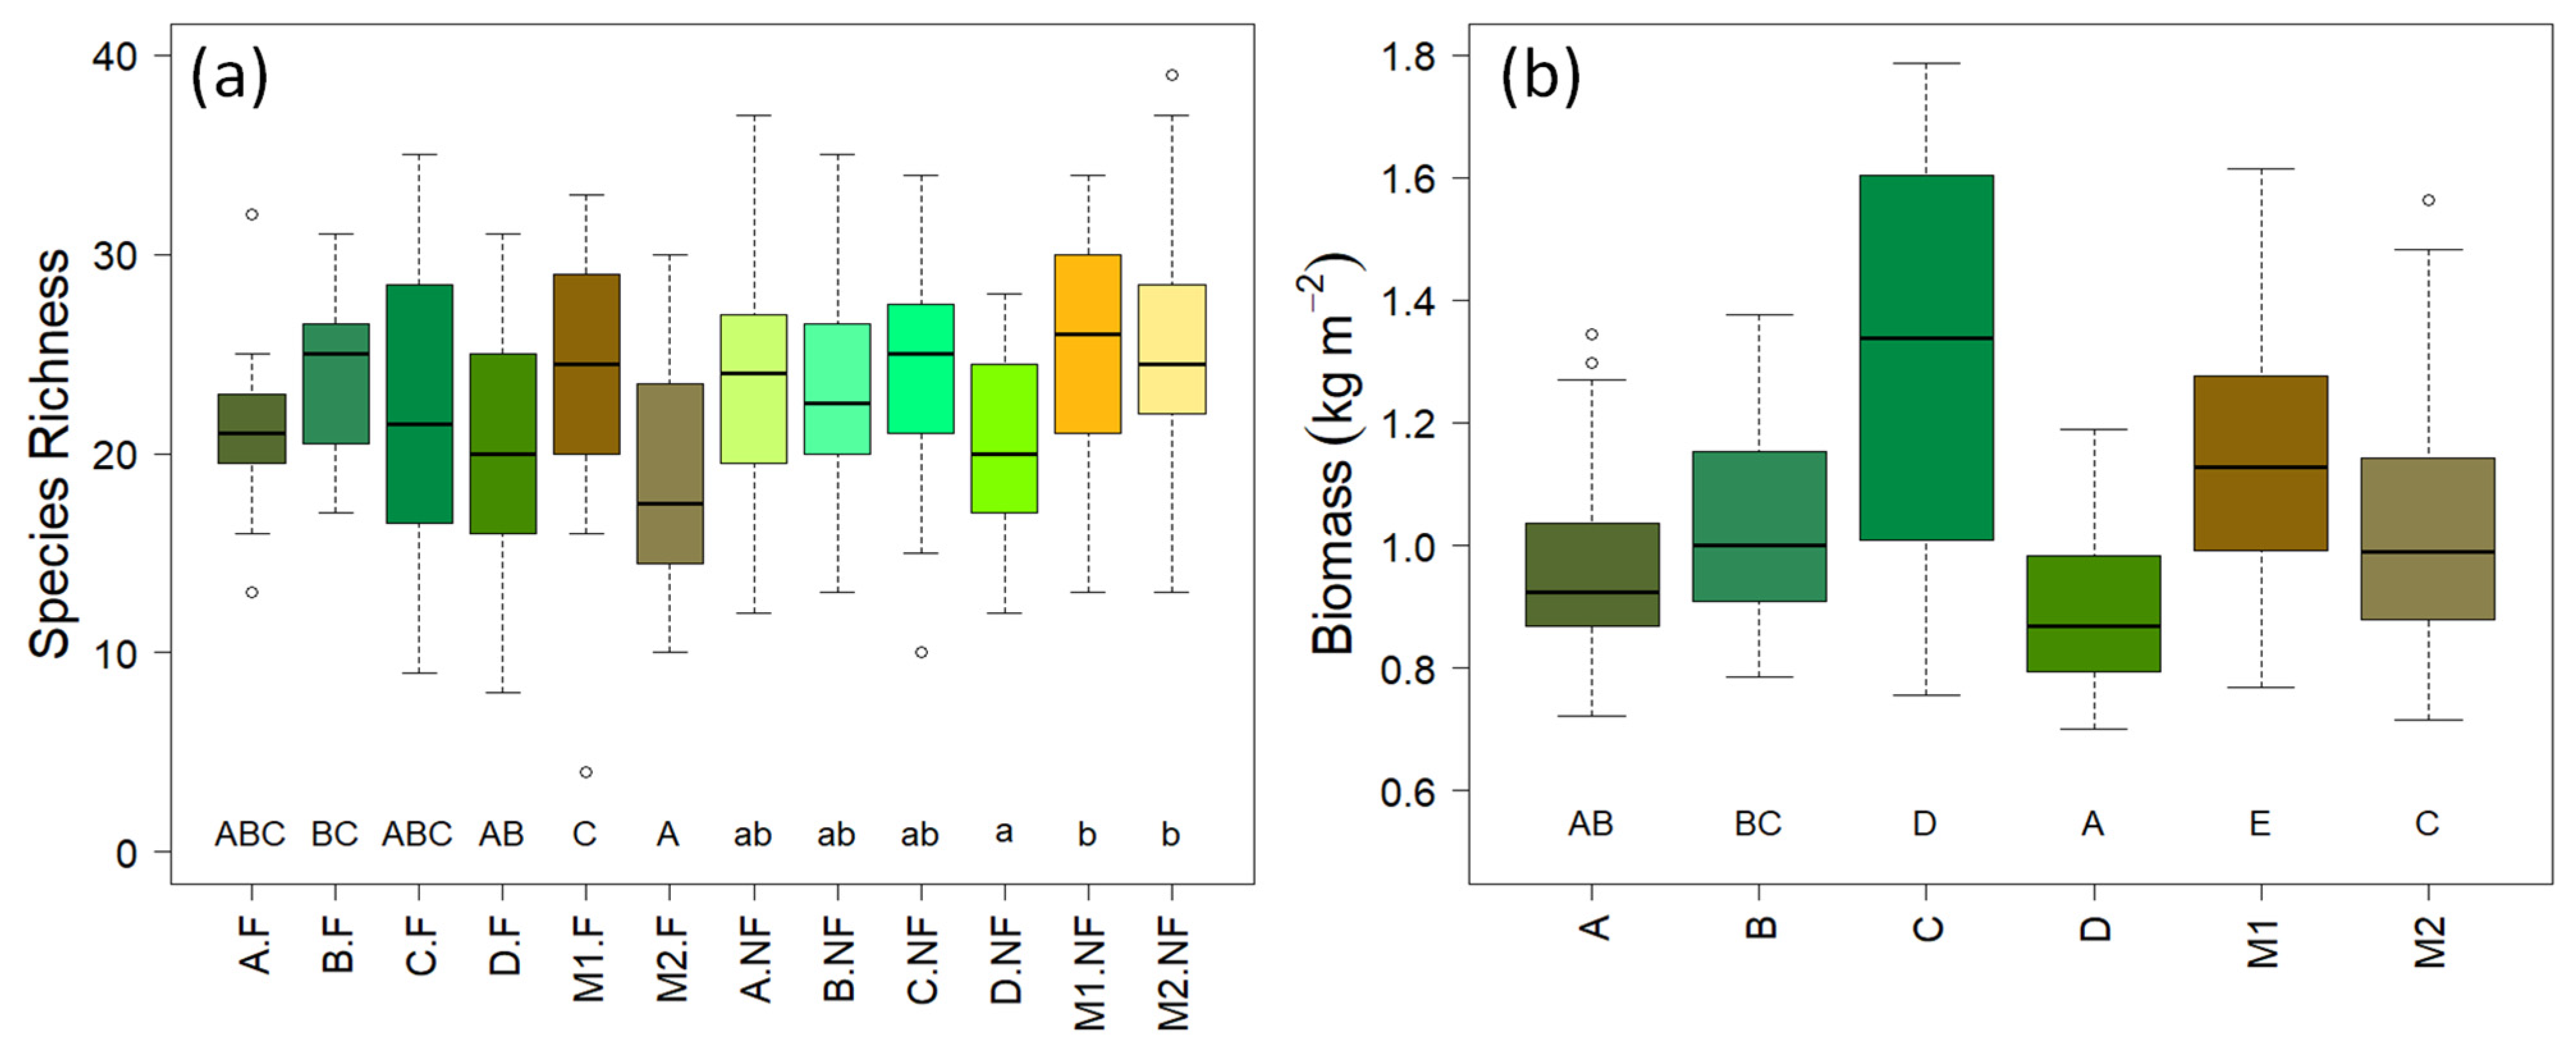
Species richness ranged from 4 to 39 and the mean species richness was 23. Shannon diversity ranged from 0.94 to 2.77 and the mean Shannon diversity was 2.11 (Figure 2 and Figure S3). The restoration treatments had no significant effects on Shannon diversity. However, the interaction between seed treatments and fertilized status was found to have a significant effect on species richness (Table 3). Pairwise comparisons (Figure 2 and Table S3) showed that, in plots that were fertilized, seed mix M1 had, on average, the greatest richness, and this was significantly greater than that seen in mixes M2 and D. Mix M2 had the lowest average richness, and this was significantly lower than that seen in mixes M1 and B.
Fertilized plots appeared to generally have a slightly lower average richness than those that received no fertilizer. In plots that were not fertilized, those seeded with mix D had a significantly lower species richness compared to plots seeded with both M1 and M2. Plots seeded with B had a marginally lower species richness than plots seeded with M2 (p = 0.067). Plots seeded with C had a marginally higher species richness than plots seeded with D (p = 0.073).

3.3. Variation in Biomass Across the Restoration Experiment

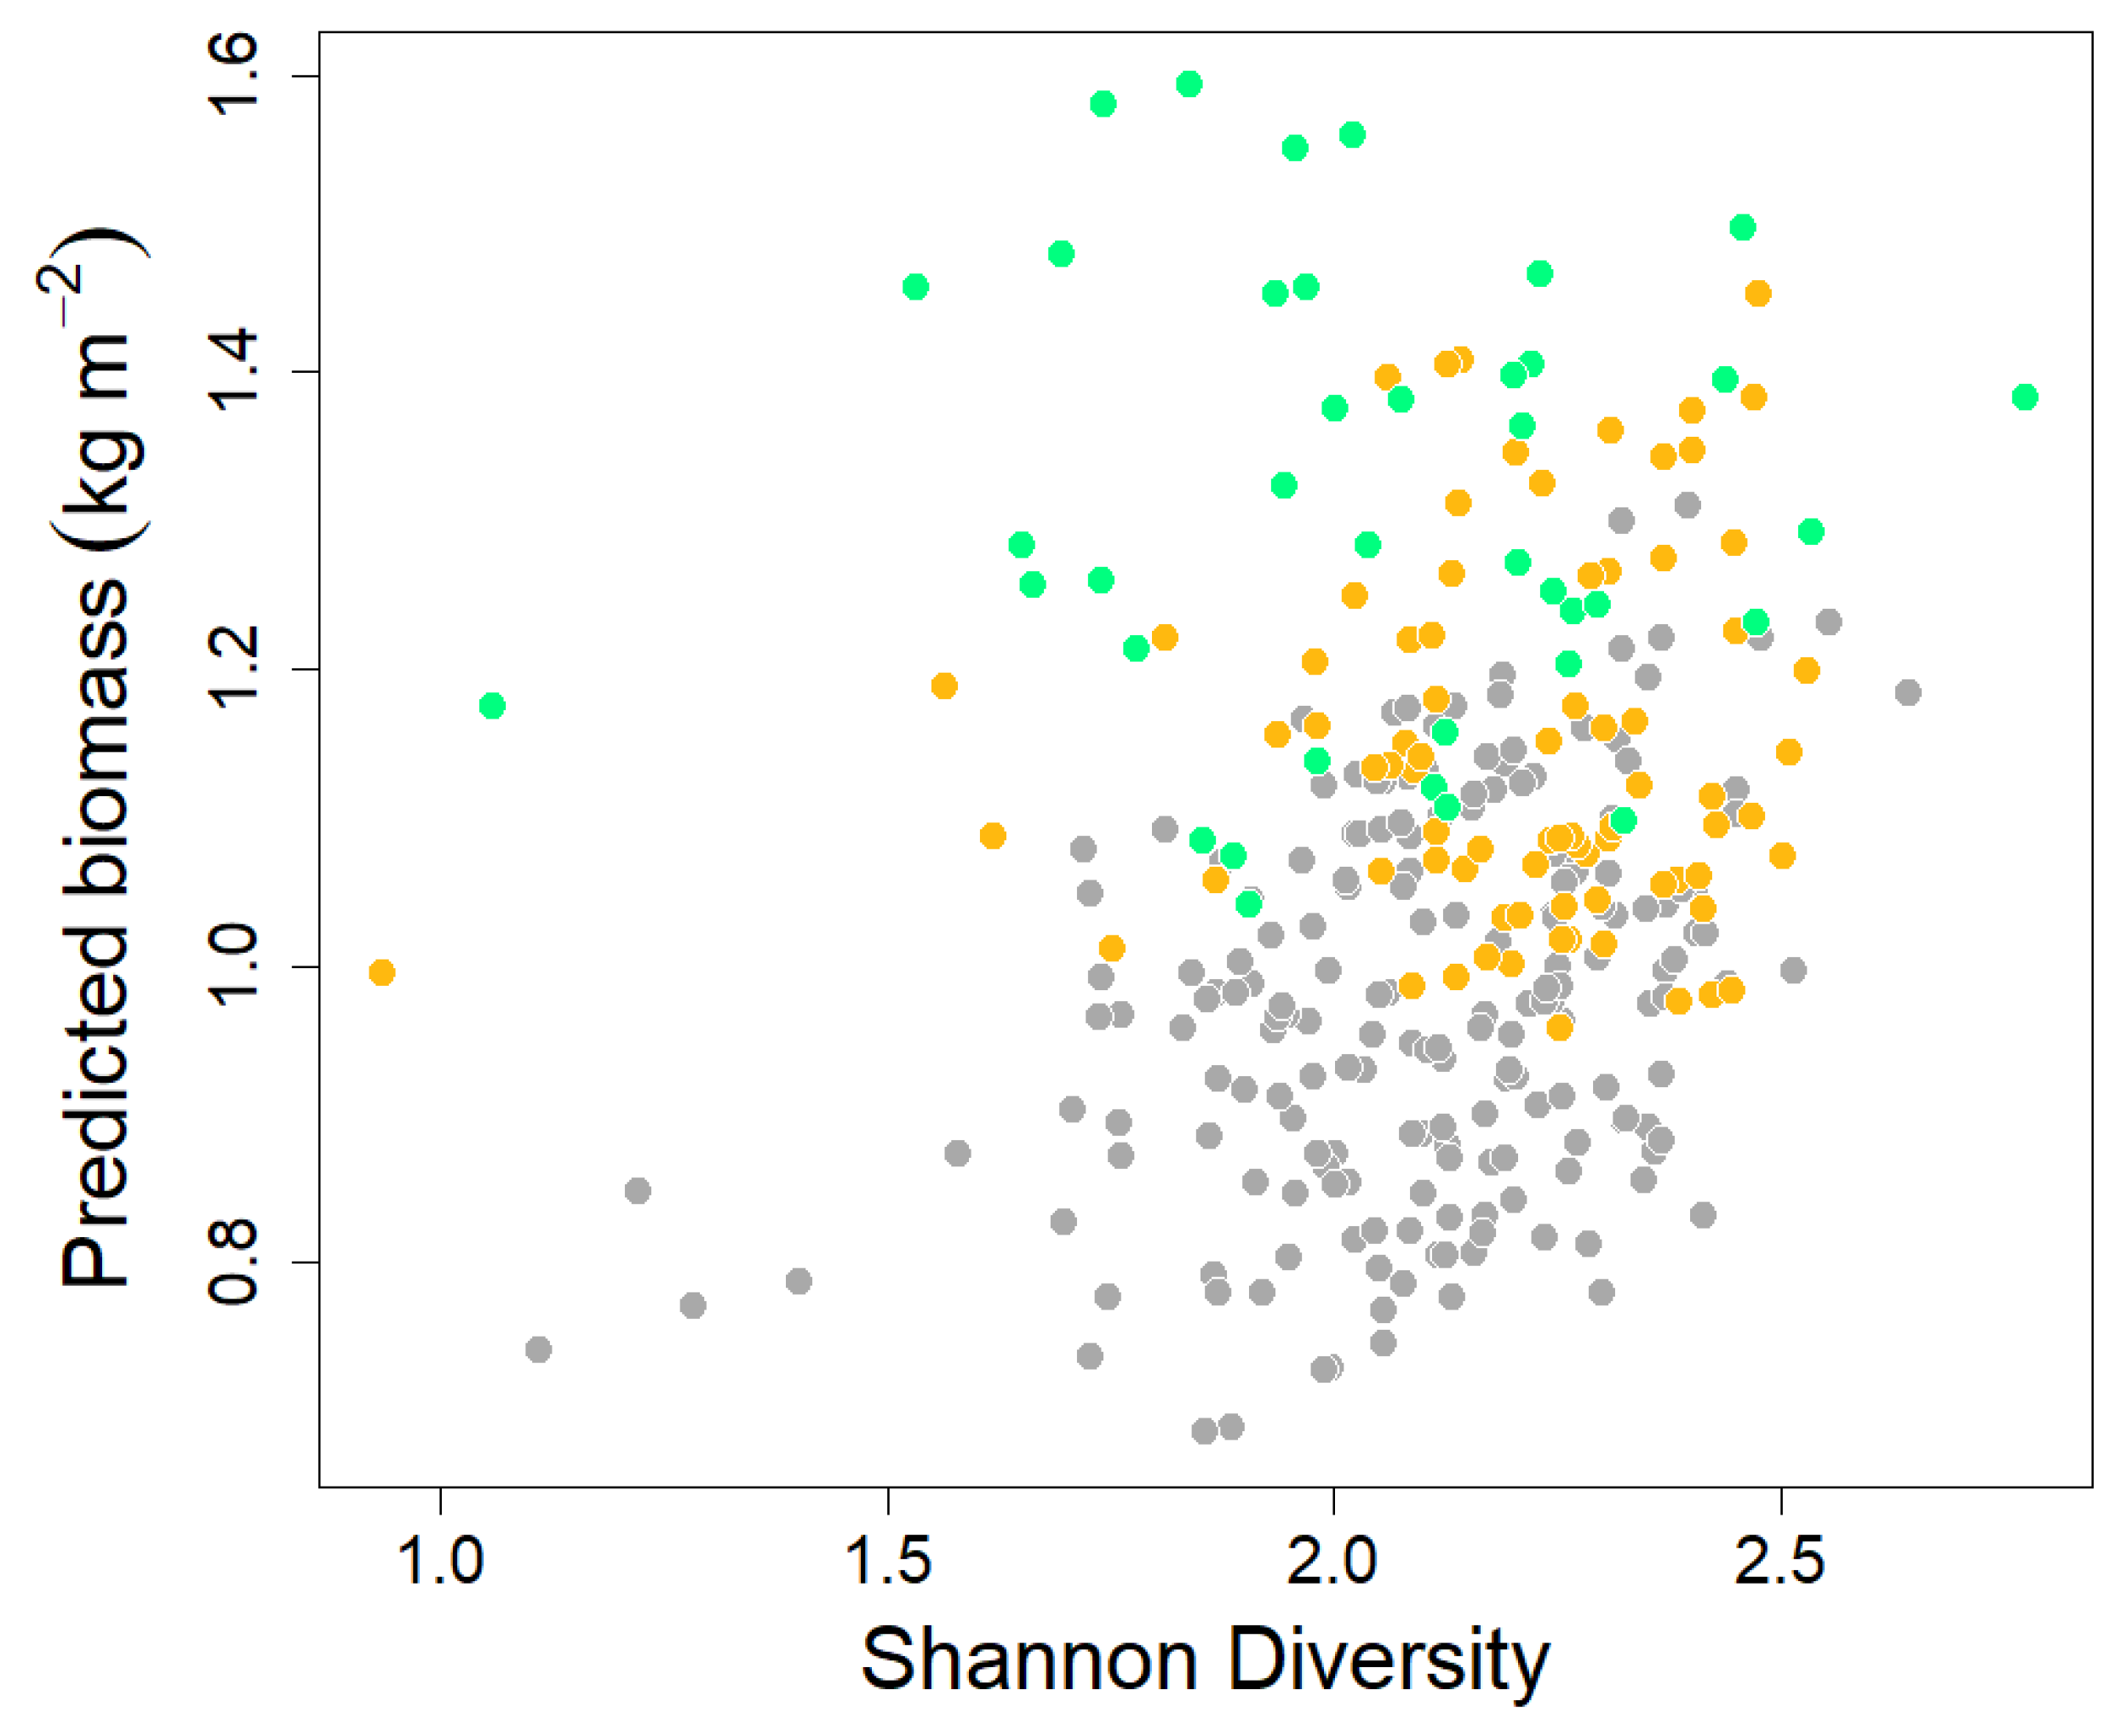
Across the treatment plots, biomass ranged from 0.71 kg m−2 to 1.79 kg m−2 and the mean biomass was 1.06 kg m−2 (Figure 2). Seed mix type and Shannon diversity were found to have a significant effect on biomass, but there was no significant effect of species richness (Table 3). Total biomass was significantly higher for seed mix C (A. gerardii monoculture) than all other mixes. Seed mix treatment M1 also exhibited a comparatively high biomass, with values significantly greater than those in all other mixes except for C. Seed mix M2 also significantly outperformed mix D. Shannon diversity was found to have a positive effect on biomass—as diversity increased, biomass generally increased, accounting for all seed treatment types (Figure 3). However, it was notable that seed mix C maintained a significantly higher biomass than other seeding treatments irrespective of plot diversity (Figure 3). The same was true, to a lesser extent, for mix M1, which also included a substantial amount of A. gerardii. For all models, the random effect of block explained as much, or more, of the variation in the modeled variables compared to the fixed effects. This was especially noticeable for species richness, where 40% of the variance was explained by the block effect.

3.4. Species and Plant Functional Composition in Relation to Biomass

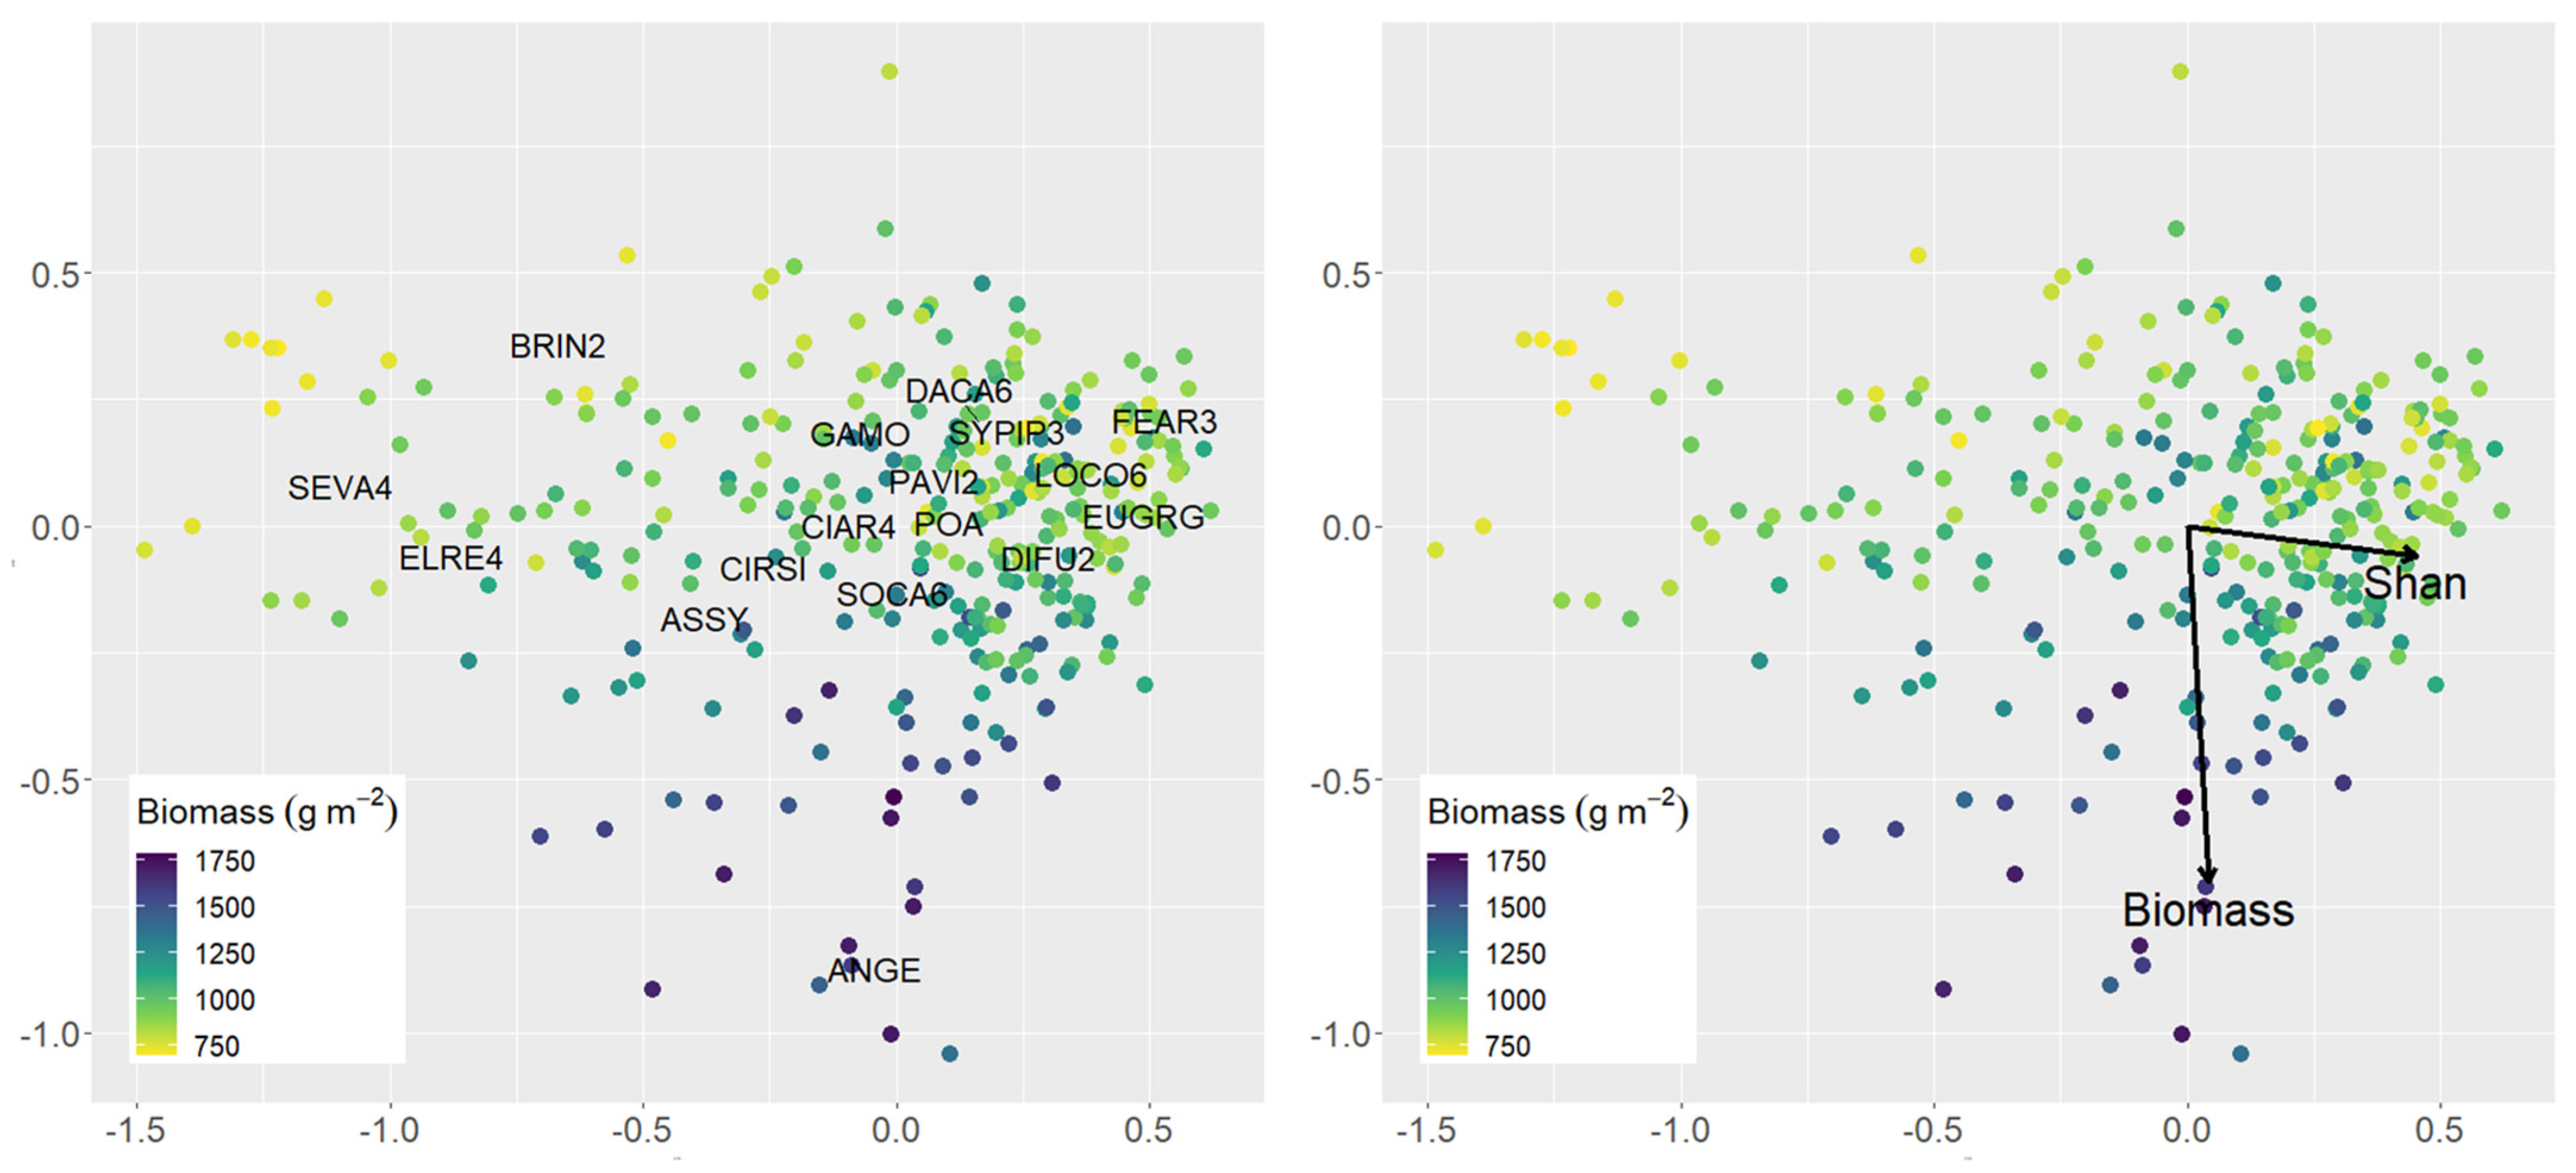
The ordination results (Figure 4) revealed two key gradients in vegetation community composition. The first broadly distinguished between plots dominated by one or the other of two dominant C3 grasses—S. arundinaceus or Bromus inermis. Plots strongly associated with each of these species also tended to be distinct in terms of the dominant introduced legumes they contained. Those associated with S. arundinaceus tended to also contain L. corniculatus, whilst those with B. inermis were more associated with Securigera varia. Plots associated with S. arundinaceus had a greater predicted Shannon diversity and appeared to show a weak trend of increasing biomass. The second clear axis of variation differentiated plots associated with a mixture of C3 grasses, forms, and P. virgatum from those with high abundances of A. gerardii. The latter plots also exhibited a significantly higher biomass.

4. Discussion

This study aimed to understand whether the effects of prairie restoration treatments persist after nearly a decade and in the absence of subsequent management. Specifically, we sought to understand the implications for plant diversity and the associations between plant diversity and productivity. Overall, species richness was significantly affected by the interaction of seed mix and fertilization, but there were no significant effects of restoration treatments on Shannon diversity. Restoration managers should be aware that, in the case of prairie restorations on highly degraded mineland sites without subsequent management, seed mixes with more species did not have an increased species richness compared to that seen with controlling non-native vegetation and sowing monocultures of C4 grasses. Whether this would remain the case if mixes contained more than the six to seven species used in this study requires further investigation. The effects of fertilizer appeared to be negligible and resulted in a lower species richness when combined with some seed mixtures. Deep ripping offered no benefit over simply tilling prior to seeding.
In our experiment, restoration treatments applied several years previously had persisting effects on species richness. The significant effects of seed mix were largely a function of the significantly lower richness in plots seeded with mix D (P. amarum). P. amarum largely failed to establish at our site, and the richness effect, therefore, seems to be primarily associated with the degree of successful establishment of C4 grasses. Fertilization can be used to enhance organic matter and nutrient availability on degraded sites [23]. The effect of seed treatment type on species richness was found to interact with the fertilization status of the plot, however, this interaction did not follow a particularly clear pattern. Broadly, richness appeared to be marginally greater in unfertilized plots, and the application of fertilizer also seemed to lead to a significant reduction in richness in seed mix M2 compared to M1. This finding demonstrates how native species establishment can be contingent on many factors, including restoration treatments like fertilization. Fertilizers can sometimes increase the competitive ability of a few species, rather than promoting all equally [41]. Most research has shown that fertilizer additions to prairies decrease species richness, though this can depend on the timing of application [42,43]. While the effect of fertilizer persisted, there was no evidence that tillage treatments influenced species richness or diversity. Forms of mechanical seedbed preparation, including tilling and deep ripping, were used to address compaction across the site. Ripping is a form of seedbed preparation that is used in instances of extreme compaction [22] such as those found in reclaimed minelands.
Highly disturbed minelands present significant challenges for restoration. In some settings, post-mining sites have provided important refugia for rare plant species, and “passive” restoration through abandonment has led to the emergence of plant communities of conservation importance [44,45]. Unfortunately, this did not appear to be the case at our study site. The majority of the species encountered during our survey were not included in the seed mixes applied during restoration. Rather, they represented non-native species commonly found in adjacent areas of reclaimed grassland or rapidly dispersing native species. This is not an uncommon issue, and many managers report that non-seeded species are a major threat to restoration success [1]. Even in long-term, large-scale prairie restoration efforts, invasive species must continually be managed [25]. At our study site, rapid recolonization by introduced species was a result of the legacy effects of the non-native vegetation seeded and established during the site’s reclamation. Legacy effects are the lasting effects of prior assemblages and species on plant community composition or ecosystem properties after management [46]. For instance, Bakker et al. [17] found that the existing soil seedbank characteristics of a site can impact native vegetation establishment and survivorship. No follow-up treatments, like targeted invasive removal, mowing, or burning [1], were implemented at the site to address legacy effects or the encroachment of non-native species.
Although there were no significant effects of the restoration treatments on Shannon diversity, a greater diversity was still found to have a positive effect on above-ground biomass production. While productivity did increase with Shannon diversity, it was also notably greater where A. gerardii was sown more heavily. This finding is in line with other studies that found that, as plant diversity increased, so did productivity [10,11,12]. Tilman et al. [9] found that in restored grasslands, biodiversity was just as important in driving primary productivity compared to other widely accepted abiotic and biotic drivers, including nutrient availability, water availability, atmospheric CO2, herbivory, and fire. Fargione et al. [11] also observed a positive relationship between species richness and biomass in diverse prairie plots and attributed this finding to complementarity that increased over time between nitrogen-fixing legumes and C4 grasses. Niche complementarity, described in Tilman et al. [10], results from the differences in resource requirements and spatial/temporal habitat usage between differing species growing as a polyculture. Individual species are expected to capitalize on a variety of niche resources, allowing species-rich plots to be highly productive. Based on existing evidence and the results of this study, niche complementary was a likely driver of productivity across the study site.
Despite this significant effect of diversity, there was also evidence that particularly dominant species could also significantly control productivity. Notably, A. gerardii, a competitive warm-season (C4) grass that can grow 4–8 ft tall, had established well following seeding across the site. The presence of A. gerardii likely explains why plots seeded with seed treatment C, a monoculture of A. gerardii, produced the highest levels of biomass. A. gerardii was also a component of the seed mix M1 treatment, and likely explains why plots seeded with this mix were the second most productive. Switchgrass did not establish as robustly as big bluestem and the coastal panic grass failed to establish at all, which would explain the comparatively low biomasses of plots seeded with seed treatments A, B, and D. Again, it is important to note that although these plots were seeded with a specific monoculture or seed mix, other non-seeded species had established within the plots, even in denser stands of bluestem.
Some studies have found that highly productive C4 grasses can dominate prairie restoration sites [6,24]. The presence of one or a few of these dominant, highly productive species, like A. gerardii, has caused diversity effects on productivity to be weak in some grassland restoration experiments [13,14,15]. This finding would indicate that the mass ratio hypothesis [13] is a key mechanism driving productivity. The mass ratio hypothesis states that even in species-rich vegetation, a small number of dominant species contribute the most to total plant biomass. Grime [13] recognized the importance of subordinates, but mostly for their ability to influence the recruitment of dominant species. The high productivity of plots seeded with A. gerardii suggests that the mass ratio hypothesis could have driven productivity in certain plots across the site. However, despite A. gerardii being established across some of the experimental plots, the significant, positive effect of diversity on productivity remained.
In conclusion, the findings of this study fall in line with existing research that has also found diversity to have a positive effect on productivity [6,10,12]. Understanding the broader relationships between plant diversity and productivity can help us pinpoint potential drivers of productivity within restored prairie ecosystems. A better understanding of what drives productivity in a restored grassland not only addresses an interesting theoretical ecological debate, but also has implications for restoration planning and management [9,12]. From a management perspective, understanding which mechanisms drive productivity can help restoration managers decide what to prioritize—for example, to maximize diversity to enhance ecosystem function and services [9] or to focus on establishing dominant species that drive function [13,14,15]. Based on our results, for prairie restoration in minelands, we suggest that the establishment of a dominant C4 grass is critical for enhancing above-ground biomass production and recommend against fertilization to maximize species richness. Where the landscape contains ample propagules from rapidly dispersing native species, sowing additional species may not yield additional benefits for diversity or productivity in the absence of ongoing maintenance and management. The positive effect of diversity on productivity indicates that niche complementarity was likely a primary driver of productivity across the site. However, there is also evidence that the presence of certain dominant species, like A. gerardii, could have driven productivity within certain areas of the site. This indicates the need for further investigation of the contingencies related to productivity drivers within restored ecosystems.

Supplementary Materials

The following supporting information can be downloaded at: https://www.mdpi.com/article/10.3390/d18020101/s1, Figure S1: Original experimental design map (top) showing the distribution of tillage, fertilization and seeding treatments across the site; and a colourized version of showing the seed treatments; Figure S2: Utilization of the “FuelRule” methodology for assessment of vegetation biomass indices and plant community composition and diversity; Figure S3: Variation in plot-level Shannon Diversity as a function of historic seed mix and fertilizer application; Table S1: Level of replication for each seed mix x fertilizer x tillage treatment combination across the study; Table S2: Vegetation structure indices recorded using the FuelRule method and/or subsequently calculated using the PObscured software; Table S3: Results of estimated marginal means analyses of pairwise contrasts in species richness as a function of the interaction of seed mix and fertilizer application; Table S4: Results of estimated marginal means analyses of pairwise contrasts in biomass as a function of seed mix.

Author Contributions

Conceptualization, E.K., R.G. and G.M.D.; methodology, E.K., R.G. and G.M.D.; field data collection, R.G., E.K. and G.M.D.; formal analysis, E.K. and G.M.D.; investigation, all authors; resources, B.M.S. and G.M.D.; writing—original draft preparation, E.K. and G.M.D.; writing—review and editing, all authors; supervision, G.M.D. and B.M.S.; project administration, G.M.D. and B.M.S.; funding acquisition, G.M.D. All authors have read and agreed to the published version of the manuscript.

Funding

This research was funded by the Ohio Agriculture Research and Development Center via a USDA-NIFA Hatch Grant. Funding for the original project that established the prairies was provided by Rentech.

Institutional Review Board Statement

Not applicable.

Data Availability Statement

All data and analytical scripts, and a copy of the PObscured program, are archived and freely available on figshare. PObscured: DOI: https://doi.org/10.6084/m9.figshare.29565200; Data and scripts: DOI: https://doi.org/10.6084/m9.figshare.29565251.

Acknowledgments

We are grateful to Nicole Cavendar, Shana Byrd, Nina Sengupta (the Wilds), and David Ussiri and Rattan Lal (SENR, OSU), who designed and implemented the original plot network. Jimmy Huntsman and Juston Wickham (the Wilds) ensured the plots’ ongoing maintenance over subsequent years. Our gratitude to Julie Slater and Sarah Francino for assistance with field data collection. The PObscured software utilized to calculate FuelRule structural indices was developed by Colin Legg. Funding for the implementation of the original experiment came from Rentech. Steve Hovick and Maria Miriti (EEOB, OSU) provided invaluable guidance and advice throughout the project. Simon Power (SENR, OSU) provided help and assistance with data management and preliminary analyses.

Conflicts of Interest

The authors declare no conflicts of interest.

References

  1. Rowe, H.I. Tricks of the trade: Techniques and opinions from 38 experts in tallgrass prairie restoration. Restor. Ecol. 2010, 18, 253–262. [Google Scholar] [CrossRef] [Scilit]
  2. McCain, K.N.S.; Baer, S.G.; Blair, J.M.; Wilson, G.W.T. Dominant grasses suppress local diversity in restored tallgrass prairie. Restor. Ecol. 2010, 18, 40–49. [Google Scholar] [CrossRef] [Scilit]
  3. Smith, D.; Williams, D.; Houseal, G.; Henderson, K. The Tallgrass Prairie Center Guide to Prairie Restoration in the Upper Midwest; University of Iowa Press: Iowa City, IA, USA, 2010. [Google Scholar]
  4. Steiner, J.L.; Starks, P.J.; Neel, J.P.S.; Northup, B.; Turner, K.E.; Gowda, P.; Coleman, S.; Brown, M. Managing tallgrass prairies for productivity and ecological function: A long-term grazing experiment in the Southern Great Plains, USA. Agronomy 2019, 9, 699. [Google Scholar] [CrossRef] [Scilit]
  5. Tilman, D.; Hill, J.; Lehman, C. Carbon-negative biofuels from low-input high-diversity grassland biomass. Science 2006, 314, 1598–1600. [Google Scholar] [CrossRef] [Scilit]
  6. Betz, R.F.; Lootens, R.J.; Becker, M.K. Two Decades of Prairie Restoration at Fermilab, Batavia, Illinois; Fermi National Accelerator Lab.: Batavia, IL, USA, 1996. Available online: https://www.osti.gov/biblio/435342-two-decades-prairie-restoration-fermilab-batavia-illinois (accessed on 1 June 2020).
  7. Swab, R.M.; Lorenz, N.; Lee, N.R.; Culman, S.W.; Dick, R.P. From the Ground Up: Prairies on Reclaimed Mine Land—Impacts on Soil and Vegetation. Land 2020, 9, 455. [Google Scholar] [CrossRef] [Scilit]
  8. Huang, Y.; Martin, L.M.; Isbell, F.I.; Wilsey, B.J. Is community persistence related to diversity? A test with prairie species in a long-term experiment. Basic Appl. Ecol. 2013, 14, 199–207. [Google Scholar] [CrossRef] [Scilit]
  9. Tilman, D.; Reich, P.B.; Isbell, F. Biodiversity impacts ecosystem productivity as much as resources, disturbance, or herbivory. Proc. Natl. Acad. Sci. USA 2012, 109, 10394–10397. [Google Scholar] [CrossRef] [Scilit]
  10. Tilman, D.; Reich, P.B.; Knops, J.; Wedin, D.; Mielke, T.; Lehman, C. Diversity and productivity in a long-term grassland experiment. Science 2001, 294, 843–845. [Google Scholar] [CrossRef] [Scilit] [PubMed]
  11. Fargione, J.; Tilman, D.; Dybzinski, R.; Lambers, J.H.R.; Clark, C.; Harpole, W.S.; Knops, J.M.H.; Reich, P.B.; Loreau, M. From selection to complementarity: Shifts in the causes of biodiversity–productivity relationships in a long-term biodiversity experiment. Proc. R. Soc. B 2007, 274, 871–876. [Google Scholar] [CrossRef] [Scilit] [PubMed]
  12. Cardinale, B.J.; Wright, J.P.; Cadotte, M.W.; Carroll, I.T.; Hector, A.; Srivastava, D.S.; Loreau, M.; Weis, J.J. Impacts of plant diversity on biomass production increase through time because of species complementarity. Proc. Natl. Acad. Sci. USA 2007, 104, 18123–18128. [Google Scholar] [CrossRef] [Scilit]
  13. Grime, J.P. Benefits of plant diversity to ecosystems: Immediate, filter and founder effects. J. Ecol. 1998, 86, 902–910. [Google Scholar] [CrossRef] [Scilit]
  14. Díaz, S.; Lavorel, S.; de Bello, F.; Quétier, F.; Grigulis, K.; Robson, T. Incorporating plant functional diversity effects in ecosystem service assessments. Proc. Natl. Acad. Sci. USA 2007, 104, 20684–20689. [Google Scholar] [CrossRef] [Scilit]
  15. Sonkoly, J.; Kelemen, A.; Valkó, O.; Deák, B.; Kiss, R.; Tóth, K.; Miglécz, T.; Tóthmérész, B.; Török, P. Both mass ratio effects and community diversity drive biomass production in a grassland experiment. Sci. Rep. 2019, 9, 1848. [Google Scholar] [CrossRef] [Scilit]
  16. Hejda, M.H.; Pyšek, P.; Jarošík, V. Impact of invasive plants on the species richness, diversity and composition of invaded communities. J. Ecol. 2009, 97, 393–403. [Google Scholar] [CrossRef] [Scilit]
  17. Bakker, J.D.; Wilson, S.D.; Christian, J.M.; Li, X.; Ambrose, L.G.; Waddington, J. Contingency of grassland restoration on year, site, competition from introduced grasses. Ecol. App. 2003, 13, 137–153. [Google Scholar] [CrossRef] [Scilit]
  18. Cavender, N.; Byrd, S.; Bechtoldt, C.L.; Bauman, J.M. Vegetation communities of a coal reclamation site in Southeastern Ohio. Northeast. Nat. 2014, 21, 31–46. [Google Scholar] [CrossRef] [Scilit]
  19. Beneduci, Z.J.; Scott, D.A.; Byrd, S.M.; Swab, R.M. We built it; did they come? Pollinator diversity and community structure in a post-mining prairie restoration project. Ecol. Restor. 2023, 41, 180–188. [Google Scholar] [CrossRef] [Scilit]
  20. Lannoo, M.J.; Kinney, V.C.; Heemeyer, J.L.; Engbrecht, N.J.; Gallant, A.L.; Klaver, R.W. Mine spoil prairies expand critical habitat for endangered and threatened amphibian and reptile species. Diversity 2009, 1, 118–132. [Google Scholar] [CrossRef] [Scilit]
  21. Guzman, J.G.; Lal, R.; Byrd, S.; Apfelbaum, S.I.; Thompson, R.L. Carbon lifecycle assessment for prairie as a crop in reclaimed mine land. Land Degrad. Dev. 2016, 27, 1196–1204. [Google Scholar] [CrossRef] [Scilit]
  22. Swab, R.M.; Lorenz, N.; Byrd, S.; Dick, R. Native vegetation in reclamation: Improving habitat and ecosystem function through using prairie species in mine land reclamation. Ecol. Eng. 2017, 108, 525–536. [Google Scholar] [CrossRef] [Scilit]
  23. Shaw, N.; Barak, R.S.; Campbell, R.E.; Kirmer, A.; Pedrini, S.; Dixon, K.; Frischie, S. Seed use in the field: Delivering seeds for restoration success. Restor. Ecol. 2020, 28, S276–S285. [Google Scholar] [CrossRef] [Scilit]
  24. Scott, D.A.; Baer, S.G. Degraded soil increases the performance of a dominant grass, Andropogon gerardii (big bluestem). Plant Ecol. 2018, 219, 901–911. [Google Scholar] [CrossRef] [Scilit]
  25. Campbell, R.E.; Hooymans, J.L. Results from four decades of successional prairie restoration and an update on ecological land management at Fermilab in Batavia, Illinois. In Proceedings of the North American Prairie Conference, Normal, IL, USA, 17–20 July 2016; p. 14. Available online: https://ir.library.illinoisstate.edu/cgi/viewcontent.cgi?article=1004&context=napc (accessed on 1 June 2020).
  26. Howe, H.F. Dominance, diversity and grazing in tallgrass restoration: Ecology has much to contribute to debates over the role of grazing in restoration—And much to learn from the results of experiments in restorative grazing. Ecol. Restor. 1999, 17, 59–66. [Google Scholar] [CrossRef] [Scilit]
  27. Dickson, T.L.; Busby, W.H. Forb species establishment increases with decreased grass seeding density and with increased forb seeding density in a Northeast Kansas, U.S.A., experimental prairie restoration. Restor. Ecol. 2009, 17, 597–605. [Google Scholar] [CrossRef] [Scilit]
  28. Natural Resources Conservation Service. PLANTS Database. United States Department of Agriculture. Available online: https://plants.usda.gov (accessed on 6 December 2024).
  29. Chase, P.E.; Pettyjohn, W.A. ERTS-1 investigation of ecological effects of strip mining in eastern Ohio. In Proceedings of the Goddard Space Flight Center Symposium on Significant Results Obtained from the ERTS-1, New Carrollton, MD, USA, 5–9 March 1973; p. 1. Available online: https://ntrs.nasa.gov/citations/19730019534 (accessed on 1 June 2020).
  30. Steiger, J.R. Soil Survey of Muskingum County, Ohio; USDA Natural Resources Conservation Service: Washington, DC, USA, 1996; Available online: https://www.muskingumswcd.org/Expertise/Soils (accessed on 1 June 2020).
  31. Arguez, A.; Durre, I.; Applequist, S.; Vose, R.; Squires, M.; Yin, X.; Heim, R.; Owen, T. NOAA’s 1981-2010 climate normals: An overview. Bull. Amer. Meteor. Soc. 2012, 93, 1687–1697. [Google Scholar] [CrossRef] [Scilit]
  32. Glover, R. Ecological Disturbance and Restoration Effects of Plant Functional Composition and Diversity. Ph.D. Thesis, The Ohio State University, Columbus, OH, USA, 2022. [Google Scholar]
  33. Davies, G.M.; Hamilton, A.; Smith, A.; Legg, C.J. Using visual obstruction to estimate heathland fuel load and structure. Int. J. Wildland Fire 2008, 17, 380–389. [Google Scholar] [CrossRef] [Scilit]
  34. R Core Team. R: A Language and Environment for Statistical Computing; R Foundation for Statistical Computing: Vienna, Austria, 2022; Available online: https://www.R-project.org (accessed on 1 June 2020).
  35. Miller, T.L. Leaps: Regression Subset Selection. R Package Version 3.1, 2020. Available online: https://CRAN.R-project.org/package=leaps (accessed on 1 June 2020).
  36. Oksanen, J.; Simpson, G.; Blanchet, F.; Kindt, R.; Legendre, P.; Minchin, P.; O’Hara, R.; Solymos, P.; Stevens, M.; Szoecs, E.; et al. Vegan: Community Ecology Package. R Package Version 2.6-2, 2022. Available online: https://CRAN.R-project.org/package=vegan (accessed on 1 August 2022).
  37. Bates, D.; Maechler, M.; Bolker, B.; Walker, S. Fitting linear mixed-effects models using lme4. J. Stat. Softw. 2015, 67, 1–48. [Google Scholar] [CrossRef] [Scilit]
  38. Fox, J. Car: Companion to Applied Regression. R Package Version 3.1-3. Available online: https://cran.r-project.org/web/packages/car (accessed on 1 August 2022).
  39. Lenth, R. Emmeans: Estimated Marginal Means, aka Least-Squares Means. R Package Version 1.8.1-1, 2022. Available online: https://CRAN.R-project.org/package=emmeans (accessed on 1 August 2022).
  40. Bartoń, K. MuMIn: Multi-Model Inference. R Package Version 1.47.1, 2022. Available online: https://CRAN.R-project.org/package=MuMIn (accessed on 1 August 2022).
  41. Liancourt, P.; Viard-Crétat, F.; Michalet, R. Contrasting community responses to fertilization and the role of the competitive ability of dominant species. J. Veg. Sci. 2009, 20, 138–147. [Google Scholar] [CrossRef] [Scilit]
  42. Piper, J.K.; Billings, D.N.; Leite, V.J. Effects of Nitrogen fertilizer on the composition of two prairie plant communities. Community Ecol. 2005, 6, 93–100. [Google Scholar] [CrossRef] [Scilit]
  43. Jarchow, M.E.; Liebman, M. Nitrogen fertilization increases diversity and productivity of prairie communities used for bioenergy. Glob. Change Biol. Bioenergy 2013, 5, 281–289. [Google Scholar] [CrossRef] [Scilit]
  44. Fois, M.; Murgia, L.; Bacchetta, G. Plant diversity and species composition of the abandoned mines of the Iglesiente mining district (Sardinia, Italy): A restoration perspective. Ecol. Eng. 2023, 188, 106879. [Google Scholar] [CrossRef] [Scilit]
  45. Řehounková, K.; Vítovcová, K.; Prach, K. Threatened vascular plant species in spontaneously revegetated post-mining sites. Restor. Ecol. 2020, 28, 679–686. [Google Scholar] [CrossRef] [Scilit]
  46. Corbin, J.D.; D’Antonio, C.M. Gone but not forgotten? Invasive plants’ legacies on community and ecosystem properties. Invasive Plant Sci. Manag. 2012, 5, 117–124. [Google Scholar] [CrossRef] [Scilit]
Figure 1. (ad) Relationship between total or standing biomass and selected structural indices recorded by the FuelRule and calculated in Pobscured. Standing biomass excludes layers of litter or thatch lying on the soil surface but does include all standing live and dead foliage. The predicted relationship is shown as a solid line, while dashed lines are 95% prediction intervals. Regression equations are presented in Table 2.
Diversity 18 00101 g001
Figure 2. Variation in species richness (a) and estimated plot biomass (b) as a function of historic seed mix and fertilizer application during site preparation (F = fertilized, NF = not fertilized). Seed mixes are described in Table 1. Letters below each bar show the results of post hoc pairwise comparisons of estimated marginal means (see Tables S3 and S4 for full results). Bars with differing letters are significantly different (p < 0.05). For species richness, there was a significant seed mix × fertilizer interaction, so tests were between seed mixes within each level of fertilizer application.
Diversity 18 00101 g002
Figure 3. Predicted biomass from the model evaluating the effects of Shannon diversity and seed mix, fertilizer application, and tillage treatments (block included as a random effect). Two seed mixes that were associated with significantly higher biomass are illustrated in green (mix = C) and orange (mix = M1).
Diversity 18 00101 g003
Figure 4. Non-Metric Multidimensional Scaling ordination biplot showing variation in species composition across 322 prairie plots (stress = 0.15; axes 1 and 2 of a 3D solution). Point color reflects plot biomass estimated via equation X. The left panel provides USDA species symbols for dominant species (defined as those with a site-level median cover of >0). The right panel shows predicted gradients in biomass (R2 = 0.49, p < 0.001) and Shannon diversity (Shan; R2 = 0.21, p < 0.001).
Diversity 18 00101 g004
Table 1. Seed mix treatments applied within each experimental block. Species with a number next to their scientific name indicate different cultivars of the same species were used when seeding.
Seed TreatmentScientific NameCommon NamePlant Functional Type
Single Species, APanicum virgatum (1)SwitchgrassC4 grass
Single Species, BPanicum virgatum (2)SwitchgrassC4 grass
Single Species, CAndropogon gerardiiBig bluestemC4 grass
Single Species, DPanicum amarumCoastal panic grassC4 grass
Seed Mix, M1Andropogon gerardiiBig bluestemC4 grass
Desmodium canadenseShowy tick-trefoilLegume
Elymus canadensisCanada wild ryeC3 grass
Heliopsis helianthoidesSmooth oxeyeForb
Panicum virgatum (3)SwitchgrassC4 grass
Panicum virgatum (1)SwitchgrassC4 grass
Seed Mix, M2Andropogon gerardiiBig bluestemC4 grass
Chamaecrista fasciculataPartridge-peaLegume
Elymus canadensisCanada wild ryeC3 grass
Helianthus maximilianiMaximillian sunflowerForb
Panicum virgatumSwitchgrassC4 grass
Senna hebecarpaWild sennaLegume
Sorghastrum nutansIndiangrassC4 grass
(1) Variety “Cave in Rock”, (2) Variety “Carthage”, (3) Variety “Blackwell”.
Table 2. Equations for predicting prairie biomass based on best-subsets regression analysis using indicators available from the full and/or abbreviated FuelRule monitoring methods (Table S1). All coefficients are shown along with their standard error. All predictors were significant a p < 0.001.
Dependent VariableInterceptPredictorCoefficientR2 (adj)
Total Biomass266.50 ± 107.3710%ht16.58 ± 1.820.75
Total Biomass461.81 ± 98.57PartObs7.60 ± 0.940.70
Standing Biomass360.36 ± 71.7510%ht7.80 ± 1.290.56
Standing Biomass441.88 ± 66.52PartObs3.41 ± 0.630.50
Table 3. Results of generalized linear mixed-effects models examining the relationship between restoration treatments, species richness, Shannon diversity, and plot biomass. Two models were constructed for biomass that included either Shannon diversity or species richness as predictors. The conditional (R2 con) and marginal (R2 mar) R2 values are reported for each model and represent the variance explained by full (fixed + random effect) and fixed effects in the model.
Species RichnessShannon DiversityBiomass Model 1Biomass Model 2
PredictorX2pX2pX2pX2p
Seed mix (S)12.0410.035.5020.3655.416<0.00196.778<0.001
Fertilizer (F)0.2960.591.3440.250.0660.800.0150.90
Tillage (T)0.0640.800.0030.960.0020.970.0050.94
S × F13.2450.025.8270.323.5760.613.6540.60
S × T1.6520.895.6480.348.2540.149.2180.10
F × T0.3300.570.3780.540.1360.710.0380.85
S × F × T1.7550.882.8090.737.8830.167.8770.16
Shannon----10.5660.001--
Richness------2.2580.13
R2 mar0.140.140.320.31
R2 con0.540.330.600.60
Disclaimer/Publisher’s Note: The statements, opinions and data contained in all publications are solely those of the individual author(s) and contributor(s) and not of MDPI and/or the editor(s). MDPI and/or the editor(s) disclaim responsibility for any injury to people or property resulting from any ideas, methods, instructions or products referred to in the content.