Article

Morphometric, Phenological, and Nutritional Characterization of Five Wild Bean Species from Durango, Mexico

by
Denisse Téllez-Mazzocco
1,†,
Yolanda Herrera-Arrieta
1,*,†,
Gabriel Alejandre-Iturbide
1,‡,
Miguel Mauricio Correa-Ramírez
1,
Marlon Rojas-López
2,† and
Kalina Bermúdez-Torres
3
1
Centro Interdisciplinario de Investigación Para el Desarrollo Integral Regional, Instituto Politécnico Nacional, Durango 34220, Mexico
2
Centro de Investigación en Biotecnología Aplicada, Instituto Politécnico Nacional, Tlaxcala 90700, Mexico
3
Centro de Desarrollo de Productos Bióticos, Instituto Politécnico Nacional, Yautepec 62739, Mexico
*
Author to whom correspondence should be addressed.
These authors contributed equally to this work.
Gabriel Alejandre-Iturbide, developed the general idea of the work, at the beginning, but he passed away before the end of this research.
Diversity 2025, 17(9), 645; https://doi.org/10.3390/d17090645
Submission received: 16 June 2025 / Revised: 6 September 2025 / Accepted: 7 September 2025 / Published: 12 September 2025
(This article belongs to the Section Plant Diversity)

Abstract

The taxonomic complexity of the genus Phaseolus requires a detailed characterization of traits that highlight species diversity. This study evaluated five wild bean species throughout their life cycle, analyzing 20 qualitative and 18 quantitative morphometric variables as well as phenological traits such as days, along with recording phenological data such as the number of days from germination to seed maturity. The nutritional composition was assessed using Fourier-transform infrared spectroscopy (FTIR) to identify the functional groups of organic compounds in the seed coat and embryo. Significant differences were observed among species, including distinct germination forms that may affect environmental adaptation and flower colors potentially linked to pollinator interactions. Morphological and phenological diversity was documented, along with variation in seed and embryo protein, polysaccharide, and lipid content. Three species were identified as being the most suitable with agronomic potential for crop improvement: P. vulgaris, P. leptostachyus, and P. acutifolius, while P. coccineus and P. leptostachyus stood out for their nutritional profiles and potential contributions to food security. The results underscore the importance of integrating morphological, phenological, and nutritional data to better understand Phaseolus diversity and inform conservation and breeding strategies.

1. Introduction

Climate change and anthropogenic disturbances have led to significant environmental degradation, including pollution and the large-scale loss of primary vegetation, directly impacting global biodiversity. These environmental shifts have profound consequences for the diversity and distribution of economically and ecologically important plant species, such as Phaseolus vulgaris L. (common bean). In Mexico, legumes—especially beans—have formed a staple of the diet since ancient times [1] (p. 272). Beyond their nutritional value [2], legumes play a critical role in sustainable agriculture by fixing atmospheric nitrogen in the soil, thereby reducing the need for chemical fertilizers [3]. Taxonomic and phylogenetic studies report 52 species of the genus Phaseolus in Mexico, 31 of which are endemic [4]. These species are primarily distributed across the Sierra Madre Occidental, the Trans-Mexican Volcanic Belt, and the southern regions of the country [5]. According to Bitocchi et al. [6], Mexico is possibly the center of origin of Phaseolus vulgaris, or the common bean, where it is believed that the speciation of this genus may have occurred.
The state of Durango, located in northern Mexico, is the fourth largest in the country, characterized by complex physiography and diverse climatic conditions [7]. According to the local floristic inventory, around 15 native Phaseolus species are found in the region [8] (p. 52). However, there is limited research on the morphometric, phenological, and nutritional aspects of wild bean populations in Durango. The states of Durango, Jalisco, and Oaxaca boast the highest diversity of wild bean species [5], which have successfully colonized a range of environmental conditions over time [9], owing to their high resistance to pests and diseases [10,11]. Unfortunately, populations of some of these wild species in northern Mexico have been significantly reduced due to both anthropogenic and natural factors [12].
In conservation biology, a fundamental objective is the comprehensive characterization of plant species from diverse perspectives, including chemical, genetic, and morphological analyses. Such characterization enables the accurate identification of populations with desirable traits, supports more robust taxonomic classifications, and guides the selection of representative individuals. Moreover, it provides a basis for designing effective conservation programs, assessing genetic diversity, and implementing genetic improvement initiatives [13].
Previous studies have examined the morphometric and phenological characterization of wild species distributed in northeastern Mexico [14], western Mexico (Jalisco) [15], and southern Mexico (Tabasco) [16], as well as cultivated, intermediate, and wild forms [17]. However, research specifically focused on wild species from the state of Durango remains scarce. This lack of information underscores the importance of their collection, description, and conservation, particularly given the absence of records addressing these aspects. In this context, it is essential to document the morphometric, phenological, and nutritional traits of these species [18]. Therefore, the objective of the present study is to characterize morphometric, phenological, and nutritional attributes of five wild bean species (P. vulgaris, P. leptostachyus, P. coccineus, P. microcarpus, and P. acutifolius) distributed in the state of Durango.

2. Materials and Methods

2.1. Germplasm and Its Management

Seeds and specimens of five bean species were collected from various municipalities in the state of Durango (Table 1). Wild plants were collected from August to November 2021 and subsequently processed following established protocols [19]. Taxonomic identification was carried out according to the criteria described by [5], and voucher specimens were deposited in the CIIDIR Durango herbarium.

2.2. Growing Conditions

The morphometric and phenological characterization was conducted under open-field (non-controlled) conditions at the Interdisciplinary Research Center for Regional Integral Development, Durango Unit, of the National Polytechnic Institute (CIIDIR-IPN-Durango). The site is characterized by a temperate subhumid climate with summer rains and an average annual precipitation of 500 mm [20]. For seed preparation, seeds were manually scarified with fine sandpaper (G150) and disinfected with 5% sodium hypochlorite for 3 min. Three replicates of four seeds each (12 plants per species) were sown in a peat moss substrate using biodegradable pots (5 cm in height) and placed in a germinator at 25 °C. At the primordial leaf stage, seedlings were transplanted into 40 cm high pots filled with a substrate mixture of 60% alluvium, 20% sawdust, and 20% horse manure. The substrate had been pre-disinfected through solar exposure for one month. Transplanted pots were arranged within an 8m × 5 m plot, where plants completed their biological cycle under field conditions, maintaining a 1 m spacing between pots of each species. A natural repellent prepared from onion, garlic, and habanero chili was applied to minimize pathogen and herbivore damage [21,22]. Morphometric and phenological characterization was conducted from March to November 2022.

2.3. Morphometric Characterization

The morphometric characterization was conducted following the descriptor guide for common beans developed by the National Seed Inspection and Certification Service (SNICS, 2005). A total of 20 qualitative variables were analyzed, including germination type, growth habit, leaf margin, venation, leaf shape and color, flower color, seed color, pod curvature, pod apex orientation, pod texture, pubescence, seed prominence within the pod, and seed shape, color, size, and texture. In addition, 18 quantitative variables were evaluated, comprising the length and width of primordial leaves and central leaflets, petiole length, stem diameter at the base, pod and seed dimensions (length, width, and thickness), pod apex length, number of pods per plant, seeds per pod, total seeds per plant, weight of 100 seeds, and total seed weight per plant.
The dimensions of primordial leaves (24 leaves per species) were recorded during the first month of growth. Central leaflet measurements were performed on 15 trifoliate leaflets per individual, totaling 180 central leaflets per species over the subsequent two months. Both primordial leaves and central leaflets were evaluated once more than 50% of the individuals had developed these structures [23] (p. 66). For pod and seed measurements, 100 pods and 100 seeds per species were randomly selected to assess pod apex length, pod dimensions, seed dimensions, and number of seeds per pod. The primordial leaves, central leaflets, petioles, stems, and dimensions of pods and seeds were measured using a digital caliper (Surtek, 0–150 mm, Beijing, China). The weight of 100 seeds and the total seed weight per plant were determined using an analytical balance (Velay, model Ve204, Mexico City, Mexico).

2.4. Phenological Characterization

Phenological evaluation was conducted by recording the number of days from germination to the appearance of the third trifoliate leaf (vegetative phase) and from pre-flowering to seed ripening (reproductive phase), following the methodology described by Fernandez et al. [23] (pp. 65–78). A total of 12 plants per species were evaluated.

2.5. Nutritional Composition Analysis

To identify the functional groups associated with organic compounds present in the seed coat and embryo of the wild bean species, the seed coat was separated from the embryo using a small grinder. Both fractions were subsequently ground separately with a mortar and pestle. The number of samples per species varied according to seed size. For analysis, 100 mg of seed coat and embryo material, obtained from multiple plants, were placed in a Bruker (Billerica, MA, USA) Vertex 70 Fourier Transform Infrared (FTIR) spectrometer operated in attenuated total reflectance (ATR) mode. Each spectrum was acquired over 60 s, with measurements performed in triplicate. Signal processing was conducted using the OPUS software package 7.5 included with the FTIR system. Spectra were further analyzed through principal component analysis (PCA) to identify groupings and trends among species based on the predominance of organic compounds (lipids, proteins, and polysaccharides) in the seed coat and embryo. The nutritional composition analysis was carried out at the Center for Applied Biotechnology Research (CIBA IPN Tlaxcala) in January 2023.

2.6. Analysis of Results

Data normality was assessed using the Shapiro–Wilk test. Subsequently, an analysis of variance (ANOVA) was performed at p < 0.05, followed by mean comparison using the Tukey test, as implemented in the InfoStat 2001 program. To evaluate the behavior and trends of each variable among species, Principal Component Analysis (PCA) was conducted. Additionally, a clustering analysis based on Euclidean similarity was performed to assess the degree of similarity among species, and a coefficient of variation (CV) analysis was carried out [24] (pp. 11–25), [25]. Canonical correspondence analysis (CCA) was employed to examine the relationships between origin and the different characteristics analyzed, considering environmental influences. The CV, PCA, and clustering analyses were conducted using the XLSTAT 5.1 program, while CCA analyses were performed using the Past 4.07b computer program. For the nutritional composition analysis, data visualization was carried out using Origin 6.0.

3. Results

3.1. Morphometric Characterization of Qualitative Variables

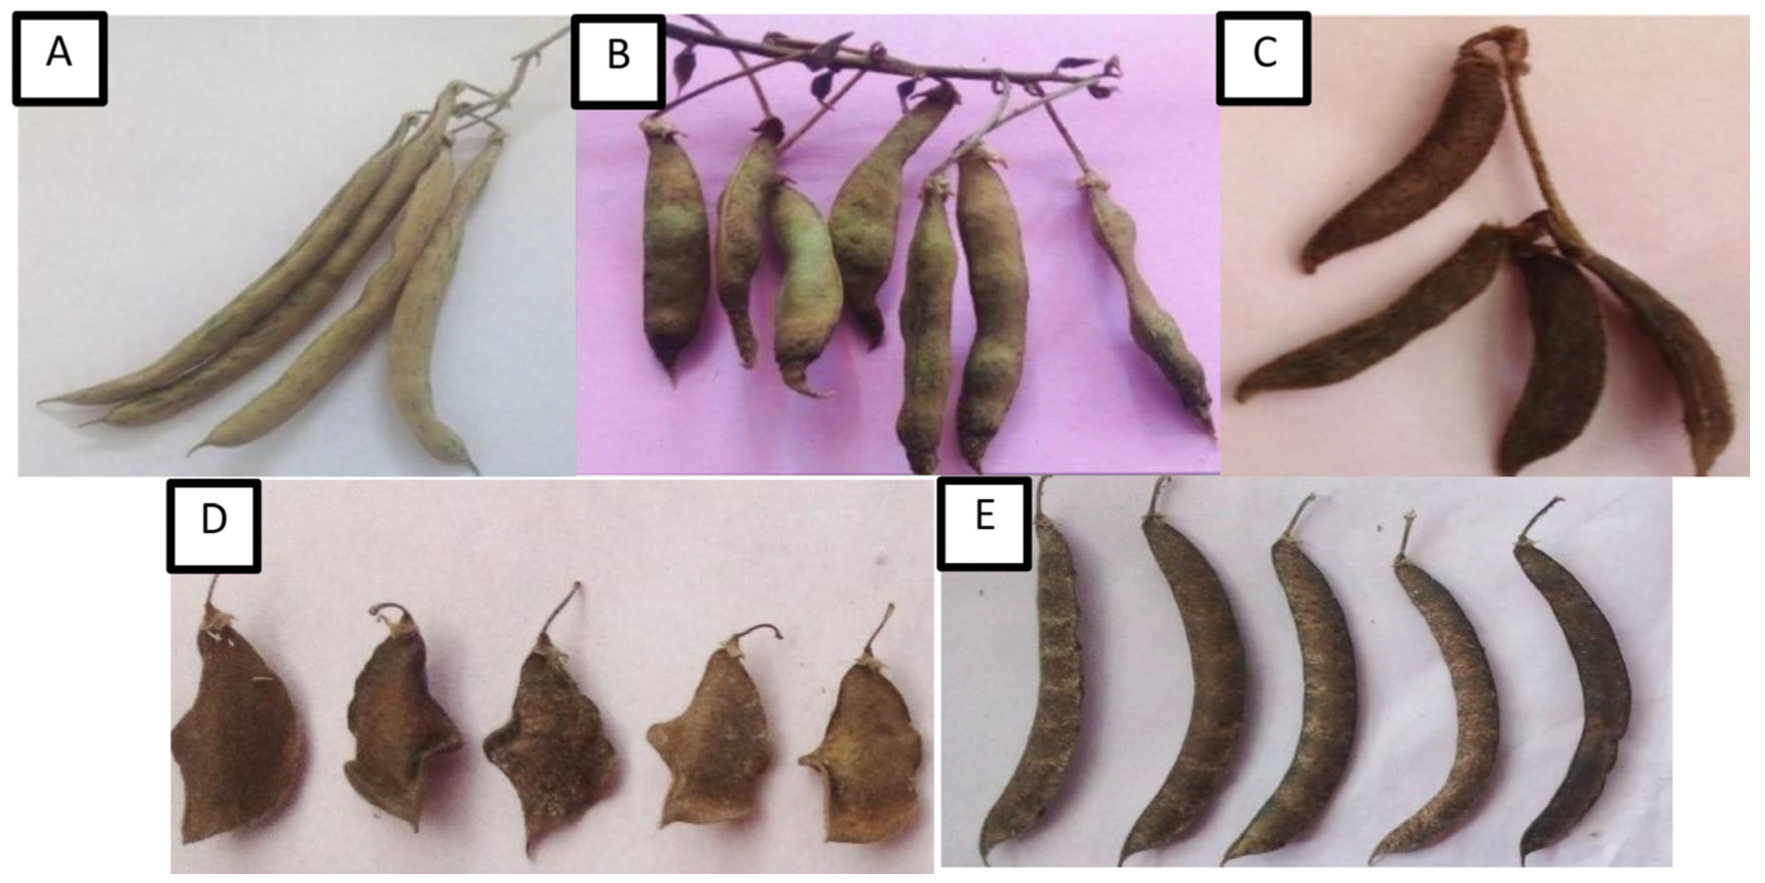
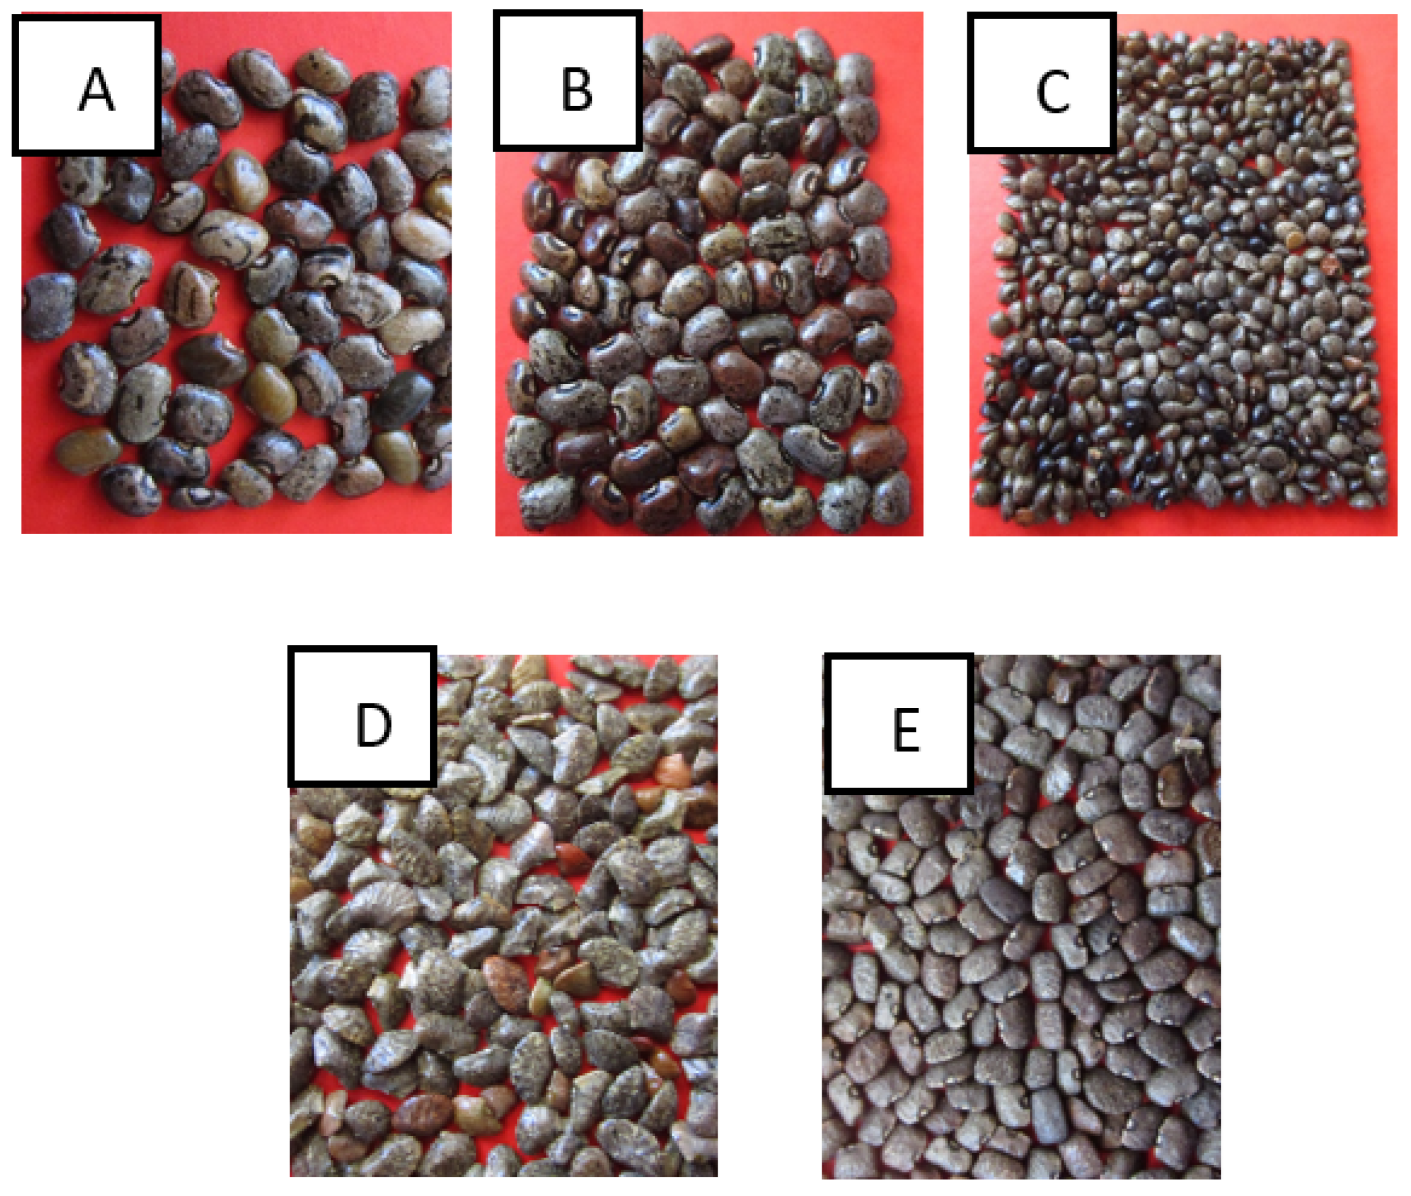
Evaluation of qualitative traits revealed variation in germination type, leaf venation, shape, and color among the species (Table 2). Most species produced lilaC–Colored flowers, except P. coccineus and P. vulgaris, which exhibited red and white flowers, respectively (Figure 1A–E). Variations were also observed in pod characteristics, including color, curvature, texture, pubescence, and seed prominence within the pods (Figure 2A–E). Seed morphology differed among species, with shapes ranging from quadrangular and rhombic to circular and colors including black, brown, and grayish tones (Figure 3A–E).

3.2. Characterization in the Leaflets, Petiole, and Steam

The species P. vulgaris and P. coccineus exhibited the highest values for the length and width of primordial leaves, as well as the length and width of central leaflets. In contrast, P. leptostachyus displayed smaller primordial leaves in both dimensions, while P. acutifolius had central leaflets with reduced width (Table 3). No significant differences were observed among the Phaseolus species in petiole length or stem diameter (p > 0.05).

3.3. Characterization in the Pods

P. vulgaris produced the longest pods, whereas P. microcarpus exhibited the greatest pod thickness. No significant differences were observed among the Phaseolus species in pod width (p > 0.05). Regarding pod apex length, P. coccineus displayed the longest apices (Table 3).

3.4. Characterization in Seeds

P. coccineus and P. acutifolius produced the longest seeds, while P. acutifolius exhibited the widest seeds and P. vulgaris the thickest seeds (Table 3). P. vulgaris and P. acutifolius recorded the highest number of seeds per pod, while P. acutifolius also displayed the greatest total seed weight per plant. The highest weight per 100 seeds was observed in P. coccineus. In terms of reproductive output, P. microcarpus produced the most pods per plant, whereas P. leptostachyus produced the largest total number of seeds per plant (Table 3).

3.5. Principal Component Analysis and Clustering Analysis of Quantitative Variables in Wild Phaseolus

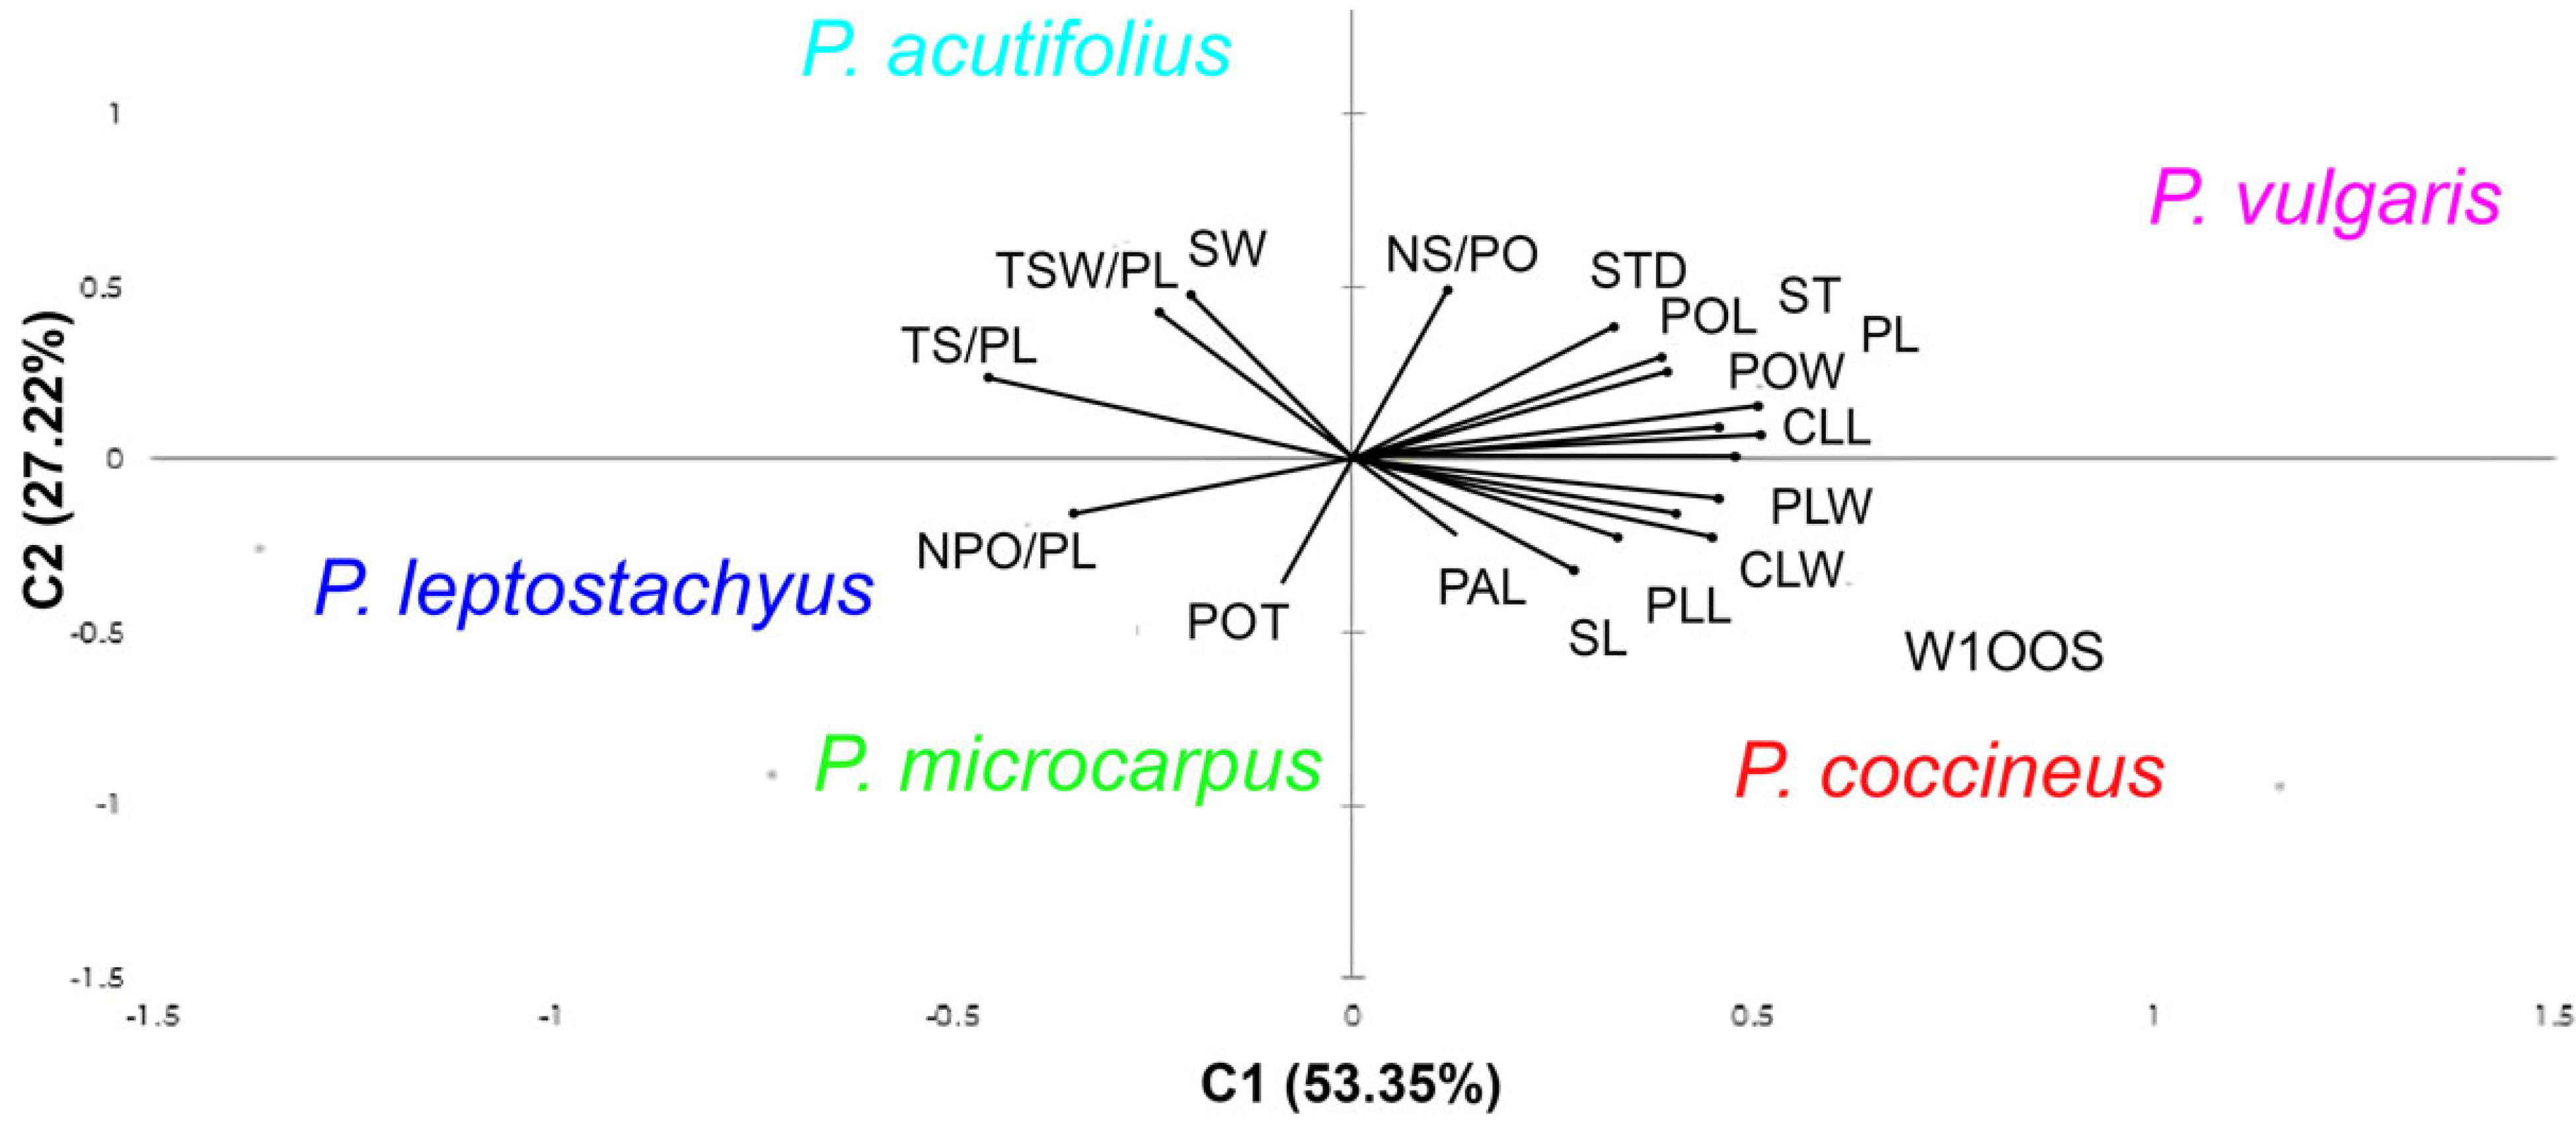
Principal Component Analysis (PCA) of the quantitative variables revealed that PC1 accounted for 53.35% of the total variation, primarily influenced by the length of the central leaflet and petiole, as well as pod width. PC2 explained 27.22% of the variation and was mainly associated with total seed weight per plant, seed length and width, and stem diameter (Figure 4).
Based on the direction and angles of the vectors, three groups were observed. In the positive region of PC1, vectors corresponding to primary leaf length and width, central leaflet length and width, seed length and thickness, pod apex length, pod width, 100-seed weight, and petiole length clustered near P. coccineus and P. vulgaris. A second group of vectors, located near the center of the plot, represented the number of seeds per pod, stem diameter, pod length, seed width, and total seed weight per plant, close to P. acutifolius. In the negative quadrant of PC1, vectors corresponding to the total number of seeds per plant, pod thickness, and number of pods per plant were associated with P. microcarpus and P. leptostachyus (Figure 4).
The clustering analysis based on Euclidean similarity identified two main groups. The first group comprised P. microcarpus and P. leptostachyus, while the second group included P. coccineus and P. vulgaris, with P. acutifolius positioned as an intermediate species connecting the two clusters (Figure 5).

3.6. Canonical Correspondence Analysis (CCA) Showing Relationship Between Morphometric Characteristics and Environmental Variables of Provenance

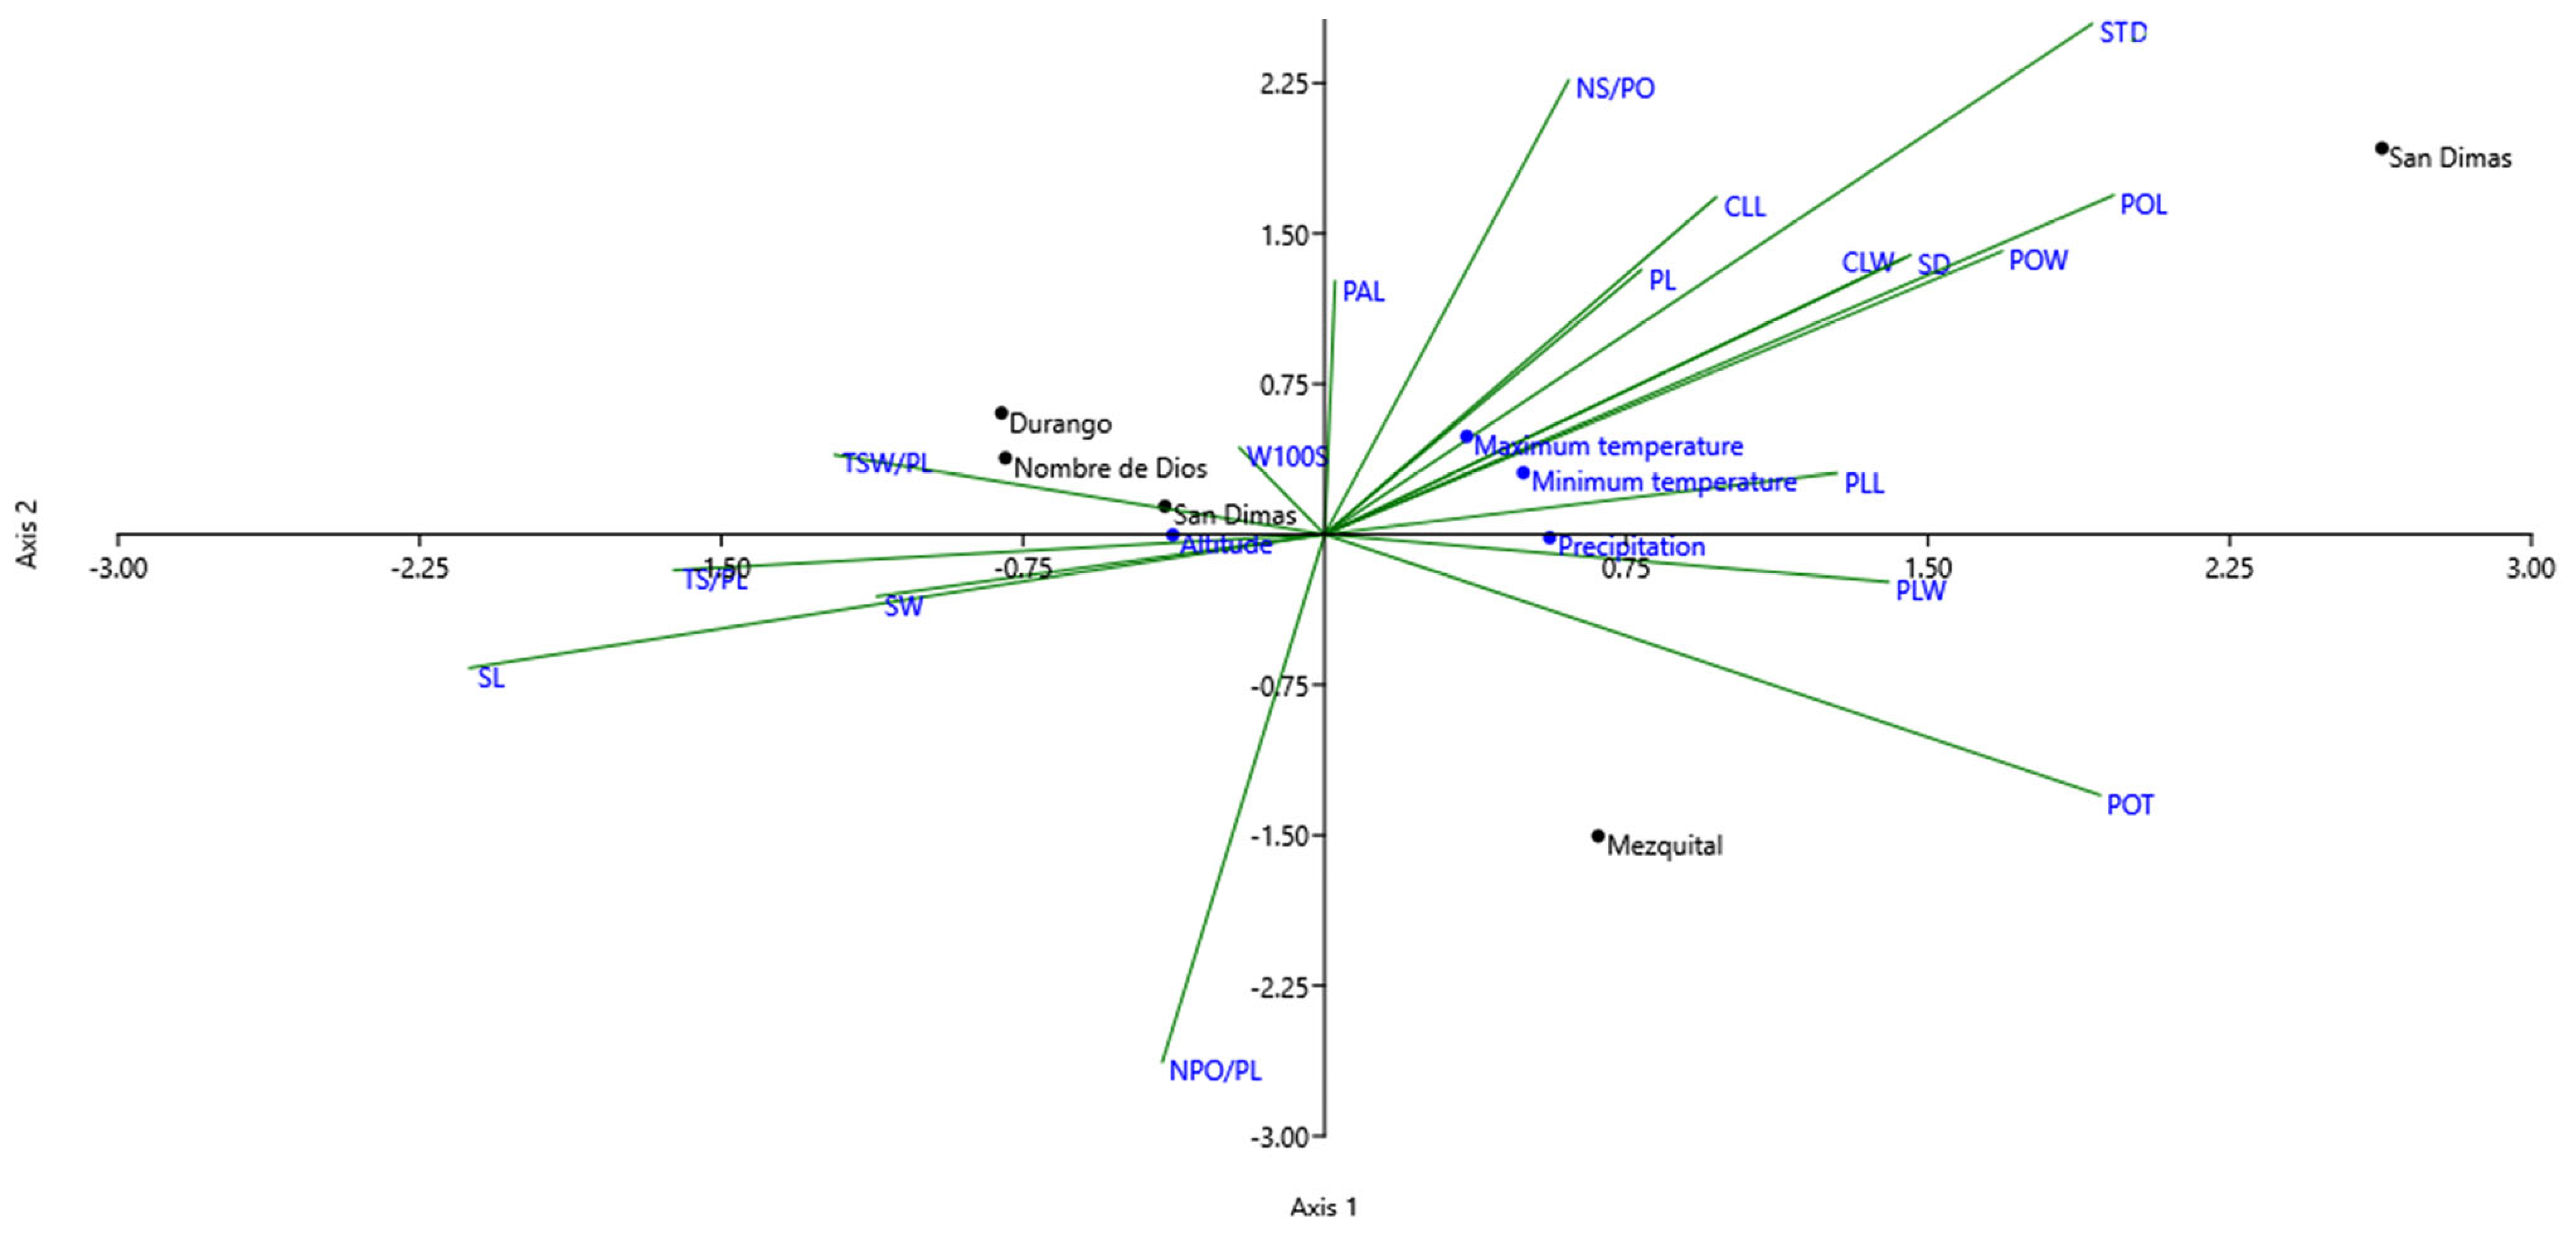
Canonical Correspondence Analysis (CCA) revealed eigenvalues of 0.209044 and 0.00150 for canonical axes 1 and 2, respectively, with a cumulative variance of 99.2%. The CCA permutation test (1000 permutations) was significant (p = 0.001) (Figure 6).
The CCA results, considering the effects of maximum and minimum temperatures, precipitation, and altitude of the collection sites, indicated that altitude strongly influenced total seeds per plant, total seed weight per plant, seed width, and the weight of 100 seeds. Additionally, lower temperatures were associated with the development of longer and wider pods, thicker seeds, and of reduced pod wall thickness.

3.7. Analysis of the Coefficient of Variation

Variables with a coefficient of variation (CV) greater than 50% were considered highly variable. Among the wild bean species, the traits showing the greatest variability included pod apex length, number of seeds per pod, seed length and width, weight of 100 seeds, number of pods per plant, total seeds per plant, and total seed weight per plant. Conversely, stem diameter and pod width exhibited the lowest variation, with CV values below 20% (Table 4).

3.8. Phenological Characterization

All five Phaseolus species exhibited similar durations for germination and emergence. Variation was observed in the development of primordial leaves, which occurred between 5 and 10 days. The longest developmental stages were the formation of the third trifoliate leaf (22–32 days), flowering (35–52 days), pod formation (51–75 days), pod filling (67–100 days), and seed ripening (95–136 days). P. coccineus required the longest period to complete its biological cycle (171 days), whereas P. acutifolius completed its cycle in 128 days (Table 5 and Table 6).

3.9. Nutritional Composition Analysis

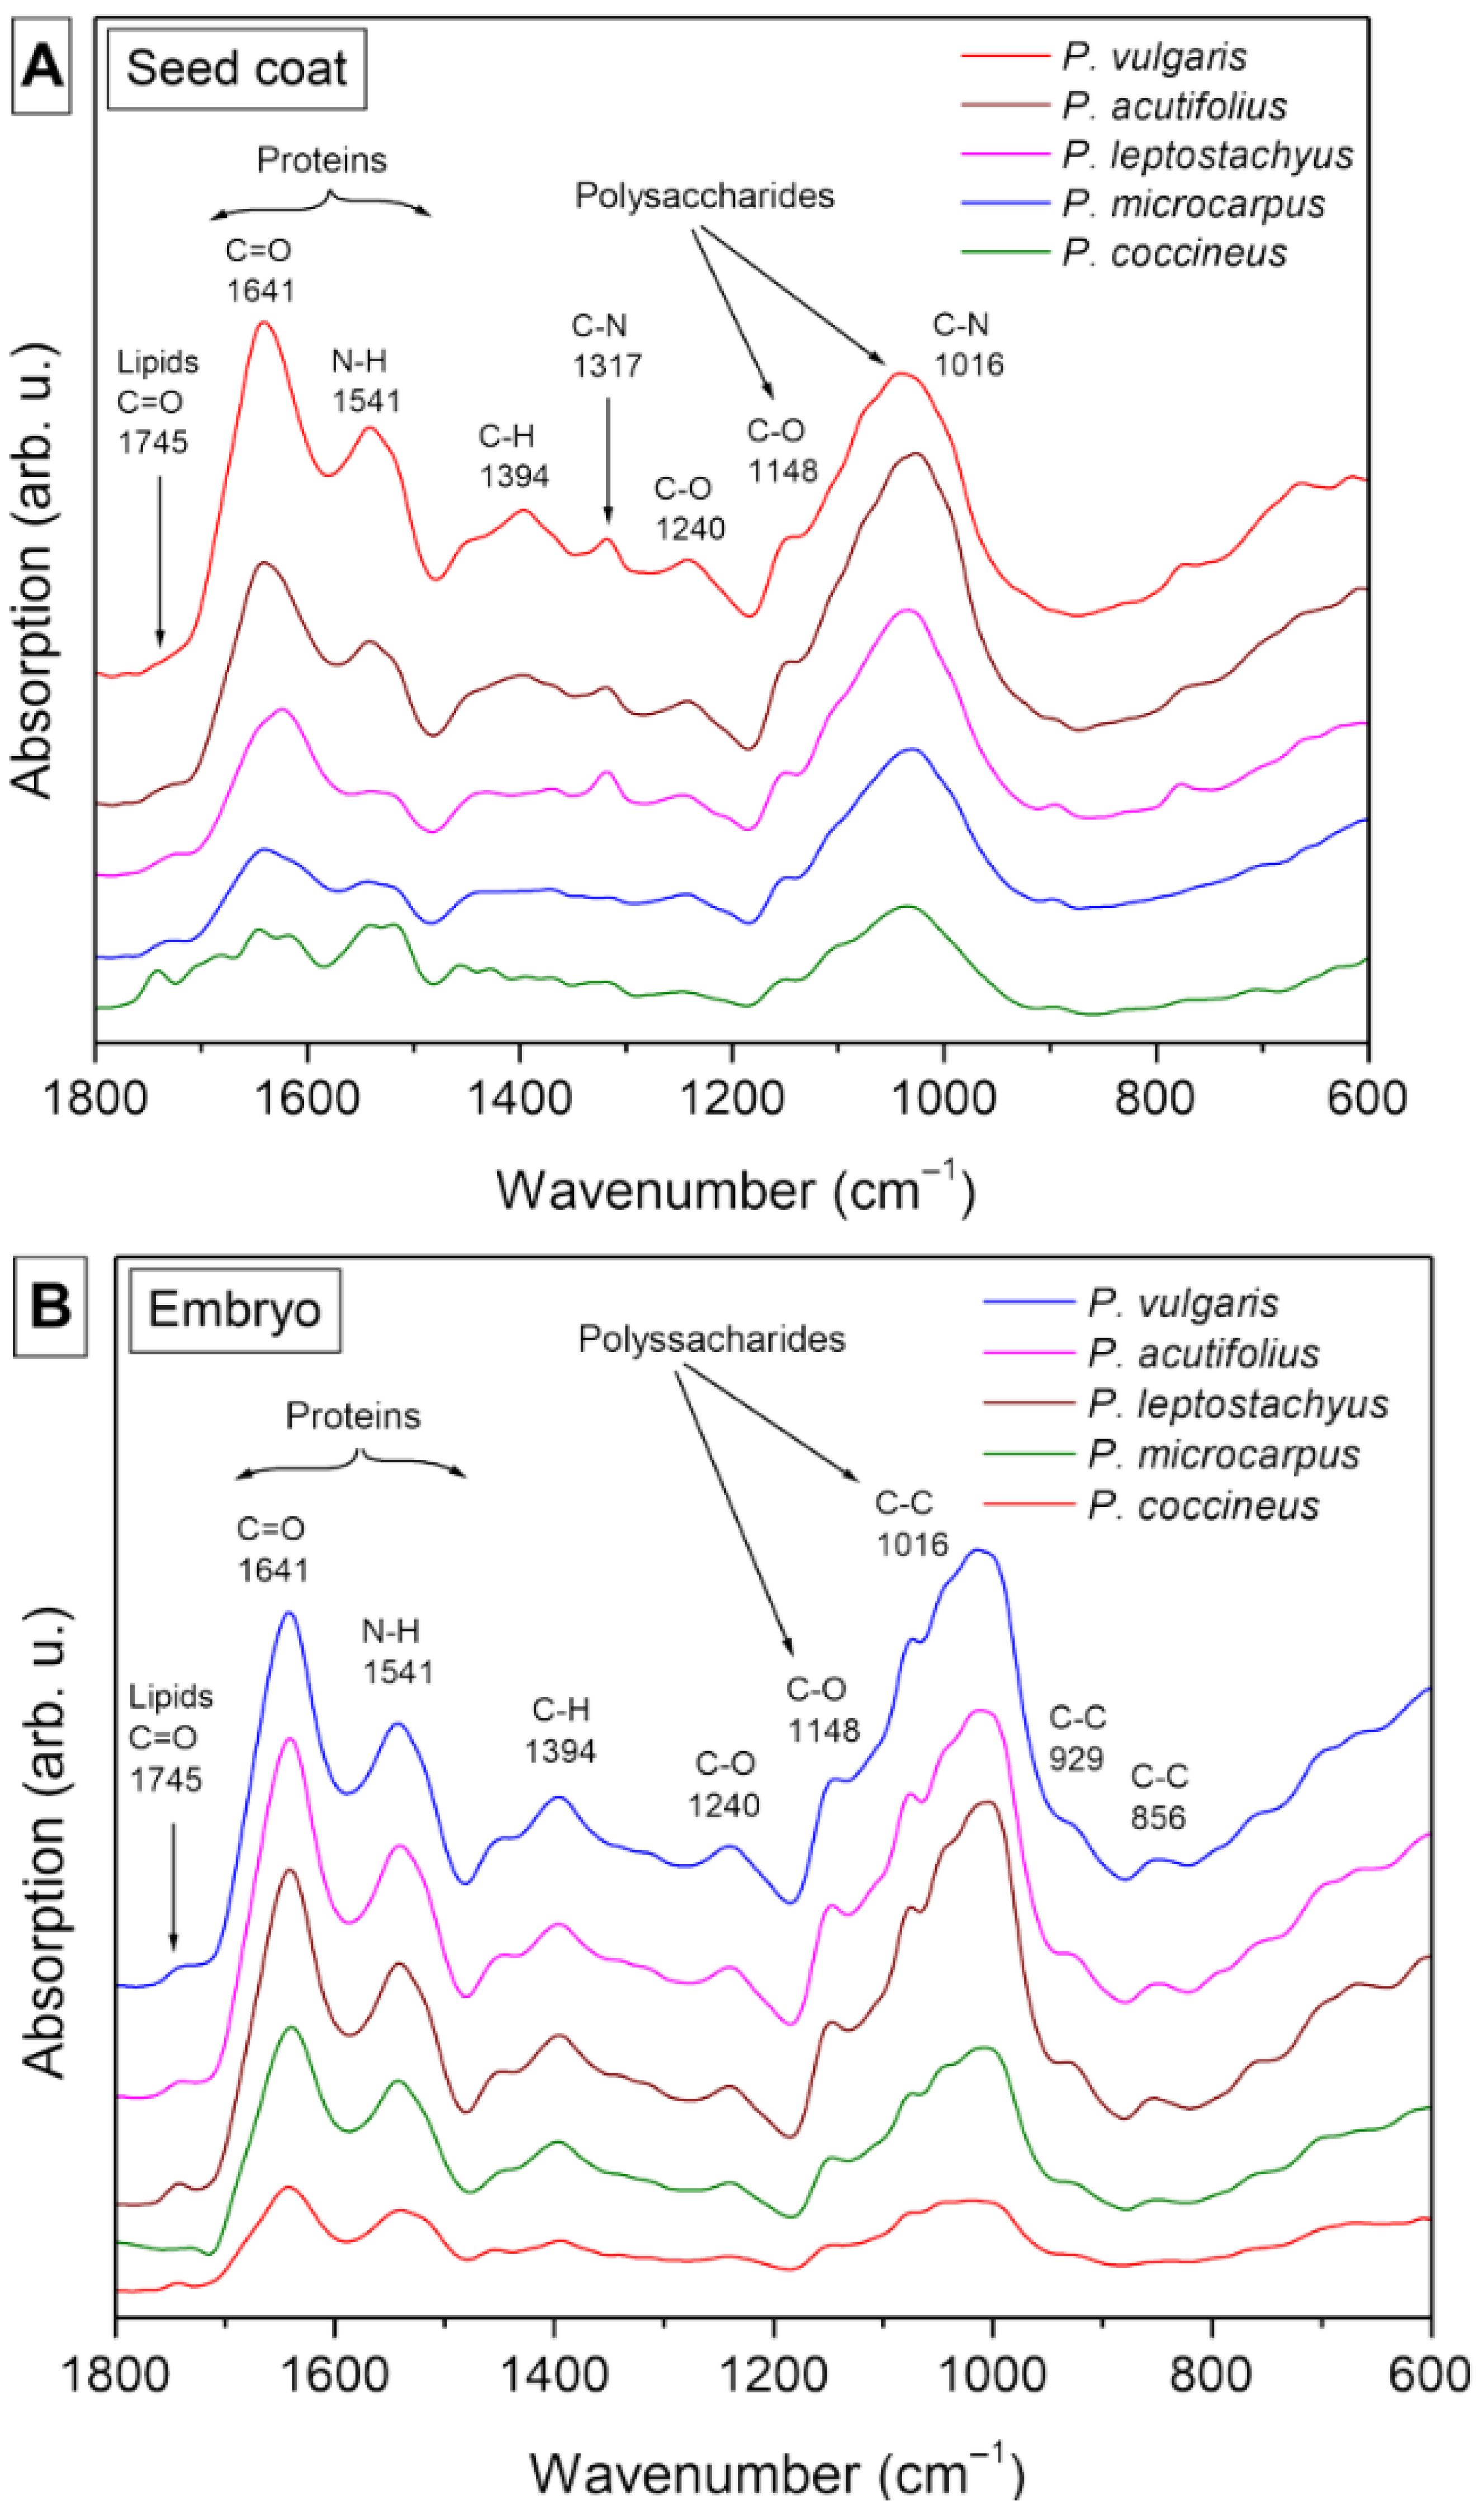
FTIR analysis of the seed coat and embryo of the wild bean species revealed characteristic absorption bands. A band at 1745 cm−1 corresponded to the carbonyl group (C=O) of lipids, while bands at 1641 and 1541 cm−1 were primarily associated with the C=O (amide I) and N-H (amide II) groups of proteins [26] (pp. 321–349) [27,28]. Additional bands at 1454, 1394, and 1240 cm−1 were attributed to C–O vibrations of the amide III group of proteins, and bands between 1148 and 856 cm−1 corresponded to C–O and C–C vibrations of polysaccharides. In the embryo, the band at 1317 cm−1 (C–N linkage of polysaccharides) was absent, and bands at 929 and 856 cm−1 were not detected in the seed coat (Table 7). Overall, both the seed coat and embryo of the analyzed species exhibited absorption bands corresponding to functional groups of lipids, proteins, and polysaccharides, as confirmed by FTIR (Figure 7A,B).
The seed coat and embryo of the analyzed species, as determined by FTIR, showed absorption bands linked to functional groups related to lipids, proteins, and polysaccharides (Figure 7A,B).
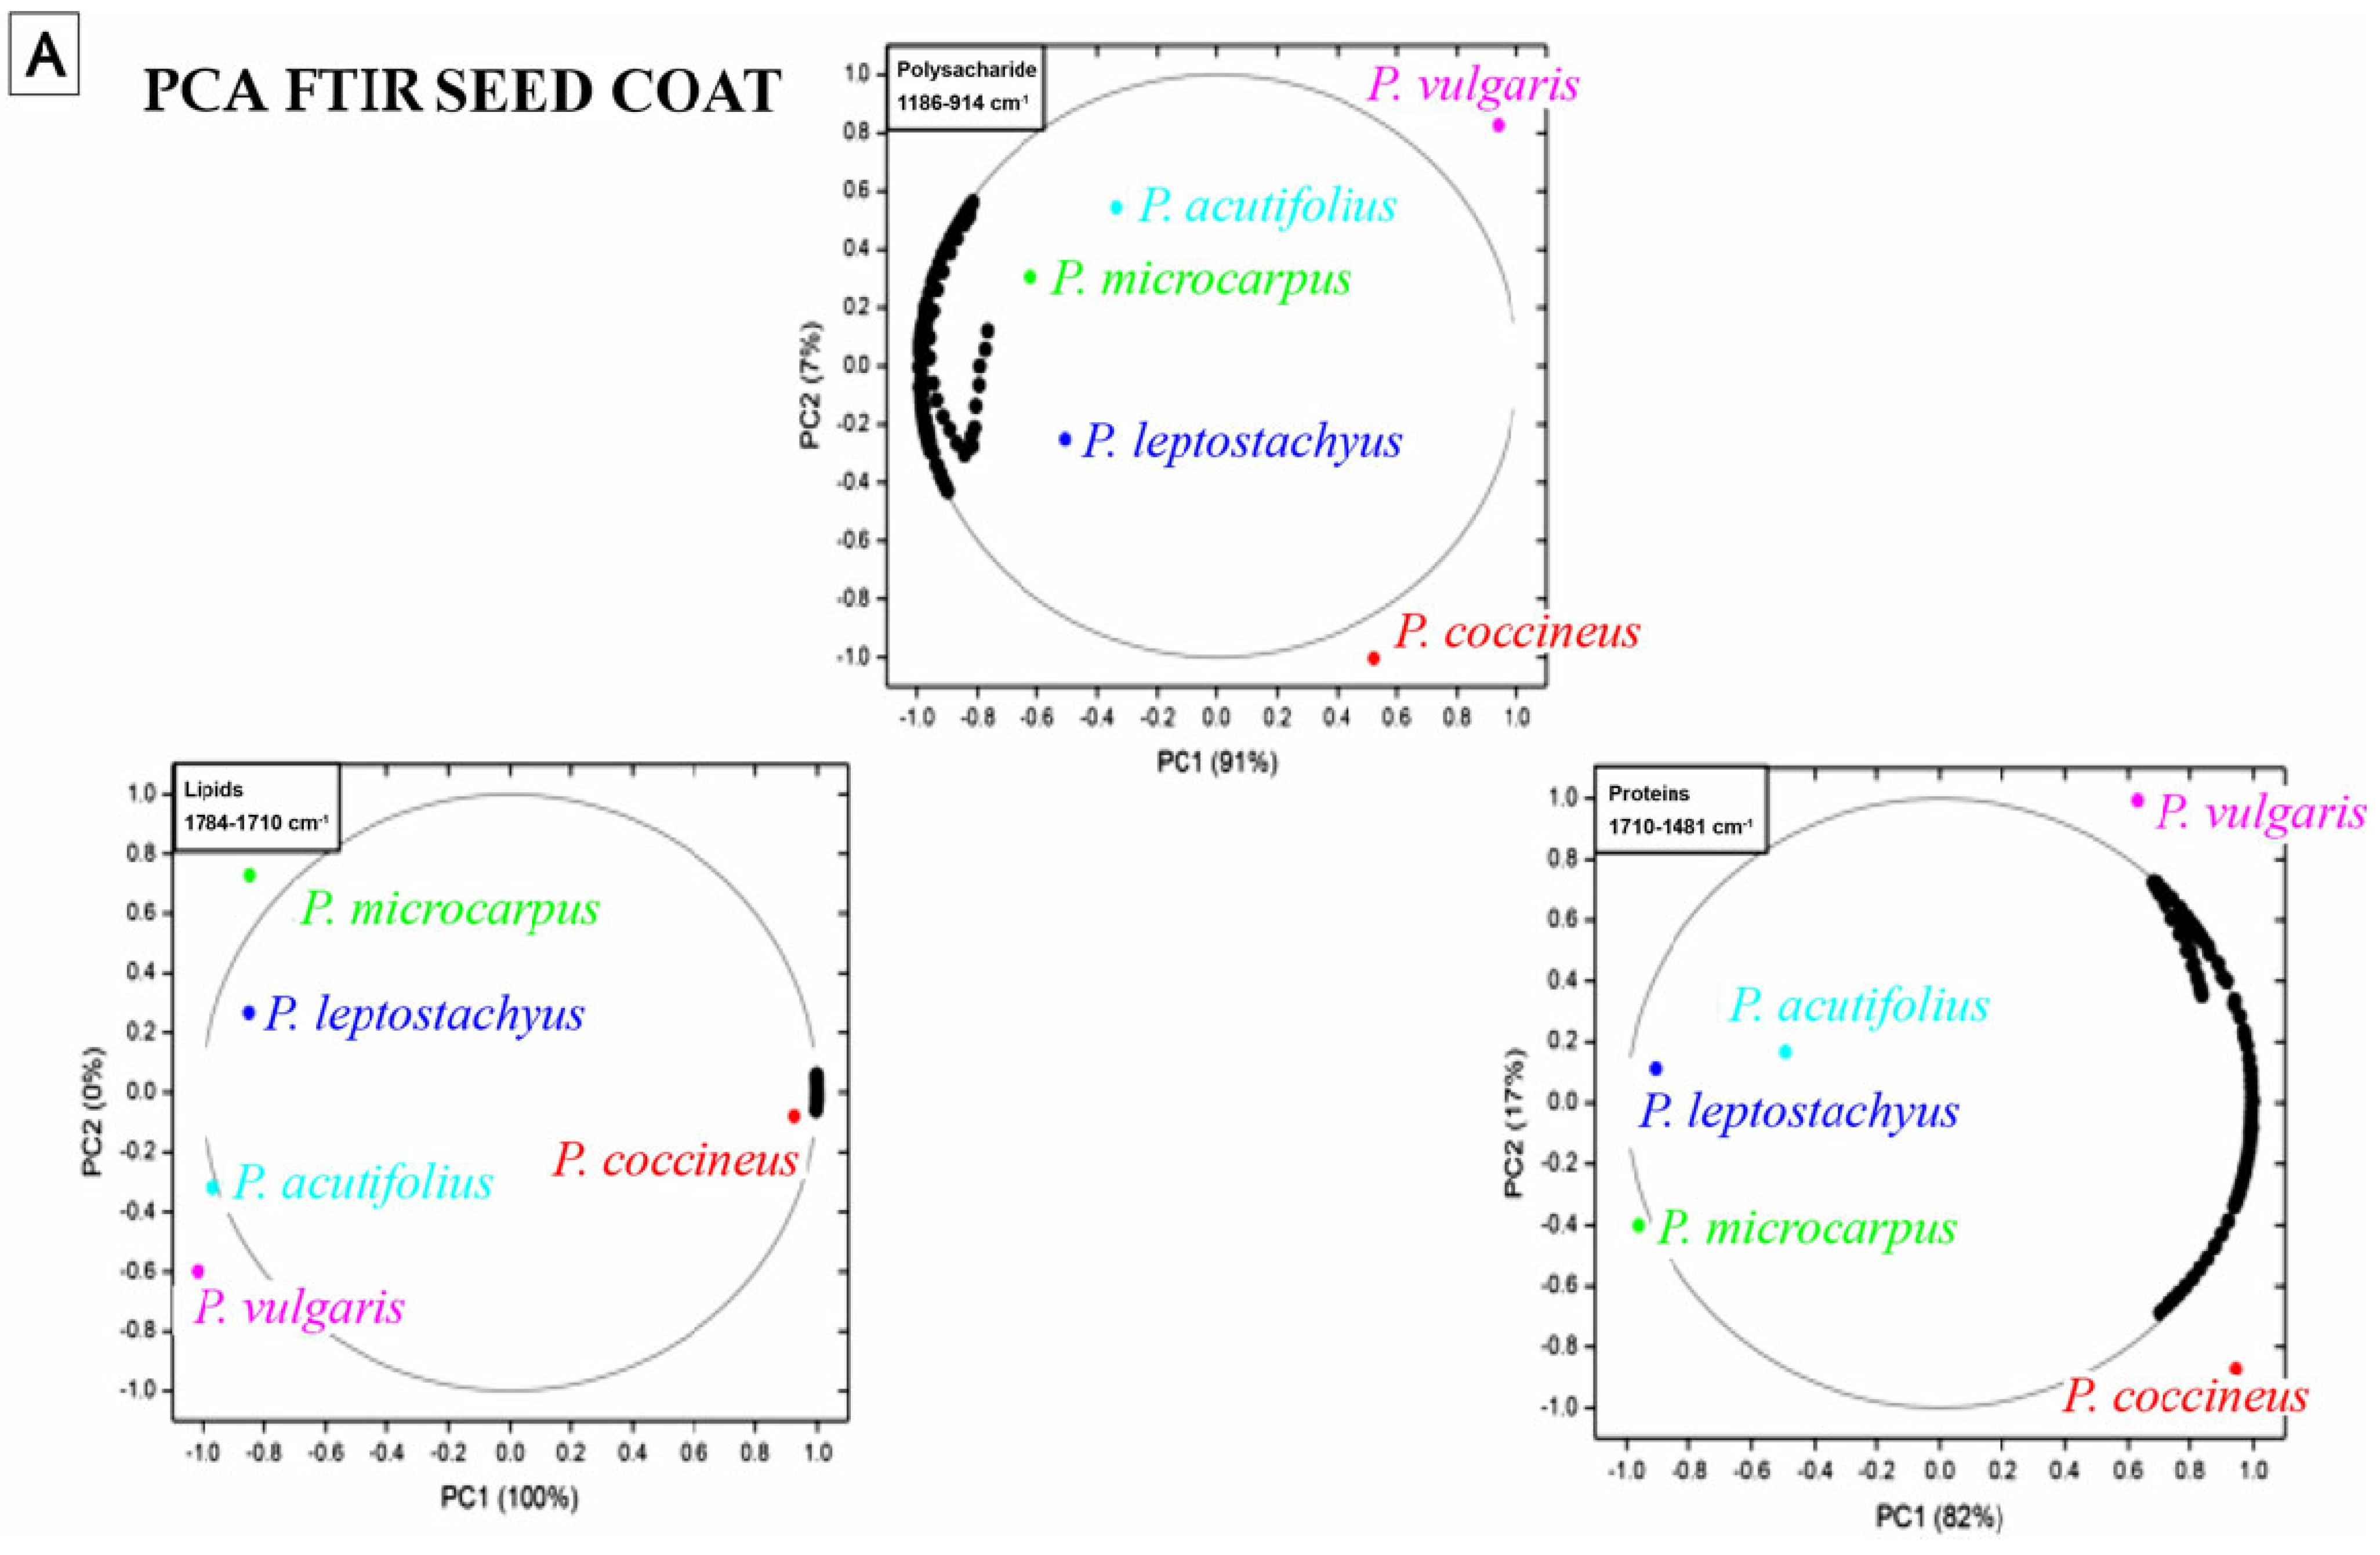
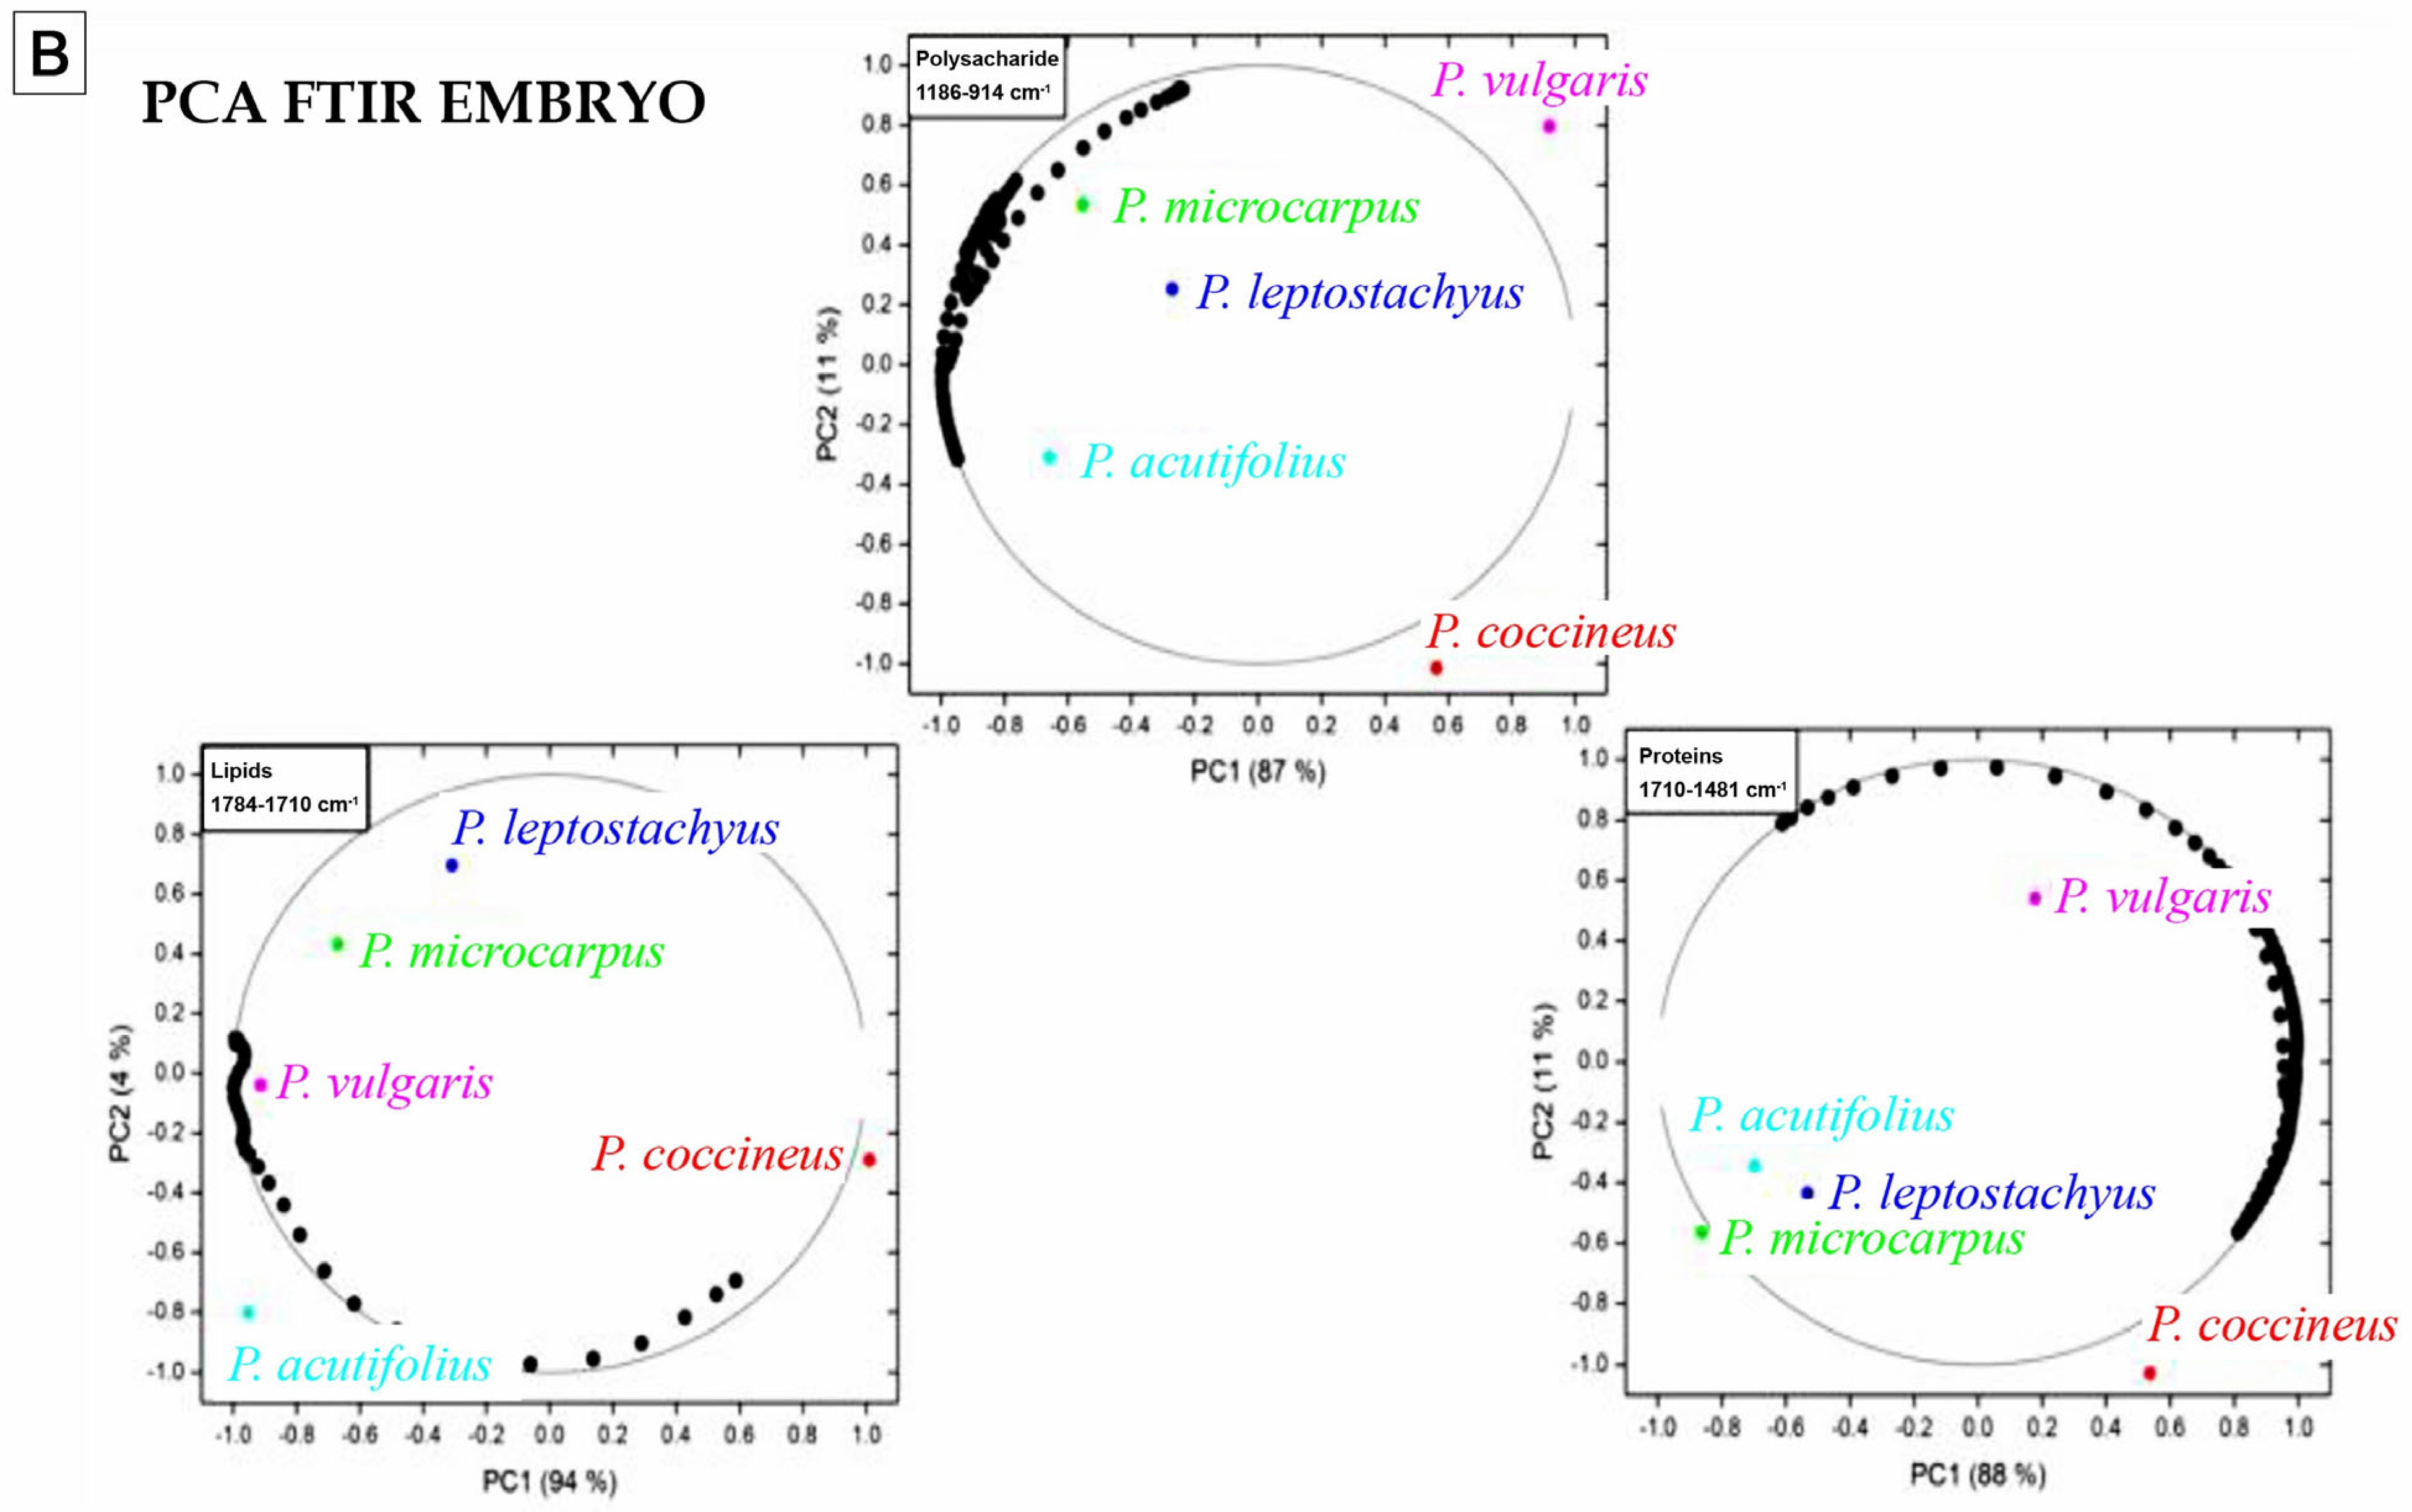
The FTIR spectra were processed using principal component analysis, with results shown in the biplot graphs for the seed coat and embryo. First, the PCA of the seed coat (Figure 8A) showed a relationship among the species P. leptostachyus, P. microcarpus, and P. acutifolius, which formed a group based on lipid presence; however, P. coccineus had the highest lipid content. The species P. leptostachyus, P. microcarpus, P. acutifolius, and P. vulgaris varied in their lipid levels, with P. coccineus exhibiting greater lipid abundance. Additionally, P. leptostachyus, P. microcarpus, and P. acutifolius showed a higher presence of polysaccharides compared to P. coccineus and P. vulgaris. Lastly, P. coccineus and P. vulgaris had higher protein levels than the other species. Concerning the embryo (Figure 8B), the principal component analysis displayed groupings and abundance patterns very similar to those observed in the seed coat.

4. Discussion

4.1. Morphometric Characterization in Qualitative Variables

Three wild species exhibited epigeal germination (P. vulgaris, P. microcarpus, and P. acutifolius), whereas P. coccineus and P. leptostachyus displayed hypogeal germination. In epigeal germination, the cotyledons emerge above the soil, initiating photosynthesis, which promotes faster growth and establishment. Hypogeal germination, in contrast, retains the cotyledons underground, providing a stable nutrient reserve and enhancing adaptation to adverse conditions and herbivory. Variation in flower coloration was observed. P. vulgaris and P. coccineus displayed white and red flowers, respectively, consistent with previous reports for wild species in Jalisco [15]. The other three species exhibited lilac and purple flowers. In P. coccineus, flowers can sometimes show both white and red, while P. vulgaris rarely exhibits purple in addition to white or red [29,30]. Flower colors are determined by pigments: anthocyanins generate pink to violet-blue hues, carotenoids and flavonoids produce yellow, red, and purple, and white may reflect the absence or presence of certain pigments. Flower color also mediates plant–pollinator interactions, with generalist pollinators favoring purple flowers and specialized pollinators preferring white or yellow [31]. Seed shape and coloration varied among species, aligning with reports from Guanajuato and Morelia [32], where wild beans exhibit olive, black, pink, brown, purple, and cream seeds. Seed coat color is associated with phenolic compounds such as tannins, flavonoids, and anthocyanins, which contribute to bright colors in red, pink, and black seeds [33,34].
In general, the Durango species displayed indeterminate growth, allowing continuous flowering and fruit production over an extended period [23], except for P. leptostachyus, which exhibits a determinate growth habit, ceasing growth after a certain point. The wild bean species in Tamaulipas follows the indeterminate growth as most in Durango [35].

4.2. Morphometric Characterization of Leaflets, Petiole, and Stem

Central leaflets of wild species ranged from 4.0 to 6.7 cm in length and 2.1–6.2 cm in width, with average values of 7.4 cm (length) and 5.7 cm (width) [29]. Comparable ranges were reported in Jalisco populations (4.3–8.0 cm length, 2.5–6.0 cm width) [15]. These differences likely reflect genetic adaptations to local environmental conditions. P. coccineus exhibited larger primordial leaves, central leaflets, and petioles, potentially due to its indeterminate growth pattern, which optimizes light capture and water utilization [36]. Although no significant differences in stem diameter were observed, P. vulgaris and P. acutifolius showed slightly larger stems, possibly due to genetic factors and favorable environmental conditions, which can enhance water and nutrient transport and support larger leaf development [37,38].

4.3. Morphometric Characterization in the Legume Pods

Regarding the length of the pods, Lépiz-Ildefonso et al. [17] found that wild populations had an average pod length of 7.1 cm. They can also be found in lengths ranging from 6.0 to 8.0 cm [39] (pp. 7–43). Meza-Vázquez et al. [15] reported values from 5.9 to 1.2 cm in length and a width of 0.4 to 0.6 cm. P. leptostachyus had the smallest pods in both length and width. In wild beans, the length of the pod apex averages about 0.4 cm [17].
Environmental conditions can influence the growth of pods [40], with nighttime temperature being one of the factors [41]. Seeds regulate certain aspects of fruit growth because they serve as a source of growth-regulating substances [42]. Gibberellins may be involved in pod growth [43], and their concentrations change during different stages of plant development, affecting the size of the fruit [44] and other hormones like ethylene [45]. Elements such as nitrogen, water, and photoassimilates are accumulated in various organs and then transported to the pods, likely influencing their size [46].

4.4. Morphometric Characterization in Seeds

Regarding the sizes of the seeds, wild beans typically measure 6.0 mm in length, 4.5 mm in width, and 2.3 mm in thickness (Lépiz-Ildefonso et al. [17]). For P. vulgaris, the thickness ranges from 0.22 to 0.31 mm (Peña-Valdivia et al. [18]), while our results show seeds of this species with a thickness of 2.80 mm. P. acutifolius has a length of about 4.20 mm and a width of 3.33 mm, although other studies report dimensions between 3.4 and 6.3 mm and 2.5 to 4.5 mm, respectively [47]. Plant development involves various environmental factors such as light, water, humidity, and soil nutrients that likely influence seed size [48], along with changes in resource availability [49] and environmental stresses like drought, salinity, and high temperatures [50]. These factors can affect development and growth, possibly leading to uneven distribution of nutrients during seed production. Additionally, the genetic variability within each species, passed to their offspring, could also influence seed size [51,52].
The highest number of pods is attributed to high temperatures, low relative humidity, minimal precipitation, and high solar radiation [53]. The number of pods per plant for the analyzed wild species was generally lower, except for P. microcarpus and P. leptostachyus, compared to what was reported by Meza-Vázquez et al. [15], who observed an average of 41 pods for P. vulgaris, 33 pods for P. coccineus, 104 pods for P. microcarpus, and 27 pods for P. leptostachyus; both studies identify P. microcarpus as the species with the highest pod count per plant. Possible competition that may occur during vegetative and reproductive phases during the photosynthesis process for resources such as light, water, and nutrients—used to produce leaves, stems, flowers, and fruits—could affect development and yield [40].
Regarding the number of seeds per pod, Zizumbo-Villarreal et al. [54] mention that wild species have an average of 5.8 seeds per pod. Specifically, for P. acutifolius, it is reported to have 2–10 seeds per pod [47]. In our study, P. microcarpus had the lowest number of seeds per pod (one seed), while P. coccineus ranged from one to three seeds, P. leptostachyus from 3 to 5 seeds, P. vulgaris from 4 to 8 seeds, and P. acutifolius from 7 to 9 seeds. No significant differences were observed between these two species (p > 0.05). High solar radiation, which promotes leaf development and photosynthesis, may lead to the development of more seeds per pod [55]. Besides being a species characteristic [56], as seen in P. microcarpus, it consistently produces one seed per pod [15,57]. Some species of the genus Phaseolus can self-pollinate and cross-pollinate, with variations depending on environmental conditions, pollinators, and the number of flowers.
The variation in the number of seeds per pod and their weight may result from limited nutrient flow from the mother plant to the seed [58]. The position of the ovule within the ovary [59], with the most distant ovules probably not fertilized by the pollen, and factors such as pollination efficiency significantly influence the chances of maturation, seed weight, and the overall yield of the offspring [60].
Regarding the weight of 100 seeds, data ranging from 6.0 to 14 g is mentioned for wild beans [39]. The species P. coccineus from Durango showed a weight of 8.71 g, compared with the 6.0–12 g reported by Ruiz-Salazar et al. [29] and 6.3 g reported by other authors [54]. We obtained a range of (1.23 to 8.7 g). The variation in seed weight could be related to the content of storage components such as starch, proteins, and lipids during the later stages of development [61] (pp. 1–23). These differences may be due to the genetic diversity of the species influenced by the environment [62] and probably to its hypogeal germination.
In the study, the total weight of the seeds per plant of the wild beans does not increase with the number of seeds per pod, probably due to their weight and small size. Characteristics of wild beans align with those described by Berrocal-Ibarra et al. [63].
Regarding the number of seeds per plant, Flores de la Cruz et al. [64] report that in the wild bean ‘S13’, there are 1120 seeds per plant grown in pots. A larger number of seeds per plant probably helps ensure its survival in natural environments [65] (p. 175). Probably, its small seeds can mimic and avoid being eaten by different herbivores. The high production of seeds will allow for favorable germination and growth under optimal conditions [66]. However, plants produce more flowers and ovules than the number of fruits and seeds [67]. Possibly, many flowers fall off during the plant’s development due to factors such as lack of nutrients, competition for resources, adverse environmental conditions, and herbivory, which could affect the physiological and biochemical development of plants, ultimately impacting the total weight of seeds per plant [68].
In the case of wild beans from the state of Durango, smaller pods produce a greater number of seeds per plant, as observed in the species P. leptostachyus and in the wild bean S13 [64,69]. P. leptostachyus has a determined growth; when its vegetative growth stops, it likely directs its energy and nutrient reserves toward producing pods and fruits due to its hypogeal germination.
Phaseolus coccineus is a species that, during its phenological development, exhibits abortive processes, which may be due to the development of fewer seeds [70] or the lack of pollinators [71]. Ovules closer to nutrient sources may be more likely to mature than those farther away, and probably not all ovules are pollinated [72] (pp. 333–338). Additionally, environmental factors such as high temperatures could likely affect pollen grain development and cause abortions [73].

4.5. Principal Component Analysis and Clustering Analysis of Quantitative Variables in Wild Phaselous

PCA revealed that PC1 and PC2 were correlated with morphometric variables. PC1 was influenced by central leaflet length, petiole length, and pod width, while PC2 correlated with seed length, seed width, stem diameter, and total seed weight per plant. Clustering identified three groups: The first group consists of the species P. microcarpus and P. leptostachyus, both of which displayed lower values for primary leaf length, central leaflets, seed length and width, pod apex length, and 100-seed weight, along with a higher number of pods. The second group includes P. coccineus and P. vulgaris, which have larger primary leaves, central leaflets, petioles, seed weight, and fewer pods per plant. P. acutifolius is grouped with these two species, sharing greater similarity in pod width, length, and seed size. The clustering of these species likely reflects shared evolutionary ancestry or similar ecological niches that favor larger leaf surface area and seed size, advantageous traits in intermediate-shade forest margins, and possibly for storing more nutrients due to their larger seeds [74]. These traits could enhance optimal establishment, growth, and adaptation.

4.6. Canonical Correspondence Analysis (CCA) Showing Relationship Between Morphometric Characteristics and Environmental Variables of Provenance

CCA indicated that altitude, temperature, and precipitation influenced morphometric traits. Altitude affected total seeds per plant, total seed weight, seed width, and 100-seed weight. Species collected at higher altitudes (P. coccineus, P. leptostachyus, and P. acutifolius) exhibited higher values for these traits, suggesting adaptation to extreme conditions. Environmental factors appear to influence the growth of bean pods and seeds [40,41]. Low temperatures favored the development of longer and wider pods and thicker seeds, as observed in P. vulgaris, while low precipitation affected the thicker pod, as observed in the species P. microcarpus.

4.7. Analysis of the Coefficient of Variation

High variability (CV > 50%) was observed for pod apex length, number of seeds per pod, seed length and width, 100-seed weight, and total seed weight per plant, likely reflecting genetic diversity and environmental interactions (water, light, temperature, soil nutrients, altitude, radiation) in which they grow and develop.
Various studies have demonstrated the genetic diversity found in wild bean species [14,32,75]. As environmental conditions change, individuals exhibit variations in morphological and life history traits [76,77,78]. The outcome depends on factors such as genetic variability, interactions between species, life history, and intensity and direction of environmental change [79,80]. Studies on Mediterranean species have shown their ability to undergo morphological, physiological, phenological, and reproductive changes in response to variations in light [81], water [82], and nutrients [83].

4.8. Phenological Characterization

Differences in the phenological cycle of wild bean species are reported in the literature. Meza-Vázquez et al. [15] report a biological cycle of 126 days for P. vulgaris, while Flores de la Cruz et al. [64] report 137 days. For the species P. coccineus, a biological cycle of 148 days is reported [15]. Vargas-Vázquez et al. [84] mention that P. coccineus plants exhibit phenological differences, with some having a short cycle (123–144 days) and others a long cycle (165 days). P. vulgaris, P. coccineus, and P. microcarpus are species that continue to grow and develop over a long period, likely due to their indeterminate growth, whereas P. leptostachyus has a shorter cycle in comparison to these species.
Fernández et al. [23] (pp. 62–65) mention that the climatic factors most affecting the duration of bean development stages are light, temperature, growth habit, and genotype. Sometimes, the reproductive phase can overlap and occur simultaneously with other stages of this phase; for example, flowering and pod formation or pod filling, which could contribute to a shorter phenological cycle, as seen in P. acutifolius. This may be a strategy to ensure its survival. The occurrence and duration of phenological stages are determined by the species’ genetic characteristics, which are modified and influenced by the current climatic factors [85] (p. 10). A plant may grow differently depending on climatic conditions [86] (p. 124).

4.9. Nutritional Composition Analysis

The seed coat and embryo of the species analyzed by FTIR showed the presence of functional groups related to lipids, proteins, and carbohydrates. Few studies have analyzed the nutritional composition of wild species. A 28% protein content is reported in wild beans S13 [87]. Quiroz-Sodi et al. [88] mention that in the seed of wild P. vulgaris from Querétaro, there is a protein content of 0.61 μg/mL to 0.62 μg/mL. The presence of polysaccharides has been reported in the embryo of wild P. coccineus, showing a starch content of 53% [89]. The accumulation of biomass and nitrogen in seeds could be involved in the protein content [46]. Differences in polysaccharide, lipid, and protein content are likely due to the genetics of the species and how it interacts with environmental conditions (light, temperature, pH), as well as crop management practices (fertilization, water availability, and pest and disease control) [90].

5. Conclusions

This study characterized five wild bean species from Durango, Mexico, through morphometric, phenological, and nutritional analyses. The findings are relevant for plant breeding, agroecological adaptation, and food security. Wild bean species exhibit traits that can enhance cultivation, such as germination types that promote rapid seedling growth and facilitate colonization of new habitats, ensuring adaptation to challenging environments. Flower coloration attracts a diverse range of pollinators, supporting seed production and the persistence of subsequent generations, as observed in P. leptostachyus. Species such as P. acutifolius and P. vulgaris, which produce a higher number of seeds per pod, and P. acutifolius, which exhibits greater total seed weight per plant and a shorter developmental cycle, are particularly valuable for agronomic applications. The nutritional content of proteins, lipids, and polysaccharides in the seed coat and embryo of P. coccineus and P. leptostachyus also presents potential benefits for human nutrition.
These results provide critical information for biodiversity research, species identification, and classification. Future studies incorporating molecular marker analyses alongside morphological data, as well as detailed profiling of nutrients and secondary metabolites in seeds, leaves, and other plant parts, would allow the development of comprehensive species-specific fingerprints. The baseline data generated here underscore the potential of these wild beans for crop improvement, food security, and biodiversity conservation.

Author Contributions

Species collection, field work and data collection, D.T.-M.; manuscript analysis and funding, Y.H.-A.; project idea and funding, G.A.-I.; data compilation and analysis, M.M.C.-R.; nutritional characterization, M.R.-L.; manuscript analysis, K.B.-T. All authors have read and agreed to the published version of the manuscript.

Funding

This study was funded by the Instituto Politécnico Nacional through projects SIP 20210637 and 20220754 (Y.H.-A.) and 20210263 and 20201733 (G.A.-I.).

Institutional Review Board Statement

Not applicable.

Data Availability Statement

All data generated and analyzed are included in the published article.

Acknowledgments

The authors thank the Secretaría de Ciencia, Humanidades, Tecnología e Innovación (SECIHTI) for supporting a doctoral scholarship (280528) awarded to one of the authors (D.T.-M.); to the Instituto Politécnico Nacional for supporting this research; and to the MDPI Reviewers for their comments that contributed positively to improving the manuscript.

Conflicts of Interest

The authors declare that they have no financial or personal conflicts of interest regarding the information, data presentation, and results of this article.

References

  1. Arias, J.D.; Chavero, A.; Olavarría, E.; Vigil, J.M.; Zárate, J. México a Través de Los Siglos. In Compendio de la obra de Vicente Riva Palacio; Océano: Barcelona, España, 1999; p. 272. [Google Scholar]
  2. Maphosa, Y.; Jideani, V.A. The role of legumes in human nutrition. In Functional Food—Improve Health Through Adequate Food; Hueda, M.C., Ed.; IntechOpen: London, UK, 2017; p. 318. [Google Scholar] [CrossRef]
  3. Singh, A.; Schöb, C.; Iannetta, P.P.M. La fijación de nitrógeno por frijol común en mezclas de cultivos se ve influenciada por la tasa de crecimiento de las especies asociadas. BMC Plant Biol. 2023, 23, 253. [Google Scholar] [CrossRef]
  4. Villarreal-Villagran, V.H.; Muruaga-Martínez, J.S.; Vargas-Vázquez, M.L.P.; Mayek-Pérez, N.; Hérnandez-Delgado, S. Relaciones filogenéticas de especies de Phaseolus de México con base en marcadores de ADN cloroplástico. Polibotánica 2022, 27, 35–51. [Google Scholar] [CrossRef]
  5. Delgado-Salinas, A.; Gama-López, S. Diversidad y distribución de los frijoles silvestres en México. Rev. Digit. Univ. 2015, 16, 1–8. [Google Scholar]
  6. Bitocchi, E.; Rau, D.; Bellucci, E.; Rodríguez, M.; Murgia, M.L.; Gioia, T.; Santo, D.; Nanni, L.; Attene, G.; Papa, R. Beans (Phaseolus spp.) as a model for understanding crop evolution. Front. Plant Sci. 2017, 8, 722. [Google Scholar] [CrossRef]
  7. González-Elizondo, M.S.; González-Elizondo, M.; Márquez-Linares, M.A. Vegetación y Ecorregiones de Durango; Instituto Politécnico Nacional-Plaza y Valdés: Mexico City, Mexico, 2007; p. 220. [Google Scholar]
  8. González-Elizondo, M.; González-Elizondo, S.; Herrera-Arrieta, Y. Listados Florísticos de México. IX. Flora de Durango; Instituto de Biología, Universidad Nacional Autónoma de México: Mexico City, Mexico, 1991; p. 52. [Google Scholar]
  9. Rzedowsky, J. Vegetación de México, México: Limusa, 1978, p. 432—“Vegetación Potencial 1:4000 000. IV.8.2. Atlas Nacional de México” [en Línea]. 1990, vol. II. México: Instituto de Geografía, UNAM. Available online: http://www.conabio.gob.mx/informacion/gis/ (accessed on 6 September 2025).
  10. Mahuk, G.S.; Jara, C.; Cajiao, C.; Beebe, S. Source of resistance to angular leaf spot (Phaeoisariopsis griseola) in common bean core collection, wild Phaseolus vulgaris and secondary gene pool. Euphytica 2003, 130, 303–313. [Google Scholar] [CrossRef]
  11. Espinosa-Alonso, L.G.; Lygin, A.; Widholm, J.M.; Valverde, M.E.; Paredes-López, O. Polyphenols in wild and weedy Mexican common beans (Phaseolus vulgaris L.). J. Agric. Food Chem. 2006, 54, 4436–4444. [Google Scholar] [CrossRef]
  12. Baez-González, A.D.; Acosta-Díaz, E.; Padilla-Ramírez, J.S.; Almeyda-León, I.H.; Zavala-García, F. Estado de conservación de Once Especies de Frijol Silvestre (Phaseolus spp. Fabaceae) en el Noreste de México. Rev. Mex. Cienc. Agríc. 2019, 10, 417–429. [Google Scholar] [CrossRef]
  13. Nuñez-Colín, C.A.; Escobedo-López, D. Caracterización de germoplasma vegetal: La piedra angular en el estudio de los recursos fitogenéticos. Acta Agríc. Pecu. 2015, 1, 1–6. [Google Scholar]
  14. Vidal-Barahona, A.; Lagunes-Espinoza, L.C.; Valadez-Moctezuma, E.; Ortiz-García, C. Variabilidad morfológica y molecular de cultivares criollos y mejorados de frijol común en Tabasco, México. Rev. Fitotec. Mex. 2006, 29, 273–281. [Google Scholar] [CrossRef]
  15. Meza-Vázquez, K.E.; Lépiz-Ildefonso, R.; López-Alcocer, J.J.; Morales-Rivera, M.M. Caracterización morfológica y fenológica de especies silvestres de frijol (Phaseolus). Rev. Fitotec. Mex. 2015, 38, 17–28. [Google Scholar] [CrossRef]
  16. Acosta-Díaz, E.; Hernández-Torres, I.; Amador-Ramírez, M.D.; Padilla-Ramírez, J.S.; Zavala-García, F.; Baez-González, A. Collection and characterization of wild species of Phaseolus (Fabaceae) in northeastern Mexico for ex situ conservation. Plant Ecol. Evol. 2016, 148, 119–127. [Google Scholar] [CrossRef]
  17. Lépiz Ildefonso, R.; López Alcocer, J.J.; Sánchez González, J.J.; Santacruz Ruvalcaba, F.; Nuño Romero, R.; Rodríguez Guzmán, E. Características morfológicas de formas cultivadas, silvestres e intermedias de frijol común de hábito trepador. Rev. Fitotec. Mex. 2010, 33, 21–28. [Google Scholar] [CrossRef]
  18. Peña-Valdivia, C.B.; García-Nava, R.; Aguirre, R.J.R.; Trejo, C. The effects of high temperature on dormancy and hypocotyl-root growth of wild common bean (Phaseolus vulgaris L.). Seed Sci. Technol. 2002, 30, 231–248. [Google Scholar]
  19. Lot, A.; Chiang, F. Manual de Herbario: Administración y Manejo de Colecciones Técnicas de Recolección y Preparación de Ejemplares Botánicos; Consejo Nacional de la Flora de México, A.C.: Ciudad de México, Mexico, 1986; p. 142. [Google Scholar]
  20. Instituto Nacional de Estadística y Geografía. Aspectos Geográficos. Available online: https://www.inegi.org.mx/contenidos/app/areasgeograficas/resumen/resumen_10.pdf (accessed on 6 September 2025).
  21. Pavela, R. History, presence and perspective of using plant extracts as commercial botanical insecticides and farm products for protection against insects—A review. Plant Protect. Sci. 2016, 52, 229–241. [Google Scholar] [CrossRef]
  22. Al-Shuraym, A. The impact of the onion-garlic extracts to control date palm aphids in Saudi Arabia. J. Saudi Soc. Agric. Sci. 2022, 21, 546–551. [Google Scholar] [CrossRef]
  23. Fernández, F.; Gepts, P.; López, M. Etapas de desarrollo en la planta de frijol. In Frijol: Investigación y Producción; Lopez, M., Fernandez, F., Schoonhoven, A., Eds.; CIAT: Palmira, Colombia, 1991; pp. 61–78. [Google Scholar]
  24. Franco, T.L.; Hidalgo, R. Análisis Estadístico de Datos de Caracterización Morfológica de Recursos Fitogenéticos; Boletín Técnico No. 8; Instituto Internacional de Recursos Fitogenéticos (IPGRI): Cali, Colombia, 2003; pp. 11–25. [Google Scholar]
  25. Ligarreto, M.G.A.; Martínez, W.O. Variabilidad genética en frijol común (Phaseolus vulgaris L.). Análisis de variables morfológicas y agronómicas cuantitativas. Agron. Colomb. 2002, 19, 69–80. [Google Scholar]
  26. Mendelsoh, R.; Mantsch, H.H. Protein-Lipid Interactions; Watts, A., De Pont, J.J.H.H.M., Eds.; Elsevier: Amsterdam, The Netherlands, 1986; pp. 321–349. [Google Scholar]
  27. Tamm, L.K.; Tatulian, S.A. Infrared spectroscopy of proteins and peptides in lipid bilayers. Q. Rev. Biophys. 1997, 30, 365–429. [Google Scholar] [CrossRef]
  28. Arrondo, J.L.R.; Goñi, F.M. Structure and dynamics of membrane proteins as studied by infrared spectroscopy. Prog. Biophys. Mol. Bio. 1999, 72, 367–405. [Google Scholar] [CrossRef]
  29. Ruíz Salazar, R.; Hernández Delgado, S.; Vargas Vázquez, M.L.P.; Mayek Pérez, N. Estado actual de los recursos genéticos de Phaseolus coccineus (Fabaceae) en México. Bol. Soc. Argent. Bot. 2021, 56, 289–305. [Google Scholar] [CrossRef]
  30. Freytag, G.F.; Debouck, D.G. Taxonomy, Distribution, and Ecology of the Genus Phaseolus (Leguminosae–Papilionoideae) in North America, México and Central America; Sida Botanical Miscellany 23; Botanical Research Institute of Texas: Forth Worth, TX, USA, 2002; p. 9. [Google Scholar]
  31. Reverte, S.; Retana, J.; Gómez, J.M.; Bosch, J. Pollinators show flower colour preferences but flowers with similar colours do not attract similar pollinators. Ann. Bot. 2016, 2, 249–257. [Google Scholar] [CrossRef]
  32. Payró de la Cruz, E.; Gepts, P.; Colunga Garcia, M.P.; Zizumbo Villareal, D. Spatial distribution of genetic diversity in wild populations of Phaseolus vulgaris L. from Guanajuato and Michoacán, México. Genet. Resour. Crop Evol. 2005, 52, 589–599. [Google Scholar] [CrossRef]
  33. Díaz, A.M.; Caldas, G.V.; Blair, M.W. Concentrations of condensed tannins and anthocyanins in common bean seed coats. Food Res. Int. 2010, 43, 595–601. [Google Scholar] [CrossRef]
  34. Salinas-Moreno, Y.; Rojas-Herrera, L.; Sosa-Montes, E.; Pérez-Herrera, P. Composición de antocianinas en variedades de frijol negro (Phaseolus vulgaris L.) cultivadas en México. Agrociencia 2005, 39, 385–394. [Google Scholar]
  35. Instituto Nacional de Investigaciones Forestales, Agrícolas y Pecuarias (INIFAP). Available online: http://www.inifapcirne.gob.mx/Biblioteca/Publicaciones/976.pdf (accessed on 6 September 2025).
  36. Salinas-Ramírez, N.; Escalante-Estrada, J.S.; Rodríguez-González, M.T.; Sosa-Montes, E. Yield, nutritional quality and profitability of green beans of rainfed in San Pablo Ixayoc, Mexico. Rev. Chapingo. Ser. Hortic. 2013, 19, 333–342. [Google Scholar] [CrossRef]
  37. García, M.; Watson, C.E. Herencia de la resistencia al acame de raíces en maíz dulce (Zea mays L). Rev. Científica UDO Agrícola 2003, 3, 24–33. [Google Scholar]
  38. Lagunes-Fortiz, E.; Villanueva-Verduzco, C.; Lagunes-Fortiz, E.R.; Zamora-Macorra, E.; Ávila-Alistac, N.; Villanueva-Sánchez, E. La densidad de siembra en el crecimiento de la verdolaga. Rev. Mex. Cienc. Agríc. 2021, 12, 1–13. [Google Scholar] [CrossRef]
  39. Gepts, P.L.; Debouck, D.G. Origin, domestication, and evolution of the common bean (Phaseolus vulgaris L.). In Common Beans: Research for Crop Improvement; Schoonhoven, A.V., Voysest, O., Eds.; CAB International y CIAT: Wallingford, UK, 1991; pp. 7–43. [Google Scholar]
  40. Díaz, M.F. Crecimiento de la vaina y semillas del frijol. Turrialba 1990, 40, 553–561. [Google Scholar]
  41. Oliker, M.; Poljakoff-Mayber, A.; Mayer, A.M. Changes in weight, nitrogen accumulation, respiration and photosynthesis during growth and development of seeds and pods of Phaseolus vulgaris. Am. J. Bot. 1978, 65, 366–371. [Google Scholar] [CrossRef]
  42. Nitsch, J.P. Plant Hormones in the Development of Fruits. Q. Rev. Biol. 1952, 27, 33–57. [Google Scholar] [CrossRef]
  43. Suge, H.; Flores, G.D.M. Changes of gibberellins during seed and pericarp development in common bean with special reference to abortion. J. Crop Sci. 1977, 46, 371–378. [Google Scholar] [CrossRef][Green Version]
  44. Skene, K.G.; Carr, D.J. A quantitative study of the gibberellin content of seeds of Phaseolus vulgaris at different stages in their development. Aust. J. 1961, 14, 1–13. [Google Scholar] [CrossRef]
  45. Alcántara Cortés, S.J.; Acero Godoy, J.; Alcántara Cortés, J.D.; Sánchez Mora, R.M. Principales reguladores hormonales y sus interacciones en el crecimiento vegetal. Nova 2019, 17, 109–129. [Google Scholar] [CrossRef]
  46. Granados, A.R.; Ortega-Delgado, M.L.; Zárate, G. Influencia del peso seco y contenido de nitrógeno de los órganos de la planta en el rendimiento y contenido de proteína del grano de frijol Phaseolus vulgaris L. Chapingo 1987, 54, 47–52. [Google Scholar]
  47. Nabhan, G.P.; Felger, R.S. Teparis in southwestern North America. Econ. Bot. 1978, 32, 3–19. [Google Scholar] [CrossRef]
  48. Fenner, M. Environmental influences of seed size and composition. Hortic. Rev. 1992, 13, 183–213. [Google Scholar]
  49. Eriksson, O. Seed size variation and its effect on germination and seedling performance in the clonal herb Convallaria majalis. Acta Oecol. 1999, 20, 61–66. [Google Scholar] [CrossRef]
  50. Pitelka, L.F.; Thayer, M.E.; Hansen, S.B. Variation in achene weight in Aster acuminatus. Can. J. Bot. 1983, 61, 1415–1420. [Google Scholar] [CrossRef]
  51. Meyer, S.E. Ecological correlates of achene mass variation in Chrysothamnus nauseosus (Asteraceae). Am. J. Bot. 1997, 84, 471–477. [Google Scholar] [CrossRef]
  52. Susko, D.J.; Lovett-Doust, L. Patterns of seed mass variation and their effects on seedling traits in Alliaria petiolata (Brassicaceae). Am. J. Bot. 2000, 87, 56–66. [Google Scholar] [CrossRef]
  53. Kulandaivelu, R.; Morachan, Y.B. Influencia del clima sobre el rendimiento de vainas y el crecimiento de maní. Turrialba 1983, 33, 332–334. [Google Scholar]
  54. Zizumbo-Villarreal, D.; Colunga-García Marín, P.; Payró de la Cruz, E.; Delgado-Valerio, P.; Gepts, P. Population structure and evolutionary dynamics of wild-weedy-domesticated complexes of common bean in a Mesoamerican region. Crop Sci. 2005, 45, 1073–1083. [Google Scholar] [CrossRef]
  55. Enriquez, A.G. Mejoramiento Genético Sobre Otros Factores Limitantes de la Producción de Frijol, Diferentes de Enfermedades e Insectos; CR Centro Agronómico Tropical de Investigación y Enseñanza (CATIE), Departamento de Cultivos y Suelos Tropicales Costa Rica: Turrialba, Costa Rica, 1977; pp. 15–17. [Google Scholar]
  56. Tapia, B.H. Mejoramiento Varietal de Frijol en Nicaragua; Instituto de Ciencias Agropecuarias (ICSA): Managua, Nicuaraga, 1987; pp. 4–11. [Google Scholar]
  57. Lépiz Ildefonso, R.; Ramírez Delgadillo, R. Los Parientes Silvestres del Frijol Común en el Occidente de México; Universidad de Guadalajara: Guadalajara, Mexico, 2010; p. 17. [Google Scholar]
  58. Ambika, S.; Manonmani, V.; Somasundar, G. Review on effect of seed size on seedling vigor and seed yield. Res. J. Seed Sci. 2014, 7, 31–38. [Google Scholar] [CrossRef]
  59. Nakamura, R.R. Seed abortion and seed size variation within fruit of Phaseolus vulgaris: Pollen donor and resource limitation effects. Am. J. Bot. 1988, 75, 1003–1010. [Google Scholar] [CrossRef]
  60. Venable, D.L. Size-number trade-offs and the variation of seed size with plant resource status. Am. Natur. 1992, 140, 287–304. [Google Scholar] [CrossRef]
  61. Matilla, A.J. Desarrollo y germinación de las semillas. In Fundamentos de Fisiología Vegetal; Azcón-Bieto, J., Talón, M., Eds.; Mc Graw Hill. E.U.: Maidenhead, UK, 2008; pp. 537–558. [Google Scholar]
  62. Sicard, D.; Nanny, L.; Porfiri, O.; Bulfon, D.; Papa, R. Genetic diversity of Phaseolus vulgaris and P. coccineus landraces in central Italy. Plant Breed. 2005, 124, 464–472. [Google Scholar]
  63. Berrocal-Ibarra, S.; Ortíz Cereceres, J.; Peña-Valdivia, C.B. Yield components, harvest index and leaf area efficiency of a sample of wild population and a domesticated variant of the common bean Phaseolus vulgaris. S. Afr. J. Bot. 2002, 68, 205–211. [Google Scholar] [CrossRef]
  64. Flores de la Cruz, M.J.; García Esteva, A.; García Nava, J.R.; Kohashi Shibata, J.; Ybarra Moncada, M.C. Diferencias fenológicas, morfológicas y de componentes del rendimiento entre una forma silvestre y una domesticada de frijol común. Rev. Mex. Cienc. Agríc. 2018, 9, 137–149. [Google Scholar] [CrossRef][Green Version]
  65. Schwanitz, F. The Origin of Cultivated Plants; Harvard University Press: Cambridge MA, USA, 1966; p. 175. [Google Scholar]
  66. Parker, K.C. Seed crop characteristics and minimum reproductive size of organ pipe cactus (Stenocereus thurberi) in southern Arizona. Madroño 1987, 34, 294–303. [Google Scholar][Green Version]
  67. Rocha, O.J.; Stephenson, A.G. Effects of nonrandom seed abortion on progeny performance in Phaseolus coccineus L. Evolution 1991, 45, 1198–1208. Evolution 1991, 45, 1198–1208. [Google Scholar][Green Version]
  68. Stephenson, A.G. Flower and fruit abortion: Proximate cause and ultimate functions. Ann. Rev. Ecol. Syst. 1981, 12, 253–279. [Google Scholar] [CrossRef]
  69. García-Urióstegui, A.; Garcia-Nava, J.R.; Uscanga-Mortera, E.; García-Esteva, A.; Kohashi-Shibata, J.; Garcia de los Santos, G. Rendimiento, biomasa y fenología de la cruza entre fríjol silvestre y domesticado. Rev. Mex. Cienc. Agríc. 2025, 16, 1–11. [Google Scholar] [CrossRef]
  70. Búrquez, A.; Sarukhán, J. Biología floral de poblaciones silvestres y cultivadas de Phaseolus coccineus L. II. Sistemas reproductivos. Bol. Soc. Bot. Méx. 1984, 46, 3–12. [Google Scholar] [CrossRef]
  71. Kendall, D.A.; Smith, B.D. The pollinating efficiency of honeybee and bumblebee visits to flowers of the runner bean Phaseolus coccineus L. J. Appl. Ecol. 1976, 13, 749–752. [Google Scholar] [CrossRef]
  72. Stephenson, A.G.; Winsor, J.A.; Schlichting, C.D. Evidence for non-random fertilization in the common zucchini, Cucurbita pepo. In Reproduction in Higher Plants; Cresti, M., Gori, P., Pacini, E., Eds.; Springer: Berlin/Heidelberg, Germany, 1988; pp. 333–338. [Google Scholar]
  73. Kaushal, N.; Awasthi, R.; Gupta, K.; Gaur, P.; Siddique, K.H.; Nayyar, H. Heat-stress-induced reproductive failures in chickpea (Cicer arietinum) are associated with impaired sucrose metabolism in leaves and anthers. Funct. Plant Biol. 2013, 40, 1334–1349. [Google Scholar] [CrossRef] [PubMed]
  74. Jurado, E.; Westoby, M. Seedling growth in relation to seed size among species of arid Aust. J. Ecol. 1992, 80, 407–416. [Google Scholar] [CrossRef]
  75. Reyes Martínez, A. Variabilidad Genética de Frijol (Phaseolus vulgaris L.) Cultivado Y Silvestre en el Estado de Durango. Ph.D. Thesis, Instituto Politécnico Nacional CIIDIR, Oaxaca, Mexico, 2014. [Google Scholar]
  76. Stearns, S.C.; Koella, J.C. The evolution of phenotypic plasticity in life history traits: Predictions for norms of reaction for age and size at maturity. Evolution 1986, 40, 893–913. [Google Scholar]
  77. Stenseth, N.C.; Mysterud, A.; Ottersen, G.; Hurrell, J.W.; Chan, K.S.; Lima, M. Ecological effects of climate fluctuations. Science 2002, 23, 1292–1296. [Google Scholar] [CrossRef]
  78. Walther, G.R.; Post, E.; Convey, P.; Menzel, A.; Parmesan, C.; Beebee, T.J.C.; Fromentin, J.M.; Hoegh-Guldberg, O.; Bairlein, F. Ecological responses to recent climate change. Nature 2022, 28, 389–395. [Google Scholar] [CrossRef]
  79. Matesanz, S.; Gianoli, E.; Valladares, F. Global change and the evolution of phenotypic plasticity in plants. Ann. N. Y. Acad. Sci. 2010, 2, 35–55. [Google Scholar] [CrossRef]
  80. Nicotra, A.B.; Atkin, O.K.; Bonser, S.P.; Davidson, A.M.; Finnegan, E.J.; Mathesius, U.; Poot, P.; Purugganan, M.D.; Richards, C.L.; Valladares, F.; et al. Plant phenotypic plasticity in a changing climate. Trends Plant Sci. 2010, 15, 684–692. [Google Scholar] [CrossRef]
  81. Quero, J.L.; Villar, R.; Marañón, T.; Murillo, A.; Zamora, R. Plastic response to light and water in four Mediterranean Quercus species (Fagaceae). Rev. Chil. Hist. Nat. 2008, 81, 373–385. [Google Scholar]
  82. Zavala, M.A.; Espelta, J.M.; Caspersen, J.; Retana, J. Interspecific differences in sampling performance with respect to light and aridity gradients in Mediterranean pine-oak forests: Implications for species coexistence. Can. J. For. Res. 2011, 41, 1432–1444. [Google Scholar] [CrossRef]
  83. Andivia, E.; Fernández, M.; Vazquez-Piqué, J.; Alejano, R. Two provenances of Quercus ilex ssp. ballota (Desf) Samp. nursery seedlings have different response to frost tolerance and autumn fertilization. Eur. J. For. Res. 2012, 131, 1091–1101. [Google Scholar] [CrossRef]
  84. Vargas Vázquez, M.L.P.; Muruaga Martínez, J.S.; Alejandre Iturbide, G.; Mayek Pérez, N. Variabilidad fenológica de una población de frijol Patol (Phaseolus coccineus L.) nativo de Durango, México. Rev. Mex. Cienc. Agríc. 2015, 6, 2121–2127. [Google Scholar] [CrossRef][Green Version]
  85. Orduño-Cruz, A.; Troyo-Dieguéz, E. Morfología y Desarrollo del Frijol Tepari Phaseolus acutifolius; Gray, A., Ed.; Centro de Investigaciones Biológicas del Noreste. S.C. Unidad-Guerrero Negro: Guerrero Negro, Mexico, 2003; p. 10. [Google Scholar]
  86. Forero Hernández, D.C.; Hormaza Martínez, P.A.; Moreno Caicedo, L.P.; Ruiz Romero, R. Generalidades Sobre la Morfología y Fenología de la Palma de Aceite; Publicación del Centro de Investigación en Palma de Aceite (Cenipalma): Bogota, Colombia, 2012; p. 124. [Google Scholar]
  87. Pérez Herrera, P.; Acosta Gallegos, J.A. Permeabilidad de la testa y la porción micrópilo-Hilio en semilla de frijol silvestre y cultivado. Rev. Fitotec. Mex. 2002, 25, 57–63. [Google Scholar] [CrossRef]
  88. Quiroz-Sodi, M.; Mendoza-Díaz, S.; Hernández-Sandoval, L.; Carrillo-Ángeles, I. Characterization of the secondary metabolites in the seeds of nine native bean varieties (Phaseolus vulgaris and P. coccineus) from Queretaro, México. Bot. Sci. 2018, 96, 650–661. [Google Scholar] [CrossRef]
  89. Vargas-Vázquez, M.L.P.; Uscanga-Mortera, E.; Padilla-Chacón, D.; Vibrans, H.; Kohashi-Shibata, J.; Miranda-Colín, S.; Yañez-Jiménez, P. Biomass and carbohydrate partitioning in seeds and seedlings of domesticated and wild Phaseolus coccineus L. Bot. Sci. 2020, 98, 366–376. [Google Scholar] [CrossRef]
  90. Sánchez-Chávez, E.; Férnandez-Valeriano, A.F. Estudio de las propiedades físico-químicas y calidad nutricional en distintas variedades de frijol consumidas en México. Nova Sci. 2017, 9, 133–148. [Google Scholar] [CrossRef][Green Version]
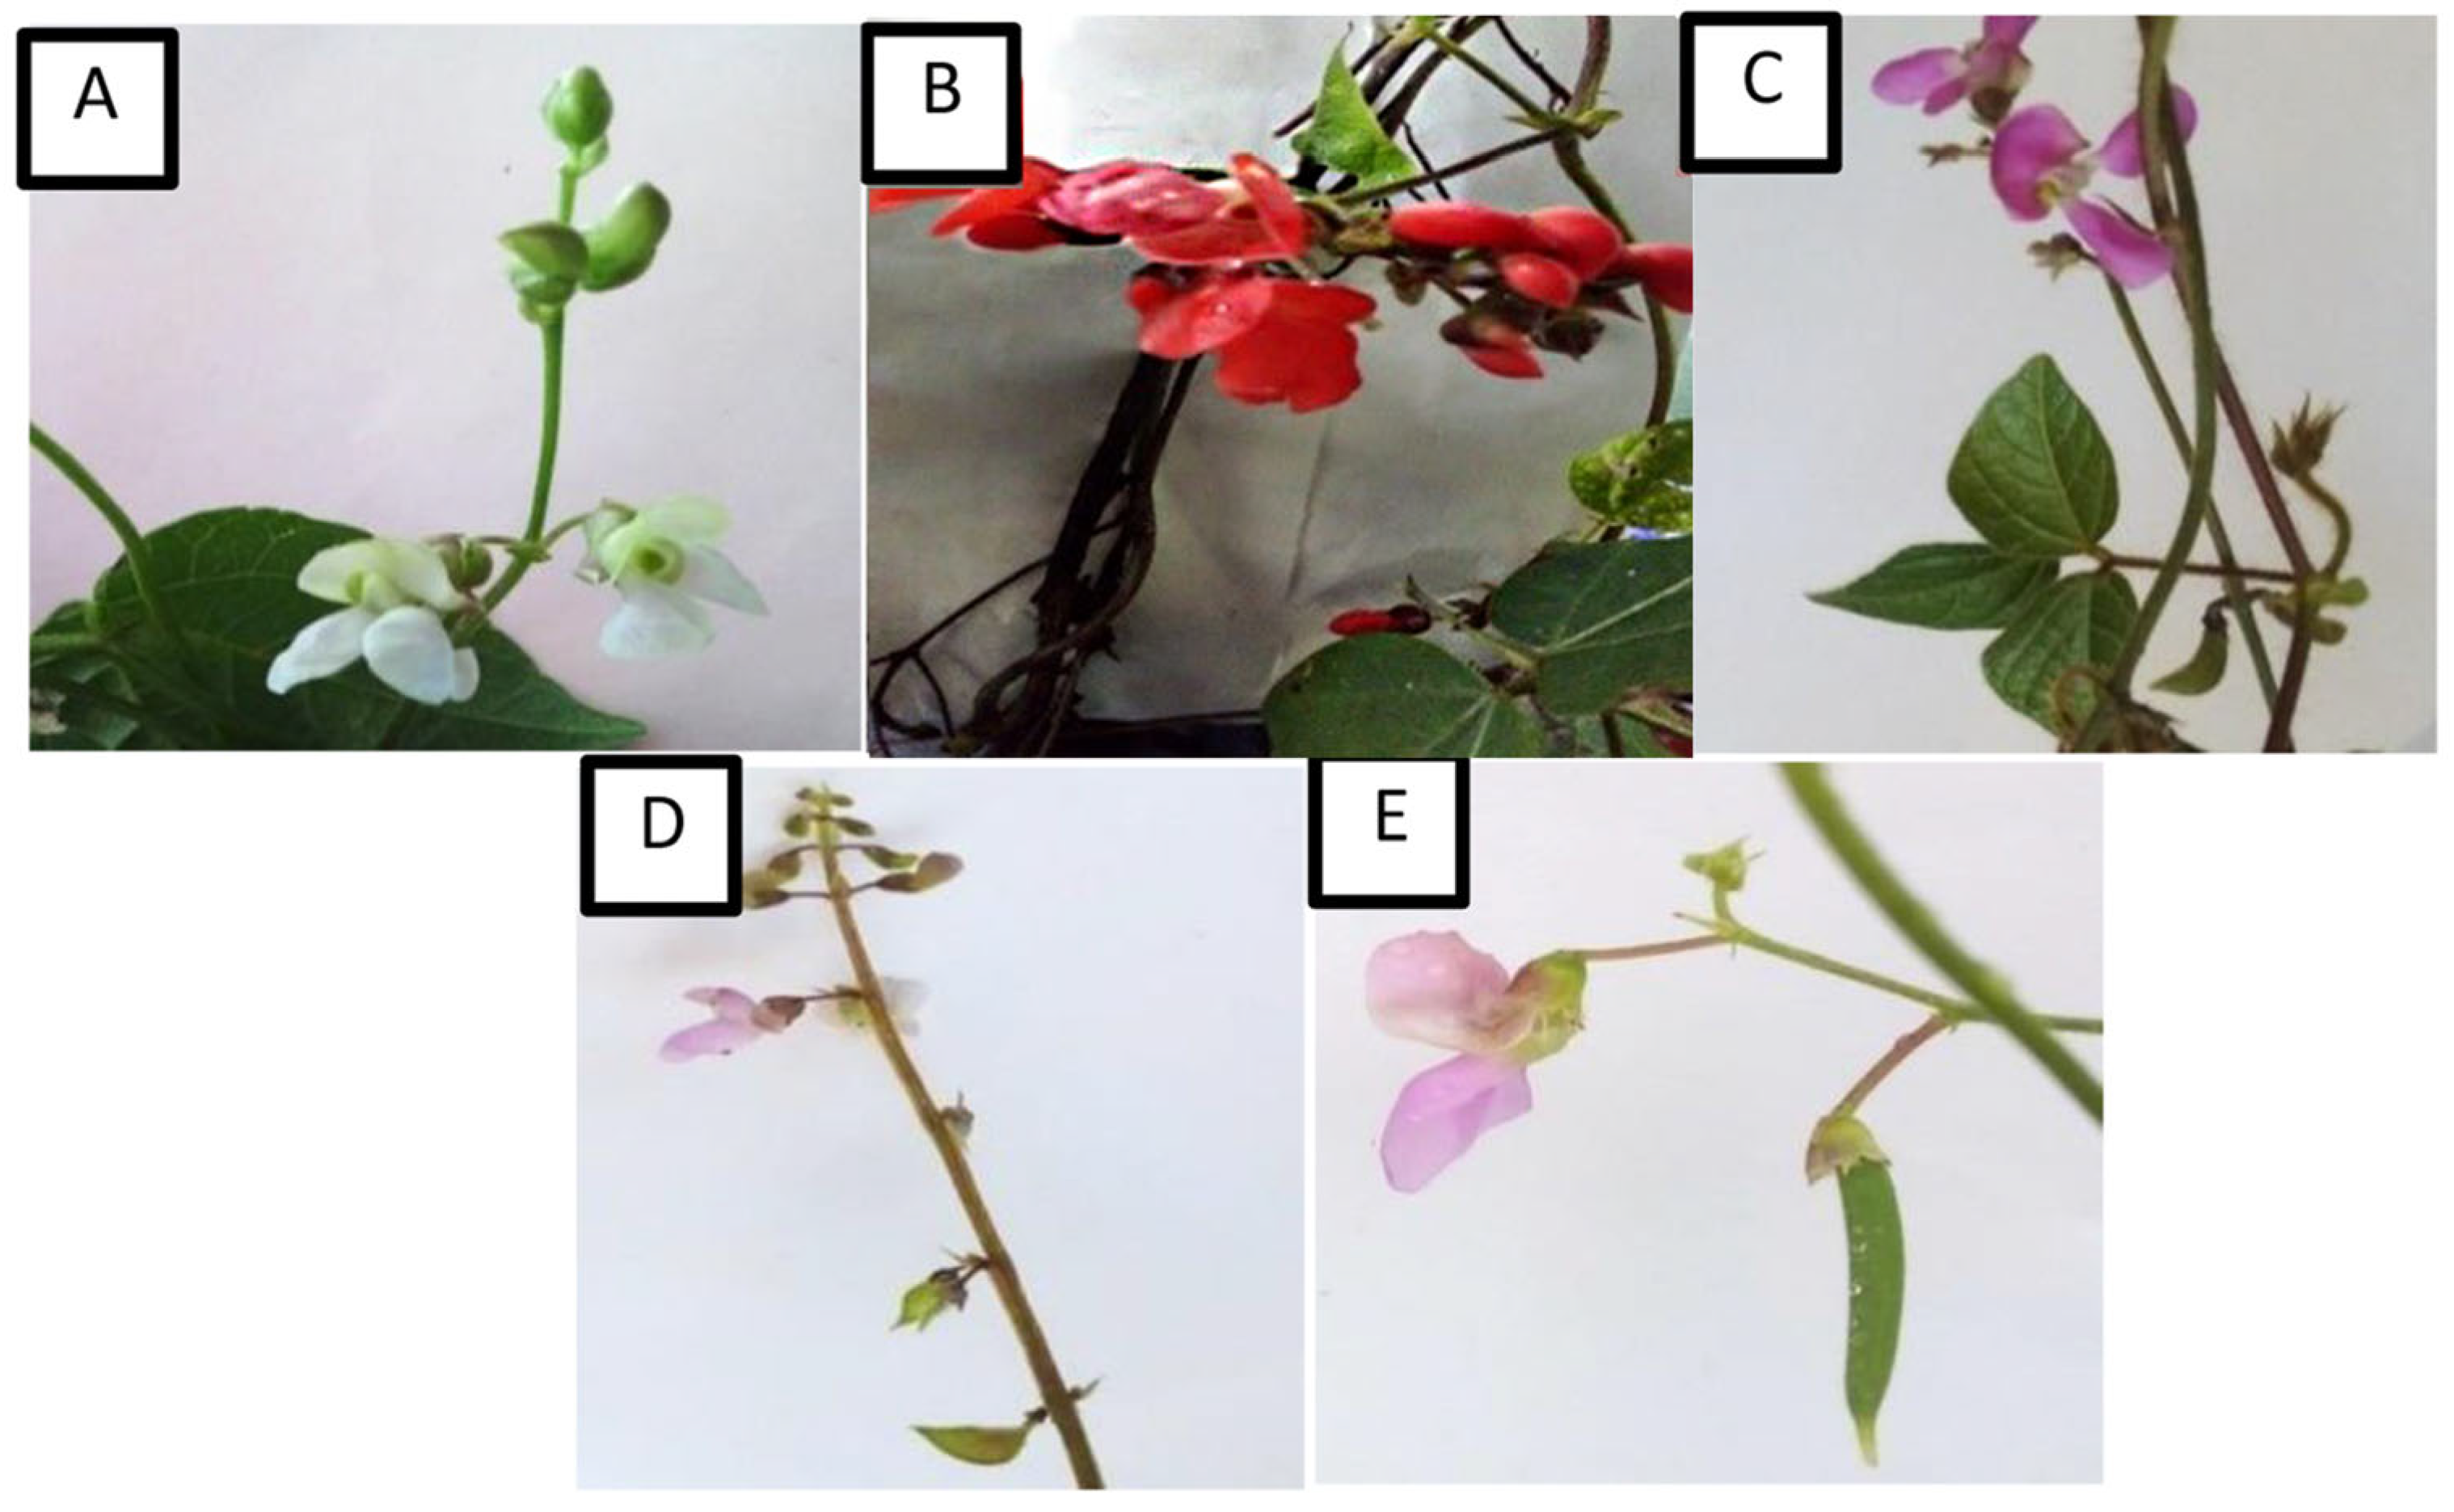
Figure 1. Flowers of the studied wild bean species. (A) Phaseolus vulgaris (white flower), (B) P. coccineus (red flower), (C) P. leptostachyus (intense lilac), (D) P. microcarpus (light lilac), and (E) P. acutifolius (ligh lilac). Figure for illustrative purposes.
Diversity 17 00645 g001
Figure 2. Pods of the studied wild bean species. (A) Phaseolus vulgaris (opaque green, curvature weak, texture smooth, pubescence light, and predominance of seed absent), (B) P. coccineus (light brown, curvature very weak, texture rough, pubescence light, and predominance of seed light), (C) P. leptostachyus (dark brown, curvature half, texture rough, pubescence predominant, predominance of seed absent), (D) P. microcarpus (light brown, curvature absent, texture smooth, pubescence light, predominance of seed prominent), and (E) P. acutifolius (dark brown, curvature half, texture rough, pubescence light, predominance of seed light). Figure for illustrative purposes.
Diversity 17 00645 g002
Figure 3. Seeds of the studied wild bean species. (A) Phaseolus vulgaris (kidney, brown, and cream), (B) P. coccineus (square, black, gray), (C) P. leptostachyus (spherical, black, and brown), (D) P. microcarpus (triangular, gray) and (E) P. acutifolius (rectangular, black, and gray). Figure for illustrative purposes.
Diversity 17 00645 g003
Figure 4. Principal component analysis of quantitative variables in wild Phaseolus species. PLL: primordial leaves length, PLW: primordial leaves width, CLL: central leaflet length, CLW: central leaflet width, PL: petiole length. STD: stem diameter, POL: pod length, POW: pod width, POT: pod thickness, PAL: pod apex length, NS/PO: number of seeds per pod, SL: seed length, SW: seed width, ST: seed thickness, weight of 100 seeds: W100S, NPO/PL: number of pods per plant, TS/PL: total seeds per plant, TSW/PL: total seed weight per plant.
Diversity 17 00645 g004
Figure 5. Clustering analysis of the quantitative variables of wild Phaseolus species.
Diversity 17 00645 g005
Figure 6. Canonical correspondence analysis (CCA) showing the relationship between morphometric characteristics and environmental variables of provenance. PLL: primordial leaf length; PLW: primordial leaf width; CLL: central leaflet length; CLW: central leaflet width; PL: petiole length; STD: stem diameter; POL: pod length; POW: pod width; POT: pod thickness; PAL: pod apex length; NS/PO: number of seeds per pod; SL: seed length; SW: seed width; W100S: weight of 100 seeds; NPO/PL: number of pods per plant; TS/PL: total sees per plant; TSW/PL: total seed weight per plant.
Diversity 17 00645 g006
Figure 7. FTIR spectra of (A) seed coat and (B) embryo from five wild Phaseolus species in the fingerprint spectral region.
Diversity 17 00645 g007
Figure 8. Principal component analysis of FTIR spectra for (A) seed coat and (B) embryo of five wild Phaseolus species.
Diversity 17 00645 g008aDiversity 17 00645 g008b
Table 1. Collecting data of wild Phaseolus species used in the morphometric, phenological, and nutritional characterization.
SpeciesLocalityVoucherLatitudeLongitudeAltitudePrecipitationMaximum TemperatureMinimum TemperatureVegetation
NW(m)(mm)(°C)(°C)
P. vulgaris L.San Dimas6067323°40′105°47′1546105027.0−7LDF
P. coccineus L.San Dimas5755723°39′105°47′2383105027.0−7TF
P. leptostachyus Benth.Durango5755924°2′104°20′1851500.031.4−3XS
P. microcarpus Mart.Mezquital5755824°2′104°16′1464391.842.4−2SS
P. acutifolius A. Gray.Nombre de Dios5756723°56′104°18′1798446.636.7−3.5XS
LDF: low deciduous forest, TF: temperate forest, XS: xerophytic scrub, SS: subtropical scrub.
Table 2. Qualitative variables evaluated in wild bean species.
SpeciesP. vulgarisP. coccineusP. leptostachyusP. microcarpusP. acutifolius
Qualitative Variables
GFEpigealHypogealHypogealEpigealEpigeal
GHIndeterminateIndeterminateDeterminateIndeterminateIndeterminate
LMWholeWholeWholeWholeWhole
LVClosedReticulatedOpenOpenClosed
LSOvateRhombicRopedRopedLanceolate
LCLight greenDark greenDark greenLight greenDark green
SCGreenPurpleGreenGreenGreen
WCWhiteRedIntense lilacLight lilacLight lilac
BCWhiteRedIntense lilacLight lilacLight lilac
CMPOpaque greenLight brownDark brownLight brownDark brown
CPWeakVery weakHalfAbsentHalf
OPACurved upwardCurved upwardCurved upwardCurved upwardCurved upward
PTSmoothRoughRoughSmoothRough
PPLightLightPredominantLightLight
SPPAbsentLightAbsentProminentLight
SSKidneySquareSphericalTriangularRectangular
SCBrown and creamBlack and grayBlack and brownGrayBlack and gray
CAHSBlack and creamBlackBlack and brownLight brownBlack and gray
SZSmallSmallSmallSmallSmall
STSmoothSmoothSmoothSmoothSmooth
GF: germination form, GH: growth habit, LM: leaf margin, LV: leaf venation, LS: leaf shape, LC: leaf color, SC: stem color, WC: wing color, BC: banner color; CMP: color of mature pod, CP: curvature of pod, OPA: orientation of pod apex, PT: texture of pod, PP: pubescence of pod, SPP: seed prominence of pod, SS: seed shape, SC: seed color, CAHS: color around hilum of seed, SZ: seed size, ST: seed texture.
Table 3. Quantitative variables evaluated in wild bean species.
SpeciesP. vulgarisP. coccineusP. leptostachyusP. microcarpusP. acutifolius
Quantitative Variables
14.00 ± 0.25 c4.38 ± 0.36 c1.71 ± 0.13 a3.37 ± 0.16 b3.51 ± 0.10 b
23.43 ± 0.45 cd3.80 ± 0.56 d1.33 ± 0.15 a3.20 ± 0.12 bc2.74 ± 0.28 b
36.44 ± 0.29 c6.72 ± 0.51 d4.03 ± 0.35 a4.05 ± 0.44 a5.40 ± 0.51 b
45.82 ± 0.32 d6.21 ± 0.47 d3.52 ± 0.43 b3.31 ± 0.38 b2.70 ± 0.23 a
52.52 ± 0.18 a2.81 ± 0.20 a1.36 ± 0.15 a1.51 ± 0.21 a2.28 ± 0.18 a
62.62 ± 0.30 a2.34 ± 0.18 a2.16 ± 0.26 a2.22 ± 0.37 a2.63 ± 0.21 a
76.25 ± 1.09 d3.62 ± 0.74 b1.77 ± 0.56 a3.08 ± 1.02 b4.95 ± 0.34 bc
80.57 ± 0.14 ab0.51 ± 0.19 ab0.37 ± 0.10 a0.44 ± 0.23 ab0.52 ± 0.05 ab
92.60 ± 1.05 bc2.28 ± 1.42 b1.77 ± 0.52 a3.06 ± 0.44 c2.07 ± 0.58 a
100.79 ± 0.30 ab1.21 ± 0.63 b0.25 ± 0.13 a0.18 ± 0.12 a0.82 ± 0.63 ab
116.95 ± 1.89 d2.16 ± 0.59 b3.85 ± 1.11 c1.00 ± 0.0 a7.59 ± 0.86 d
120.61 ± 0.36 a4.31 ± 1.83 c1.64 ± 1.27 b1.59 ± 0.98 b4.20 ± 0.42 c
130.95 ± 0.30 a2.96 ± 1.80 bc1.50 ± 0.96 ab1.51 ± 0.39 ab3.33 ± 0.52 c
142.80 ± 0.19 b2.10 ± 1.15 b1.79 ± 0.65 a1.65 ± 1.69 a2.23 ± 0.33 b
153.34 ± 0.32 ab8.71 ± 0.44 b1.23 ± 0.13 a1.26 ± 0.06 a2.53 ± 0.22 a
1617.88 ± 4.64 a16.88 ± 7.94 a104.33 ± 56.89 c266.88 ± 35.74 d90.77 ± 49.14 b
17121.66 ± 22.38 b15.11 ± 4.34 a594.77 ± 90.03 e262.44 ± 100.55 c489.44 ± 67.78 d
184.14 ± 00.78 ab1.30 ± 0.40 a6.78 ± 1.54 b3.58 ± 1.32 ab13.72 ± 1.68 c
Mean values ± standard deviation of quantitative variables for five wild Phaseolus species from Durango, Mexico. Different letters indicate significant differences (Tukey, p < 0.05). Variables include: 1. Primordial leaf length (cm); 2. primordial leaf width (cm); 3. central leaflet length (cm); 4. central leaflet width (cm); 5. petiole length (cm); 6. stem diameter (mm); 7. pod length (cm); 8. pod width (cm); 9. pod thickness (mm); 10. pod apex length (cm); 11. number of seeds per pod; 12. seed length (mm); 13. seed width (mm); 14. seed thickness (mm); 15. weight of 100 seeds (g); 16. number of pods per plant; 17; total seeds per plant; 18. total seed weight per plant (g).
Table 4. Analysis of the coefficient of variation for quantitative variables in the five wild Phaseolus species.
Variables CV
PLL3.3 ± 1.0030.30
PLW2.88 ± 0.9633.61
CLL5.30 ± 1.2824.16
CLW4.30 ± 1.5836.88
PL2.06 ± 0.6431.20
STD2.39 ± 0.229.06
POL3.93 ± 1.7243.75
POW0.48 ± 0.0715.52
POT2.36 ± 0.4921.04
PAL0.65 ± 0.4365.72
NS/PO4.26 ± 2.8767.40
SL1.69 ± 1.5088.72
SW1.52 ± 1.1274.27
ST2.11 ± 0.4421.13
W100S3.40 ± 3.0990.72
NPO/PL103.04 ± 98.5295.62
TS/PL296.67 ± 243.4782.06
TSW/PL5.88 ± 4.7881.33
Values are expressed as mean ± standard deviation and coefficient of variation. PLL: primordial leaves length, PLW: primordial leaves width, CLL: central leaflet length, CLW: central leaflet width, PL: petiole length, STD: stem diameter, POL: pod length, POW: pod width, POT: pod thickness, PAL: pod apex length, NS/PO: number of seeds per pod, SL: seed length, SW: seed width, ST: seed thickness, weight of 100 seeds: W100S, NPO/PL: number of pods per plant, TS/PL: total seeds per plant, TSW/PL: total seed weight per plant.
Table 5. Phenology of five wild Phaseolus species from Durango during the vegetative stage.
SpeciesGermination
VO
Emergency
V1
Primordial Leaves
V2
Trifoliate
First Leaves
V3
Trifoliate
Third Leaves
V4
P. vulgaris2251623
P. coccineus35102332
P. leptostachyus3251223
p. microcarpus2381827
P. acutifolius3451322
Table 6. Phenology of five wild Phaseolus species from Durango during the reproductive phase.
SpeciesPre-Flowering
R5
Flowering
R6
Pod Formation
R7
Pod Filling
R8
Maturation
R9
Number of Days
P. vulgaris52586785121163
P. coccineus49617599136171
P. leptostachyus4046546795133
p. microcarpus445363100128138
P. acutifolius35405174102128
Table 7. Frequencies and vibrational modes related to FTIR absorption bands of wild Phaseolus seed coat and embryo samples.
Frequency
(cm−1)
Functional Group and Vibration ModeSeed CoatEmbryo
1745C=O extension (ester carbonyl)XX
1641C=C extension, C=O extension (amide), N–H folding (amide I)XX
1541C=C extension (aromatic), N–H folding (amide II), C–N extension.XX
1454CH3 lipids/proteins y COO of proteins (amide III)XX
1394CH3 lipids/proteins y COO of proteins (amide III)XX
1317C–N polysaccharidesX
1240C–O extension, in-plain C–H folding (aromatic), aliphatic C–O extension
P=O extension (aliphatic) (amide III)
XX
1148C–O extension, C–N extension (aliphatic), in-plain C–H folding (aromatic), aliphatic C–O extension (polysaccharides)XX
929Vibrations C–O y C–C of polysaccharides X
856Vibrations C–O y C–C of polysaccharides X
Disclaimer/Publisher’s Note: The statements, opinions and data contained in all publications are solely those of the individual author(s) and contributor(s) and not of MDPI and/or the editor(s). MDPI and/or the editor(s) disclaim responsibility for any injury to people or property resulting from any ideas, methods, instructions or products referred to in the content.