Abstract
Phylogeographic studies in Antarctica allow us to understand the demographic events of populations during glacial periods. In this study, the polyplacophoran Tonicina zschaui was analyzed in several localities on the West Antarctic Coast using the mitochondrial gene cytochrome oxidase subunit I (COI). Two genetically distinct populations were identified: one in the Weddell Sea and another across the Antarctic Peninsula and South Shetland Islands. Genetic diversity was generally low to moderate, suggesting limited gene flow and the influence of historical climatic events. Star-like haplotype networks and demographic analyses indicate population contractions during the Last Glaciation followed by postglacial expansion, especially in the Antarctic Peninsula–South Shetland Islands population. Several sites in this region were identified as potential glacial refugia, exhibiting proportionally elevated genetic diversity and exclusive haplotypes. Conversely, the small Weddell Sea population displayed signs of long-term isolation, limited expansion, and low diversity, likely due to stronger environmental constraints and genetic drift. Ocean currents such as the Antarctic Coastal Current, the Antarctic Peninsula Coastal Current and the Weddell Gyre appear to restrict larval dispersal, reinforcing genetic discontinuities. These findings support the hypothesis of glacial survival in localized refugia and postglacial recolonization, a pattern observed in other Antarctic marine invertebrates.
1. Introduction
During the glacial periods of the Pliocene and Pleistocene in Antarctica, sea level dropped, and the ice sheets advanced from the terrestrial environment towards the continental shelf up to 100 km from the continental slope [1,2,3]. These glacial advances caused major environmental disturbances that affected both terrestrial and aquatic ecosystems [3]. As a result, the alternating glacial and interglacial cycles played a critical role in shaping the diversification of Antarctic benthic species, including mollusks, echinoderms, and crustaceans [4,5,6,7,8]. The repeated expansions and contractions of the ice sheets rendered vast areas uninhabitable for most species, driving evolutionary and ecological shifts [9].
The glacial period also triggered changes in key life history traits, such as egg size and developmental mode, as well as in habitat availability [10,11], ultimately influencing species distributions. The changes affected the ability of species to adapt, migrate, or face extinction [3,12,13,14], underscoring the profound influence of glacial cycles on Antarctic biodiversity. To explain shifts in species distribution during glacial periods in Antarctica, three main hypotheses have been proposed: (i) persistence in Antarctic refugia, (ii) survival in Subantarctic areas, and (iii) retreat to deeper waters [10,15,16]. Genetic studies in eurybathic marine invertebrates such as polychaetes, amphipods, and sea spiders supported the third hypothesis, suggesting survival during the Last Glacial Maximum (LGM), retreating to deeper marine environments [15]. Species with pelagic larvae and broad Southern Ocean distribution tend to support the second hypothesis, as phylogeographic studies in mollusks, echinoderms, crustaceans, and annelids commonly reveal low genetic diversity and signs of post-glacial population expansion [6,15,17,18,19,20,21]. In contrast, for many shallow-water Antarctic endemic species with limited dispersal capacity, the first hypothesis, persistence in local refugia, is considered more plausible [10,15,22].
Among benthic marine invertebrates in Antarctica, polyplacophorans are less abundant and diverse compared to other mollusk groups [23]. Ten chiton species have been reported in the Southern Ocean, inhabiting both shallow and deep waters, with half of these species being endemic to the region [23,24,25,26]. Among the endemic shallow-water chitons, Tonicina zschaui (Pfeffer, 1886) stands out as the most abundant species, particularly in the Antarctic Peninsula and South Shetland Islands, where it is the most common shallow-water chiton [25,26]. Polyplacophorans generally exhibit lecithotrophic or direct development, which explains their reduced dispersal capacity [27,28]. Tonicina zschaui has been characterized by its endemic status (in fact, it belongs to an endemic monotypic genus), having a distribution ranging from 100 m to shallow waters, and possessing a lecithotrophic development stage [26,29]. Given these particular characteristics, the first hypothesis appears to be the most probable explanation for the evolutionary history of this species’ populations in Antarctica. According to this hypothesis, genetic evidence of population changes associated with glacial periods in Antarctica is expected. Therefore, this study aims to estimate the genetic diversity, population structure, phylogeographic pattern, and demographic history of T. zschaui populations in the South Shetland Islands and the Antarctic Peninsula.
2. Materials and Methods
2.1. Sampling
A total of 244 Tonicina zschaui specimens were collected during the austral summers of 2022, 2023, and 2024 at several locations across the South Shetland Islands and the Antarctic Peninsula, which are part of the West Antarctic Region (see Table 1 and Figure 1). The chitons were collected from the intertidal and subtidal zones at depths ranging from 5 to 17 m using scuba diving equipment (Tokyo, Japan). All specimens were fixed in 96% ethanol for genetic analysis.

Table 1.
Genetic diversity indices of Tonicina zschaui, based on COI sequences. N: sample size; K: number of haplotypes; S: number of polymorphic sites; Hd: haplotypic diversity; π: nucleotide diversity; Π: average number of differences between pairs of sequences.
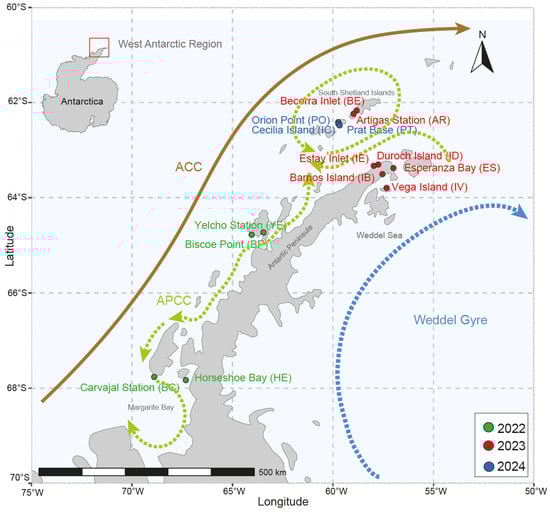
Figure 1.
Map showing the sampling sites of Tonicina zschaui in the West Antarctica Region. Marine currents modified from [26]. ACC: Antarctic Circumpolar Current, APCC: Antarctic Peninsula Coastal Current.
2.2. Mitochondrial DNA Analyses: Genetic Diversity, Genealogy, and Structuring
We sequenced a fragment of the mitochondrial cytochrome oxidase I (COI) region using the primers described in Folmer et al. [30]. Total DNA was extracted following the salt extraction protocol [31]. Then, PCR reactions were performed for each sample, which included 0.06 U/µL Taq polymerase, 1X buffer (50 mM KCl, 10 mM Tris-HCl, pH 8.0), 0.8 mM dNTPs, 2 mM MgCl2, 0.2 M of each primer, and 2–3 ng/µL of the extracted DNA. These reactions were carried out using the following thermal cycler program: after an initial denaturation (3 min at 94 °C), the reaction mixtures were subjected to 35 cycles of 94 °C for 50 s, 50 °C for 40 s, and 72 °C for 60 s, followed by a final extension at 72 °C for 10 min. PCR products were then both purified and bidirectionally sequenced at Macrogen Inc. (Santiago, Chile). Sequences were edited and consensus sequences were assembled in ProSeq v.2.9 [32]. The reading frame was then verified using the invertebrate mitochondrial genetic code in the program MEGA XI [33].
From the mitochondrial sequences (COI), standard diversity indices such as the number of haplotypes (K), the number of polymorphic sites (S), haplotype diversity (Hd), the mean number of pairwise differences (∏), as well as nucleotide diversity (π) were estimated using DnaSp v6 [34].
Genealogical relationships among haplotypes from different regions along the South Shetland Islands and Antarctic Peninsula were reconstructed using a median-joining network algorithm, which infers the most parsimonious connections between haplotypes while allowing for reticulations when equally parsimonious alternatives exist. This approach is particularly suited for intraspecific data without recombination, as it identifies potential ancestral haplotypes and visualizes mutational steps among them, facilitating the interpretation of genealogical relationships and geographic structuring. The network was built using COI sequence data in Hapview Beta [35]. Additionally, pie charts of haplotype frequencies by locality were plotted on a map to visualize the variation in haplotype diversity and frequency across the South Shetland Islands and the Antarctic Peninsula.
Posterior probabilities for detecting georeferenced genetic structuring were estimated using the Geneland 4.0.2 package [36] implemented in R 4.5.1 [37]. The number of genetic clusters (K) or populations (based on the COI gene) along the South Shetland Islands and Antarctic Peninsula was assessed using a Markov Chain Monte Carlo (MCMC) approach with 10 million iterations, sampling parameters every 10,000 iterations. Analyses were conducted under both uncorrelated (haplotype frequencies independent among populations) and correlated frequency models. The convergence of likelihood scores was evaluated in TRACER 1.6 [38] after discarding 10% of samples as burn-in. The best-fitting model was chosen in TRACER software using the mean Akaike Information Criterion for MCMC samples (AICM). Additionally, pairwise differences in the FST (based on haplotype frequencies) and ΦST (based on nucleotide differences) indices were calculated among sampling localities. The statistical significance of pairwise FST and ΦST values was calculated using 10,000 permutations in Arlequin v3.5 [39].
2.3. Demographic and Phylogeographic Analyses
To detect departures from Wright-Fisher mutation-drift equilibrium caused by population expansions or bottlenecks under neutrality hypotheses, we calculated Tajima’s D and Fu’s Fs indexes and their corresponding p-values [40,41] using Arlequin software.
The demographic history of T. zschaui was also inferred from Bayesian Skyline analysis implemented in BEAST version 1.10.5 [42]. This method uses Markov Chain Monte Carlo (MCMC) sampling of sequence data to estimate the posterior distribution of effective population size (Ne) through time, along with their 95% Highest Posterior Density (HPD) intervals [43]. The analysis was performed under the HKY+I substitution model, identified as the best-fitting model based on Bayesian Information Criterion (BIC = 53.75.25, •ln likelihood = 1096.77) implemented in jModelTest version 2.1.7 [44]. The mutation rate was set using a normal distribution as a prior (mean: 2.0 × 10⁻⁸, s.d.: 2.0 × 10⁻⁹) following estimates for Liolophura species by Choi et al. [45]. Subsequently, an estimated mutation rate from the first run was used. A relaxed molecular clock with an uncorrelated exponential distribution was utilized, as this model provided the best fit to the data (log10 Bayes Factor = 5.314). The number of grouped intervals (m) was set to 10, and the Bayesian Skyline was performed in the piecewise-constant model. We ran the MCMC for 50 million iterations, sampling every 5000 generations, and discarded the first 10% of iterations as burn-in. Bayesian skyline plots were generated using Tracer.
To investigate the origin of the ancestral population lineages of T. zschaui, a discrete phylogeographic analysis was conducted within a Bayesian framework using BEAST version 1.10.5. This analysis was based on COI gene sequences, with the HKY+I substitution model selected through jModelTest. Each of the two populations (population 1: Antarctic Peninsula and South Shetland Islands; population 2: Weddell Sea) was modeled as a discrete character, and the asymmetric substitution model was applied to reconstruct the ancestral states of the lineages. For the mitochondrial COI gene, a relaxed molecular clock model was employed, assuming no correlation with a limited distribution. A coalescent tree was constructed under a constant population size model, with an average substitution rate of 2% per million years and a standard deviation of 0.2%. The analysis was run for 10,000,000 iterations of the Markov Chain Monte Carlo (MCMC), with parameter estimates sampled every 1000 steps. Convergence was assessed using Tracer software, and a maximum credibility tree was generated using TreeAnnotator 1.8.4.
3. Results
3.1. Genetic Diversity and Genealogical Relationships
Of the 244 aligned COI gene sequences, comprising 657 bp, contrasting diversity results were found among localities. Nine localities exhibited low haplotype diversity, nucleotide diversity, and average pairwise differences. Meanwhile, five localities showed intermediate levels of haplotype diversity and pairwise differences but low nucleotide diversity (Table 1). In total, 29 haplotypes and 23 polymorphic sites were identified. Overall, COI sequences showed limited genetic differentiation, with an average of π = 1.116 pairwise differences (Table 1). Haplotype composition and frequency varied across localities. Eleven of the fourteen sampling sites showed unique haplotypes (Figure 2). Nine localities shared haplotypes at intermediate frequencies, while the highly frequent haplotype H1 was found in almost all localities (Figure 2). The distribution of shared haplotypes with intermediate frequencies was uneven and spatially discontinuous across the West Antarctic region. In contrast, haplotype H1 was consistently highly frequent at all localities, while several unique haplotypes were detected at specific sites within the region (Figure 2).
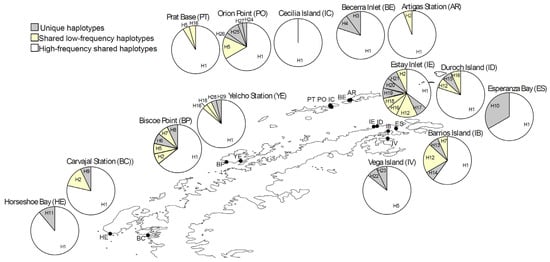
Figure 2.
Pie chart map showing haplotype frequencies at sampling sites across the South Shetland Islands and the Antarctic Peninsula in the West Antarctic region. Each circular graph represents a locality, with segments indicating the relative frequencies of haplotypes. The widespread haplotype H1 is shown in white, site-specific haplotypes in gray, and low-frequency haplotypes in yellow. This figure highlights both shared and localized genetic patterns across the study area.
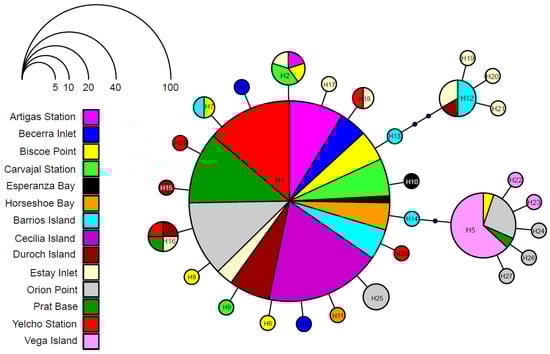
The genealogical relationship network revealed a star-like pattern (Figure 3). The centered, high-frequency haplotype H1 (represented by the size of the circle, Figure 3) was detected in thirteen of the fourteen sampled localities. The H1 haplotype was surrounded by 18 haplotypes, five low-frequency haplotypes, and thirteen unique haplotypes, each of which differed from H1 by one mutational step. The next most frequent haplotypes were H5 and H12, located two and three mutational steps away from H1, respectively, and each surrounded by five and three unique haplotypes (Figure 3).
3.2. Genetic Population Structure
The Bayesian analysis of genetic structure, using an uncorrelated allele frequency model for the COI gene (selected based on AICM = 639.236), provided strong support (posterior probability = 0.9) for the spatial assignment of genetic lineages into two distinct clusters (K = 2) or populations in the West Antarctica Region (Figure 4A,B). A marked genetic discontinuity was detected at 63.79° S, 57.33° W in Vega Island, clearly separating the Weddell Sea and Antarctic Peninsula plus South Shetland Islands populations (Figure 4A,B).
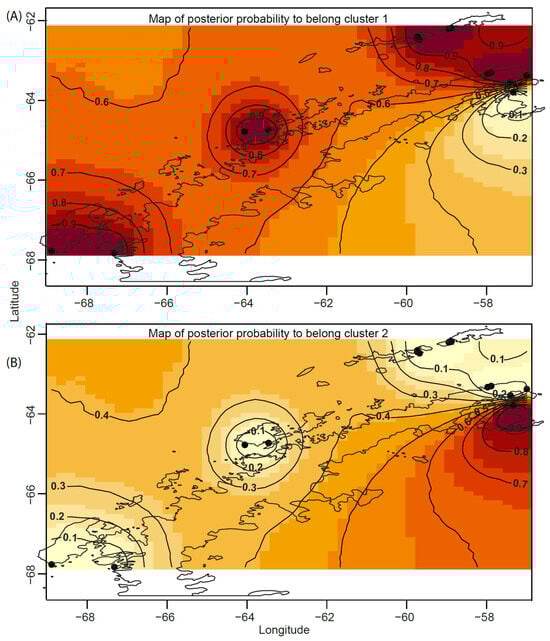
Figure 4.
(A,B) Posterior probability maps showing the spatial assignment of T. zschaui individuals to genetic populations inferred from Geneland, based on COI mitochondrial DNA sequences, across the Antarctic Peninsula, South Shetland Islands, and Weddell Sea. Isolines represent the posterior probability contours delineating the spatial position of the genetic discontinuity between clusters or populations. Darker shades indicate higher posterior probabilities of individual membership within each inferred population.
Pairwise comparisons of FST (based on haplotype frequencies) and ΦST (based on nucleotide differences) values between localities (Table 2) revealed the strongest genetic differentiation between Vega Island (Weddell Sea) and the other thirteen sampling sites along the Antarctic Peninsula and South Shetland Islands. Additionally, relatively low but statistically significant levels of genetic differentiation were detected between localities within the Antarctic Peninsula and South Shetland Islands, suggesting the presence of subtle genetic differentiation at a finer spatial scale.
Table 2.
Pairwise comparisons of genetic differentiation (FST below the diagonal and ΦST above the diagonal) between sampling localities based on COI sequence data. Bonferroni-corrected p-values (α = 0.0005) are reported, with statistically significant comparisons highlighted in bold and underlined.
3.3. Demographic History
Neutrality tests were positive and non-significant in the Weddel Sea population (Fu and Li’s D test statistic: 1.82689, p > 0.10; Tajima’s D: 1.48074, p > 0.10), suggesting this population is in mutational-drift equilibrium. In contrast, the population encompassing the Antarctic Peninsula and the South Shetland Islands showed significantly negative values (Fu and Li’s D* test statistic: −3.25095, p < 0.05; Tajima’s D: −2.13362, p < 0.01), indicating a signal of recent population expansion.
Bayesian Skyline plots analyses, run using estimated mean rates (Antarctic Peninsula and South Shetland Islands: mean = 1.823 × 10⁻⁸, SD = 1.823 × 10⁻⁹; Weddel Sea: mean = 4.929 × 10⁻¹¹, SD = 4.929 × 10⁻¹²), revealed a marked demographic expansion in the Antarctic Peninsula and South Shetland Islands population beginning around 15,000 years ago (Figure 5A). This expansion involved an increase in effective population size by more than one order of magnitude. The estimated time of the most recent common ancestor (TMRCA) for this population was approximately 125,000 years ago (HPD 95%: 100,930–148,680 years). Meanwhile, the Weddell Sea population did not show evidence of significant demographic expansion over the last 100,000 years (Figure 5B), and the estimated TMRCA was approximately 100,000 years (HPD 95%: 98,000–136,000 years).
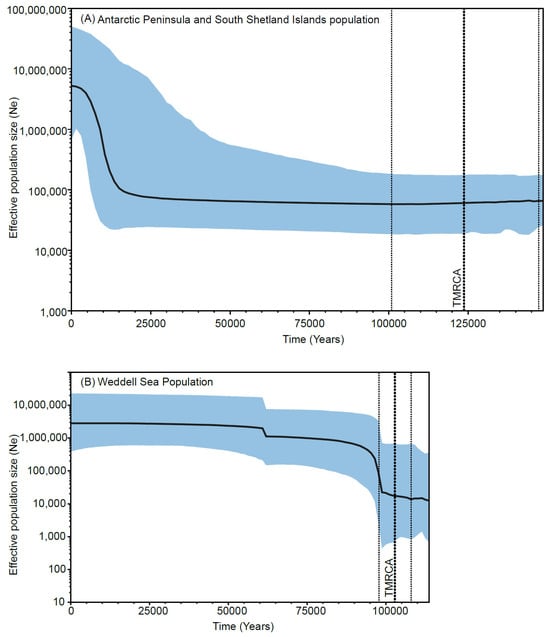
Figure 5.
Bayesian Skyline Plots illustrate changes in the effective population size of Tonicina zschaui over time. The x-axis represents time, with estimates based on the average pairwise sequence divergence rate calculated separately for each population. The y-axis shows effective population size, expressed as the number of individuals. The thick solid line indicates the median population size, while the thin dashed lines represent the 95% highest posterior density (HPD) intervals. The black vertical dotted line marks the estimated time to the most recent common ancestor (TMRCA), with the surrounding thin dotted lines denoting its 95% HPD interval.
3.4. Phylogeographic Inference
Discrete phylogeographic analysis identified a maximum clade credibility tree supporting a common ancestor for both populations dating to ~127,000 years ago (posterior probability = 0.99; Figure 6). This represents the oldest lineage of Tonicina zschaui, originating in the Antarctic Peninsula–South Shetland Islands population, from which dispersal across West Antarctica began. A subsequent divergence between the Antarctic Peninsula–South Shetland Islands and Weddell Sea populations occurred ~26,514 years ago (posterior probability = 0.97), giving rise to the ancestor of the Weddell Sea population. Around 15,600 years ago, with a posterior probability of 1.0, this ancestor established a distinct lineage in the Weddell Sea, characterized by reciprocal monophyly. Individuals in this lineage were more closely related to each other than to those in the Antarctic Peninsula–South Shetland Islands lineage (Figure 6).
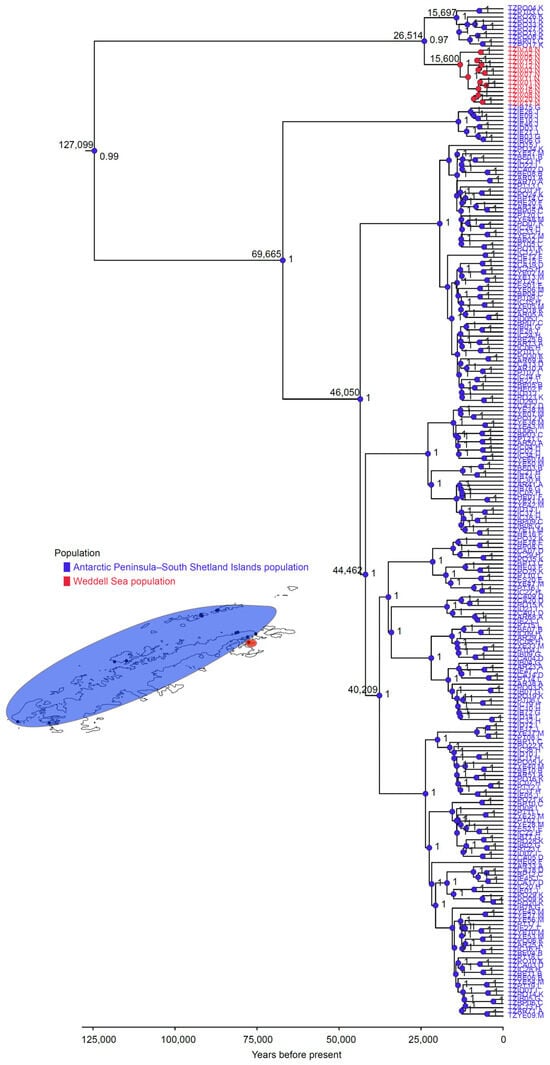
Figure 6.
Maximum Clade Credibility Tree (MCCT) for Tonicina zschaui lineages, based on the COI gene. Colored circles in each node correspond to the most likely ancestral population (blue: Antarctic Peninsula and South Shetland Islands; red: Weddell Sea. The numbers at the nodes represent the posterior probability of the ancestral reconstruction (on the right) and the age of the most ancestral nodes (on the left).
4. Discussion
4.1. Genetic Diversity
This study presents the first phylogeographic analysis of polyplacophorans on the Antarctic continent. The results reveal that Tonicina zschaui consists of two distinct genetic units: one restricted to the Weddell Sea and another distributed across the Antarctic Peninsula and South Shetland Islands. Genetic diversity in T. zschaui was generally low to moderate, indicating limited gene flow both within the Antarctic Peninsula–South Shetland Islands population and between this population and the Weddell Sea population (Table 1). Moreover, the distribution and frequency patterns of unique and shared haplotypes (Figure 2) suggest restricted connectivity, likely shaped by extreme environmental and oceanographic conditions. Such barriers appear to reduce, rather than promote, genetic homogenization, even across relatively short distances (<25 km), highlighting the influence of Antarctic seascape features on population structure.
The genetic diversity pattern of Tonicina zschaui and the observed star-like haplotype network suggest populations that have undergone diversity loss, likely because of environmental fluctuations during the Pleistocene glaciations. During the Last Ice Age, pronounced temperature drops, particularly at the onset of the Pleistocene (<3 °C), favored the expansion of ice masses along the Antarctic margins, leading to reduced light penetration and diminished primary productivity [14,46]. Previous studies on benthic species indicate that glaciation had substantial impacts on their populations [3]. Habitat disturbance and ice-sheet expansion reduced both the extent of suitable environments and population sizes, ultimately causing a loss of genetic diversity [15]. Similar genetic patterns, including low genetic diversity and star-like haplotype networks, have been reported in other Antarctic marine invertebrates, such as Nacella concina [18], Sterechinus neumayeri [10], Parbolasia corrugatus [4], and Chorismus antarcticus [47]. The population expansion detected in T. zschaui reflects a pattern also reported for other invertebrates and marine algae in Antarctica following population reductions caused by the LGM [10,18,22,48,49].
4.2. Genetic Population Structure
A clear genetic break separates the Antarctic Peninsula–South Shetland Islands and Weddell Sea populations of T. zschaui. This delimitation is primarily driven by differences in haplotype composition and, secondarily, by haplotype frequencies (Figure 2). The most common haplotype, H1, occurs at all sampled localities, together with additional shared haplotypes and several unique haplotypes restricted to the Antarctic Peninsula and South Shetland Islands population (Figure 2 and Figure 3). By contrast, the Weddell Sea population harbors unique haplotypes and the second most common shared haplotype, H5. Such genetic discontinuity, reflecting limited connectivity, likely stems from the low dispersal capacity of chitons. Like other polyplacophorans, T. zschaui probably produces lecithotrophic trochophore larvae that remain planktonic for only 2–10 days before settlement [50,51]. This short pelagic duration is consistent with the pronounced genetic discontinuity observed within the Antarctic Peninsula and South Shetland Islands and the genetic disjunction with the Weddell Sea population, as species with lecithotrophic larvae typically exhibit strong phylogeographic structure [45,52].
Although occasional long-distance dispersal cannot be ruled out, rafting has been documented in several chiton species, with adults reported attached to seagrass and other floating substrates in the Southern Hemisphere [53,54]. This mechanism provides an effective dispersal pathway that can homogenize genetic variation through sustained gene flow [53,54,55]. In Antarctica, rafting is likely mediated by non-buoyant macroalgae such as Desmarestia and Adenocystis [56,57]. However, the discontinuous genetic distribution of T. zschaui along the West Antarctic coast suggests that larval dispersal is the predominant mode of connectivity, consistent with patterns observed in other benthic species with limited larval dispersal capacity [58]. This interpretation is further supported by field observations indicating that adult T. zschaui are typically found attached to rocky substrates rather than algal rafts. In addition, oceanographic circulation likely contributes to the observed genetic discontinuities. The Antarctic Coastal Current (ACC) flows northward along the inner and outer coasts of the South Shetland Islands, converging at their northern tip before diverging in opposite directions [59]. This circulation pattern does not favor continuous connectivity between the South Shetland Islands and more southerly localities, thereby restricting larval dispersal. Similarly, the Antarctic Peninsula Coastal Current (APCC), which encircles the Antarctic Peninsula and is strongly influenced by the southward outflow from the Weddell Sea [60], is unlikely to promote connectivity. Instead, it may help explain both the genetic heterogeneity within the Antarctic Peninsula–South Shetland Islands region and its divergence from the Weddell Sea population by limiting larval exchange. Comparable oceanographically driven genetic breaks have been reported in Antarctic fishes [61], highlighting the central role of currents in shaping population structure across the region.
4.3. Demography and Phylogeographic History
Demographic analyses reveal that the Antarctic Peninsula and South Shetland Islands population began a population decline approximately 125,000 years ago, roughly coinciding with the onset of the Last Glaciation (116,000 years ago) in the Late Pleistocene [62,63]. This population remained small throughout the Last Glaciation until the last advance during the Last Glacial Maximum around 21,000 years ago in the Late Holocene [62,63]. Glacial modeling analyses during this Last Glacial Maximum suggest extensive ice sheet formation along the west Antarctic coast, which may have reduced suitable habitats for T. zschaui, leading to the Antarctic Peninsula and South Shetland Islands population decline. Subsequently, as the ice sheets began to retreat approximately 17,000 years ago [62,63], recolonization of available habitats was promoted, leading to the expansion of the T. zschaui population around 15,000 years ago (Figure 5), as also observed in other marine invertebrates [15]. On the other hand, the Weddell Sea population showed no signs of significant expansion (Figure 5), remaining a very small population during this Last Glaciation and therefore exposed to strong microevolutionary processes such as genetic drift and/or selection, which would cause a loss of genetic diversity and effective population size during this period.
The persistence of both populations, which remained small throughout the Last Glaciation, suggests survival in putative glacial refugia along the West Antarctic coast. The genetic signature of such refugia and subsequent recolonization is typically marked by low diversity across large, glaciated regions, dominated by a few widespread haplotypes, together with proportionally higher diversity and exclusive alleles in refugial areas [64]. In this context, the West Antarctic coast, particularly the Antarctic Peninsula and South Shetland Islands population, exhibits a disproportionate distribution of shared haplotypes, including dominant and ancestral variants (H1 and H5; Figure 2 and Figure 3). Moreover, several sites within this population show proportionally greater diversity and exclusive haplotypes (Table 1; Figure 2), identifying Biscoe Point (BP), Orion Point (PO), Estay Inlet (IE), Barrios Island (IB), and Esperanza Bay (ES) as putative glacial refugia. These sites likely acted as sources of subsequent secondary contact and recolonization, facilitating the expansion of T. zschaui along the West Antarctic coast.
The Weddell Sea population also shows evidence of having served as a glacial refugia, as indicated by the presence of a second shared dominant ancestral haplotype and exclusive haplotypes (Figure 2). However, unlike the Antarctic Peninsula–South Shetland Islands population, this population exhibits a pronounced genetic break, consistent with the absence of secondary contact. This is supported by evidence of divergence approximately 15,600 years ago, accompanied by the clear formation of reciprocal monophyly (Figure 6). Such differentiation was likely reinforced by the distinctive oceanographic conditions of the Weddell Sea during the Last Glacial Maximum [65]. In addition, the low genetic diversity observed suggests that haplotype loss occurred through genetic drift, a process exacerbated by the small effective population size that persisted in this refugia during the glacial period.
Taken together, our results support the hypothesis of survival in glacial refugia during the Last Ice Age. The presence of exclusive haplotypes in semi-isolated sites points to the generation of unique genetic diversity, albeit alongside losses associated with reduced effective population sizes. A subsequent postglacial expansion phase is also evident, reflecting patterns documented in other Antarctic taxa [6,18,66]. Importantly, the estimated age of the most recent common ancestor (MRCA) of both T. zschaui populations suggests that they are relatively young, originating no more than 125,000 years ago (Figure 5), between the middle and late Pleistocene. This timing aligns with the Last Ice Age and underscores the substantial demographic fluctuations these populations have undergone since their origin, while also highlighting their persistence to the present day through survival in glacial refugia.
5. Conclusions
This study provides the first phylogeographic insight into Tonicina zschaui, a polyplacophoran endemic to the Antarctic continent. The findings reveal two genetically distinct populations: one in the Weddell Sea and another across the Antarctic Peninsula and South Shetland Islands. Low-to-moderate genetic diversity and restricted gene flow highlight the role of limited larval dispersal and oceanographic barriers in shaping population structure. The observed star-like haplotype network and demographic analysis suggest that both populations experienced reductions during the Last Glaciation, followed by postglacial expansion, particularly in the Antarctic Peninsula–South Shetland Islands population. The identification of potential glacial refugia, such as Biscoe Point and Esperanza Bay, further supports the hypothesis of local persistence during glaciation. The Weddell Sea population, by contrast, appears to have remained isolated, with minimal gene flow post-glaciation. These patterns are consistent with other Antarctic benthic invertebrates, underscoring the influence of Pleistocene climate events and ocean currents on contemporary biodiversity. Future studies incorporating additional molecular markers and broader geographic sampling are essential to fully understand the evolutionary processes governing Antarctic marine invertebrates. Together, these results contribute valuable data to Antarctic phylogeography and highlight the resilience of marine life in extreme environments.
Author Contributions
Conceptualization, M.C.P.-G., C.M.-G., P.M., A.D. and C.M.I.; methodology, M.C.P.-G., C.M.-G., P.M. and C.M.I.; formal analysis, M.C.P.-G., C.M.-G., P.M., J.C., K.P. and C.M.I.; resources, M.C.P.-G., P.M., A.D. and C.M.I.; data curation, P.M., J.C., K.P. and C.M.I.; writing—original draft preparation, M.C.P.-G., C.M.I. and C.M.-G.; writing—review and editing, M.C.P.-G., P.M., A.D., S.R., K.K. and C.M.I.; project administration, M.C.P.-G. and C.M.I.; funding acquisition, M.C.P.-G., P.M., A.D., K.K. and C.M.I. All authors have read and agreed to the published version of the manuscript.
Funding
This research was funded by Instituto Antártico Chileno (INACH), funding number RT 07-20. Additionally, this research was funded by the ANID Millennium Science Initiative Program, funding number ICN2021_002.
Institutional Review Board Statement
The study was conducted in accordance with the ethics committee of Universidad Andres Bello and Instituto Antártico Chileno.
Data Availability Statement
The COI sequences obtained in this study are in GenBank under the codes PX273957–PX274200.
Acknowledgments
We thank the RV Betanzos crew and INACH staff for their logistical support on all Antarctic scientific expeditions (ECA 58, 59, and 60). This study was funded by the INACH project RT 07-20. We would also like to thank Cynthia Briceño for their help with the laboratory work. Special thanks to Rodrigo Bermeo from Hippocampus Diving Center for helping collect chitons.
Conflicts of Interest
The authors declare no conflicts of interest.
References
- Grobe, H.; Mackensen, A. Late Quaternary climatic cycles as recorded in sediments from the Antarctic continental margin. In The Antarctic Paleoenvironment: A Perspective on Global Change; Antarctic Research Series; American Geophysical Union: Washington, DC, USA, 1992; Volume 56, pp. 349–376. [Google Scholar]
- Huybrechts, P. Sea-level changes at the LGM from ice-dynamic reconstructions of the Greenland and Antarctic ice sheets during the glacial cycles. Quat. Sci. Rev. 2002, 21, 203–231. [Google Scholar] [CrossRef]
- Thatje, S.; Hillenbrand, C.D.; Larter, R. On the origin of Antarctic marine benthic community structure. Trends Ecol. Evol. 2005, 20, 534–540. [Google Scholar] [CrossRef]
- Thornhill, D.J.; Mahon, A.R.; Norenburg, J.L.; Halanych, K.M. Open-ocean barriers to dispersal: A test case with the Antarctic Polar Front and the ribbon worm Parborlasia corrugatus (Nemertea: Lineidae). Mol. Ecol. 2008, 17, 5104–5117. [Google Scholar] [CrossRef]
- Pearse, J.S.; Mooi, R.; Lockhart, S.J.; Brandt, A. Brooding and species diversity in the Southern Ocean: Selection for brooders or speciation within brooding clades? In Smithsonian at the Poles: Contributions to International Polar Year Science; Krupnik, I., Lang, M.A., Miller, S.E., Eds.; Smithsonian Institution Press: Washington, DC, USA, 2009; pp. 181–196. [Google Scholar]
- Wilson, N.G.; Schröld, M.; Halanych, K.M. Ocean barriers and glaciation: Evidence for explosive radiation of mitochondrial lineages in the Antarctic sea slug Doris kerguelenensis (Mollusca, Nudibranchia). Mol. Ecol. 2009, 18, 965–984. [Google Scholar] [CrossRef]
- Allcock, A.L.; Barratt, I.; Eléaume, M.; Linse, K.; Norman, M.D.; Smith, P.J. Cryptic speciation and the circumpolarity debate: A case study on endemic Southern Ocean octopuses using the COI barcode of life. Deep-Sea Res. II 2011, 58, 242–249. [Google Scholar] [CrossRef]
- Baird, H.P.; Miller, K.J.; Stark, J.S. Evidence of hidden biodiversity, ongoing speciation and diverse patterns of genetic structure in giant Antarctic amphipods. Mol. Ecol. 2011, 20, 3439–3454. [Google Scholar] [CrossRef]
- Provan, J.; Bennett, K.D. Phylogeographic insights into cryptic glacial refugia. Trends Ecol. Evol. 2008, 23, 564–571. [Google Scholar] [CrossRef]
- Díaz, A.; Gerard, K.; González-Wevar, C.; Maturana, C.; Féral, J.P.; David, B.; Poulin, E. Genetic structure and demographic inference of the regular sea urchin Sterechinus neumayeri (Meissner, 1900) in the Southern Ocean: The role of the last glaciation. PLoS ONE 2018, 13, e0197611. [Google Scholar] [CrossRef]
- Ibáñez, C.M.; Rezende, E.L.; Sepúlveda, R.D.; Avaria-Llautureo, J.; Hernández, C.E.; Sellanes, J.; Pardo-Gandarillas, M.C. Thorson’s rule, life-history evolution, and diversification of benthic octopuses (Cephalopoda: Octopodoidea). Evolution 2018, 72, 1829–1839. [Google Scholar] [CrossRef]
- Thatje, S.; Hillenbrand, C.D.; Mackensen, A.; Larter, R. Life hung by a thread: Endurance of Antarctic fauna in glacial periods. Ecology 2008, 89, 682–692. [Google Scholar] [CrossRef]
- Convey, P.; Bindschadler, R.; Di Prisco, G.; Fahrbach, E.; Gutt, J.; Hodgson, D.A.; ACCE Consortium. Antarctic climate change and the environment. Antarct. Sci. 2009, 21, 541–563. [Google Scholar] [CrossRef]
- Poulin, E.; Palma, A.T.; Féral, J.P. Evolutionary versus ecological success in Antarctic benthic invertebrates. Trends Ecol. Evol. 2002, 17, 218–222. [Google Scholar] [CrossRef]
- Allcock, A.L.; Strugnell, J.M. Southern Ocean diversity: New paradigms from molecular ecology. Trends Ecol. Evol. 2012, 27, 520–528. [Google Scholar] [CrossRef]
- Fraser, C.I.; Nikula, R.; Ruzzante, D.E.; Waters, J.M. Poleward bound: Biological impacts of Southern Hemisphere glaciation. Trends Ecol. Evol. 2012, 27, 462–471. [Google Scholar] [CrossRef]
- Hemery, L.G.; Eléaume, M.; Roussel, V.; Améziane, N.; Gallut, C.; Steinke, D.; Wilson, N. Comprehensive sampling reveals circumpolarity and sympatry in seven mitochondrial lineages of the Southern Ocean crinoid species Promachocrinus kerguelensis (Echinodermata). Mol. Ecol. 2012, 21, 2502–2518. [Google Scholar] [CrossRef]
- González-Wevar, C.A.; David, B.; Poulin, E. Phylogeography and demographic inference in Nacella (Patinigera) concinna (Strebel, 1908) in the western Antarctic Peninsula. Deep-Sea Res. II 2011, 58, 220–229. [Google Scholar] [CrossRef]
- Strugnell, J.M.; Allcock, A.L.; Watts, P.C. Closely related octopus species show different spatial genetic structures in response to the Antarctic seascape. Ecol. Evol. 2017, 7, 8087–8099. [Google Scholar] [CrossRef]
- González-Wevar, C.; Segovia, N.; Rosenfeld, S.; Doll, D.; Maturana, C.S.; Naretto, J.; Hüne, M.; Gérard, K.; Díaz, A.; Spencer, H.G.; et al. Contrasting biogeographical patterns in Margarella (Gastropoda: Calliostomatidae: Margarellinae) across the Antarctic Polar Front. Mol. Phylogenet. Evol. 2021, 156, 107039. [Google Scholar] [CrossRef]
- Levicoy, D.; Flores, K.; Rosenfeld, S.; Cárdenas, L. Phylogeography and genetic diversity of the microbivalve Kidderia subquadrata, reveals new data from West Antarctic Peninsula. Sci. Rep. 2021, 11, 5705. [Google Scholar] [CrossRef] [PubMed]
- Díaz, A.; Féral, J.P.; David, B.; Saucède, T.; Poulin, E. Evolutionary pathways among shallow and deep-sea echinoids of the genus Sterechinus in the Southern Ocean. Deep-Sea Res. II 2011, 58, 205–211. [Google Scholar] [CrossRef]
- De Broyer, C.; Danis, B. How many species in the Southern Ocean? Towards a dynamic inventory of the Antarctic marine species. Deep-Sea Res. II 2011, 58, 5–17. [Google Scholar] [CrossRef]
- Sirenko, B. Leptochiton antarcticus (Mollusca, Polyplacophora)—A new species from the Southern Ocean. Ruthenica 2015, 25, 139–146. [Google Scholar]
- Schwabe, E.; Kohlberg, G.; Schories, D. Chitons, Polyplacophora. In Marine Wildlife, King George Island, Antarctica; Schories, D., Kohlberg, G., Eds.; Dirk Schories: Rostok, Germany, 2016; 348p. [Google Scholar]
- Ibáñez, C.M.; Rosenfeld, S.; Carvajal, I.; Catalán, J.; Zapata-Hernández, G.; Gacitúa-Leible, M.; Vargas, R.; Morales, P.; Díaz, A.; Carrasco, S.A.; et al. Polyplacophoran assemblages in shallow waters of the West Antarctic Peninsula: Patterns of diversity, composition and abundance. Ecologies 2025, 6, 23. [Google Scholar] [CrossRef]
- Eernisse, D.J. Chitons. In Encyclopedia of Tidepools and Rocky Shores; Denny, M.W., Gaines, S.D., Eds.; University of California Press: Berkeley, CA, USA, 2007; pp. 127–133. [Google Scholar]
- Sirenko, B.I. The enigmatic viviparous chiton Calloplax vivipara (Plate, 1899) (Mollusca: Polyplacophora) and a survey of the types of reproduction in chitons. Russ. J. Mar. Biol. 2015, 41, 24–31. [Google Scholar] [CrossRef]
- Zettler, M.L.; Bick, A. Molluscs from a shallow bay of King George Island (Antarctica, South Shetland Islands): An annotated checklist with new distributional records. Zootaxa 2025, 5631, 401–450. [Google Scholar] [CrossRef]
- Folmer, O.; Black, M.; Hoeh, W.; Lutz, R.; Vrijenhoek, R. DNA primers for amplification of mitochondrial cytochrome c oxidase subunit I from diverse metazoan invertebrates. Mol. Mar. Biol. Biotechnol. 1994, 3, 294–299. [Google Scholar]
- Aljanabi, S.M.; Martínez, I. Universal and rapid salt-extraction of high quality genomic DNA for PCR-based techniques. Nucleic Acids Res. 1997, 25, 4692–4693. [Google Scholar] [CrossRef] [PubMed]
- Filatov, D.A. Processing and population genetic analysis of multigenic datasets with ProSeq3 software. Bioinformatics 2009, 25, 3189–3190. [Google Scholar] [CrossRef] [PubMed]
- Tamura, K.; Stecher, G.; Kumar, S. MEGA11: Molecular evolutionary genetics analysis version 11. Mol. Biol. Evol. 2021, 38, 3022–3027. [Google Scholar] [CrossRef] [PubMed]
- Rozas, J.; Ferrer-Mata, A.; Sánchez-DelBarrio, J.C.; Guirao-Rico, S.; Librado, P.; Ramos-Onsins, S.E.; Sánchez-Gracia, A. DnaSP 6: DNA sequence polymorphism analysis of large data sets. Mol. Biol. Evol. 2017, 34, 3299–3302. [Google Scholar] [CrossRef]
- Salzburger, W.; Ewing, G.B.; Von Haeseler, A. The performance of phylogenetic algorithms in estimating haplotype genealogies with migration. Mol. Ecol. 2011, 20, 1952–1963. [Google Scholar] [CrossRef] [PubMed]
- Guillot, G.; Santos, F.; Estoup, A. Analysing georeferenced population genetics data with ‘GENELAND’: A new algorithm to deal with null alleles and a friendly graphical user interface. Bioinformatics 2008, 24, 1406–1407. [Google Scholar] [CrossRef]
- R Core Team. R: A Language and Environment for Statistical Computing; R Foundation for Statistical Computing: Vienna, Austria, 2025; Available online: http://www.r-project.org/ (accessed on 10 January 2025).
- Rambaut, A.; Drummond, A.J. Tracer v1.5. Available online: http://tree.bio.ed.ac.uk/software/tracer (accessed on 10 January 2025).
- Excoffier, L.; Lischer, H.E.L. Arlequin suite ver 3.5: A new series of programs to perform population genetics analyses under Linux and Windows. Mol. Ecol. Res. 2010, 10, 564–567. [Google Scholar] [CrossRef] [PubMed]
- Tajima, F. Statistical method for testing the neutral mutation hypothesis by DNA polymorphism. Genetics 1989, 123, 585–595. [Google Scholar] [CrossRef]
- Fu, Y.X. Statistical properties of segregating sites. Theor. Pop. Biol. 1995, 48, 172–197. [Google Scholar] [CrossRef] [PubMed]
- Drummond, A.J.; Rambaut, A. BEAST: Bayesian evolutionary analysis by sampling trees. BMC Evol. Biol. 2007, 7, 214. [Google Scholar] [CrossRef]
- Drummond, A.J.; Rambaut, A.; Shapiro, B.; Pybus, O.G. Bayesian coalescent inference of past population dynamics from molecular sequences. Mol. Biol. Evol. 2005, 22, 1185–1192. [Google Scholar] [CrossRef]
- Posada, D. jModelTest: Phylogenetic model averaging. Mol. Biol. Evol. 2008, 25, 1253–1256. [Google Scholar] [CrossRef]
- Choi, E.H.; Yeo, M.Y.; Kim, G.; Park, B.; Shin, C.R.; Baek, S.Y.; Hwang, U.W. Liolophura species discrimination with geographical distribution patterns and their divergence and expansion history on the northwestern Pacific coast. Sci. Rep. 2021, 11, 5705. [Google Scholar] [CrossRef]
- Zachos, J.; Pagani, M.; Sloan, L.; Thomas, E.; Billups, K. Trends, rhythms, and aberrations in global climate 65 Ma to present. Science 2001, 292, 686–693. [Google Scholar] [CrossRef]
- Raupach, M.J.; Thatje, S.; Dambach, J.; Rehm, P.; Misof, B.; Leese, F. Genetic homogeneity and circum-Antarctic distribution of two benthic shrimp species of the Southern Ocean, Chorismus antarcticus and Nematocarcinus lanceopes. Mar. Biol. 2010, 157, 1783–1797. [Google Scholar] [CrossRef][Green Version]
- Díaz, A.; González-Wevar, C.A.; Maturana, C.S.; Palma, A.T.; Poulin, E.; Gerard, K. Restricted geographic distribution and low genetic diversity of the brooding sea urchin Abatus agassizii (Spatangoidea: Schizasteridae) in the South Shetland Islands: A bridgehead population before the spread to the northern Antarctic Peninsula? Rev. Chil. Hist. Nat. 2012, 85, 457–468. [Google Scholar] [CrossRef]
- Guillemin, M.L.; Dubrasquet, H.; Reyes, J.; Valero, M. Comparative phylogeography of six red algae along the Antarctic Peninsula: Extreme genetic depletion linked to historical bottlenecks and recent expansion. Polar Biol. 2018, 41, 827–837. [Google Scholar] [CrossRef]
- Hyman, L.H. The Invertebrates: Mollusca I; McGraw-Hill: New York, NY, USA, 1967; Volume VI, 72p. [Google Scholar]
- Eernisse, D.J. Reproductive patterns in six species of Lepidochitona (Mollusca: Polyplacophora) from the Pacific coast of North America. Biol. Bull. 1988, 174, 287–302. [Google Scholar] [CrossRef]
- Fernández, R.; Lemer, S.; McIntyre, E.; Giribet, G. Comparative phylogeography and population genetic structure of three widespread mollusc species in the Mediterranean and near Atlantic. Mar. Ecol. 2015, 36, 701–715. [Google Scholar] [CrossRef]
- Thiel, M.; Gutow, L. The ecology of rafting in the marine environment. II. The rafting organisms and community. Oceanogr. Mar. Biol. 2005, 43, 279–418. [Google Scholar]
- Salloum, P.M.; De Villemereuil, P.; Santure, A.W.; Waters, J.M.; Lavery, S.D. Hitchhiking consequences for genetic and morphological patterns: The influence of kelp-rafting on a brooding chiton. Biol. J. Linn. Soc. 2020, 130, 756–770. [Google Scholar] [CrossRef]
- Fraser, C.I.; Dutoit, L.; Morrison, A.K.; Pardo, L.M.; Smith, S.D.A.; Pearman, W.S.; Macaya, E.C. Southern Hemisphere coasts are biologically connected by frequent, long-distance rafting events. Curr. Biol. 2022, 32, 3154–3160.e3153. [Google Scholar] [CrossRef]
- Macaya, E.C.; Tala, F.; Hinojosa, I.A.; Rothäusler, E. Detached seaweeds as important dispersal agents across the Southern Ocean. In Antarctic Seaweeds; Springer: Cham, Switzerland, 2020; pp. 59–81. [Google Scholar] [CrossRef]
- González-Wevar, C.A.; Poveda, Y.; Segovia, N.I.; Rosenfeld, S.; Maturana, C.S.; Jeldres, V.; Poulin, E. Both high and low dispersal? Apparently contradictory genetic patterns in the Antarctic littorinid gastropod Laevilacunaria antarctica. Front. Ecol. Evol. 2024, 11, 1320649. [Google Scholar] [CrossRef]
- Waters, J.M.; King, T.M.; Fraser, C.I.; Craw, D. An integrated ecological, genetic, and geological assessment of long-distance dispersal by invertebrates on kelp rafts. Front. Biogeogr. 2018, 10, e40888. [Google Scholar] [CrossRef]
- Moffat, C.; Beardsley, R.C.; Owens, B.; Van Lipzig, N. A first description of the Antarctic Peninsula Coastal Current. Deep-Sea Res. II: Top. Stud. 2008, 55, 277–293. [Google Scholar] [CrossRef]
- Moffat, C.; Meredith, M. Shelf–ocean exchange and hydrography west of the Antarctic Peninsula: A review. Philos. Transact. A Math. Phys. Eng. Sci. 2018, 376, 20170164. [Google Scholar] [CrossRef]
- Bernal-Durán, V.; Donoso, D.; Piñones, A.; Jonsson, P.R.; Benestan, L.; Landaeta, M.F.; Naretto, J.; Gerard, K.; Haye, P.A.; González-Wevar, C.; et al. Combining population genomics and biophysical modelling to assess connectivity patterns in an Antarctic fish. Mol. Ecol. 2024, 33, e17360. [Google Scholar] [CrossRef] [PubMed]
- Mix, A.C.; Bard, E.; Schneider, R. Environmental processes of the ice age: Land, oceans, glaciers (EPILOG). Quat. Sci. Rev. 2001, 20, 627–657. [Google Scholar] [CrossRef]
- Pflaumann, U.; Sarnthein, M.; Chapman, M.; d’Abreu, L.; Funnell, B.; Huels, M.; Weinelt, M. Glacial North Atlantic: Sea-surface conditions reconstructed by GLAMAP 2000. Paleoceanography 2003, 18, 1065. [Google Scholar] [CrossRef]
- Maggs, C.A.; Castilho, R.; Foltz, D.; Henzler, C.; Jolly, M.T.; Kelly, J.; Olsen, J.; Perez, K.E.; Stam, W.; Väinölä, R.; et al. Evaluating signatures of glacial refugia for North Atlantic benthic marine taxa. Ecology 2008, 89, S108–S122. [Google Scholar] [CrossRef] [PubMed]
- Le Brocq, A.M.; Bentley, M.J.; Hubbard, A.; Fogwill, C.J.; Sugden, D.E.; Whitehouse, P.L. Reconstructing the Last Glacial Maximum ice sheet in the Weddell Sea embayment, Antarctica, using numerical modelling constrained by field evidence. Quat. Sci. Rev. 2011, 30, 2422–2432. [Google Scholar] [CrossRef]
- Dietz, L.; Dömel, J.S.; Leese, F.; Mahon, A.R.; Mayer, C. Phylogenomics of the longitarsal Colossendeidae: The evolutionary history of an Antarctic sea spider radiation. Mol. Phylogenet. Evol. 2019, 136, 206–214. [Google Scholar] [CrossRef]
Disclaimer/Publisher’s Note: The statements, opinions and data contained in all publications are solely those of the individual author(s) and contributor(s) and not of MDPI and/or the editor(s). MDPI and/or the editor(s) disclaim responsibility for any injury to people or property resulting from any ideas, methods, instructions or products referred to in the content. |
© 2025 by the authors. Licensee MDPI, Basel, Switzerland. This article is an open access article distributed under the terms and conditions of the Creative Commons Attribution (CC BY) license (https://creativecommons.org/licenses/by/4.0/).