Article

Projecting Range Shifts of Hippophae neurocarpa in China Under Future Climate Change Using CMIP6 Models

1
School of Human Settlements, Mianyang Teachers’ College, Mianyang 621016, China
2
College of Life Science, China West Normal University, Nanchong 637002, China
*
Author to whom correspondence should be addressed.
These authors contributed equally to this work and should be regarded as co-first authors.
Diversity 2025, 17(9), 609; https://doi.org/10.3390/d17090609
Submission received: 17 July 2025 / Revised: 26 August 2025 / Accepted: 27 August 2025 / Published: 28 August 2025
(This article belongs to the Topic Responses of Trees and Forests to Climate Change)

Abstract

Hippophae neurocarpa S. W. Liu & T. N. Ho exhibits established medicinal characteristics, valuable dietary attributes, and remarkable adaptability, displaying strong resistance to cold, drought, and to acidic and alkaline soils. These traits and others make it a valuable species for soil erosion control and a distinctive economic forest tree in western China. However, research on its geographic distribution remains limited. To address this gap, we employed the MaxEnt model to map its current distribution and to predict the future geographic distribution of suitable habitats for this species under SSP1-2.6, SSP2-4.5, and SSP5-8.5 climate scenarios. Collectively, these data suggest that the species’ current and future suitable habitats are predominantly concentrated at the junction of the northeastern Qinghai-Tibet Plateau and the Loess Plateau. Under present climatic conditions, highly suitable habitats are primarily located in the northeastern Qinghai-Tibet Plateau, with smaller patches in the Hengduan and Himalaya mountains. The AUC value of this model reached 0.954; projections under three future emission scenarios indicate an overall expansion trend in suitable habitat area. Notably, by the 2070s under the SSP2-4.5 scenario, the total suitable habitat area is projected to increase by 11.64%—the highest among all scenarios. Additionally, climate change is expected to drive a slight northward shift in the species’ distribution center toward higher latitudes. Key environmental factors influencing its projected distribution include elevation (elev), temperature seasonality (bio04), mean temperature of the coldest quarter (bio11), and precipitation of the warmest quarter (bio18). These insights are critical for conserving H. neurocarpa’s genetic resources and guiding future biodiversity conservation strategies.

1. Introduction

Hippophae neurocarpa S. W. Liu & T. N. Ho, commonly known as rib-fruit sea buckthorn, is a deciduous shrub or small tree characterized by its rapid growth, strong adaptability, cold and drought resistance, and tolerance to acidic and alkaline conditions. Plants of the genus Hippophae thrive even in barren soils owing to their nitrogen-fixing ability [1], with H. neurocarpa playing a significant role in improving soil quality in planted areas. They function as ecological engineers, simultaneously enhancing ecosystem services through (a) environmental remediation, (b) socioeconomic stimulation in agrarian regions, and (c) serving as primary colonizers for erosion mitigation and desertification reversal [2]. These plants are of great economic and ecological significance and are rich in various biologically and pharmacologically active substances. The seeds and fruits of Hippophae are abundant in oils, which are widely used in the cosmetics industry and as nutritional supplements, as well as in medicine for treating various diseases. The international nutraceutical market has long relied on nervonic acid extracted from shark brains (yielding only about 0.5 kg per ton of shark brain), leading to resource depletion. European and American companies are actively seeking botanical alternatives. H. neurocarpa, as one of the dozen-plus plants containing nervonic acid, has yet to achieve industrial-scale production due to its low content and bottlenecks in extraction technology. Additionally, Hippophae fruits are rich in a variety of bioactive compounds, including organic acids, phenolics, flavonoids, and vitamins [3], and demonstrate combined redox-modulating and anti-inflammatory capacities [4]. Plants of the genus Hippophae have a wide distribution, primarily found in northeastern, northern, and northwestern China. In Tibet, they are mainly distributed along riverbanks, floodplains, and valleys in the Hengduan Mountains and the Yarlung Tsangpo Grand Canyon region of the Qinghai-Tibet Plateau [2]. Influenced by Quaternary climatic oscillations, natural populations of Hippophae neurocarpa are restricted to high-altitude areas of the Qinghai-Tibet Plateau [5], predominantly at elevations between 3000 and 4200 m [6], including the provinces of Qinghai, Tibet, Sichuan, and Gansu [7]. They are typically distributed along riverbanks, indicating a preference for moist habitats and sensitivity to changes in precipitation [6]. Previous and ongoing research has largely focused on the morphological classification of Hippophae species, the maternal origin of H. neurocarpa [1], genetic differentiation [6], and bioactivity. However, there is limited research on the current distribution of H. neurocarpa and its suitable habitats under future climate change scenarios. Further studies in this area would help conserve the potential germplasm resources of this valuable species and lay a foundation for future biodiversity conservation efforts.
With intensified human activities, industrial gas emissions, and reduction in vegetation, greenhouse gas emissions have increased significantly. The continuous rise in greenhouse gas concentrations has enhanced the atmosphere’s ability to absorb infrared radiation, leading to an increase in global temperatures. Climate models consistently predict an end-century warming trajectory of 0.3–4.8 °C relative to 1995–2014 baseline, with median values clustering at 2.7 °C under business-as-usual [8]. The increase in greenhouse gases exacerbates the instability of the climate system, resulting in more frequent and intense extreme weather events such as heatwaves, heavy rainfall, and droughts. In terms of ecological impacts, climate change extremes pose threats to biodiversity by altering the proper functioning of ecosystems. Heat-loving species may, for example, expand rapidly, while cold-adapted species will see their habitats reduced. As a result, quantitative and visual analyses of the effects of climate change on the distributions of different species have attracted the attention of many researchers worldwide [9].
Species Distribution Models (SDMs) statistically correlate species presence records with geospatial environmental predictors (e.g., bioclimatic indices, terrain attributes, and edaphic factors) to estimate habitat suitability [10]. These models use statistical analysis and machine learning methods to establish the relationship between species niches and environmental factors. This allows predictions of species distributions in unsampled areas or under future environmental change scenarios [11]. With the increasing impacts of global climate change and human activities, species survival and habitats face significant challenges. Common machine learning algorithms used in SDMs include MaxEnt, Random Forest, and Climex models [12]. These models are capable of handling complex nonlinear relationships and are well-suited for large-scale datasets.
The Maximum Entropy Model (MaxEnt) is a widely used method in species distribution modelling, primarily focused on predicting the potential distribution range of species. Based on the principle of maximum entropy, it calculates the probability distribution of statistical modeling with machine learning [13]. MaxEnt (https://biodiversityinformatics.amnh.org/open_source/maxent/, version 3.4.1, accessed on 1 July 2023) has become an important tool in ecological studies of species distribution due to its ability to achieve accurate predictions with minimal data. The advantages of the MaxEnt model include: (1) Presence-Only Data Requirement: MaxEnt utilizes species presence data exclusively, eliminating the need for absence records (background points effectively substitute for absence data) [14]. This approach reduces data collection demands and streamlines preprocessing. (2) Robust Predictive Accuracy: The model maintains high predictive accuracy even with limited sample sizes and under complex environmental gradients [15]. (3) Intuitive Output Visualization: MaxEnt generates directly visualizable outputs, facilitating straightforward interpretation and practical application.
Using the MaxEnt model, this study analyzes the main environmental factors influencing the distribution of Hippophae neurocarpa and predicts its distribution range under different climatic conditions. The specific objectives of this study are to: (1) Identify key environmental drivers influencing H. neurocarpa distribution patterns; (2) Model current potential distribution to enable evidence-based resource exploration; (3) Project future range shifts by comparing contemporary and future climate scenarios, assessing climate change impacts on species distribution. This research provides a scientific basis for planning the conservation of germplasm resources of H. neurocarpa. Relevant authorities can utilize the identified potential suitable habitats of this species to pinpoint its distribution and formulate conservation planning. Furthermore, its key environmental drivers provide guidance for planning activities such as ex situ introduction.

2. Materials and Methods

2.1. Species Occurrence Data

Data on the current distributions of Hippophae neurocarpa were acquired from the Global Biodiversity Information Facility (GBIF Occurrence Download. Available online: https://doi.org/10.15468/dl.hrt2x4 (accessed on 4 March 2025)), and information from the literature. This was supplemented with additional distribution points that were identified using Google Maps (http://ditu.google.cn/, (accessed on 4 March 2025)) by extracting their latitude and longitude coordinates. In total, 211 distribution points for H. neurocarpa were collected. However, due to potential spatial autocorrelation in duplicate or closely spaced geographic distribution data, which may affect model accuracy [16], the distribution data was processed using ENM Tools 1.4 (https://github.com/danlwarren/ENMTools, version 1.4, (accessed on 12 June 2024)) with a grid size of 5 km × 5 km. This tool employs a grid-based method to remove duplicate distribution points within each grid cell, retaining only one point per cell. After this initial processing, the pruned coordinate data was imported into ArcGIS v10.8 (ESRI Inc., Redlands, CA, USA) for further refinement. To ensure that the retained distribution points accurately reflect the actual habitat information of H. neurocarpa, points failing to represent the species’ true habitat characteristics were excluded through spatial validation on maps. In ArcGIS, we first performed coordinate deduplication, then projected the data into the WGS 1984 coordinate system, and finally conducted spatial analysis using the SDM toolbox. As a result, the initial 211 distribution points were reduced to 181 valid points (Figure 1).

2.2. Screening and Processing of the Environmental Variables

In the MaxEnt model, a total of 36 variables were considered (Table 1), including 19 bioclimatic variables, 3 topographic variables, 13 vegetation and soil variables, as well as the human footprint and human influence index. Both climatic and topographic variables are available at four spatial resolutions (10 arc-minutes, 5 arc-minutes, 2.5 arc-minutes, and 30 arc-seconds). Among these, the 2.5 arc-minutes resolution was selected for modeling due to its higher clarity and manageable file size. The bioclimatic variables were downloaded from the World Climate Database (https://www.worldclim.org, (accessed on 12 July 2024)), covering the earliest period (1970–2000) hereinafter referred to as current period,, the 2050s, the 2070s, and the 2090s. Topographic data were sourced from the National Oceanic and Atmospheric Administration’s National Centers for Environmental Information (NOAA NCEI, https://www.ngdc.noaa.gov/, (accessed on 12 July 2024)), including three global Digital Elevation Model (DEM) datasets. Vegetation and soil variables were obtained from the World Soil Database (https://gaez.fao.org/pages/hwsd, (accessed on 12 July 2024)). The human influence index (hf) was derived from information provided by the Center for International Earth Science Information Network (CIESIN) (http://www.ciesin.org/, (accessed on 12 July 2024)). Leveraging the BCC-CSM2-MR global climate model (CMIP6 ensemble), we projected species distributional responses across three contrasting carbon trajectories: the low-emission SSP1-2.6 pathway representing ambitious climate mitigation, the intermediate SSP2-4.5 scenario reflecting moderate stabilization efforts, and the high-emission SSP5-8.5 trajectory indicative of fossil-fueled development. This multi-scenario framework facilitates robust quantification of climate-driven habitat dynamics under divergent anthropogenic futures [17]. Due to the high correlation between these environmental variables, directly inputting them into the MaxEnt model may result in the model performing overly well on training data but failing to effectively generalize to unobserved areas [18]. This phenomenon, known as overfitting, significantly reduces the model’s predictive power and stability, making it overly sensitive to environmental variables and lowering its prediction accuracy. We addressed this by calculating Pearson correlation coefficients using the ENMTools software v1.4 (https://github.com/danlwarren/ENMTools, version 1.4, (accessed on 27 August 2024)) and using these coefficients to remove climate variables with a correlation greater than 0.8, as well as environmental factors contributing less than 3% to the model, in order to improve the model’s accuracy (Table 2).

2.3. MaxEnt Model Setting

The MaxEnt model’s predictions depend on the feature combination (FC), regularization multiplier (RM), and maximum background points (BC). The model incorporates five feature types: linear (L), quadratic (Q), hinge (H), product (P), and threshold (T). Exhaustive permutation of the five feature types yields 31 possible combinations. With the regularization multiplier ranging discretely from 0.1 to 4.0 (40 values), free combination of these parameters generates 1240 unique configurations.
By integrating species occurrence records with environmental predictors, the MaxEnt model generates probability distributions representing a species’ potential suitable habitat. Using a Subsample replication approach (10 iterations), final predictions represented the ensemble mean of MaxEnt outputs. Model outputs were generated in logistic format, representing 0–1 habitat suitability probabilities [19]. The model performance was evaluated using the Area Under the Curve (AUC) of the Receiver Operating Characteristic (ROC) curve. The AUC value, ranging from 0 to 1, is used to assess the predictive performance of the model, with a higher AUC value indicating better performance [20]. The habitat suitability of the species was quantitatively assessed with a threshold range from 0 to 1. Therefore, the MaxEnt model’s prediction results were imported into ArcGIS 10.8, where they were reclassified and visualized. This was done by using the Jenks’ natural breaks method to subdivide the suitable habitat for H. neurocarpa into four categories comprising: unsuitable areas (0–0.05), low suitability areas (0.05–0.33), moderate suitability areas (0.33–0.66), and high suitability areas (0.66–1) [21]. Finally, the extent of each suitability category was determined, and the area of each suitability zone was calculated under each SSP climate change scenario. This enabled us to compare the potential changes in suitable habitat among different scenarios and to assess the possible impacts of future climate change on species distribution.

2.4. Shift of Suitable Habitat Distribution Center

The SDM Toolbox v10.2 to 9, a Python-based spatial analysis extension for ArcGIS, is extensively utilized in the fields of ecology, evolutionary biology, and genetics. This tool provides two core functionalities: (1), Species Distribution Centroid Calculation—quantifying distribution centers of suitable habitats under current and future climate scenarios; (2), Migration Path Visualization—generating spatiotemporal trajectories of habitat suitability centroids. In this study, we employed the toolbox to: (1), Calculate distribution centroids for H. neurocarpa in high-suitability zones across contemporary and future periods; (2), Map temporal migration trajectories of high-suitability centroids for this species.

3. Results

3.1. Potentially Suitable Distribution Areas of H. neurocarpa Under Current Climate

The optimized MaxEnt configuration (default: FC = Auto, RM = 1) exhibited high predictive performance in this study. After optimization, the parameters of the MaxEnt model were adjusted to FC = qt and RM = 1.7. Figure 2 shows the ROC curve used to estimate the model’s prediction accuracy, with an average AUC value of 0.95 from repeated runs.
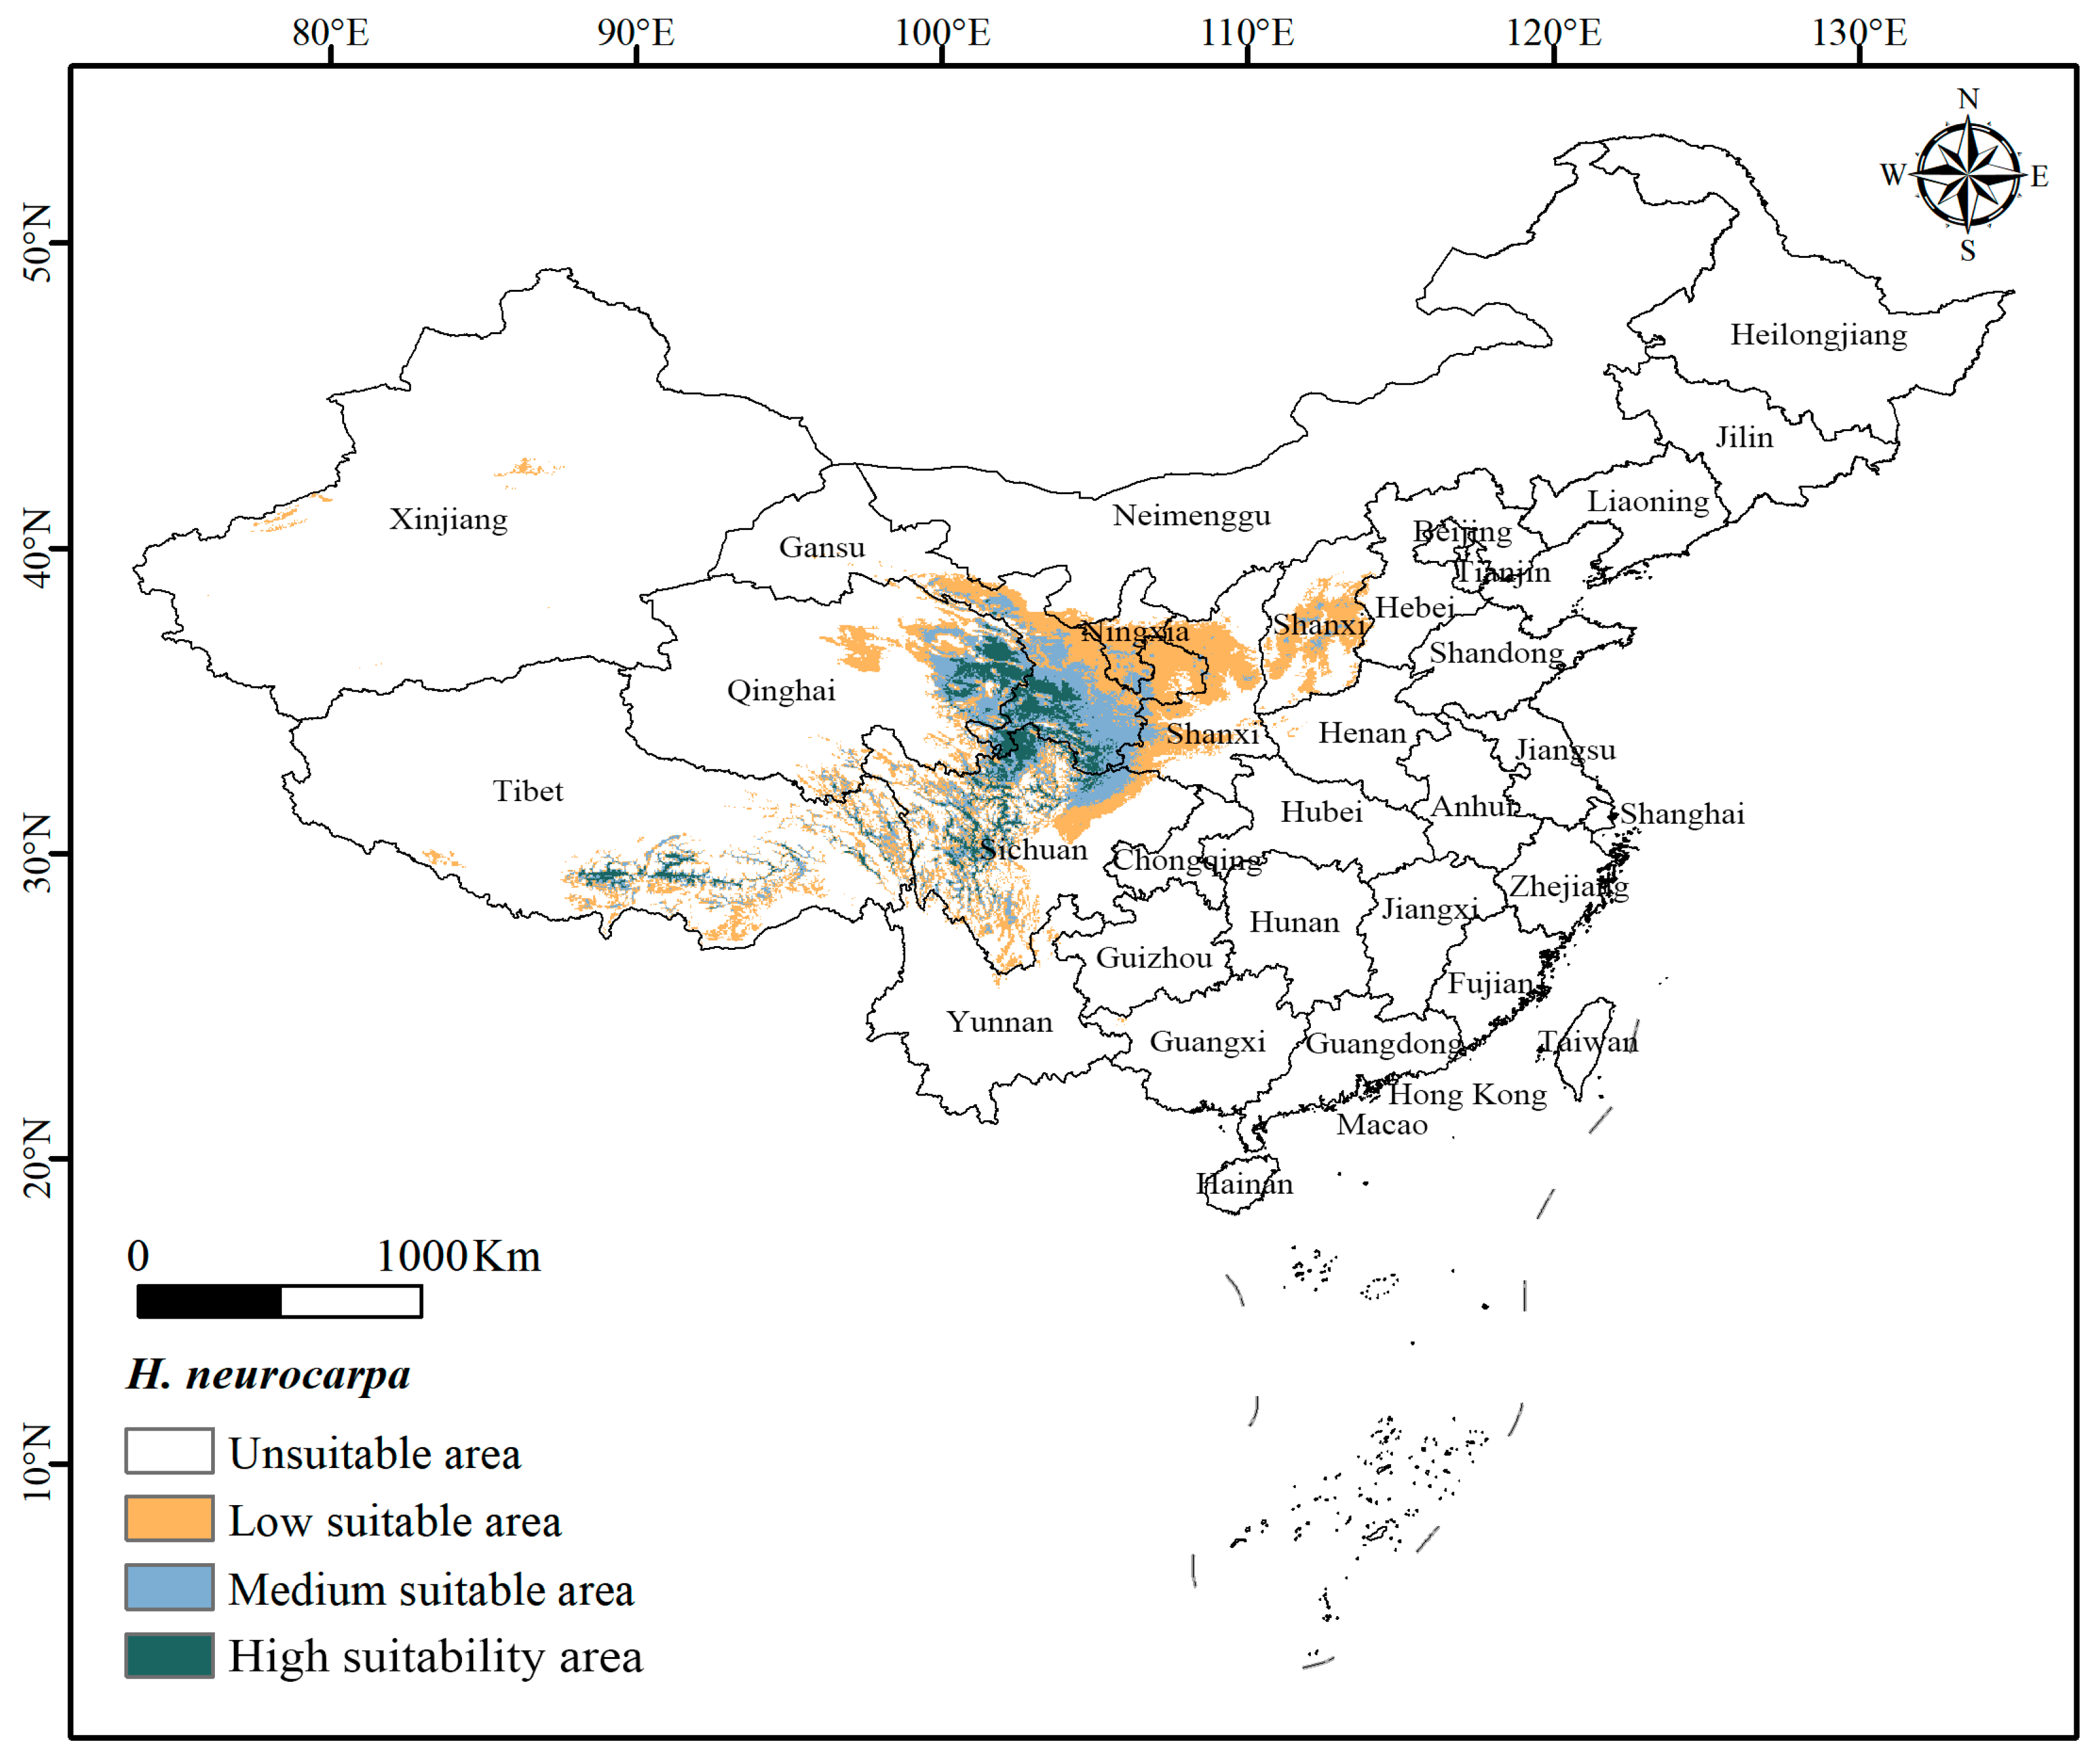
The results indicate that the model performed well, with high prediction accuracy. Four distinct habitat suitability classes were delineated for H. neurocarpa: high, moderate, low, and unsuitable areas. Figure 3 shows the potential distribution patterns of H. neurocarpa in China under current environmental variables.
The results show that the suitable habitat for H. neurocarpa is mainly confined to the area around the junction of the northeastern Tibetan Plateau. This junction is situated in southwestern China and includes the Tibet Autonomous Region, Qinghai Province, western Sichuan, southern Gansu, northwestern Yunnan, southern Xinjiang, and the Loess Plateau. The Loess Plateau straddles north-central China and covers Shanxi Province, central and northern Shaanxi, eastern Gansu, southern Ningxia, western Henan, and parts of southern Inner Mongolia. The high suitability area is relatively small, primarily concentrated in the northeastern part of the Tibetan Plateau, and small portions of the Hengduan Mountains and the Himalayas. The main provinces and regions with significant distributions include the eastern part of Qinghai Province, the western part of Sichuan, the southeastern part of the Tibet Autonomous Region, and the southwestern part of Gansu Province. The moderate and low suitability areas mainly extend from the high suitability area towards the surrounding regions, with low suitability areas significantly spreading towards the northeast, notably in the Shanxi, Shaanxi, and Ningxia Hui Autonomous Region. The total suitable habitat area (the sum of the high, moderate, and low suitability areas) for H. neurocarpa is 268.66 × 10⁴ km2, with the high suitability area covering 36.95 × 10⁴ km2 and the low suitability area being the largest at 171.65 × 10⁴ km2 (Table 3).

3.2. Future Range Dynamics of H. neurocarpa Under Climate Change Scenarios

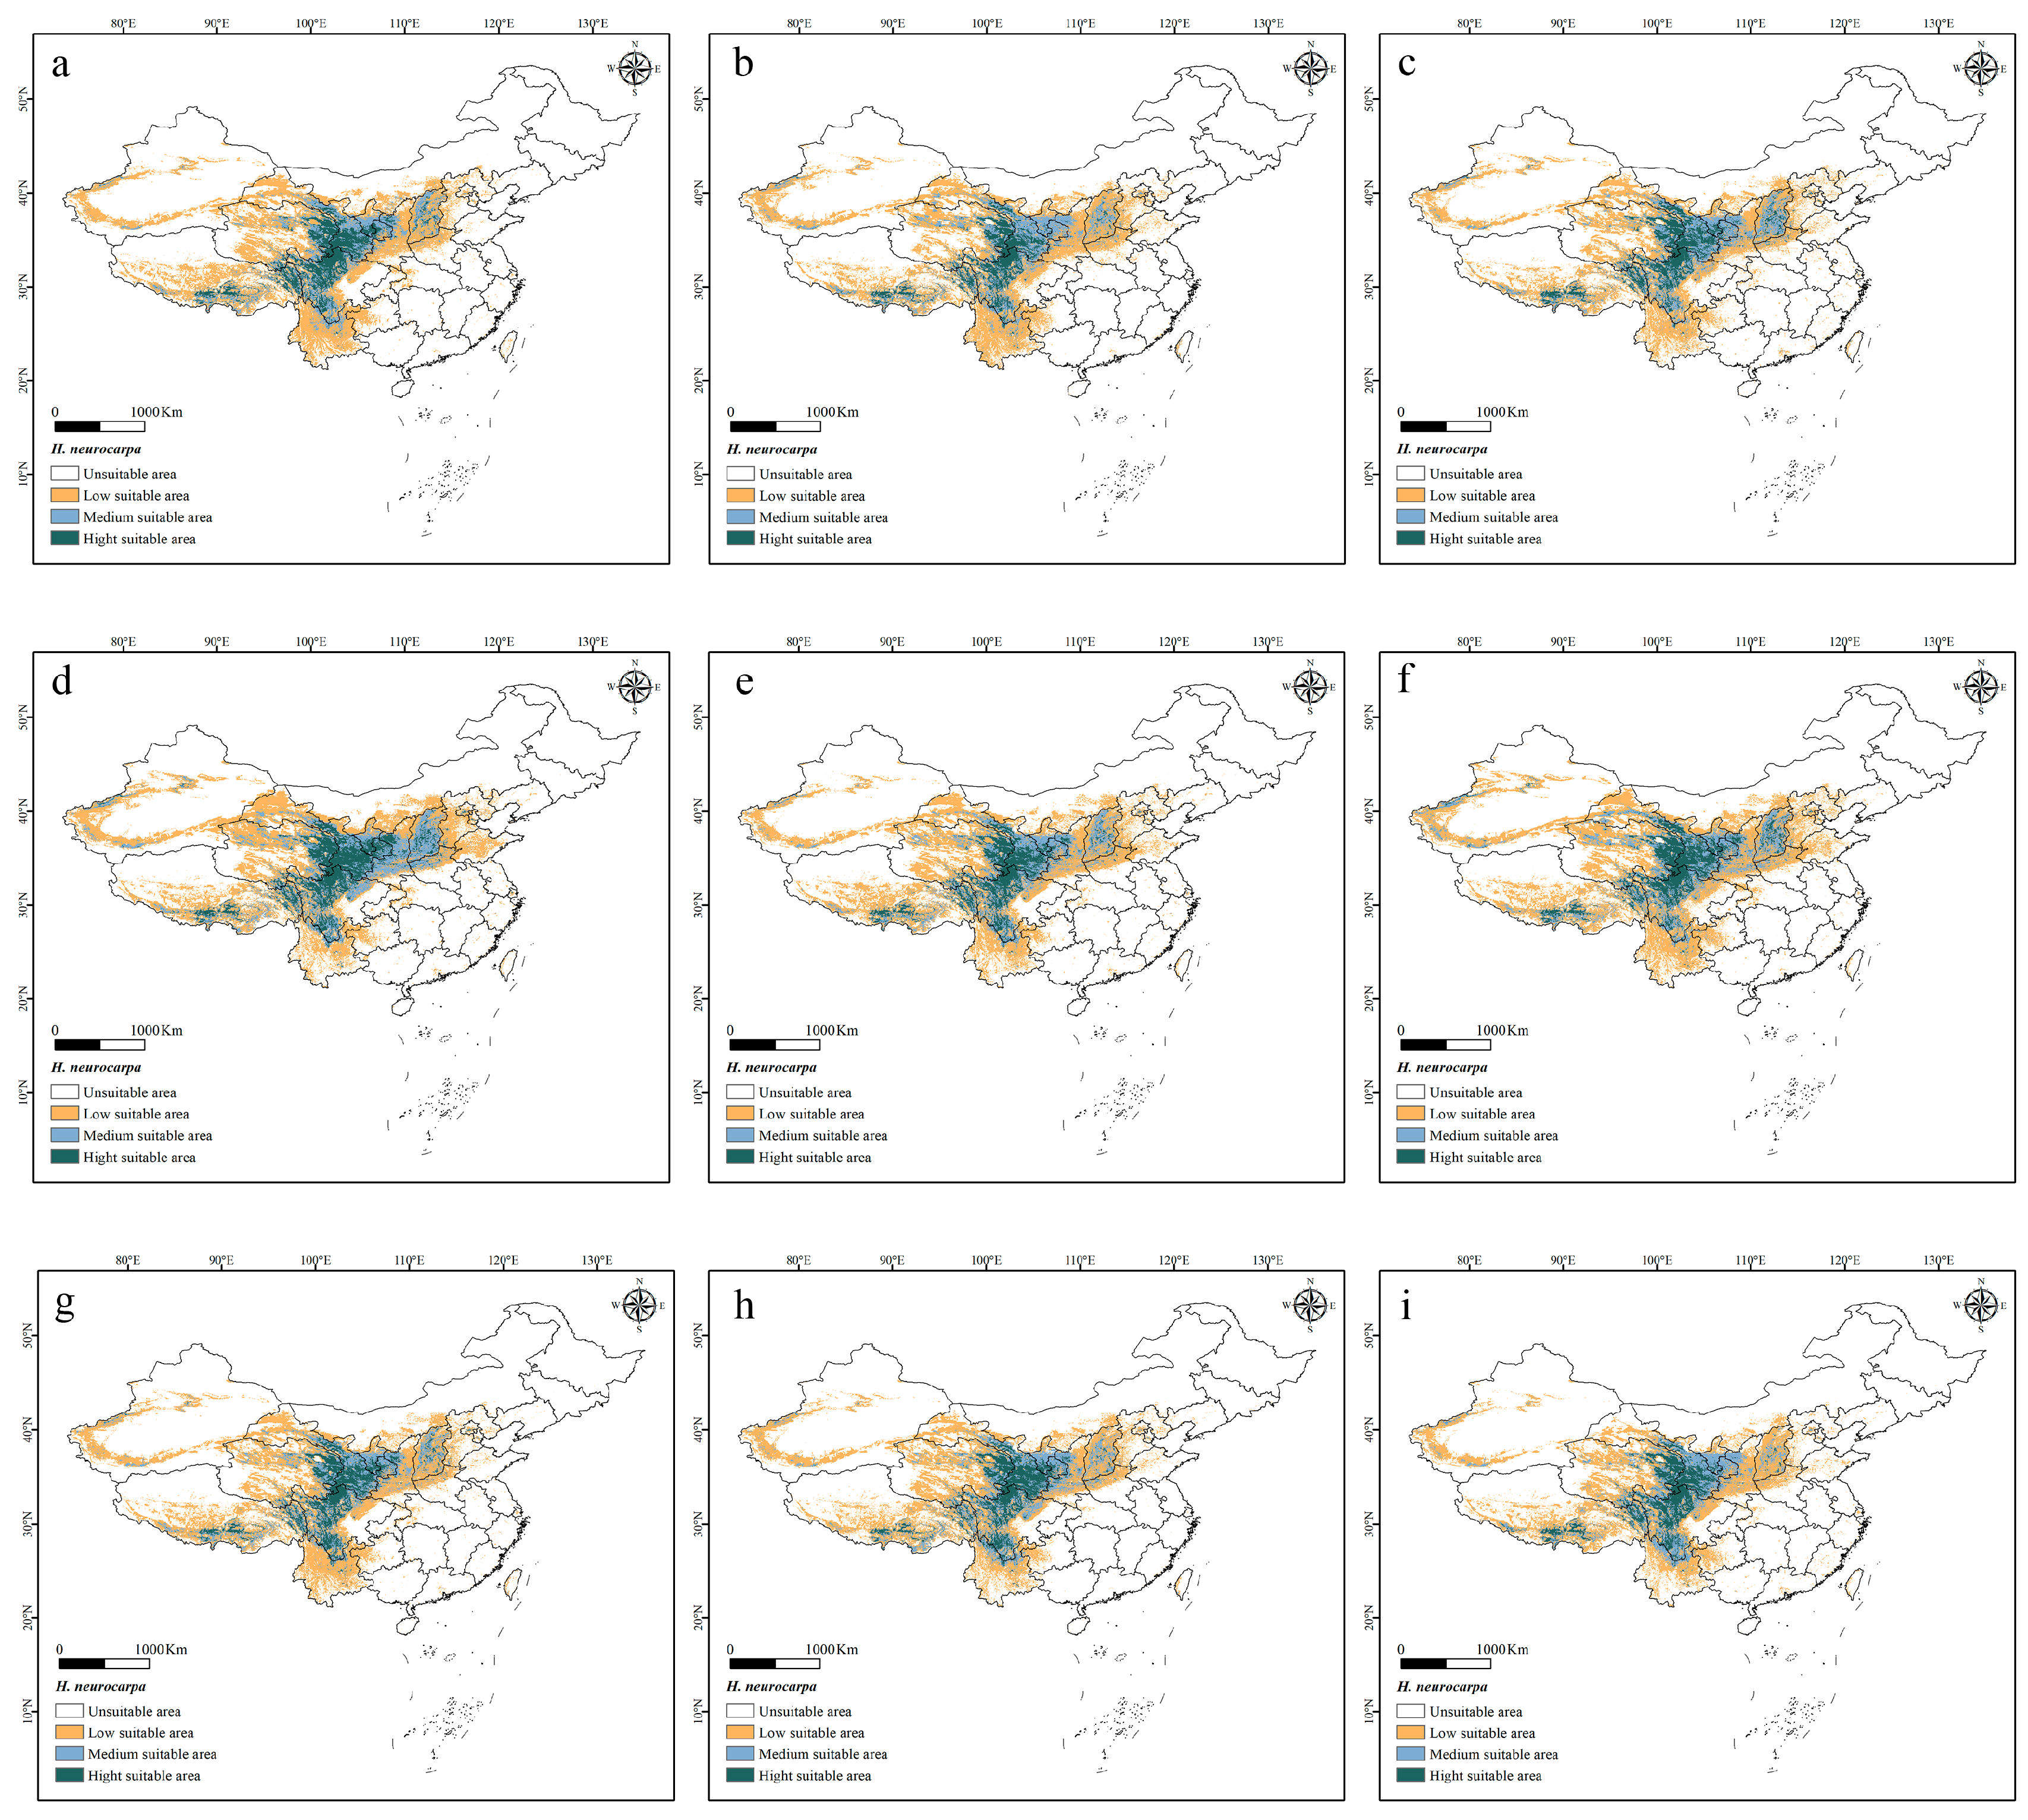
Under the three future emission scenarios, the area of suitable habitat for H. neurocarpa shows both expansion and contraction trends. The most significant increase in total suitable habitat area is projected for the 2070s under SSP2-4.5, rising from 268.66 × 10⁴ km2 to 298.92 × 10⁴ km2 compared to current conditions. Conversely, by the 2090s under SSP5-8.5, the total suitable habitat area is projected to decrease by 12.32%, from 268.66 × 10⁴ km2 to 235.56 × 10⁴ km2. The highly suitable habitat area expands substantially, increasing by 51.44% from 36.95 × 10⁴ km2 to 55.96 × 10⁴ km2 under SSP1-2.6 and by 34.70 to 49.78 × 10⁴ km2 under SSP2-4.5 by the 2050s. Meanwhile, moderately suitable habitat displays more complex dynamics under SSP2-4.5, initially expanding by 34.70% from 60.06 × 10⁴ km2 to 70.43 × 10⁴ km2 by the 2050s, before terminally declining to 66.62 × 10⁴ km2 by the 2090s. These projected shifts suggest that, although climate change may initially promote habitat expansion, the long-term sustainability of moderately suitable areas remains uncertain under higher-emission scenarios (Table 3).
Under future climate scenarios, suitable habitat is projected to expand northward from its current distribution range, with the most significant changes in moderate and low suitability areas occurring in Ningxia Hui Autonomous Region, Gansu Province, Shanxi Province, and the surrounding regions (Figure 4).

3.3. Centroid Changes in Potential Distribution

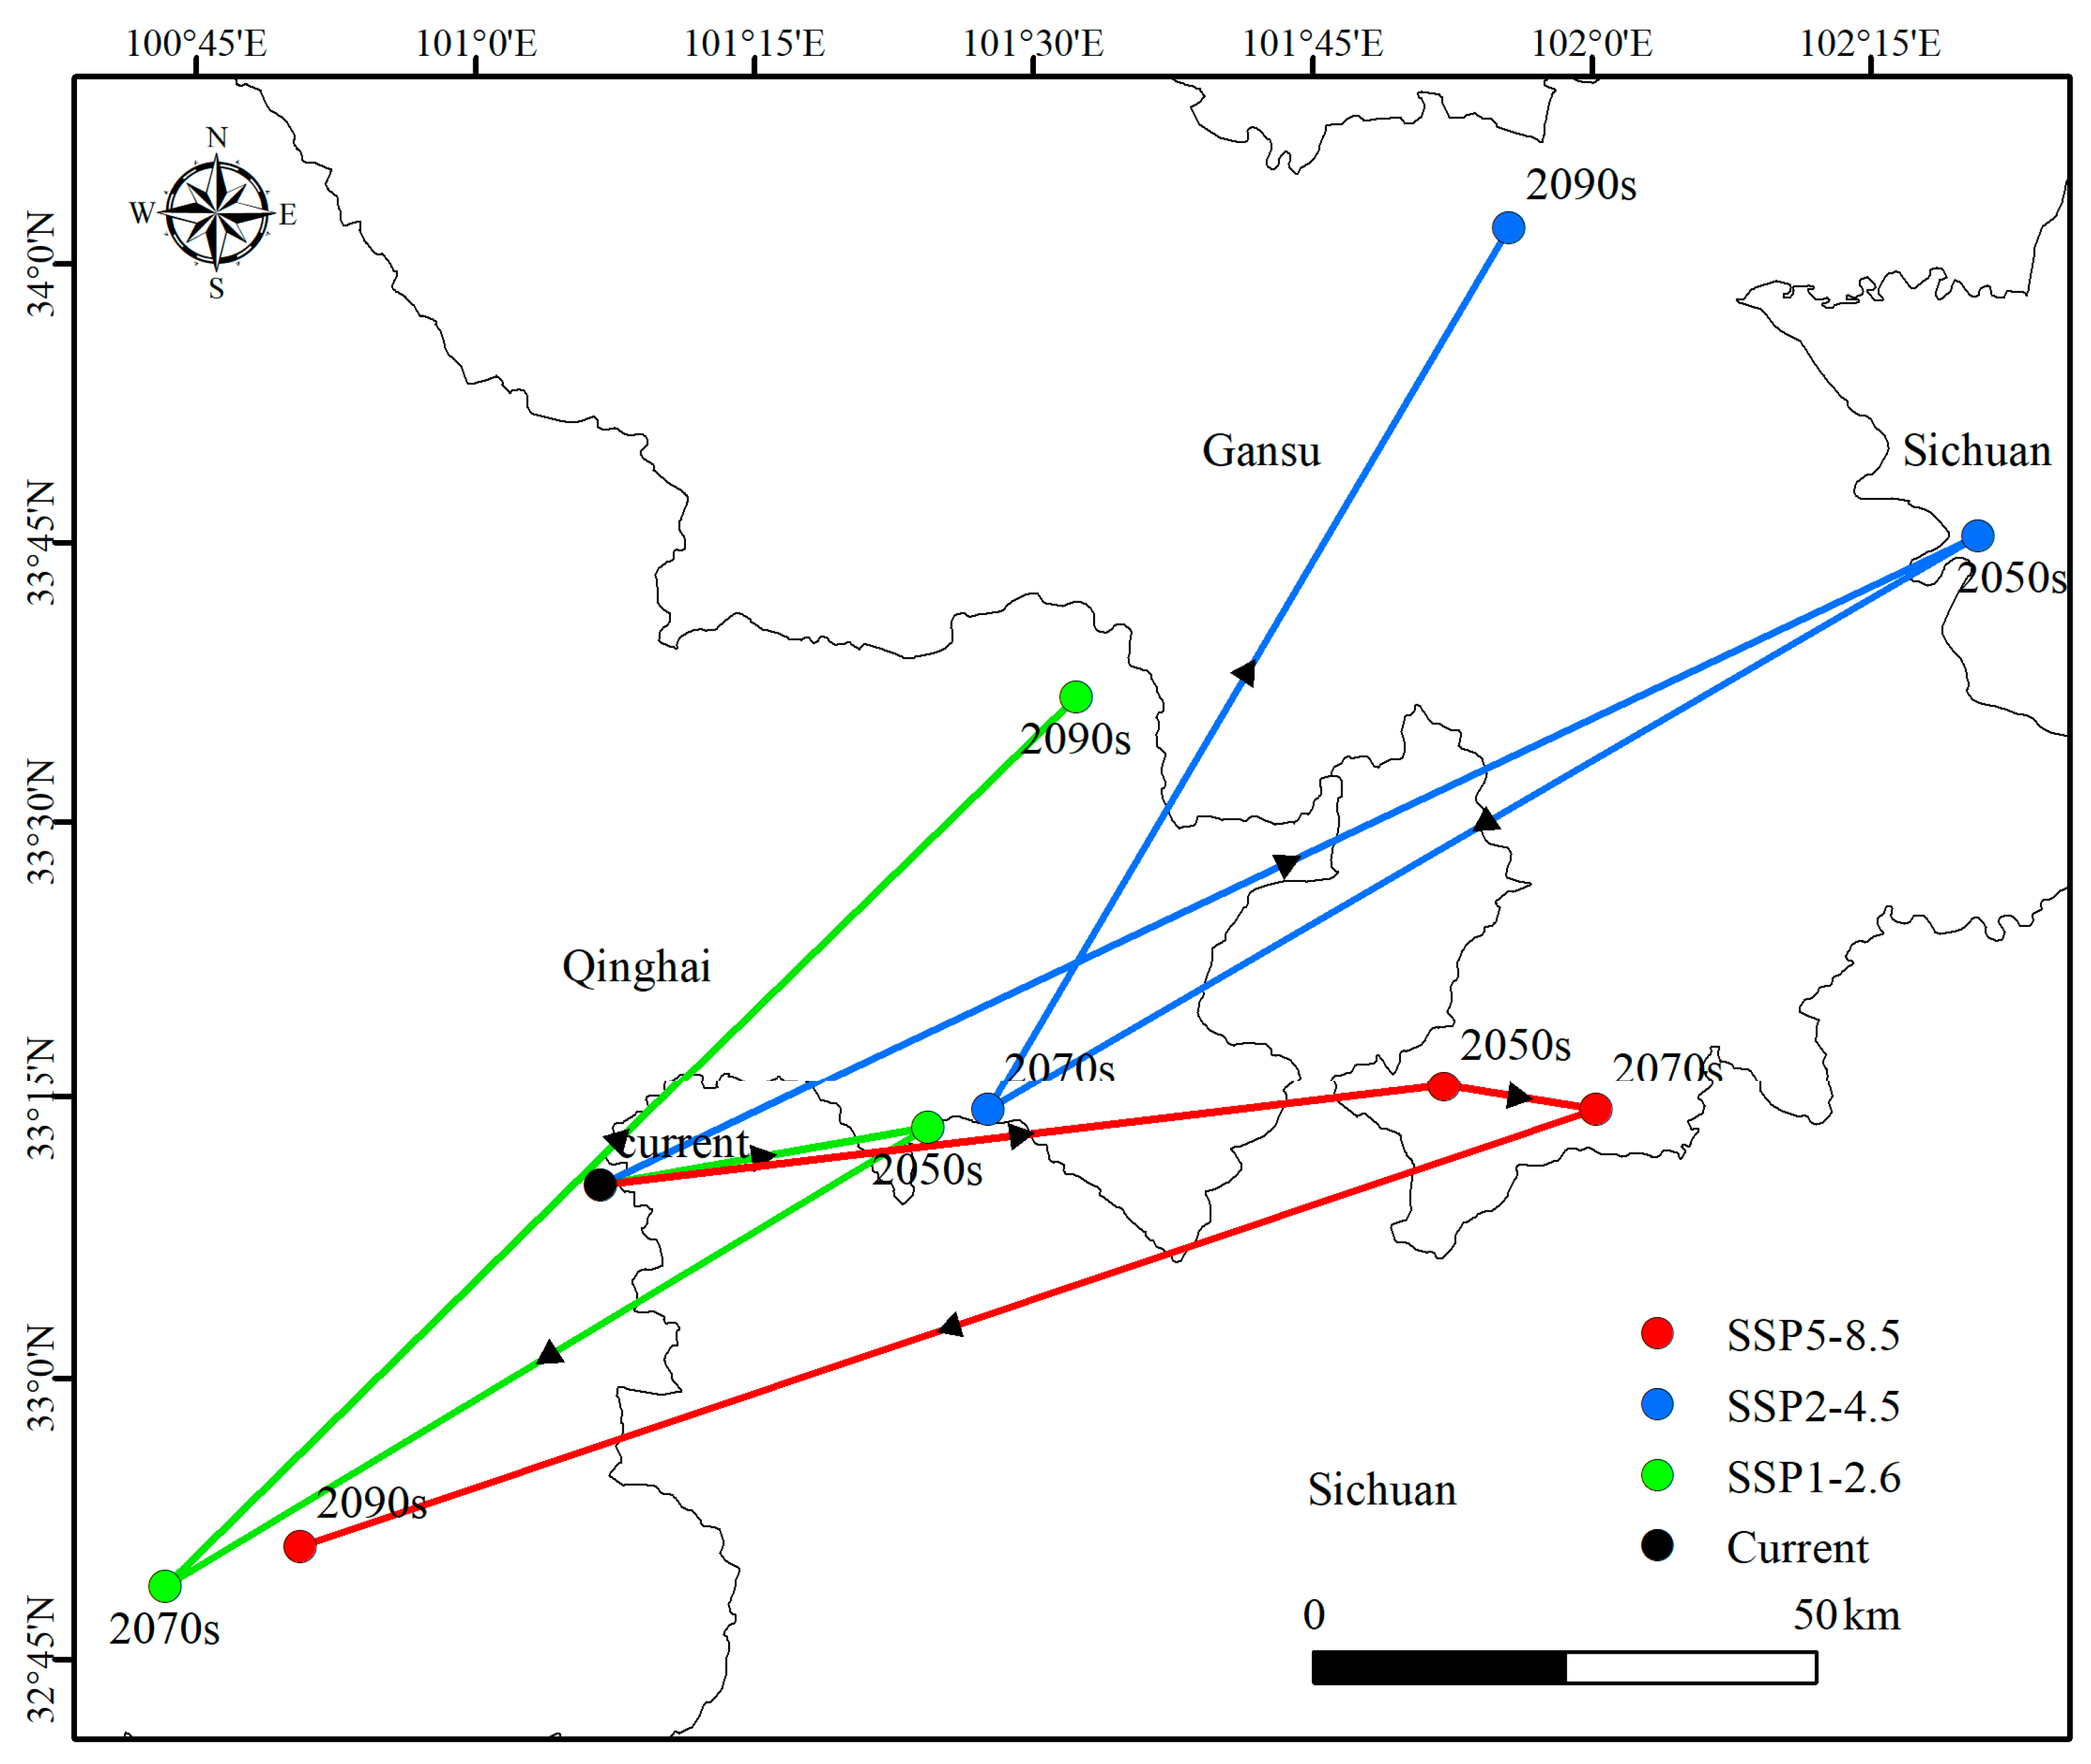
Spatial analysis in ArcGIS quantified distributional nuclei of optimal habitats across climate scenarios, with centroid displacement vectors visualized in Figure 5. Contemporary optimal habitat for H. neurocarpa centers at 33.17° N, 101.11° E (Jiuzhi County, Qinghai). Projections indicate consistent northeastward centroid migration by the 2050s, followed by divergent displacement vectors during the 2050s–2070s across climate scenarios. Climate-driven centroid trajectories exhibited scenario-dependent dynamics. Under SSP1-2.6, the core habitat shifted 105.6 km southwestward by the 2050s, subsequently reversing direction to migrate northeastward through the 2070s–2090s, ultimately stabilizing within Jiuzhi County, Qinghai (101.53° E, 33.61° N). In contrast, SSP2-4.5 drove persistent northeastward displacement across both periods. Notably, SSP5-8.5 induced southwestward divergence, generating a trajectory significantly distinct from other scenarios. This pattern suggests critical climatic thresholds may trigger directional reversals beyond 4.5 °C warming scenarios.

3.4. Relationships Between the Distribution of H. neurocarpa and Bioclimatic Variables

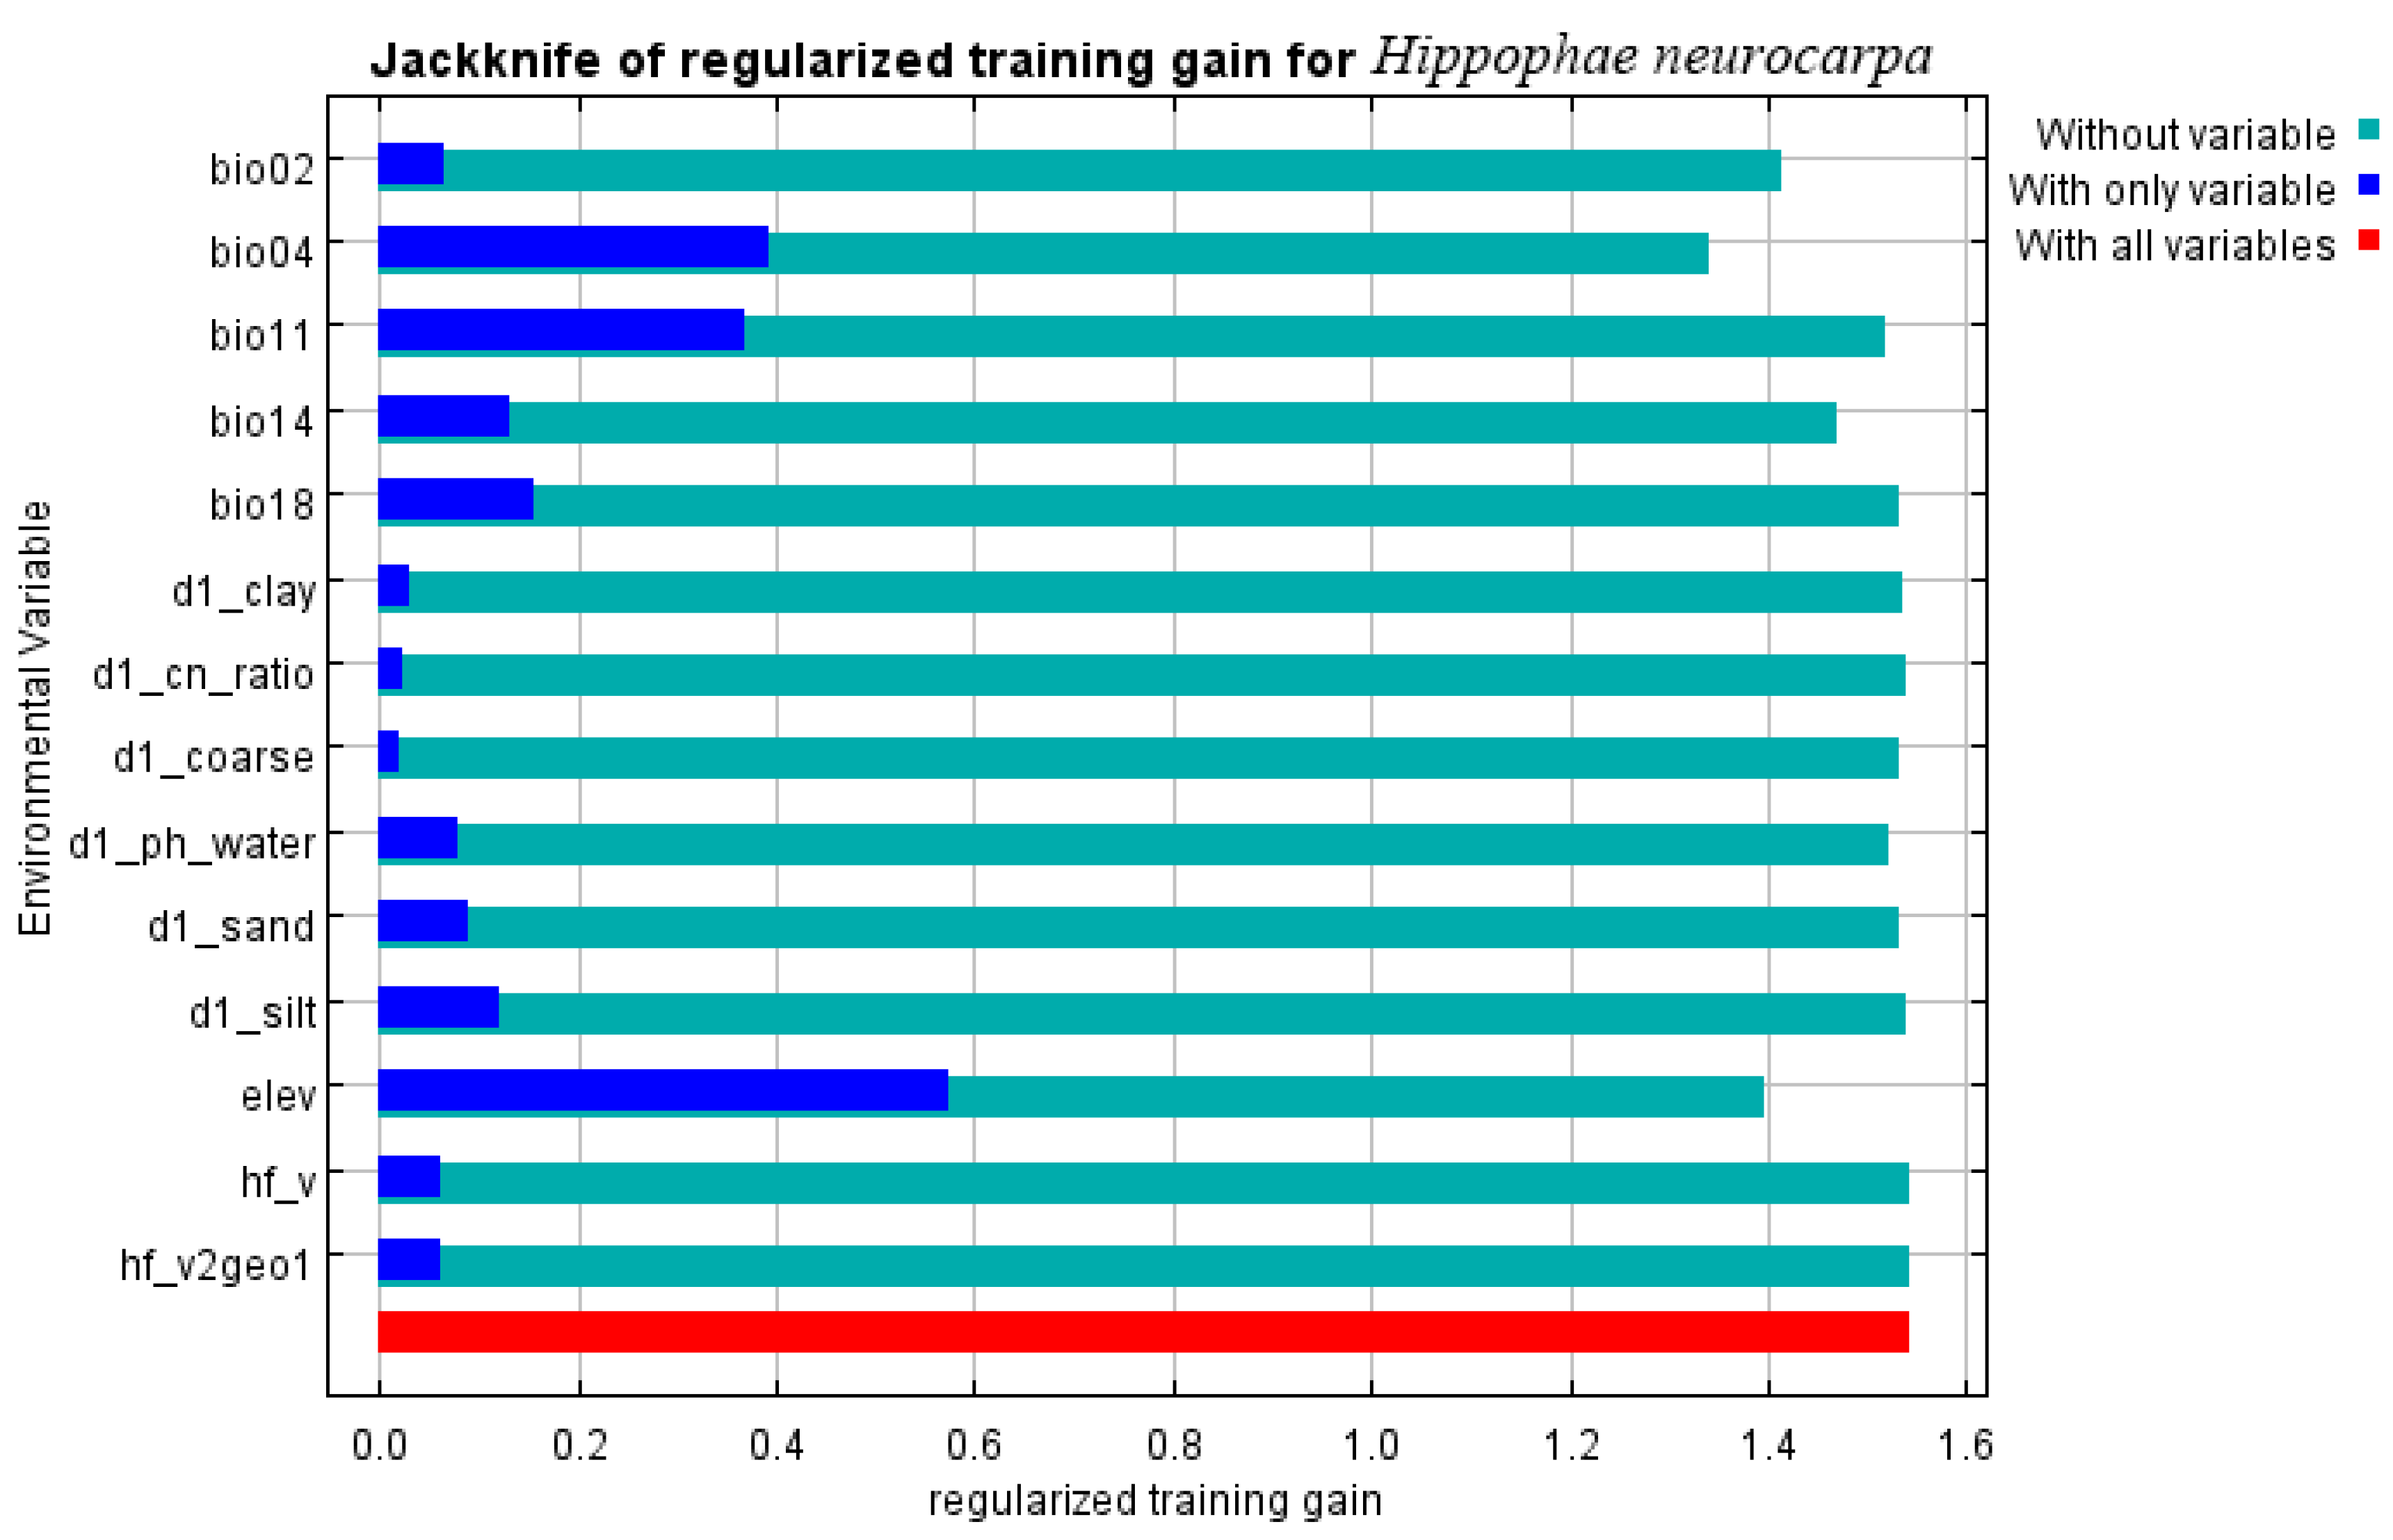
After calculating the Pearson correlation coefficient and filtering out environmental factors with high correlation and low contribution, 14 environmental factors were retained: elev, mean temperature of coldest quarter (bio11), precipitation of warmest quarter (bio18), precipitation of driest month (bio14), temperature seasonality (bio04), mean diurnal temperature range (bio02) and d1_silt. Among these, the cumulative contribution of elev, bio11, bio04, bio14 and hf accounted for 83.6%, with elev contributing the most at 29.9%. The Jackknife test results show the contribution of different environmental variables to the species distribution suitability. The Jackknife method (Figure 6) was used to quantitatively analyze the impact of environmental variables on species distribution suitability under different scenarios, including “Without Variable,” “With Only Variable,” and “With All Variables.” By comparing the results from the three scenarios, the relative importance of each environmental variable to species distribution can be intuitively assessed. Specifically, when the blue bar is longer in the “With Only Variable” scenario, it means that the environmental variable significantly affects species distribution suitability. In these variables, in terms of regularized training gain, the importance of environmental variables from greatest to least is: elev, bio04, bio11, bio18, bio14, bio04, d1_silt.
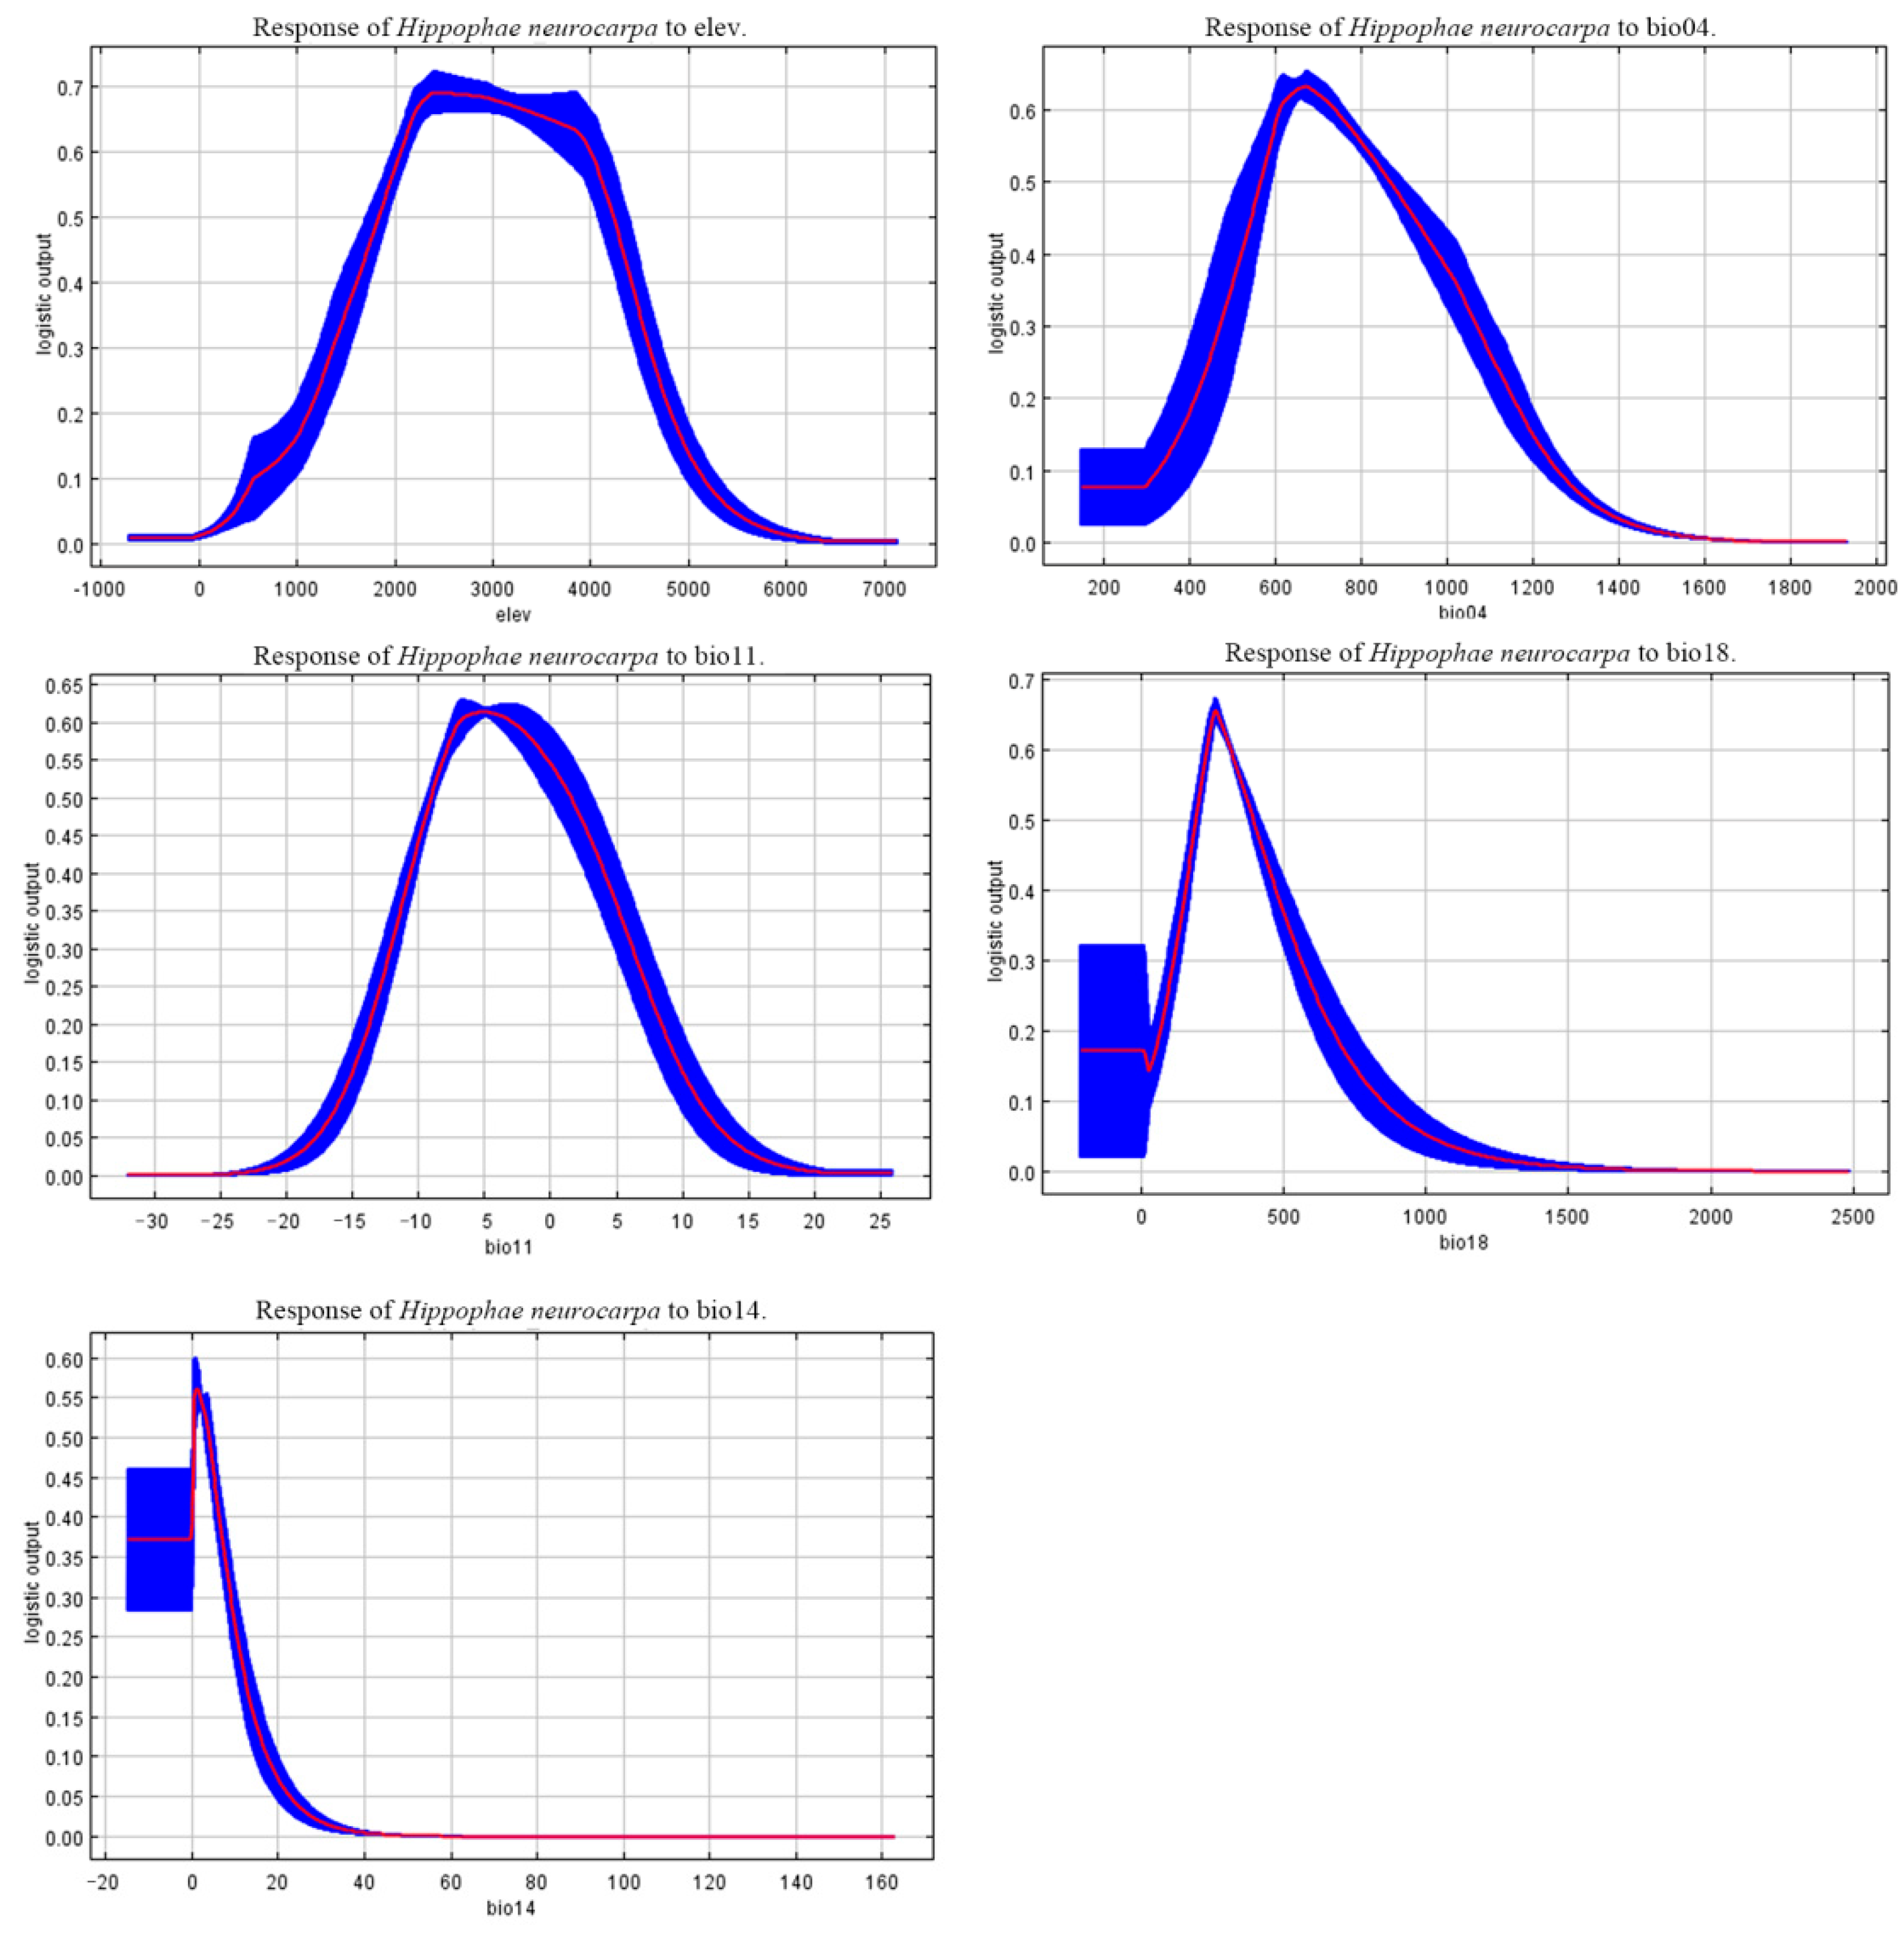
The habitat suitability threshold for the species is greater than 0.5 for environmental factors that support the survival of H. neurocarpa. Elevation is the most important environmental factor influencing the distribution of H. neurocarpa. According to the response curve (Figure 7), the suitability of H. neurocarpa follows a “concave” shape, increasing and then decreasing, peaking at an elevation of 2500 m, and declining in areas with elevations above 4000 m. Overall, the suitable elevation range for this species is between 1800 m and 4200 m asl. The mean temperature of coldest quarter (bio11) is suitable for H. neurocarpa survival when it ranges from −8 °C to 2 °C. The warmest quarter’s precipitation (bio18) is suitable when it ranges from 220 mm to 385 mm, and the temperature seasonality (bio04) is suitable within the 580–700 altitude range. These conditions indicate that H. neurocarpa can thrive at high altitudes and low temperatures in arid regions.

4. Discussion

4.1. Advantages and Limitations of the Model

Species distribution models (SDMs) constitute a predictive framework that synthesizes georeferenced occurrence records with environmental covariates through statistical and machine learning algorithms, enabling spatial projection of species’ potential ranges within and across defined spatiotemporal contexts [22,23].
By analyzing the relationships between known species distributions and related environmental factors, the model can identify key ecological factors influencing species distributions and predict their potential distributions in unobserved areas [24]. SDMs are characterized by strong predictive capability, flexibility, and a wide range of applications [25]. For example, they can use existing data to predict unknown distribution ranges, helping to expand the exploration of species in unexplored areas. In scenarios such as climate change and habitat loss, SDMs can generate dynamic distribution change maps for species [26]. They can also flexibly integrate and analyze data from different sources (such as meteorological data and site data) and support multi-scale and multi-dimensional analyses [27]. SDMs have a wide range of applications, not only in predicting biological species but also in non-biological contexts. They are of significant value in fields such as species conservation, natural resource management and exploration, and invasive pest control [28]. In this study, the MaxEnt model was selected as the tool to predict the current and future potential suitable distributions of H. neurocarpa.

4.2. Model Limitations

Although the MaxEnt model was selected and used to predict the current and future potential suitable distributions of H. neurocarpa, this model is confounded by several limitations that include: (1) dependence of the results on how point data are distributed [29], with overfitting occurring when distribution points are highly repetitive or close together. We attempted to minimize this effect by rigorously screening the data to enhance accuracy of the results; (2) its inability to support the exploration of direct interactions between species due to its static representation of relationships between species distributions and environmental variables, making it incapable of predicting changes under encroachment by enemy species; and (3) dependence of the model’s results on the choice of environmental data [23], as selecting either too many or too few risks reducing the model’s predictive performance. Similar limitations affect the BCC-CSM2-MR climate model, which was developed by the National Climate Center of China for simulation analyses. Although this model can effectively simulate climate variability and capture regional climatic features across East Asia, it is nevertheless confounded by: (1) reliance on a single GCM, which inevitably introduces systematic biases and cannot fully capture the uncertainty of future climate projections; (2) persistent residual errors in representing fine-scale climate variability due to its 1-km spatial resolution constraint, which may affect the accuracy of predictions at local scales; and (3) a bias toward climatic variables that renders it incapable of explicitly incorporating non-climatic ecological biotic interactions processes, such as interspecific competition and geographic barriers like dispersal limitations, potentially leading to overestimations of future suitable habitats. Future studies can address these limitations and enhance our capacity to better quantify variability in species distribution patterns under different emission scenarios by adopting the CMIP6 multi-model ensemble approach.

4.3. Main Environmental Factors Affecting the Distribution of H. neurocarpa

In this study, 22 environmental factors were screened, with 14 ultimately retained for in-depth analysis of the major factors influencing the spatial distribution of H. neurocarpa in China. Our analysis shows that the successful establishment of H. neurocarpa in this environment largely occurs in areas with elevations between 1800 m and 4200 m asl, mean temperatures of the coldest quarter between −8 °C and 2 °C, and precipitation of the warmest quarter ranging from 220 mm to 385 mm. These results indicate that H. neurocarpa thrives in high-altitude areas, low-temperatures, and dry environments, conditions consistent with its current distribution range. Although elevation contributes most to the model, this variable does not directly affect the temporal and spatial distributions of this species. As altitude increases, temperature gradually decreases thereby hindering seed germination and seedling growth. However, adult plants interestingly exhibit strong resistance to cold, explaining their wide distribution across the Qinghai-Tibet Plateau and surrounding areas of China, where they function as windbreakers and sand stabilizers. This phenomenon is further accentuated by the fact that strong sunlight and temperature variations in high-altitude areas promote plant photosynthesis, leading to the increased ability of secondary metabolites such as flavonoids, and phenols to withstand adverse metabolic conditions [30,31]. This observation is supported by Sharma et al., who report that H. salicifolia apart from being able to thrive at lower altitudes, this species contains high levels of cellular proteins that play an important role in regulating metabolic and physiological processes. In contrast, H. rhamnoides populations adapted to high altitudes exhibit greater abundances of proteins associated with redox signalling and stress responses, indicating greater resilience to harsh climatic conditions [32]. Implicit in this observation is the fact that future research on H. neurocarpa has much to offer in advancing our understanding of altitude’s impacts on the bioactive effects of this unique species effects on its leaves and fruits. The influence of altitude on H. neurocarpa is further demonstrated by its indirect, mediation of local temperatures, humidity, and ultraviolet radiation. Jackknife analysis reveals thermal parameters as pivotal drivers governing H. neurocarpa’s contemporary and projected distributions across China, with temperature exerting significantly greater influence than precipitation. This aligns with studies showing that, in most cases, the optimal growth temperature for sea buckthorn always approximates 20 °C [33]. This is because temperature directly affects the growth, development, and physiological processes that determine this valuable species’ endurance. Because extreme temperatures may induce stress responses in plants and temperature-related damage, the climate-change dimension must be considered when addressing the challenges confronting sustainable management of the finite resources at our disposal. The scientific community stands to offer tractable and informative insights by borrowing from the National Sea Buckthorn Resource Baseline Survey Report’s insights on how fast growth, cold and drought tolerant herbaceous species can be used to securitize our access to sustainable futures in a habitable planet. As reported by other researchers [33], this species can grow and form shrub forests even in areas with annual precipitation of 250–300 mm, severely eroded soils, poor fertility, and challenging landscapes such as barren mountain slopes, sandy rocks, and riverbanks. This observation is worth noting because it epitomizes the way forward by highlighting meaningful realization of the MDG’s leave no one behind philosophical dispensation. The analysis of environmental factors for the suitable habitat of H. neurocarpa by Gan et al. using the Biomod 2 platform aligns closely with our findings [34]. This collectively suggests that our research results are accurate.

4.4. Impact of Climate Change on the Potential Distribution of H. neurocarpa

MaxEnt projections indicate that H. neurocarpa’s suitable habitat will undergo significant range expansion with poleward latitudinal shifts under SSP1-2.6 and SSP2-4.5 scenarios. However, the range of change in its suitable habitat is relatively small. In both current and future periods, distributions remain primarily concentrated in the northeastern Tibetan Plateau, with smaller portions in the Hengduan Mountains and the Himalayas being covered. Gan et al. [34] similarly reported that the current centroid of H. neurocarpa lies in Qinghai Province in northwestern China. Climate-driven range shifts are projected to trigger poleward and upslope migrations across multiple taxa [35]. Fu et al. showed that the future suitable habitats of Prunus pseudocerasus are projected to become more fragmented, with high-suitability areas shifting to higher altitudes and latitudes [36]. Likewise, Liu et al. reported that the suitable distribution areas of Houttuynia cordata Thunb show an increasing trend in both the 2050s and 2070s, with its suitable habitats generally expanding northward [37].

5. Conclusions

Using ensemble modeling, we quantified current and projected (2070–2100) habitat suitability for H. neurocarpa in China under three SSP pathways (SSP1-2.6/SSP2-4.5/SSP5-8.5). The main conclusions are as follows:
  • Key Environmental Factors: Elevation, precipitation, and temperature are the critical environmental factors influencing the spatial and temporal distributions of H. neurocarpa. The suitable environmental thresholds include elevations of 1800–4200 m asl, mean temperatures of the coldest quarter between −8 °C and 2 °C, and precipitation of the warmest quarter ranging from 220 mm to 385 mm. H. neurocarpa is primarily distributed in the Qinghai-Tibet Plateau and its surrounding high-altitude regions in China.
  • Future Climate Scenarios: Under future climate scenarios, the suitable distribution areas of H. neurocarpa are expected to expand. By the 2090s, under the SSP2-4.5 scenario, the total suitable area will have expanded the most, increasing by 11.64%. With rising greenhouse gas emissions, the suitable distributions of H. neurocarpa will gradually shift from lower latitudes to higher latitudes.
  • Strengths and Limitations of This Study: The strength of this study lies in the selection of environmental factors, which extend beyond the climatic and topographic factors associated with H. neurocarpa. By incorporating comprehensive conditions such as land use and human disturbance, the study provides a more comprehensive evaluation of the species’ current and future potential distributions of this species. However, this study is subject to unavoidable constraints. These include sampling limitations and an unintentional reliance of our data on GBIF and literature sources. We conclude by urging and inviting other researchers to complement our efforts by filling the gaps in this study and providing constructive contributions to help pave the way forward.

Author Contributions

Conceptualization: B.Z.; methodology, Y.P. and D.X.; software, B.Z.; formal analysis, Y.P. and B.Z.; investigation, Y.P.; data curation, B.Z.; writing—original draft preparation, Y.P.; writing—review and editing, B.Z.; supervision, D.X. All authors have read and agreed to the published version of the manuscript.

Funding

This research was supported by the Fundamental Research Funds of China West Normal University (20A007, 20E051, 21E040 and 22kA011).

Data Availability Statement

The data supporting the results are available in a public repository at GBIF Occurrence Download Available online: https://doi.org/10.15468/dl.z73a3x (accessed on 4 March 2025). Hippophae neurocarpa. Peng, Yaqin (2025). Hippophae neurocarpa. figshare. Dataset. https://doi.org/10.6084/m9.figshare.29959124.v1, accessed on 14 January 2025.

Conflicts of Interest

The authors declare no conflicts of interest.

Abbreviation

The following abbreviation is used in this manuscript:
GBIFGlobal Biodiversity Information Facility

References

  1. Wang, A.; Schluetz, F.; Liu, J. Molecular evidence for double maternal origins of the diploid hybrid Hippophae goniocarpa (Elaeagnaceae): MATERNAL ORIGINS OF Hippophae GONIOCARPA. Bot. J. Linn. Soc. 2008, 156, 111–118. [Google Scholar] [CrossRef]
  2. Nan, J.B.; Chen, B.Z.; Lin, L.; Zhao, Y.W. Phenotypic Diversity and Germination Characteristics of Hippophae in the Qinghai-Tibet Plateau. Seed 2019, 38, 25–30. [Google Scholar] [CrossRef]
  3. Olas, B. The beneficial health aspects of sea buckthorn (Elaeagnus rhamnoides (L.) A.Nelson) oil. J. Ethnopharmacol. 2018, 213, 183–190. [Google Scholar] [CrossRef]
  4. Zhao, J.; Zhang, Z.; Zhou, H.; Bai, Z.; Sun, K. The Study on Sea Buckthorn (Genus Hippophae L.) Fruit Reveals Cell Division and Cell Expansion to Promote Morphogenesis. Plants 2023, 12, 1005. [Google Scholar] [CrossRef] [PubMed]
  5. Zhou, W.; Hu, N.; Dong, Q.; Wang, H.; Wang, Y. Complete chloroplast genome sequences of Hippophae neurocarpa. Mitochondrial DNA Part B 2019, 4, 2048–2049. [Google Scholar] [CrossRef]
  6. Kou, Y.X.; Wu, Y.X.; Jia, D.R.; Li, Z.H.; Wang, Y.J. Range expansion, genetic differentiation, and phenotypic adaption of Hippophaë neurocarpa (E laeagnaceae) on the Qinghai–Tibet Plateau. J. Syst. Evol. 2014, 52, 303–312. [Google Scholar] [CrossRef]
  7. Meng, L.H.; Yang, H.L.; Wu, G.L.; Wang, Y.J. Phylogeography of Hippophae neurocarpa (Elaeagnaceae) inferred from the chloroplast DNA trnL-F sequence variation. J. Syst. Evol. 2008, 46, 32–40. [Google Scholar] [CrossRef]
  8. IPCC. Climate Change 2022: Impacts, Adaptation and Vulnerability; Cambridge University Press: Cambridge, UK, 2022. [Google Scholar]
  9. Fu, C.; Peng, Y.; Yang, F.; He, Z.; Ali, H.; Xu, D. Potentially suitable geographical area for Colletotrichum acutatum under current and future climatic scenarios based on optimized MaxEnt model. Front. Microbiol. 2024, 15, 1463070. [Google Scholar] [CrossRef]
  10. Elith, J.; Leathwick, J.R. Species Distribution Models: Ecological Explanation and Prediction Across Space and Time. Annu. Rev. Ecol. Evol. Syst. 2009, 40, 677–697. [Google Scholar] [CrossRef]
  11. Zimmermann, N.E.; Edwards, T.C.; Graham, C.H.; Pearman, P.B.; Svenning, J. New trends in species distribution modelling. Ecography 2010, 33, 985–989. [Google Scholar] [CrossRef]
  12. Li, X.; Wang, Y. Applying various algorithms for species distribution modelling. Integr. Zool. 2013, 8, 124–135. [Google Scholar] [CrossRef]
  13. Elith, J.; Phillips, S.J.; Hastie, T.; Dudík, M.; Chee, Y.E.; Yates, C.J. A statistical explanation of MaxEnt for ecologists. Divers. Distrib. 2011, 17, 43–57. [Google Scholar] [CrossRef]
  14. Phillips, S.J.; Dudík, M. Modeling of Species Distributions with Maxent: New Extensions and a Comprehensive Evaluation. Ecography 2008, 31, 161–175. [Google Scholar] [CrossRef]
  15. Warren, D.L.; Seifert, S.N.; Stohlgren, T.J. Ecological niche modeling in Maxent: The importance of model complexity and the performance of model selection criteria. Ecol. Appl. 2011, 21, 335–342. [Google Scholar] [CrossRef]
  16. Zhang, Y.; Tang, J.; Ren, G.; Zhao, K.; Wang, X. Global potential distribution prediction of Xanthium italicum based on Maxent model. Sci. Rep. 2021, 11, 16545. [Google Scholar] [CrossRef]
  17. Gao, X.; Lin, F.; Li, M.; Mei, Y.; Li, Y.; Bai, Y.; He, X.; Zheng, Y. Prediction of the potential distribution of a raspberry (Rubus idaeus) in China based on MaxEnt model. Sci. Rep. 2024, 14, 24438. [Google Scholar] [CrossRef]
  18. Ramampiandra, E.C.; Scheidegger, A.; Wydler, J.; Schuwirth, N. A comparison of machine learning and statistical species distribution models: Quantifying overfitting supports model interpretation. Ecol. Model. 2023, 481, 110353. [Google Scholar] [CrossRef]
  19. Zhang, F.-G.; Liang, F.; Wu, K.; Xie, L.; Zhao, G.; Wang, Y. The potential habitat of Angelica dahurica in China under climate change scenario predicted by Maxent model. Front. Plant Sci. 2024, 15, 1388099. [Google Scholar] [CrossRef]
  20. Zhang, L.; Jiang, B.; Meng, Y.; Jia, Y.; Xu, Q.; Pan, Y. The Influence of Climate Change on the Distribution of Hibiscus mutabilis in China: MaxEnt Model-Based Prediction. Plants 2024, 13, 1744. [Google Scholar] [CrossRef]
  21. Fu, C.; Qian, Q.; Deng, X.; Zhuo, Z.; Xu, D. Prediction and Analysis of the Global Suitable Habitat of the Oryctes rhinoceros (Linnaeus, 1758) (Coleoptera: Scarabaeidae) Based on the MaxEnt Model. Insects 2024, 15, 774. [Google Scholar] [CrossRef]
  22. Wen, X.; Fang, G.; Chai, S.; He, C.; Sun, S.; Zhao, G.; Lin, X. Can ecological niche models be used to accurately predict the distribution of invasive insects? A case study of Hyphantria cunea in China. Ecol. Evol. 2024, 14, e11159. [Google Scholar] [CrossRef] [PubMed]
  23. Zhao, Z.; Xiao, N.; Shen, M.; Li, J. Comparison between optimized MaxEnt and random forest modeling in predicting potential distribution: A case study with Quasipaa boulengeri in China. Sci. Total Environ. 2022, 842, 156867. [Google Scholar] [CrossRef]
  24. Ali, F.; Khan, N.; Khan, A.M.; Ali, K.; Abbas, F. Species distribution modelling of Monotheca buxifolia (Falc.) A. DC.: Present distribution and impacts of potential climate change. Heliyon 2023, 9, e13417. [Google Scholar] [CrossRef]
  25. Robinson, N.M.; Nelson, W.A.; Costello, M.J.; Sutherland, J.E.; Lundquist, C.J. A Systematic Review of Marine-Based Species Distribution Models (SDMs) with Recommendations for Best Practice. Front. Mar. Sci. 2017, 4, 421. [Google Scholar] [CrossRef]
  26. Zhao, Y.; Deng, X.; Xiang, W.; Chen, L.; Ouyang, S. Predicting potential suitable habitats of Chinese fir under current and future climatic scenarios based on Maxent model. Ecol. Inform. 2021, 64, 101393. [Google Scholar] [CrossRef]
  27. Duan, R.-Y.; Kong, X.-Q.; Huang, M.-Y.; Fan, W.-Y.; Wang, Z.-G.; Hernandez-Lemus, E. The Predictive Performance and Stability of Six Species Distribution Models. PLoS ONE 2014, 9, e112764. [Google Scholar] [CrossRef]
  28. Moreno, R.; Zamora, R.; Molina, J.R.; Vasquez, A.; Herrera, M.Á. Predictive modeling of microhabitats for endemic birds in South Chilean temperate forests using Maximum entropy (Maxent). Ecol. Inform. 2011, 6, 364–370. [Google Scholar] [CrossRef]
  29. Hayat, U.; Shi, J.; Wu, Z.; Rizwan, M.; Haider, M.S. Which SDM Model, CLIMEX vs. MaxEnt, Best Forecasts Aeolesthes sarta Distribution at a Global Scale under Climate Change Scenarios? Insects 2024, 15, 324. [Google Scholar] [CrossRef]
  30. Hashim, A.M.; Alharbi, B.M.; Abdulmajeed, A.M.; Elkelish, A.; Hozzein, W.N.; Hassan, H.M. Oxidative Stress Responses of Some Endemic Plants to High Altitudes by Intensifying Antioxidants and Secondary Metabolites Content. Plants 2020, 9, 869. [Google Scholar] [CrossRef] [PubMed]
  31. Zhao, Q.; Dong, M.; Li, M.; Jin, L.; Paré, P.W. Light-Induced Flavonoid Biosynthesis in Sinopodophyllum hexandrum with High-Altitude Adaptation. Plants 2023, 12, 575. [Google Scholar] [CrossRef] [PubMed]
  32. Sharma, B.; Deswal, R. Comparative proteome profiling of seabuckthorn leaves from low altitude ‘Sikkim’ and high altitude ‘Himachal Pradesh’ Himalayan region hints towards differential stress adaptive responses. J. Proteins Proteom. 2021, 12, 125–141. [Google Scholar] [CrossRef]
  33. Suren, H. Research on the Growth Characteristics and Management of Mongolian Seabuckthorn in Mongolia. Master’s Thesis, Inner Mongolia Agricultural University, Hohhot, China, 2021. [Google Scholar]
  34. Gan, T.; Liu, Q.; Xu, D.; He, Z.; Zhuo, Z. Assessing the Impact of Climate Change on Hippophae neurocarpa in China Using Biomod2 Modeling. Agriculture 2025, 15, 722. [Google Scholar] [CrossRef]
  35. Li, S.; Liu, X.; Shi, P.; Liu, J.; Zhu, P.; Liu, R.; Xing, L.; Luo, X.; Zhao, H.; Zheng, Y.; et al. Changes in Ginkgo biloba L.’s Habitat Due to Climate Change in China. Forests 2024, 15, 2260. [Google Scholar] [CrossRef]
  36. Fu, C.; Li, M.; Tian, C.; Song, Y.; Yi, X.; Wang, X. Prediction of potential suitable regions of Prunus pseudocerasus based on MaxEnt model under climate change. J. Nanjing For. Univ. (Nat. Sci. Ed.) 2024, 48, 235–242. [Google Scholar] [CrossRef]
  37. Liu, L.; Guan, L.; Zhao, H.; Huang, Y.; Mou, Q.; Liu, K.; Chen, T.; Wang, X.; Zhang, Y.; Wei, B.; et al. Modeling habitat suitability of Houttuynia cordata Thunb (Ceercao) using MaxEnt under climate change in China. Ecol. Inform. 2021, 63, 101324. [Google Scholar] [CrossRef]
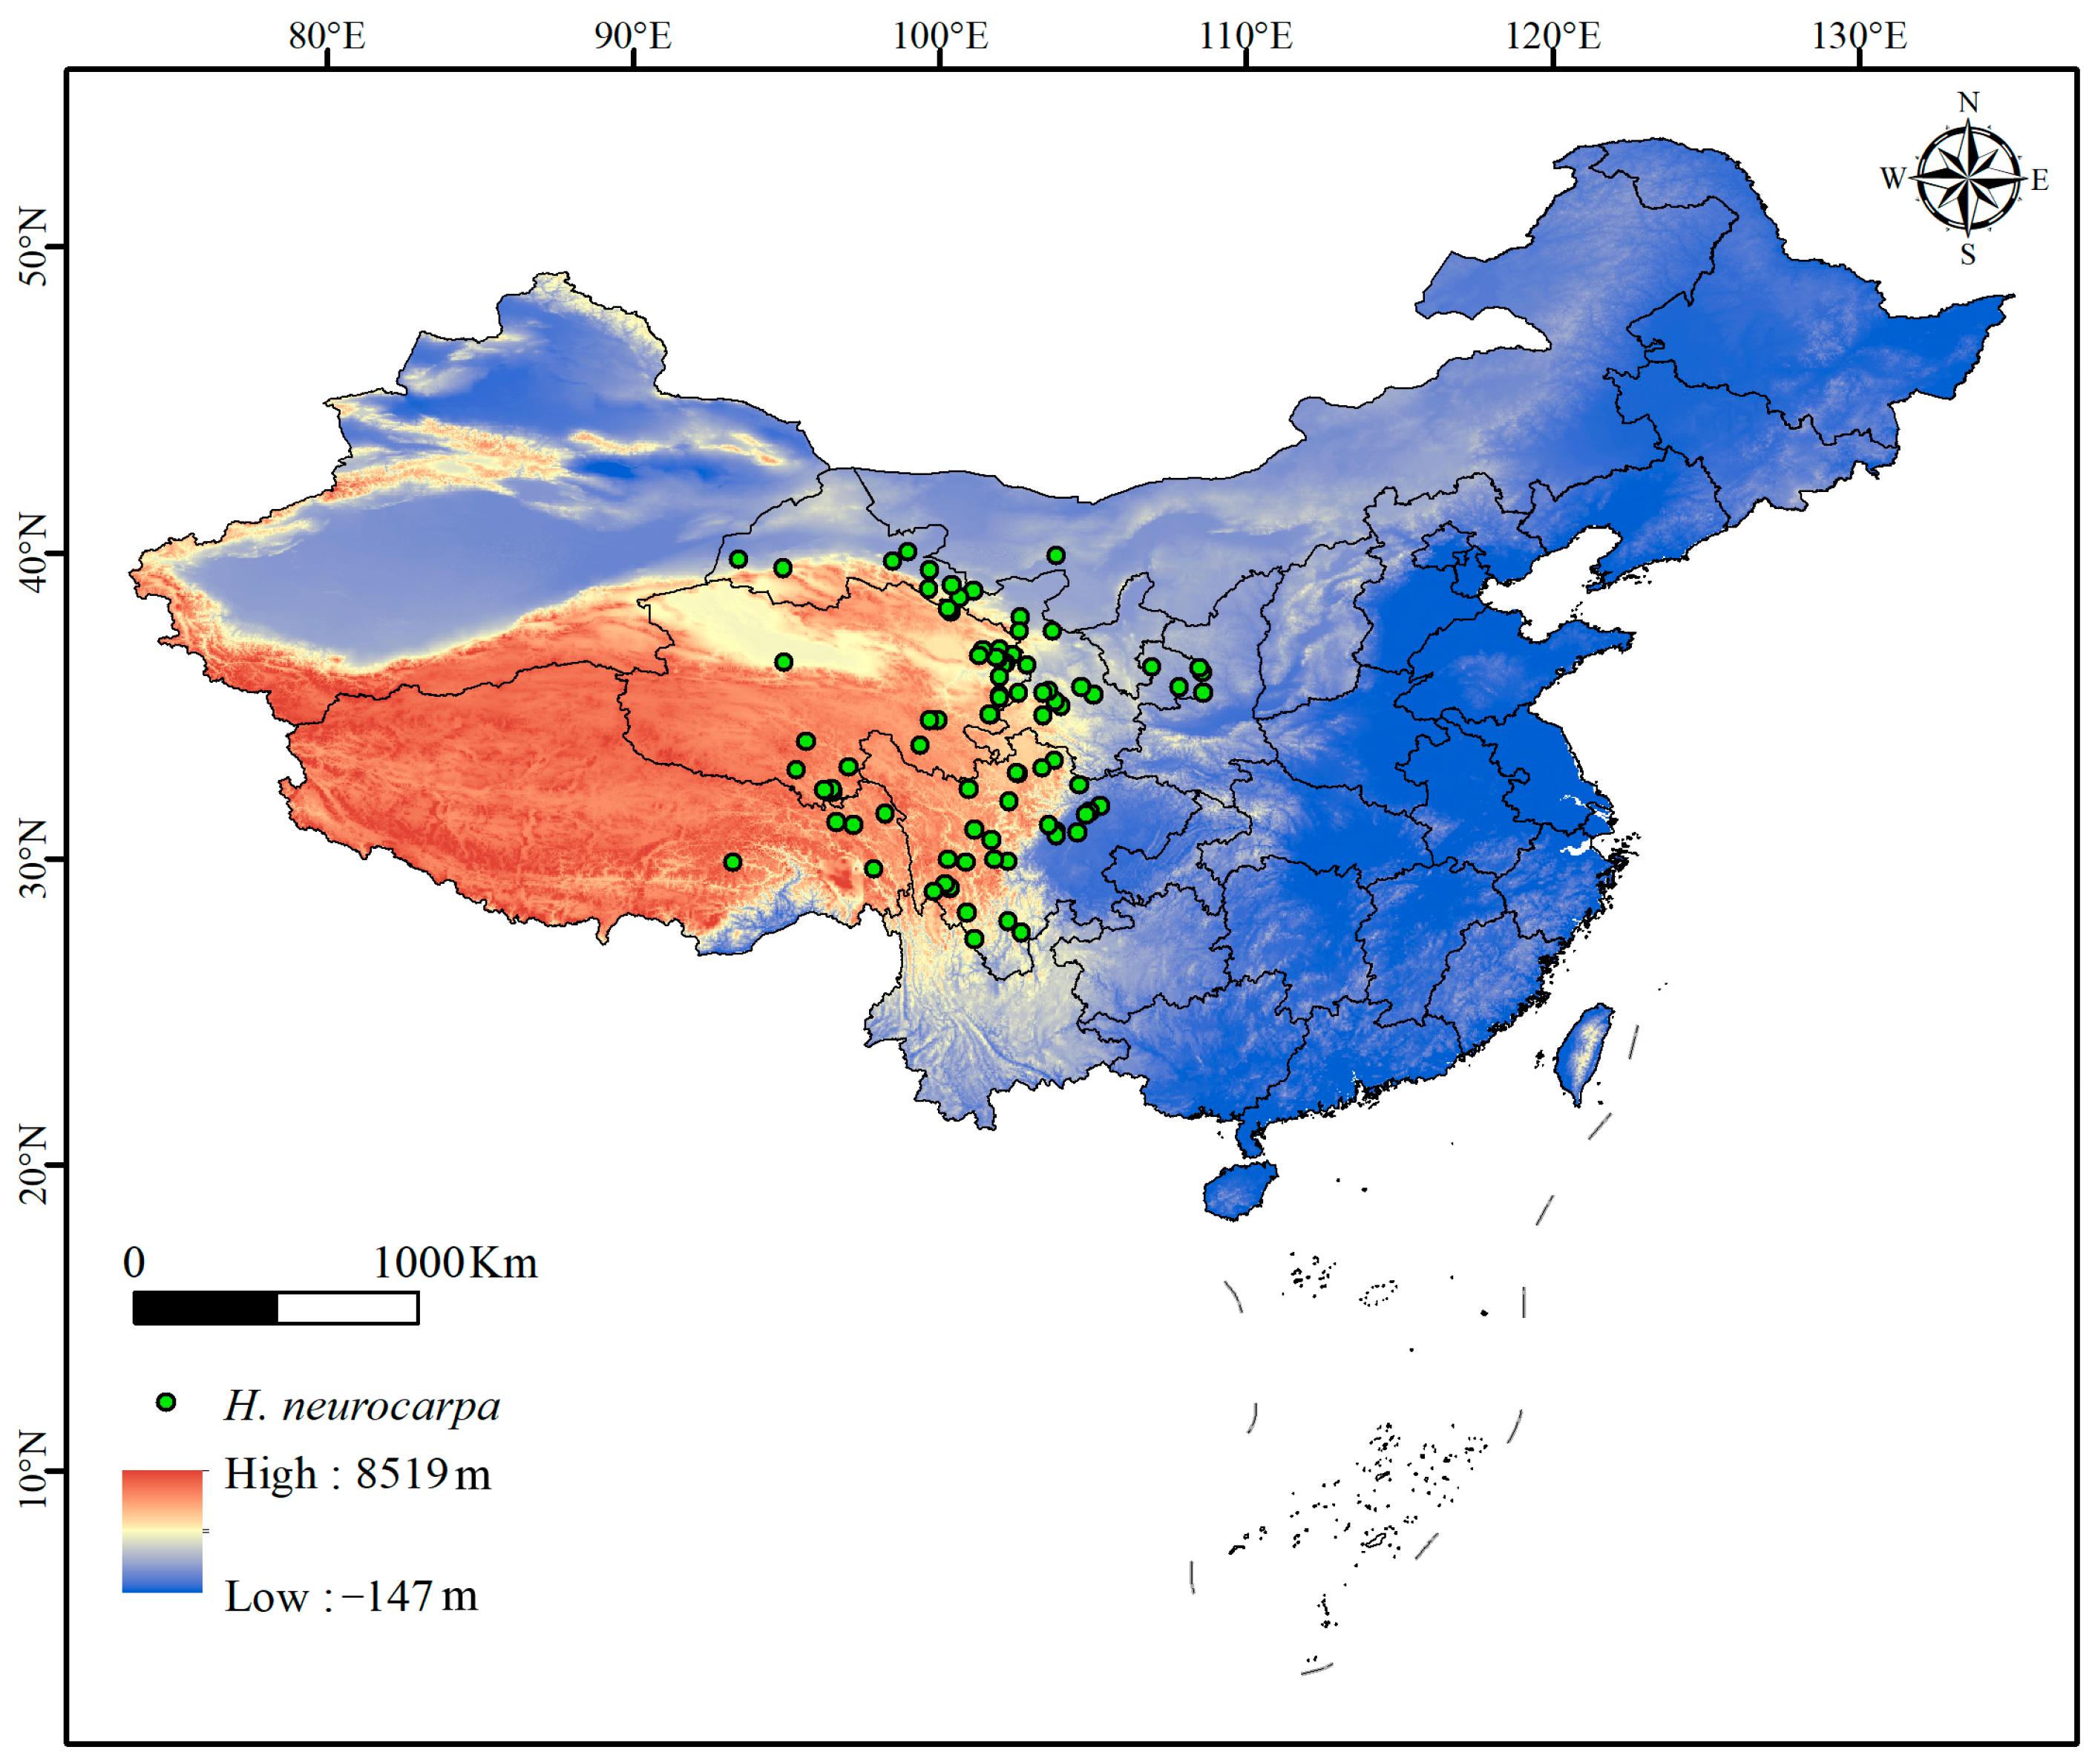
Figure 1. Geographical distribution points of H. neurocarpa in China. (High and low denote elevation ranges).
Diversity 17 00609 g001
Figure 2. MaxEnt-derived receiver operating characteristic (ROC) curves were constructed to evaluate model discrimination accuracy.
Diversity 17 00609 g002
Figure 3. Distribution of suitable habitats for H. neurocarpa under the current climate.
Diversity 17 00609 g003
Figure 4. Projected spatial distribution of H. neurocarpa under climate change scenarios. (a) SSP-2.6 in the year 2050; (b) SSP1-2.6 in the year 2070; (c) SSP1-2.6 in the year 2090; (d) SSP2-4.5 in the year 2050; (e) SSP2-4.5 in the year 2070; (f) SSP2-4.5 in the year 2090; (g) SSP5-8.5 in the year 2050; (h) SSP5-8.5 in the year 2070; (i) SSP5-8.5 in the year 2090.
Diversity 17 00609 g004
Figure 5. Spatial Shifts in Core Distribution Areas of H. neurocarpa Across China.
Diversity 17 00609 g005
Figure 6. Jackknife test of variable importance for the MaxEnt model of H. neurocarpa distribution.
Diversity 17 00609 g006
Figure 7. Response curves of five environmental variables. (The curves show the mean response of the 10 replicate Maxent runs (red) and the mean +/− one standard deviation (blue), two shades for categorical variables).
Diversity 17 00609 g007
Table 1. Environmental variables related to the distributions.
AbbreviationClimate VariablesUnit
Bio01Annual mean temperature°C
Bio02Mean diurnal range°C
Bio03Isothermality (bio2/bio7) (×100)
Bio04Temperature Seasonality (standard deviation × 100)
Bio05Max temperature of warmest month°C
Bio06Min temperature of coldest month°C
Bio07Temperature annual range (bio5–bio6)°C
Bio08Mean temperature of wettest quarter°C
Bio09Mean temperature of driest quarter°C
Bio10Mean temperature of warmest quarter°C
Bio11Mean temperature of coldest quarter°C
Bio12Annual precipitationmm
Bio13Precipitation of wettest monthmm
Bio14Precipitation of driest monthmm
Bio15Precipitation seasonality (Coefficient of variation)
Bio16Precipitation of wettest quartermm
Bio17Precipitation of driest quartermm
Bio18Precipitation of warmest quartermm
Bio19Precipitation of coldest quartermm
ElevAltitude (elevation above sea level) (m)m
SlopeSlope°
AspectAspectrad
d1_bsatSoil base saturation%
d1_clayCation exchange capacity of clayey layer soilsMol/kg
d1_cn_ratioCarbon to nitrogen ratio-
d1_elec_condConductivityS/m
d1_org_carbonOrganic carbon content-
d1_ph_waterpH (chemistry)Mol/L
d1_sandSand content%
d1_siltSilt content%
d1_swrSoil moisture statusθg
d1_total_nTotal nitrogenmg/L
d1_usdaClassification of soil texture-
gm_lc_v3Type of land cover-
gm_ve_v2Percentage of vegetation cover%
hf_v2geo1Human footprint and anthropogenic impact index-
Table 2. The 14 environment variables used for modeling.
VariablePercent ContributionPermutation Importance
Elev (m)9.99.2
Bio11 (°C)17.82.9
Bio18 (mm)4.71
Bio14 (mm)1310
Bio0416.560.9
Bio02 (°C)3.510.2
d1_clay1.50.5
d1_cn_ratio0.50
d1_coarse0.60.4
d1_ph_water1.72.2
d1_sand1.40.8
d1_silt2.40.2
hf_v2geo10.10
hf_v6.41.6
Table 3. Prediction of suitable areas for H. neurocarpa under current and future climatic conditions.
Decade ScenariosPredicted Area (×104 km2)Comparison with Current Distribution (%)
Low Habitat SuitabilityMedium Habitat SuitabilityHigh Habitat SuitabilityTotal AreaLow Habitat SuitabilityMedium Habitat SuitabilityHigh Habitat SuitabilityTotal Area
Current171.6560.0636.95268.66----
2050s-SSP1-2.6176.2255.9655.96288.142.66−6.8251.447.25
2070s-SSP1-2.6167.5660.7631.59259.90−2.381.16−14.52−3.26
2090s-SSP1-2.6157.4859.3136.85253.64−8.25−1.25−0.28−5.59
2050s-SSP2-4.5178.6270.4349.78298.824.0617.2734.7011.23
2070s-SSP2-4.5169.8759.6938.54268.10−1.04−0.614.29−0.21
2090s-SSP2-4.5189.7466.6243.57299.9310.5410.9317.9011.64
2050s-SSP5-8.5164.9754.9237.53257.42−3.89−8.561.56−4.18
2070s-SSP5-8.5156.5157.7538.26252.51−8.82−3.843.52−6.01
2090s-SSP5-8.5143.7555.4636.35235.56−16.25−7.66−1.62−12.32
Disclaimer/Publisher’s Note: The statements, opinions and data contained in all publications are solely those of the individual author(s) and contributor(s) and not of MDPI and/or the editor(s). MDPI and/or the editor(s) disclaim responsibility for any injury to people or property resulting from any ideas, methods, instructions or products referred to in the content.