Article

Unravelling the Role of Predator Diversity in Shaping Plankton Dynamics: Evidence from a Mesocosm Study

by
Robyn Shaylee Fabian
1,* and
William Froneman
1,2
1
Department of Biological Sciences, University of Cape Town, Rondebosch 7700, South Africa
2
Department of Zoology and Entomology, Rhodes University, Makhanda 6140, South Africa
*
Author to whom correspondence should be addressed.
Diversity 2025, 17(9), 591; https://doi.org/10.3390/d17090591
Submission received: 10 July 2025 / Revised: 20 August 2025 / Accepted: 21 August 2025 / Published: 22 August 2025
(This article belongs to the Special Issue 2025 Feature Papers by Diversity’s Editorial Board Members)

Abstract

Predation plays a key organizational role in structuring plankton communities. However, predator diversity can lead to emergent effects in which the outcomes of predator–prey interactions are modified. The response of the plankton community to three different predator regimes at natural densities was investigated over a 10-day mesocosm experiment in a temperate, temporarily open/closed estuary in South Africa. The regimes included: (1) predation by the mysid, Mesopodopsis wooldridgei; (2) predation by larval Rhabdosargus holubi and (3) a combination of the two predators. M. wooldridgei are primarily copepod feeders, and juvenile R. holubi consume a broader diet including zooplankton, algae and invertebrate fauna. In the absence of predators, zooplankton grazing contributed to a significant decline in the phytoplankton size structure and total chlorophyll-a (Chl-a) concentration. The presence of the predators contributed to a decline in the total zooplankton abundances and biomass which dampened the grazing impact of the zooplankton on the total Chl-a, consistent with the expectations of a trophic cascade. There were no significant differences in the size structure of the phytoplankton community, total Chl-a concentration and the total zooplankton abundances and biomass between the different predator treatments, suggesting that the increase in predator diversity did not contribute to increased prey risk. These findings highlight both the direct and indirect ecological impacts of predators on plankton dynamics.

Graphical Abstract

1. Introduction

It is now well recognized that predation plays an important organizational role in plankton communities. Predators can exert a strong top-down control of prey populations [1,2]. The impact of predators can, however, extend beyond their prey as they can influence the lower trophic levels by establishing trophic cascades [1,2,3,4]. Predation-induced trophic cascades can contribute to changes in nutrient cycles, energy flow and food web structure that may ultimately enable regime shifts within aquatic systems [5,6]. Predators can also induce risk effects that alter prey behaviour, foraging and growth, morphology and physiology, with cascading consequences for nutrient cycling [7,8]. Declining predator populations can disrupt these processes, with broad implications for ecosystem function and resilience [2,9,10,11].
Early studies on predator–prey dynamics in aquatic systems primarily concentrated on individual predator species [12]. However, in natural settings, prey often encounter multiple predators simultaneously, prompting research into their interactions within the same community [12]. These interactions can lead to complex and unpredictable outcomes, known as “emergent multiple predator effects”, where predation rates either increase or decrease compared to expectations based on individual predator effects [13,14]. Multiple predator effects (MPEs) arise from both inter- and intraspecific interactions, including cooperation, competition, and intra-guild predation, alongside antipredator behaviour [13,15]. These interactions result in varying outcomes for prey consumption rates, manifesting independently, synergistically, or antagonistically [13,16,17]. Sih, Englund and Wooster [13], identified three broad types of MPEs: linear, risk-enhancing and risk-reducing. Linear effects occur when the presence of multiple predators does not significantly change prey consumption rates compared to individual predator effects [13,18]. Risk-enhancing effects increase consumption due to the added predation pressure, while risk-reducing effects decrease overall predation risk, allowing prey to forage more freely [13,19]. As predation risks escalate, prey may alter their behaviour, impacting the extent of MPEs and the degree of risk [18].
Estuaries along the South African coastline are recognized as important nursery grounds for a variety of marine and estuarine invertebrates due to increased availability of prey, mainly zooplankton, and the availability of refugia [20,21,22]. This suggests that predation may play an important role in structuring the plankton communities within these systems [23]. Predator diversity has emerged as a key factor regulating the strength and nature of predator–prey interactions in plankton food webs [23,24,25,26]. To investigate the potential role of predator diversity in mediating predator–prey interactions, a 10-day mesocosm experiment was conducted in a temperate, temporarily open/closed estuary along the south-eastern coastline of South Africa. Two different predator species were selected: adult mysids (Mesopodopsis wooldrigei) and juvenile Rhabdosargus holubi. These species differ markedly in their feeding ecology. Adult M. wooldrigei are primarily carnivorous, preying mainly on copepods [27], whereas R. holubi undergoes an ontogenetic dietary shift. While their larval stage feeds predominantly on zooplankton, juveniles consume a broader range of food including zooplankton, filamentous algae, macrophytes and associated fauna [28,29,30]. These dietary differences are expected to shape their trophic impacts in distinct ways, making them ideal model predators for testing how predator diversity influences estuarine food web structure.
We hypothesize that increasing predator diversity will contribute to more complex predator–prey dynamics, leading to significant shifts in the plankton community structure over time.

2. Materials and Methods

2.1. Study Site

The mesocosm study was conducted in the lower reach of the medium-sized, temporarily open/closed Kasouga Estuary (33°39′11″ S, 26°44′01″ E) located on the warm, temperate-south-eastern coastline of South Africa (Figure 1). The study took place over a 10-day period in November, during the closed phase of the estuary which was characterized by the presence of an extensive sandbar at the mouth which separated the estuary from the marine environment.
The Kasouga Estuary extends 2.5 km in length and features a large salt marsh along the east bank in its lower reach [32]. The catchment area is estimated at ≈39 km2, most of which is primarily used for cattle farming [33]. Depending on the season and mouth state, the estuary is narrow (30 to 40 m wide) in the upper reach and widens (100 to 200 m) in the lower reach [34]. The estuary is shallow in the lower and middle sections, with depths less than 1.8 m, while the main channel in the upper reach ranges from 1.5 to 2 m in depth, with a maximum depth of 2.1 m [35]. Surface water temperatures in the estuary range from 14 to 28 °C and demonstrate a distinct seasonal pattern with peak temperatures in the summer (December to February) and lowest temperatures in the winter (June to August) [34]. Due to the small catchment area and sporadic rainfall, the system is typically classified as oligotrophic, with salinities exceeding 25 PSU (practical salinity units) [31]. Due to low nutrient availability, total phytoplankton concentrations and zooplankton biomass are generally <2 mg dwt m−3 and <15 mg dwt m−3, respectively [34]. Following heavy rainfall (>100 mm in a month), the system can become river-dominated, but transitions back to tidal dominance once the estuary breaches [31]. Site selection for the experiment was determined by water depth and protection from strong coastal winds leading to its placement in the middle reaches of the Kasouga Estuary.

2.2. Experimental Setup

Two predators: adult mysid, Mesopodopsis wooldrigei [36] from the family Mysidae and estuarine-dependent juvenile Cape stumpnose (approximately 3 cm standard length (SL)), Rhabdosargus holubi [37] of the family Sparidae were employed during the mesocosm study. The mysids and juvenile fish were size-selected and captured at the study site 24 h prior to the start of the study using a hand-held 200 μm mesh net. M. wooldrigei, is commonly found in estuarine and nearshore marine waters along the south-east coast of South Africa [38,39], where they can reach peak densities of up to 2500 individuals m−3 [39]. R. holubi is a numerically dominant fish species in estuaries along the south-eastern coastline of South Africa, particularly during its juvenile stages [40,41,42]. Juveniles are common in estuaries due to their advanced osmoregulatory abilities, enabling them to tolerate a wide range of salinities [43].
Fifteen identical mesocosm enclosures were setup based on the design outlined by Wasserman, Noyon, Avery and Froneman [23]. Each mesocosm, with a depth of 1.4 m, was made from translucent, 200 μm thick polyethylene bags straddling on square plastic frames measuring 80 cm × 80 cm. The top of each frame was supported by airtight 5 L buoys, raising the bags approximately 40 cm above the water surface to prevent overtopping of estuarine waters into the enclosures. The bags were anchored with a 20 kg concrete moorings embedded in the estuarine sediment with 0.5 m thick elastic ropes to prevent drift and overtopping from wave action. Although the top of each mesocosm was open to the atmosphere, they were isolated from the surrounding estuarine waters by a plastic grid with 4 cm × 4 cm mesh openings to limit access of aerial predators.
Each mesocosm was filled with ≈1000 L of estuarine water, a volume considered by Spivak, et al. [44] sufficient for comparing experimental studies to system-level outcomes. Estuarine water for the experiment was sourced directly from site, near the mesocosms. Water was collected into 100 L containers, positioned on the bow of a 3 m long motorboat and then gravitationally fed through polyethylene hoses into each mesocosm. The mesocosms were positioned 2 km upstream from the estuary’s mouth and arranged parallel to the bank along the channel. This setup ensured consistent sunlight exposure for each mesocosm from sunrise to sunset. To address potential variability related to location or proximity, the mesocosms for each treatment and replicate were randomly distributed parallel to the shoreline [23].
Four trophic treatments and a control (n = 3 for each treatment) were prepared for the study. All experimental manipulations were carried out at night to account for the diel vertical migration patterns of the zooplankton in the estuary [23,31]. For the Control, estuarine water was gravity-fed through an 80 μm filter to exclude metazoans, allowing only phytoplankton to remain. Preliminary data indicated that filtration of the water through an 80 μm filter removed <2% of the total chlorophyll-a concentrations and >98% of the zooplankton. Treatment 1 through 4 consisted of water gravity-fed through a 1000 μm filter, to remove the larger predatory metazoans including mysids and fish larvae. In Treatment 1, filtration removed all larger predatory plankton (decapods and fish larvae), leaving only zooplankton which by abundance and biomass were dominated by copepods of the genera Pseudodiaptomus, Acartia and Oithona. Treatment 2 involved the addition of 10 adult Mesopodopsis wooldrigei, while Treatment 3 included 10 juvenile, Rhabdosargus holubi. Treatment 4, the mixed treatment, comprised 5 individuals of each predator species (Table A1, Appendix A). Predator densities within the mesocosms were in the range of their natural densities, determined from net towns conducted prior to the start of the study

2.3. Physicochemical and Biological Sampling

Salinity (PSU), temperature (°C), and dissolved oxygen (mg L−1) were measured in each mesocosm at a depth of ≈0.5 m (midwater depth) using an Aquaread aquameter YSI probe. Total nitrogen (μg L−1) concentrations were determined from a 50 mL water sample collected at depth (0.5 m) using a multiparameter bench photometer (HI 83203, Hanna Instruments Inc., Smithfield, RI, USA). Measurements were taken within 2 h of water sample collection, with the photometer range set to a 10 to 20 mg L−1 ± 0.05 mg L−1 accuracy. All measurements were made after sunset at the start of the study and thereafter every second day until the completion of the study (10-day duration). Each mesocosm was stirred in a figure eight pattern for 30 s using a wooden spatula daily to mimic wind induced natural mixing of the water column [23,31].
To determine chlorophyll-a (Chl-a) concentrations (used as a proxy for phytoplankton biomass), a 250 mL water sample was collected from each mesocosm at a depth of 0.5 m. The sample was then serially filtered through a 5.0 μm Nucleopore filter and a GF/F filter (vacuum <5 cm Hg) and extracted in 90% acetone in the dark at −20 °C for 24 h. Chl-a concentrations for each size fraction (<5 μm and >5 μm) were then determined fluorometrically using a Tuner designs 10AU fluorometer [31,45]. Results were expressed as μg L−1.
Total zooplankton abundance in each treatment was determined from a vertical net tow, from the bottom of the mesocosm to the surface, using a modified WP-2 net (diameter 25 cm, mesh size 100 μm). Samples were preserved using Lugol’s iodine solution [23,46]. In the laboratory, total zooplankton (abundance expressed as Ind L−1) in each treatment was determined from a 1/2 to 1/4 subsample determined using a Folsom plankton splitter and examined with a dissection microscope (Olympus) operated at 400× magnification. Zooplankton were identified to the species level using the identification keys of Boltovskoy [47]. One sample from each treatment was collected on days 0, 2, 6, 8 and 10 for analysis of community composition.
For the determination of total zooplankton biomass, the subsample was gently filtered (vacuum <5 cm Hg) through a pre-weighed oven dried GF/C filter [31]. The filter was then oven dried at 60 °C for 48 h after which time the filter was re-weighed using a Sartorius microbalance. The difference between the final and initial weights of the filter were assumed to correspond to the total zooplankton biomass. Zooplankton biomass was expressed as μg dwt L−1.

2.4. Statistical Analyses

Repeated measures ANOVA (RM-ANOVA) [48] was used to evaluate the effects of Treatment, Day (time), and their interaction on the physiochemical and biological response variables [49]. Each mesocosm replicate was treated as a subject with repeated measurements over 10 days. Analyses were conducted using the ‘aov_ez’ function from the ‘afex’ package [50], which applies Type III sums of squares and Greenhouse-Geisser correction [51] when sphericity assumptions are violated. Post hoc pairwise comparisons of estimated marginal means were performed using Tukey’s adjustment to identify significant differences averaged across all days [52,53].
To assess the contribution of different phytoplankton size classes to total Chl-a concentrations, size-fractionated data (<5 μm and >5 μm) were analyzed across all treatments over time. For each replicate and sampling day, total Chl-a concentration was calculated as the sum of both fractions, and the relative contribution of each size class was expressed as a proportion of this total. Size structure shifts were evaluated using a size class ratio (<5 μm/>5 μm) calculated per replicate and day. A cumulative ratio per treatment was derived by summing Chl-a concentrations across all replicates and days, then dividing the total <5 μm by total >5 μm value. The data was tested for normality and homogeneity of variances before conducting ANOVA. If assumptions were violated, a Kruskal–Wallis rank sum test was used [54]. Dunn’s post hoc test with Benjamini–Hochberg p-value adjustments was used to infer specific differences between treatments [55,56,57].
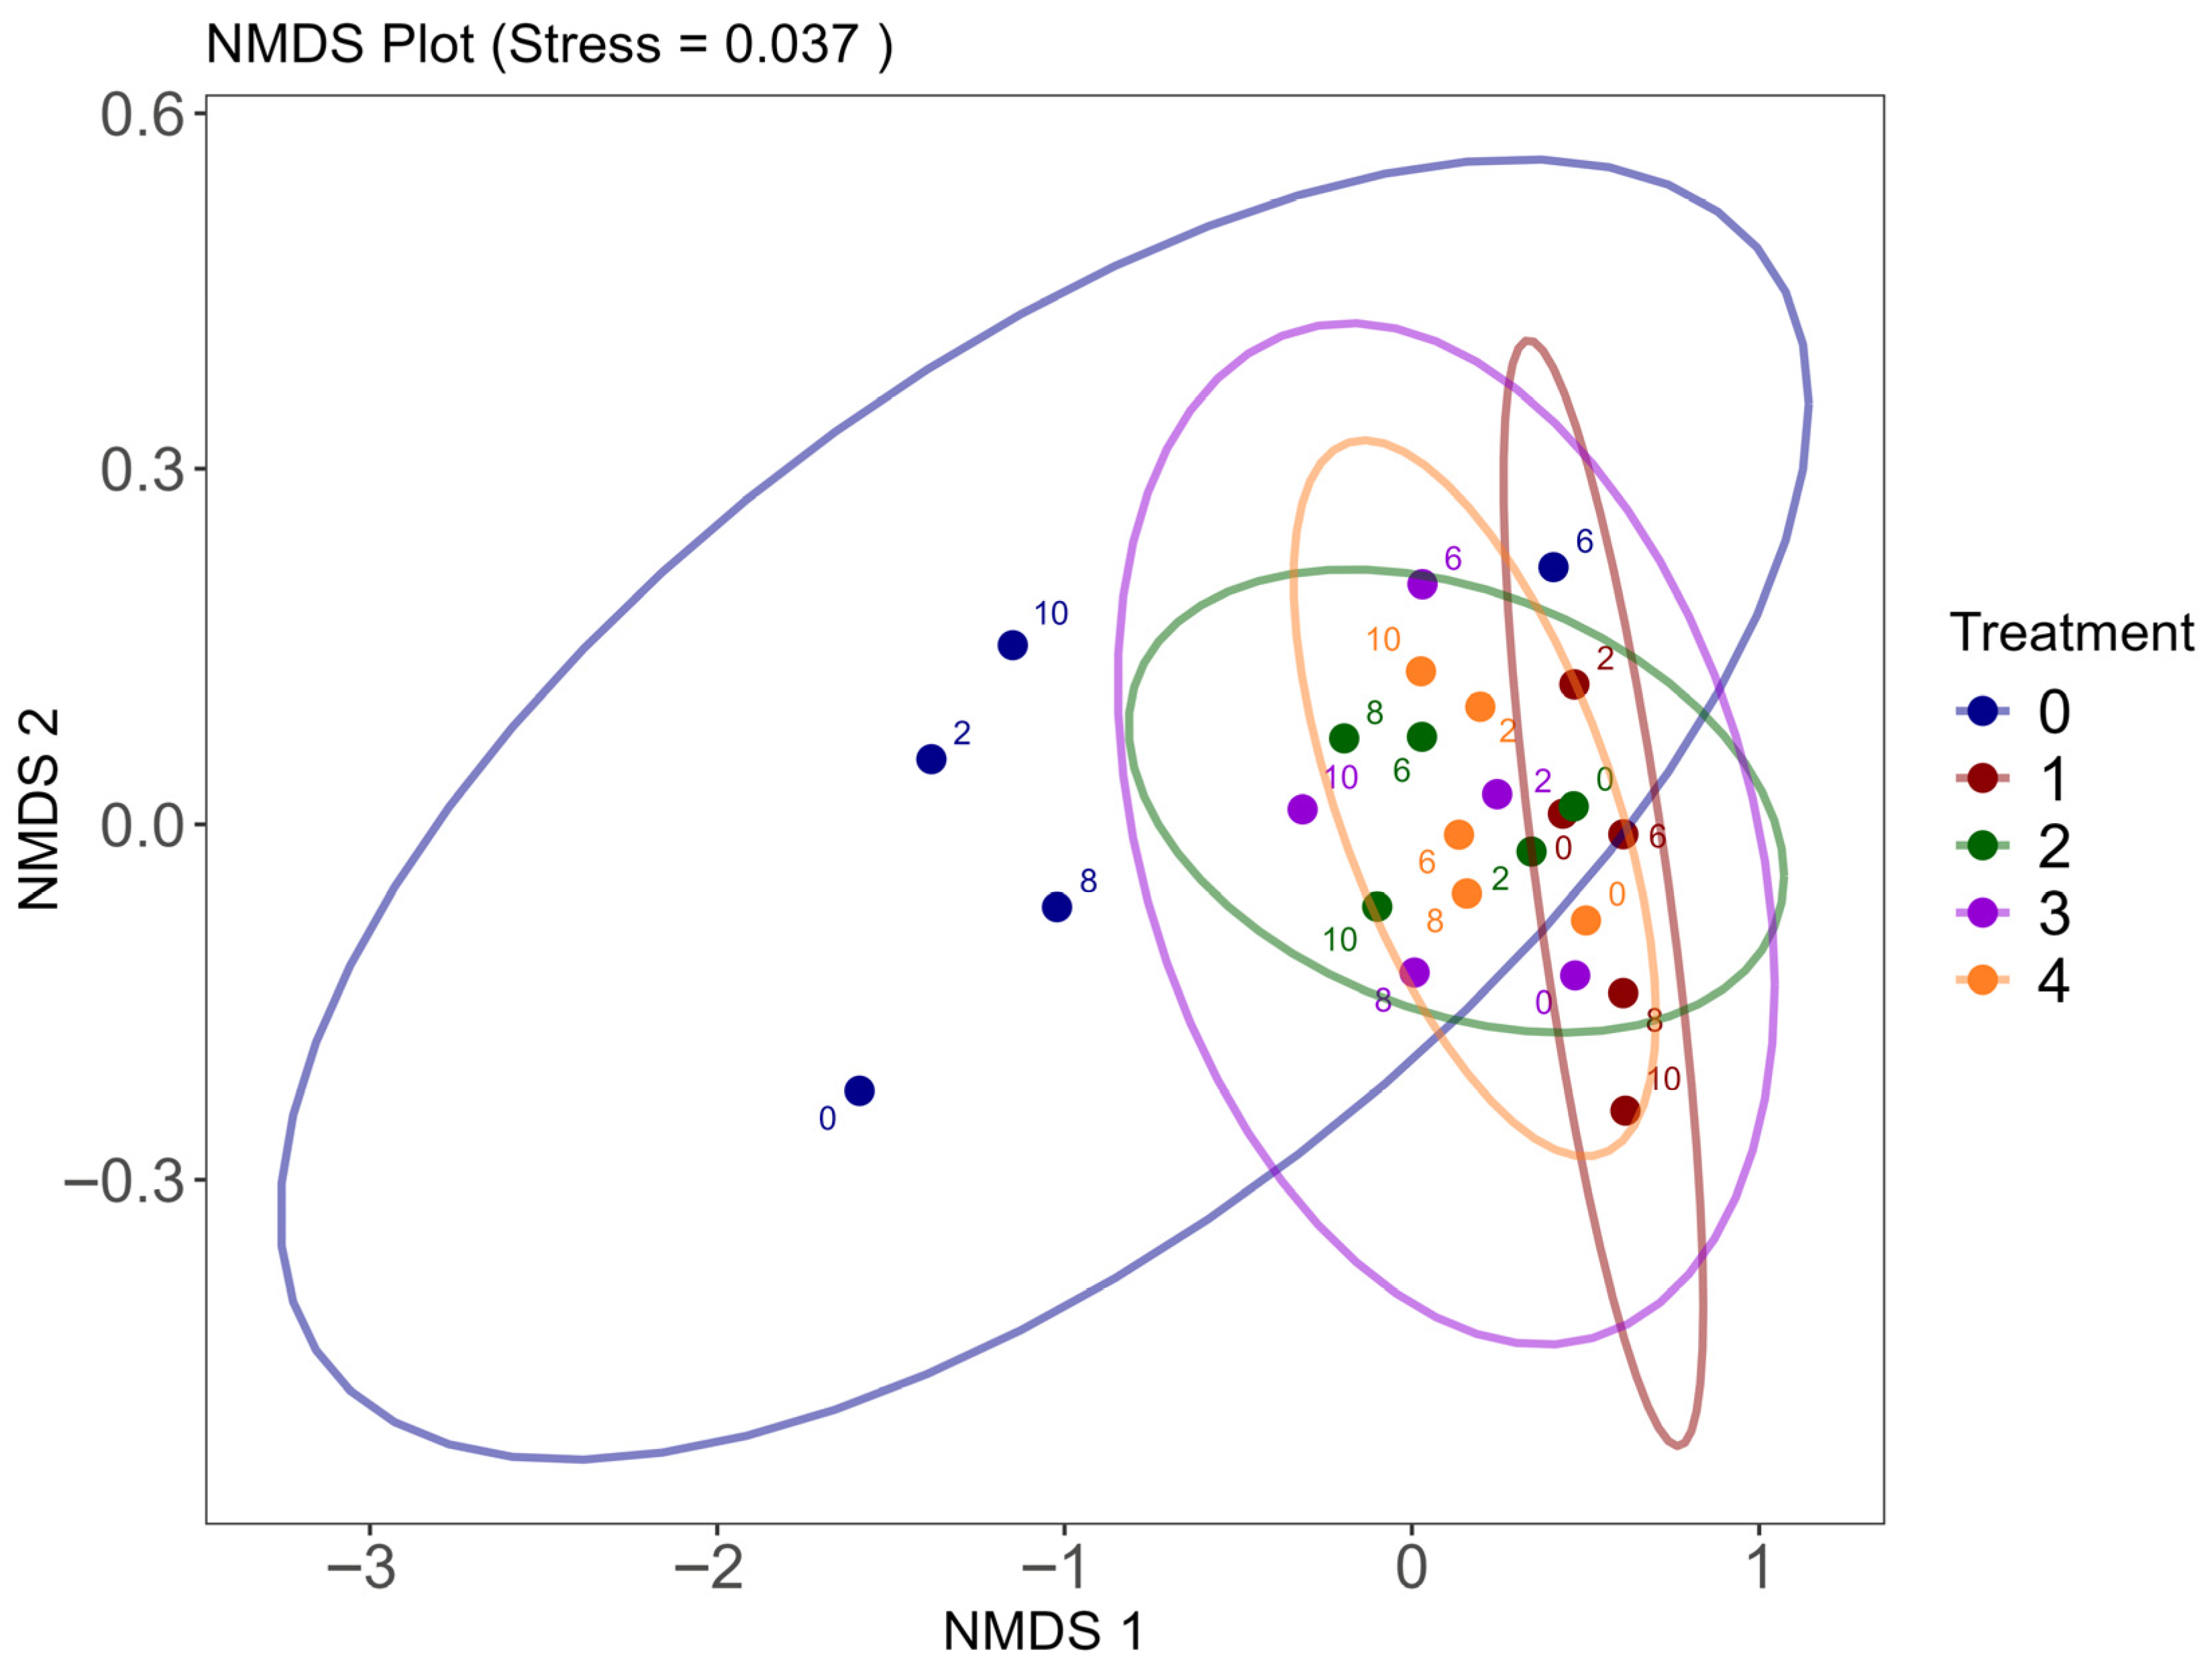
A Non-metric Multidimensional Scaling (NMDS) plot was used to examine the changes in zooplankton community composition among treatments over time. Each point on the plot represents the zooplankton community composition on a specific day for a given treatment, with proximity indicating similarity and distance reflecting distinctiveness between communities. A permutational multivariate analysis of variance (PERMANOVA) was performed using Bray–Curtis dissimilarities to evaluate differences in zooplankton community composition between treatments [58]. The analysis assessed whether treatment had a significant effect on multivariate species assemblages. To verify the assumption of equal multivariate dispersion, a prerequisite for PERMANOVA, the “betadisper” function was used, followed by an ANOVA test on group dispersions.
To quantify the effects of predators treatments on zooplankton (herbivore) biomass and Chl-a (producer) concentration, standardized effect sizes were calculated using the log-response ratio (LRR) [59]. LRR is defined as the natural logarithm of the ratio between the treatment mean and control mean [59]. This metric enabled proportional comparisons of predator effects on Chl-a concentrations and zooplankton biomass. Sampling variances for each LRR were estimated using the ‘escalc’ function in the ‘metafor’ R package [60], following Su, et al. [61], to incorporate sample size and variability. Treatment-level summaries (mean, standard deviation and sample size) were calculated for both variables with control means serving as baselines. LRRs for each predator treatment relative to the control were calculated as [59,61]:
L R R = ln ( M e a n T r e a t m e n t M e a n C o n t r o l )
Separate LRRs were derived for Chl-a (producers) concentration and zooplankton biomass (herbivores). A positive LRR for zooplankton indicates increased herbivore biomass relative to the control, while a negative LRR for Chl-a concentration reflects reduced producer biomass. Due to small sample sizes, an unweighted approach was used and inferential results were interpreted cautiously, emphasizing effect size magnitudes and confidence intervals over hypothesis testing.
Treatment effects were visualized using a Dual LRR scatterplot with 95% confidence intervals (LRR ± 1.96 × SE), including a 1:1 reference line and a linear regression fit. To assess whether herbivore biomass changes predicted producer biomass changes, a linear regression was fitted with Chl-a LRR as the response and zooplankton biomass LRR as the predictor [61,62,63]. Finally, the mixed predator treatment (Treatment 4) was contrasted with the average of single predator treatments (Treatments 1–3) to test for diversity enhanced trophic cascade strength.
All statistical analyses were conducted using R studio (R version 4.5.0) [64], with significance levels set at 0.05. The following R packages were employed for the analysis: ‘ggplot2’ [65], ‘dplyr’ (1.1.4) and ‘tidyr’ (1.3.1) [66,67], ‘car’ [68] and ‘emmeans’ (1.10.3) [52]. Additional R packages used include ‘FSA’ (0.95) [69], ‘Dunn test’ (1.3.6) [70], ‘vegan’ (2.6-6.1) [71], and ‘ggrepel’ (0.9.5) [72].

3. Results

There were no significant differences in the selected physiochemical and biological variables considered at the start of the study (p-value < 0.05 in all cases).

3.1. Physiochemical Results

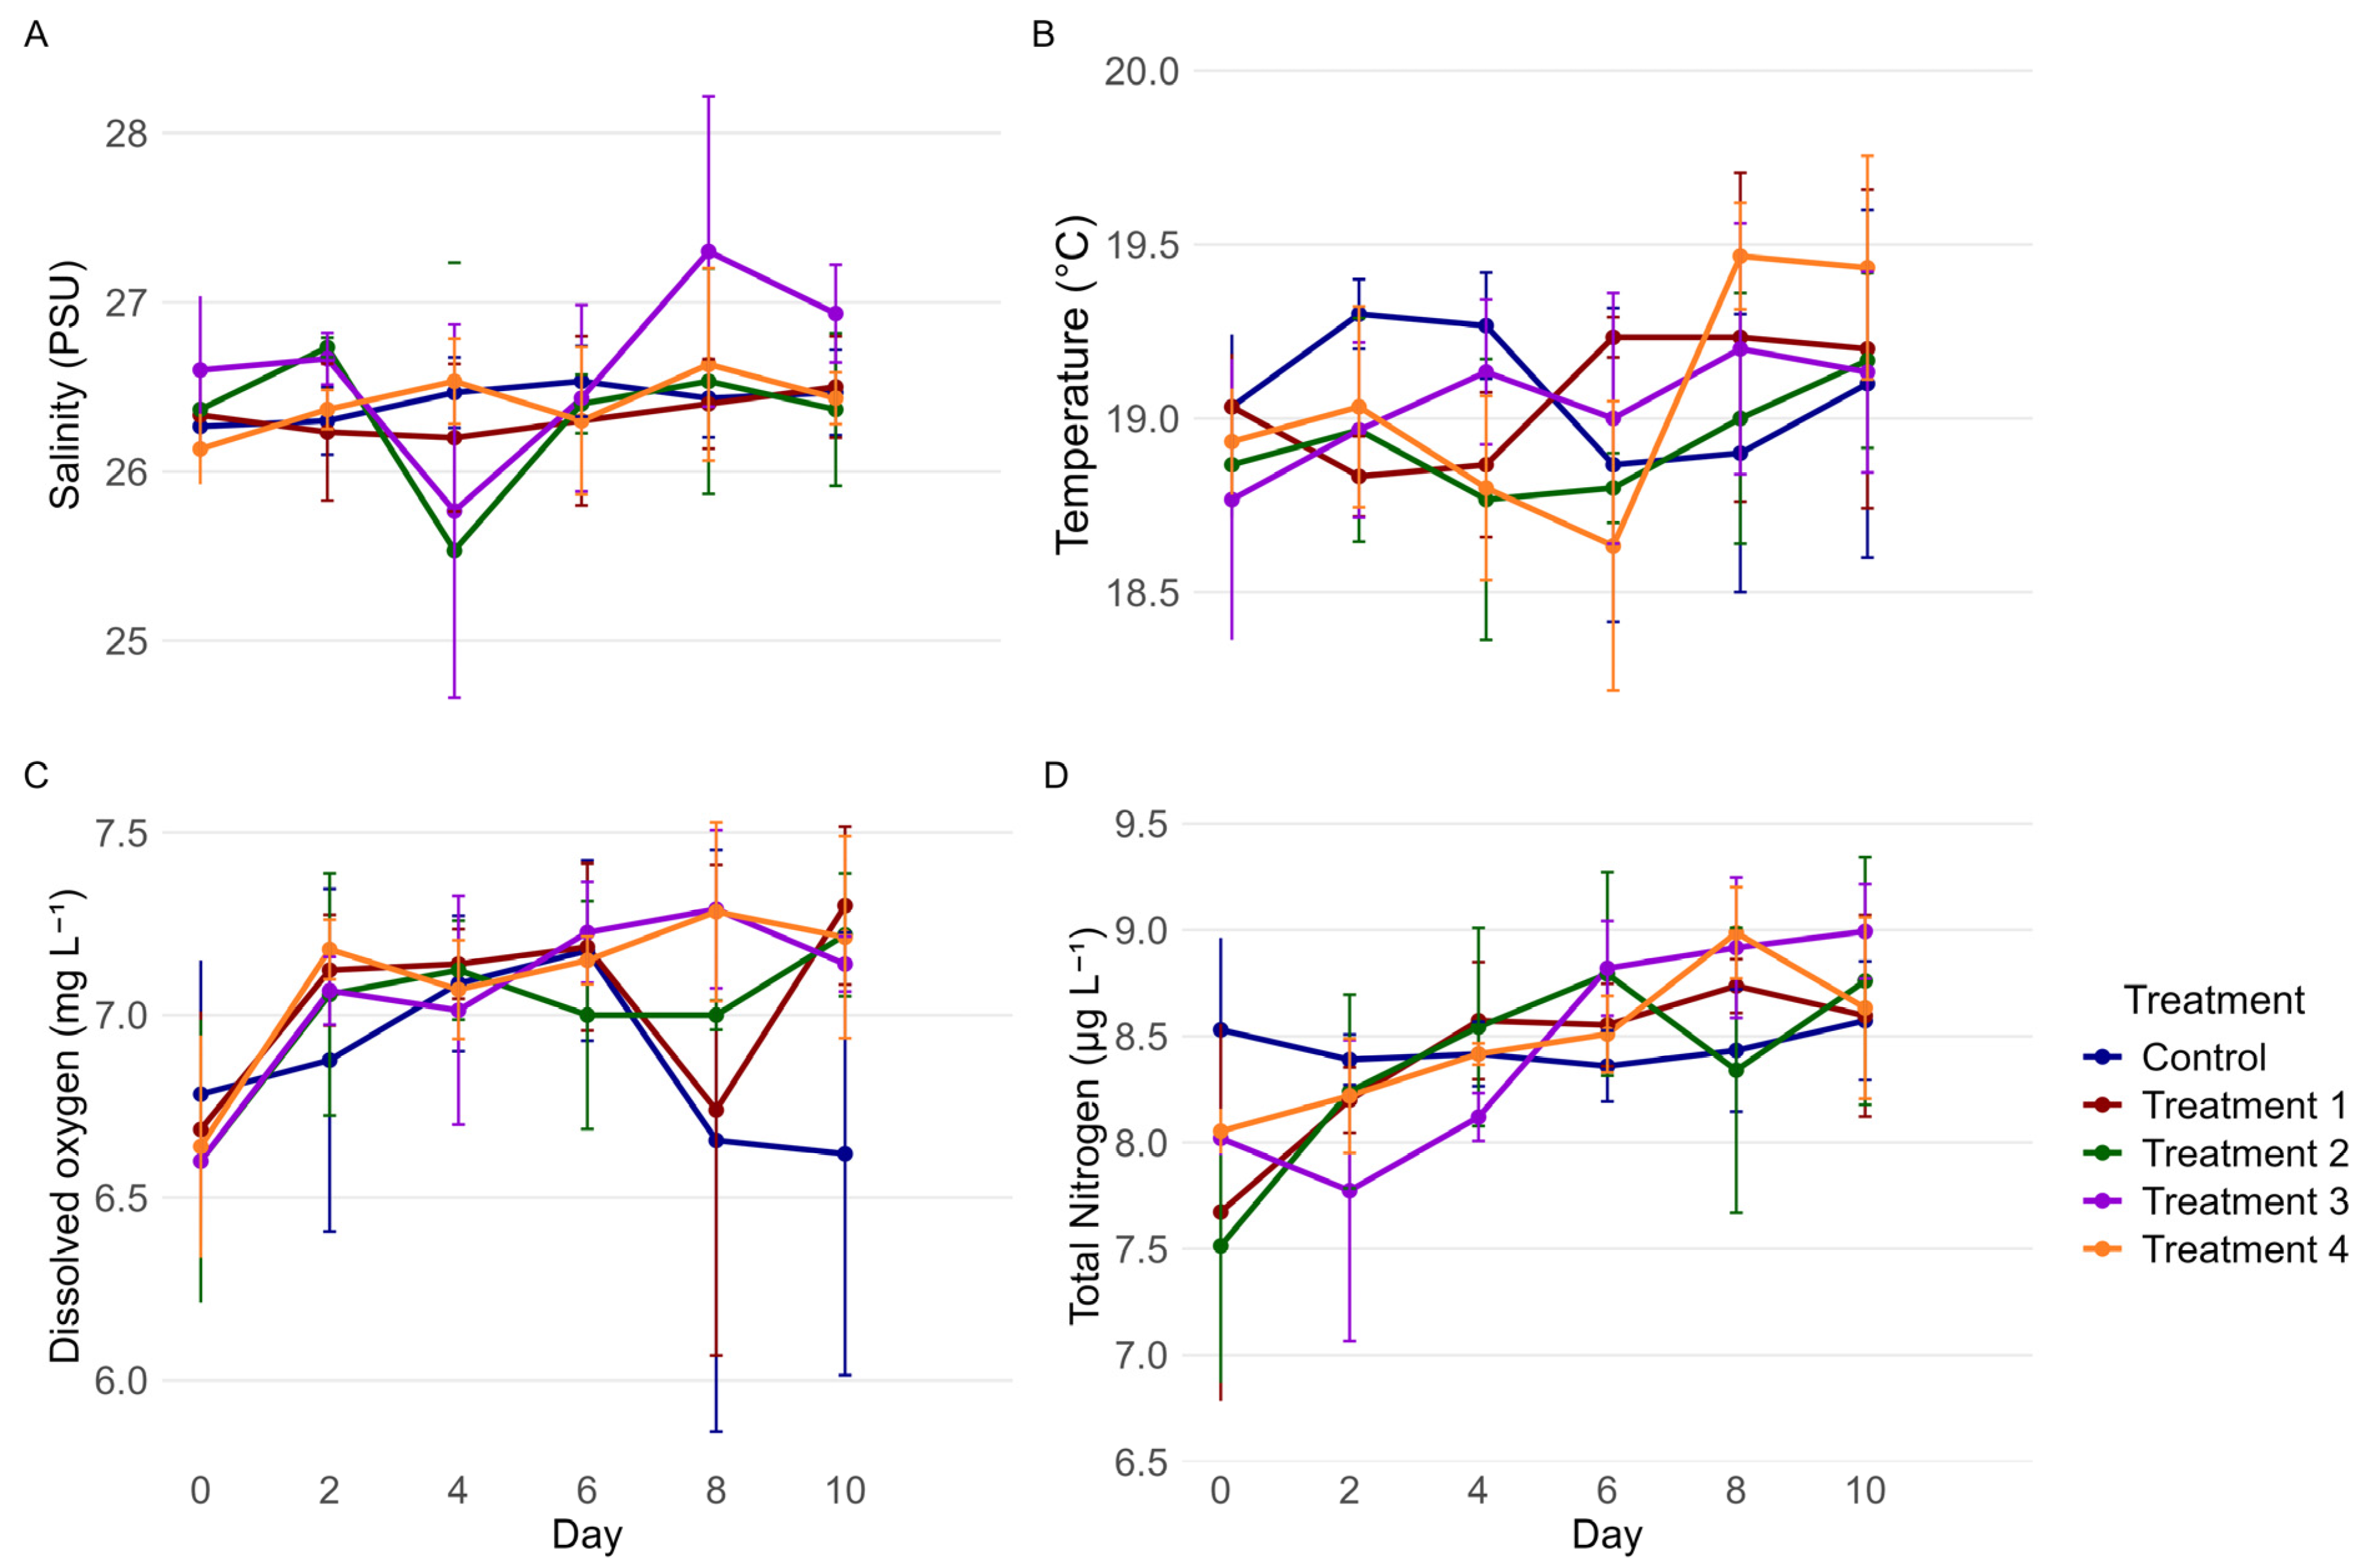
Salinity measurements varied across the different treatments (Figure 2A). The Control showed clustered data points between 26.0 and 27.0 (practical salinity units). Treatment 1 ranged between 25.5 and 27.0. Treatment 2 followed a similar pattern, though it had one outlier below 24.0. Salinities in Treatment 3 spanned from 25.5 to 27.5, with two outliers: one at 24.5 and another above 28.0. Treatment 4 exhibited a range similar to Treatments 2 and 3. RM-ANOVA found no significant effect of Treatment (F(4, 10) = 1.69, p-value = 0.228, generalized η2 = 0.061), Day (F(2.10, 20.99) = 1.91, p-value = 0.172, generalized η2 = 0.147), or their interaction effect (F(8.40, 20.99) = 0.80, p-value = 0.617, generalized η2 = 0.224) on salinity. Assumptions were generally met, Levene’s test confirmed equal variances across treatments (p-value = 0.52), and Greenhouse-Geisser correction was used. Although the Shapiro–Wilk test suggested a departure from normality (p-value < 0.001), the Q-Q plot indicated that residuals were approximately normal apart from minor deviations at the tails. Given the robustness of ANOVA to moderate deviations, the results remain appropriate for interpretation.
Water temperatures within the different treatments ranged from 18.5 to 19.5 °C (Figure 2B). RM-ANOVA revealed no significant effect of Treatment on temperature (F(4, 10) = 0.49, p-value = 0.747, generalized η2 = 0.045). The main effect of Day was marginally non-significant (F(3.08, 30.83) = 2.76, p-value = 0.057, generalized η2 = 0.174). However, the interaction effect (Treatment × Day) was not significant (F(12.33, 30.83) = 1.32, p-value = 0.255, generalized η2 = 0.287), therefore temperature changes over time did not differ among treatments. Assumptions for RM-ANOVA were met, residuals were approximately normally distributed (Shapiro–Wilk: p-value = 0.22). Variances were homogenous across treatments (Levene’s test: p-value = 0.77), and Greenhouse-Geisser corrections were applied to account for any sphericity violations.
Dissolved Oxygen (DO) concentrations ranged from 6.3 to 7.5 mg L−1 across the treatments (Figure 2C). A significant main effect of Day was found for DO levels (F(2.39, 23.92) = 4.22, p-value = 0.022, generalized η2 = 0.282). The main effect of Treatment (F(4, 10) = 3.11, p-value 0.066, generalized η2 = 0.081) and the interaction effect of Treatment × Day were not significant (F(9.57, 23.92) = 0.79, p-value = 0.633). Assumption checks supported the use of RM-ANOVA. Residuals were approximately normally distributed despite a mild deviation detected by the Shapiro–Wilk test (W = 0.968, p-value = 0.027). Levene’s test confirmed homogeneity of variance across treatment groups (p-value = 0.74), and Greenhouse-Geisser corrections were applied.
Total nitrogen concentrations varied widely across the treatments (Figure 2D). Total nitrogen concentration in the Control and Treatment 1 ranged between 8.0 and 9.0 μg L−1, with two outliers in Treatment 1 falling below 7.5 μg L−1. Nitrogen concentrations in Treatment 2 ranged from 7.5 to 9.0 μg L−1 and had two outliers below this range. Treatments 3 and 4 exhibited similar ranges between 7.1 and 9.0 μg L−1, with one outlier at 7.0 μg L−1 in Treatment 3. RM-ANOVA indicated a significant main effect of Day on total nitrogen concentrations (F(2.77, 27.74) = 8.60, p-value < 0.001, generalized η2 = 0.438). There was no significant effect of Treatment (F(4, 10) = 0.41, p-value = 0.795, generalized η2 = 0.015), or interaction effect (F(11.10, 27.74) = 1.40, p-value = 0.299, generalized η2 = 0.336). Assumption checks supported the validity of the analysis (Shiro-Wilk: p-value = 0.262; Levene’s test: p-value = 0.707).

3.2. Chlorophyll-a Concentrations

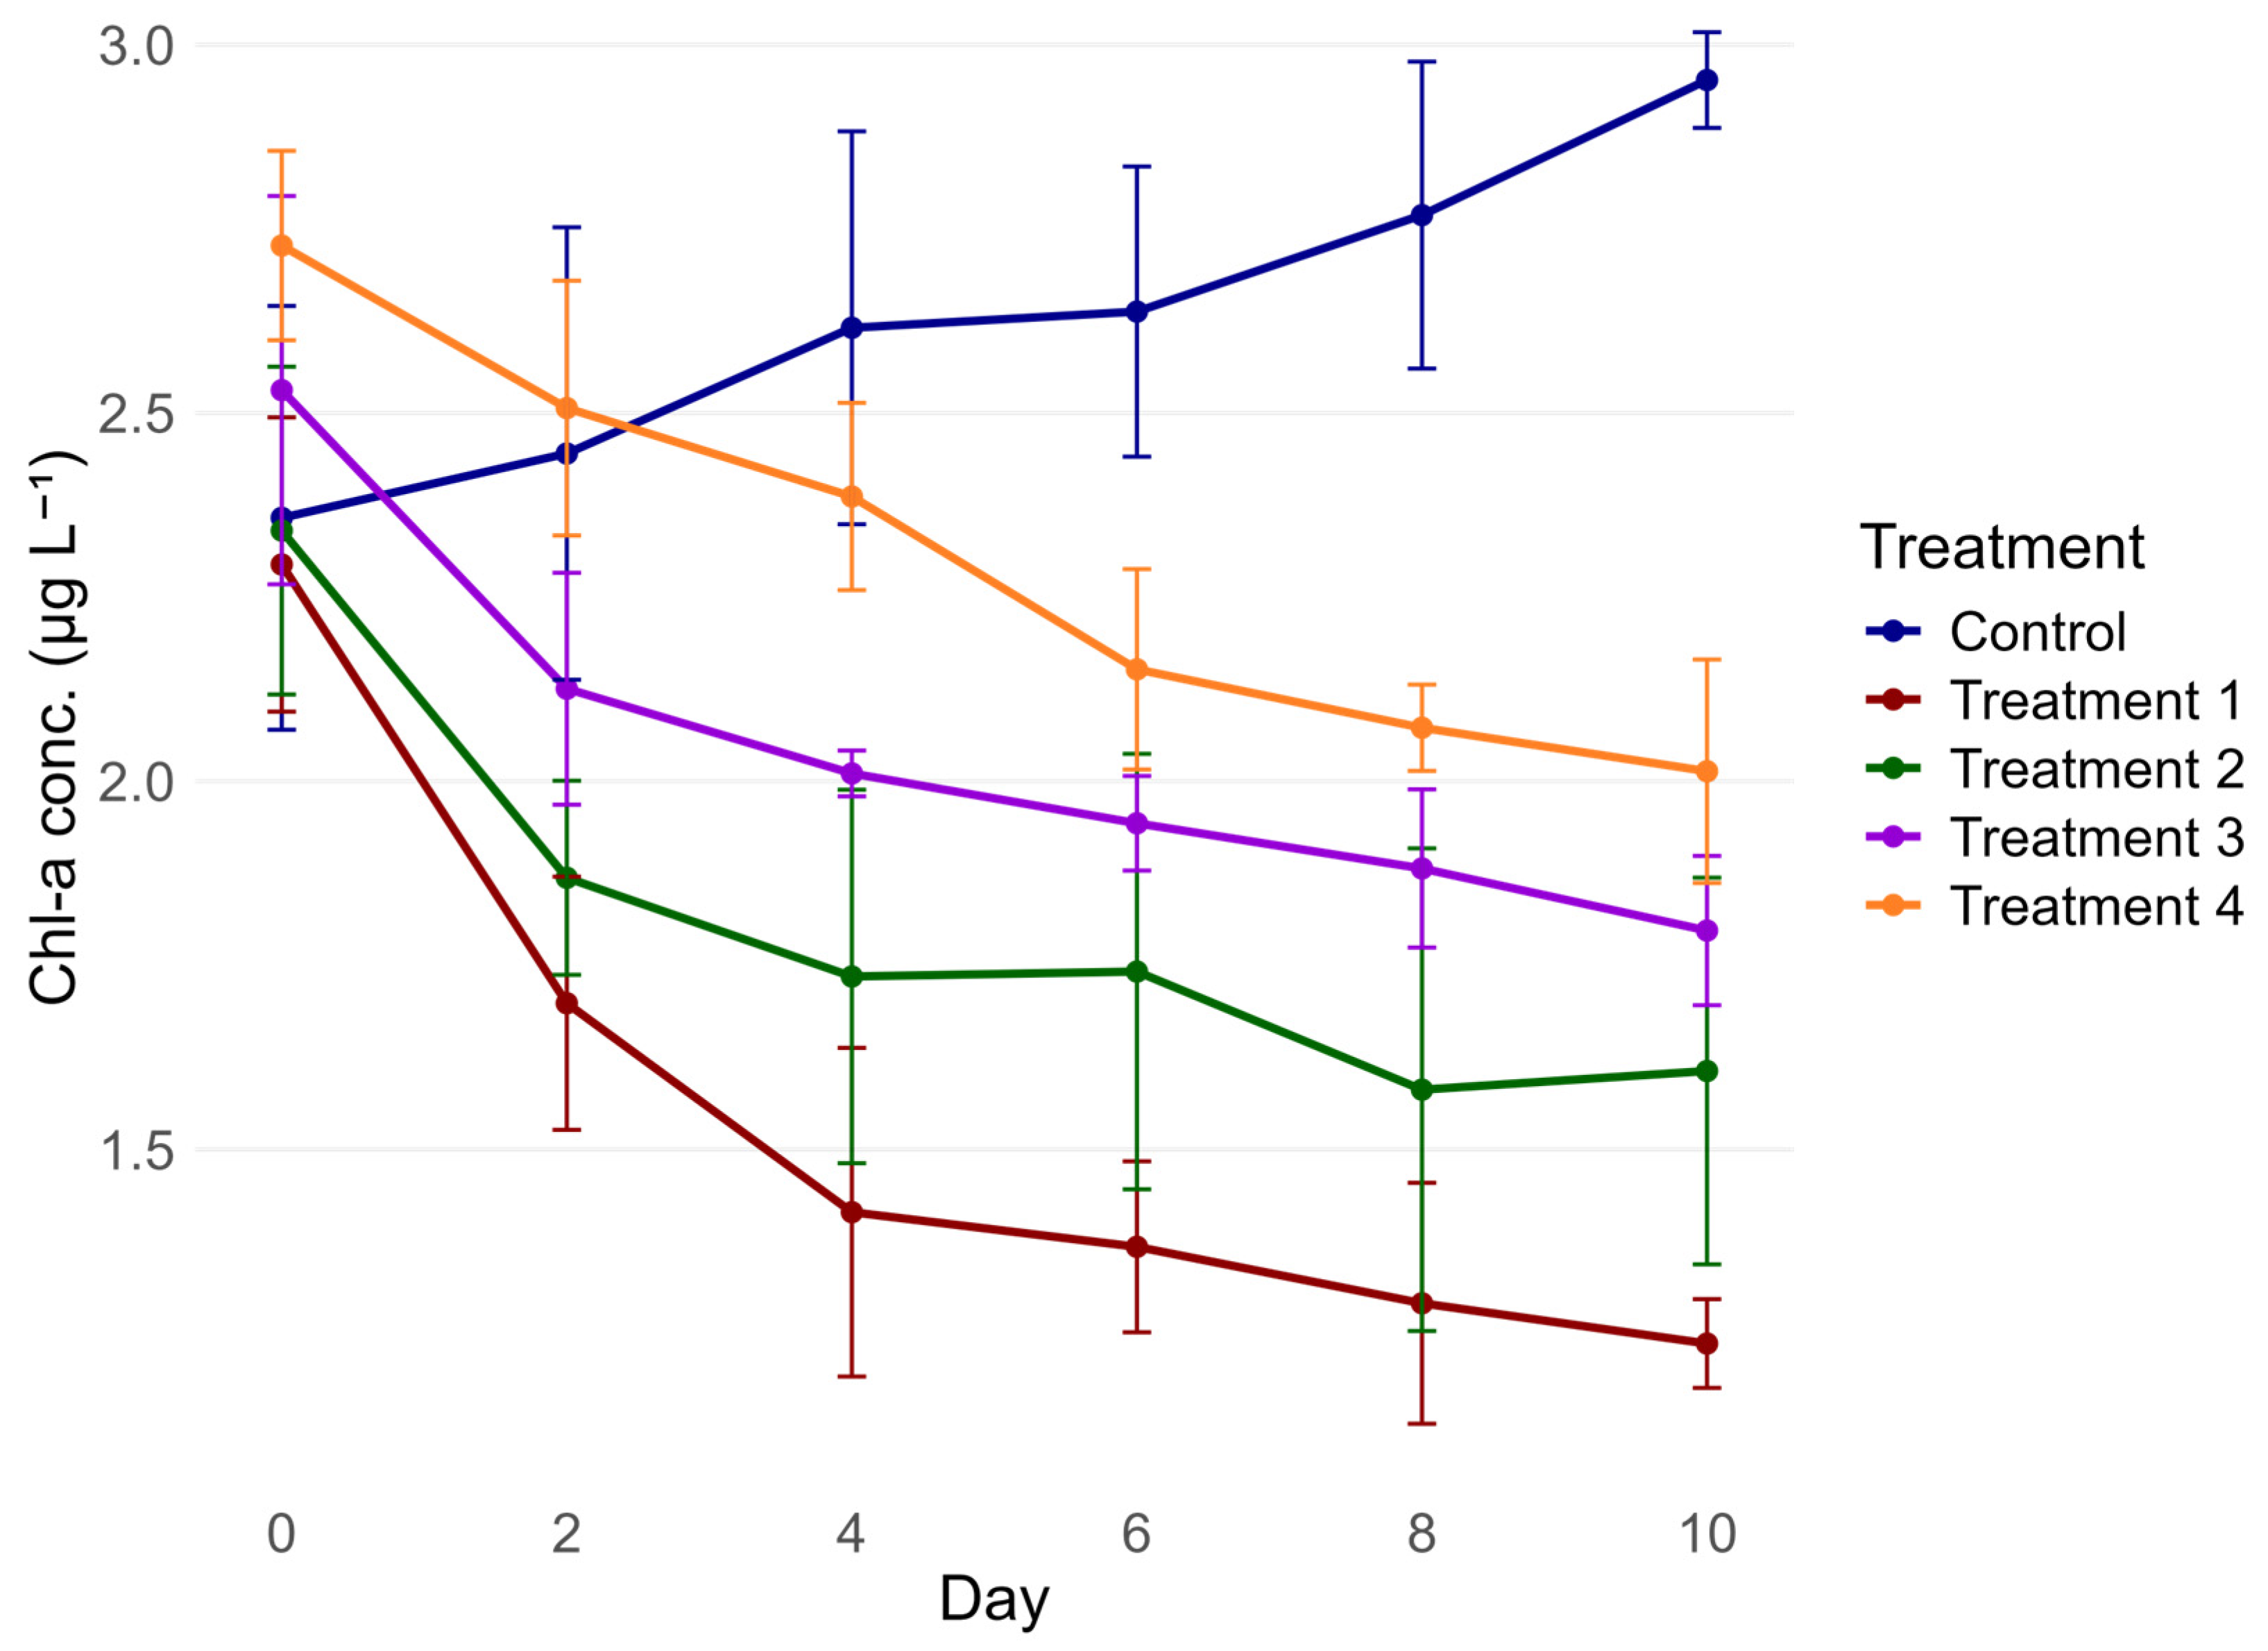
Total Chl-a concentrations during the study ranged from 1.189 to 3.021 μg L−1 (Figure 3). In Treatments 1 to 4, total Chl-a concentrations generally decreased over the duration of the mesocosm study. By contrast, the total Chl-a concentration in the Control increased during the 10-day study.
Chl-a concentrations differed significantly between treatments (F(4,10) = 23.79, p-value <0.001), over time (F(2.27, 22.71) = 33.91, p-value < 0.001), and in their interaction (F(9.08, 22.71) = 9.28, p-value < 0.001), with large effect sizes (>0.58). Assumptions were met for the use of RM-ANOVA (Shapiro–Wilk: p-value = 0.3811, Levene’s test: p-value = 0.4876).
Post hoc tests revealed that the Control treatment had the highest mean Chl-a concentration (2.63 ±   0.09   S E ) , which was significantly greater than Treatments 1 (1.55 ±   0.09 ; difference = 1.08, t(10) = 8.85, p-value < 0.0001), Treatment 2 (1.81 ±   0.09 ; difference = 0.82, t(10) = 6.70, p-value = 0.0004), and Treatment 3 (2.05 ±   0.09 ; difference = 0.58, t(10) = 4.77, p-value = 0.0053). Treatment 4 (2.31 ±   0.09 ) did not differ significantly from the Control (difference = 0.31, t(10) = 2.63, p-value = 0.139). Among treatments, Treatment 1 had the lowest Chl-a concentration and differed significantly from Treatments 3 (difference = 0.50, t(10) = −4.08, p-value = 0.015) and Treatment 4 (difference = 0.76, t(10) = −6.23, p-value = 0.0007). Differences between Treatments 1 and 2 (p-value = 0.274), Treatments 2 and 3 (p-value = 0.360), and Treatments 3 and 4 (p-value = 0.274) were not significant, while Treatment 2 and 4 differed significantly (difference = 0.50, t(10) = −4.08, p-value = 0.015).

3.3. Zooplankton Abundance and Biomass

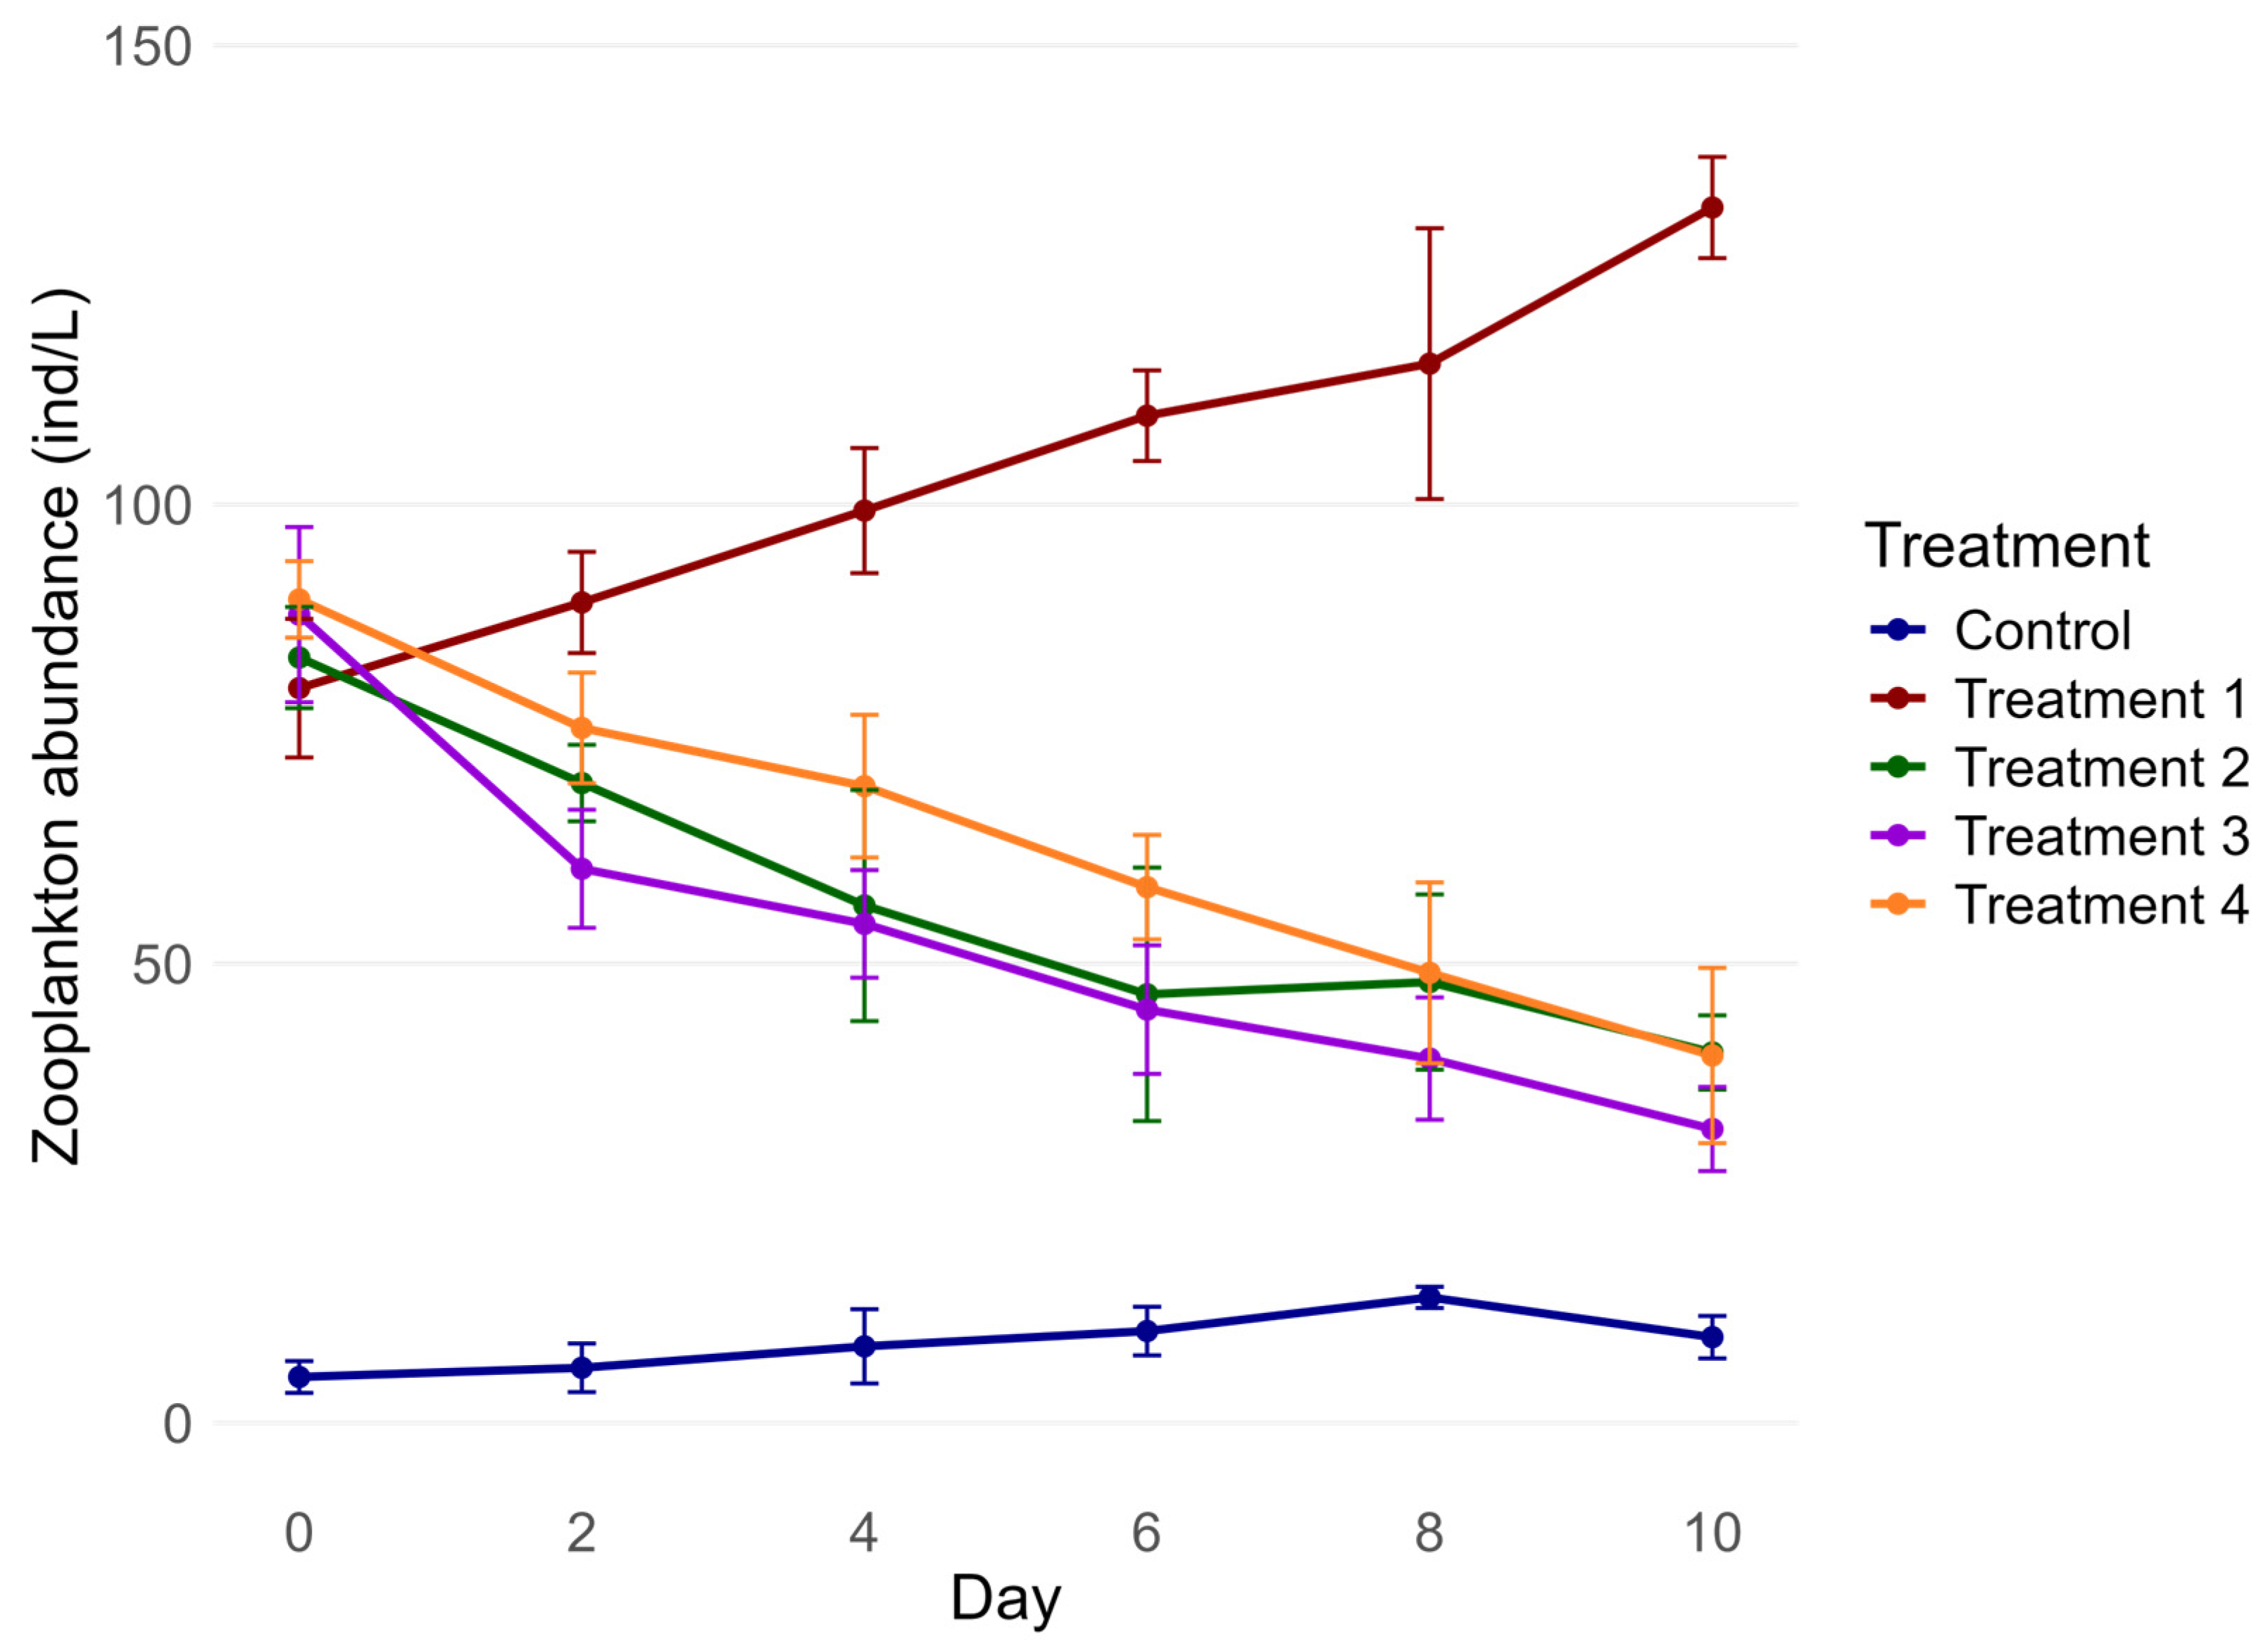
Total zooplankton abundances varied across treatments during the 10-day period and ranged from 27 to 136 Ind L−1 in Treatments 1 to 4, and from 3 to 15 Ind L−1 in the Control (Figure 4). Overall, the total zooplankton abundances increased in the Control and Treatment 1 whilst the abundances decreased in Treatments 2, 3 and 4 over the duration of the study.
Zooplankton abundance differed significantly across treatments (F(4, 10) = 138.99, p-value < 0.001, generalized η2 = 0.964) and changed significantly over time (F(3.22, 32.25) = 20.32, p-value < 0.001, generalized η2 = 0.514). Additionally, there was a significant interaction effect (Treatment × Day) (F(12.90, 32.25) = 26.02, p-value < 0.001, generalized η2 = 0.844). Model assumptions were met (Shapiro–Wilk test: W = 0.992, p-value = 0.86; Levene’s test: F = 0.395, p-value = 0.81) for RM-ANOVA and sphericity was accounted for (Greenhouse-Geisser correction). Post hoc tests showed zooplankton abundance was significantly higher in all treatments (emmeans 53.22–104.33 Ind. L−1) compared to the Control (all p-values 0.0001). Treatment 1 had the highest abundance, significantly exceeding Treatments 2, 3, and 4 (all p-value < 0.0001). Treatments 2 to 4 did not significantly differ from each other (p-value > 0.15).
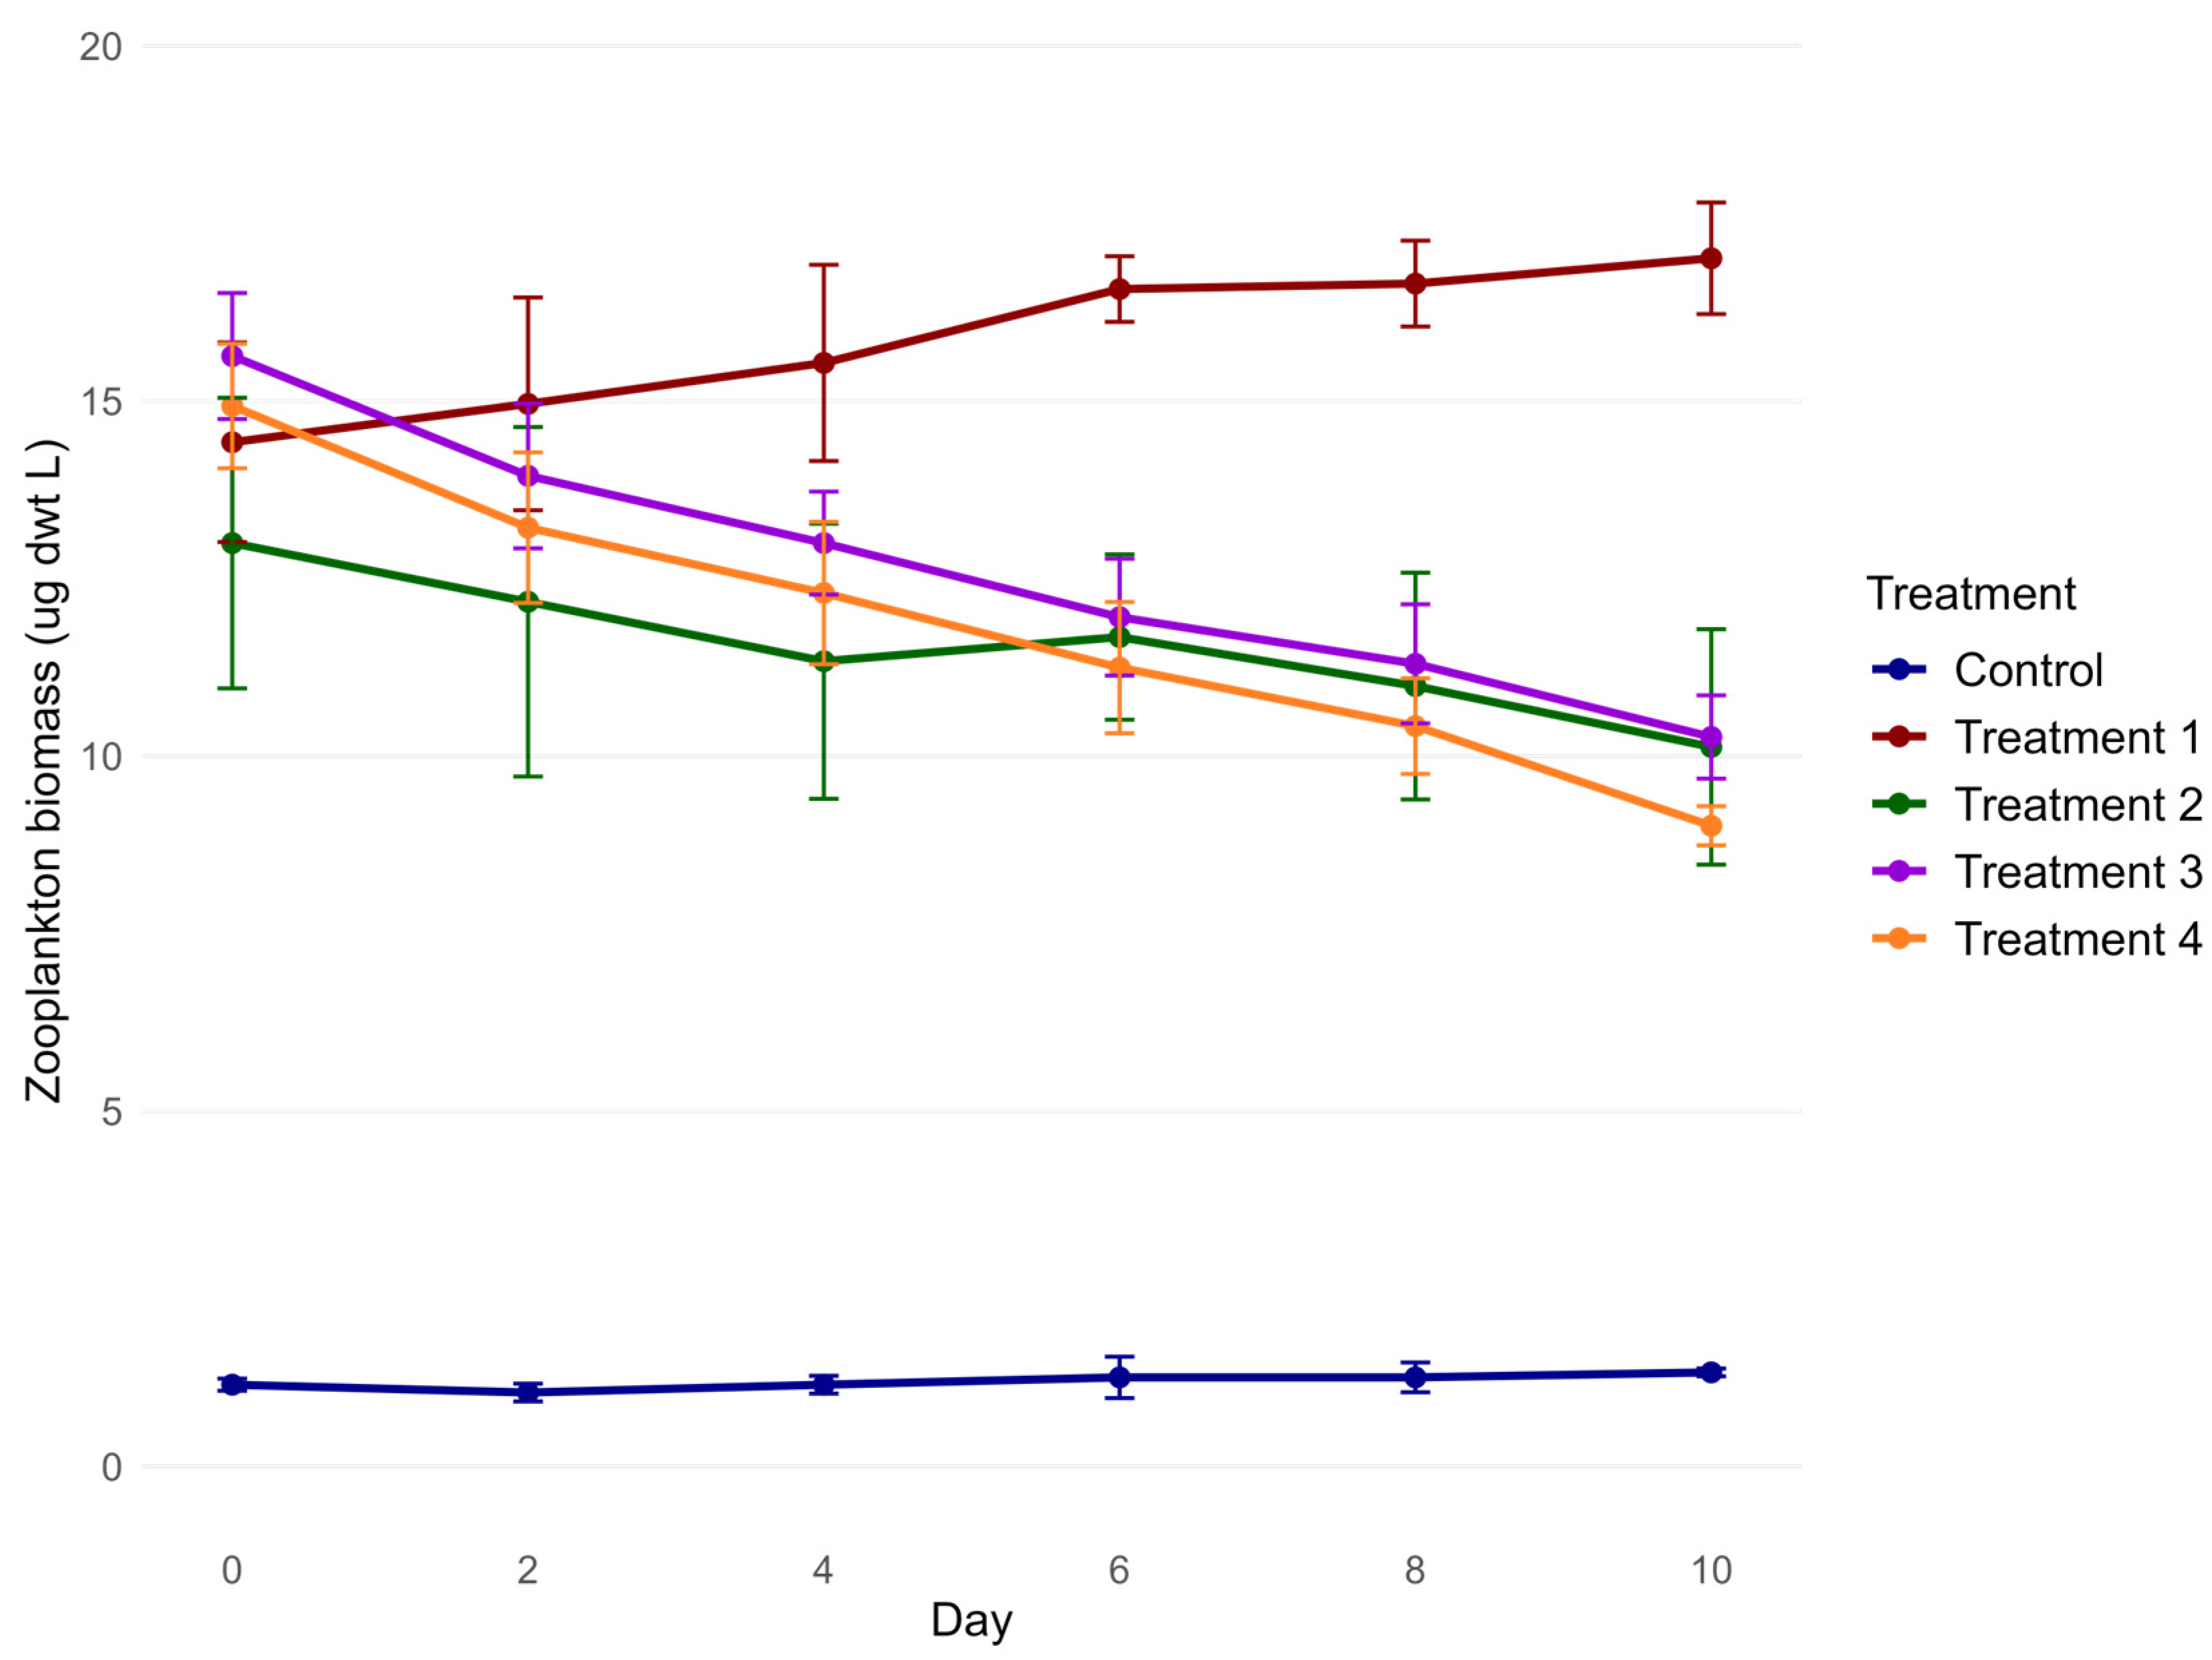
Total zooplankton biomass showed distinct trends across treatments ranging from 0.92 to 17.69 μg dwt L−1 during the 10-day period (Figure 5). Overall, the total zooplankton biomass in the Control and Treatment 1 increased over the 10-day experiment whereas the total biomass decreased in Treatments 2 to 4.
Zooplankton biomass differed significantly among treatments (F(4, 10) = 105.37, p-value < 0.001, generalized η2 = 0.968), and over time (F(1.73, 17.33) = 22.36, p-value < 0.001, generalized η2 = 0.386). There was a significant interaction effect (F(6.93, 17.33) = 13.09, p-value < 0.001, generalized η2 = 0.595). Model assumptions were met for RM-ANOVA (Shapiro–Wilk test: W = 0.985, p-value = 0.398; Levene’s test: F = 0.90, p-value = 0.498), and the Greenhouse-Geisser correction was applied.
Post hoc comparisons showed that all predator treatments had significantly higher zooplankton biomass than the Control (all p-value <0.0001). Treatment 1 yielded the highest biomass, significantly exceeding Treatments 2 to 4 (all p-value < 0.05). Treatments 2 to 4 did not differ significantly from one another (all p-value > 0.05).

3.4. Community Effects

3.4.1. Phytoplankton

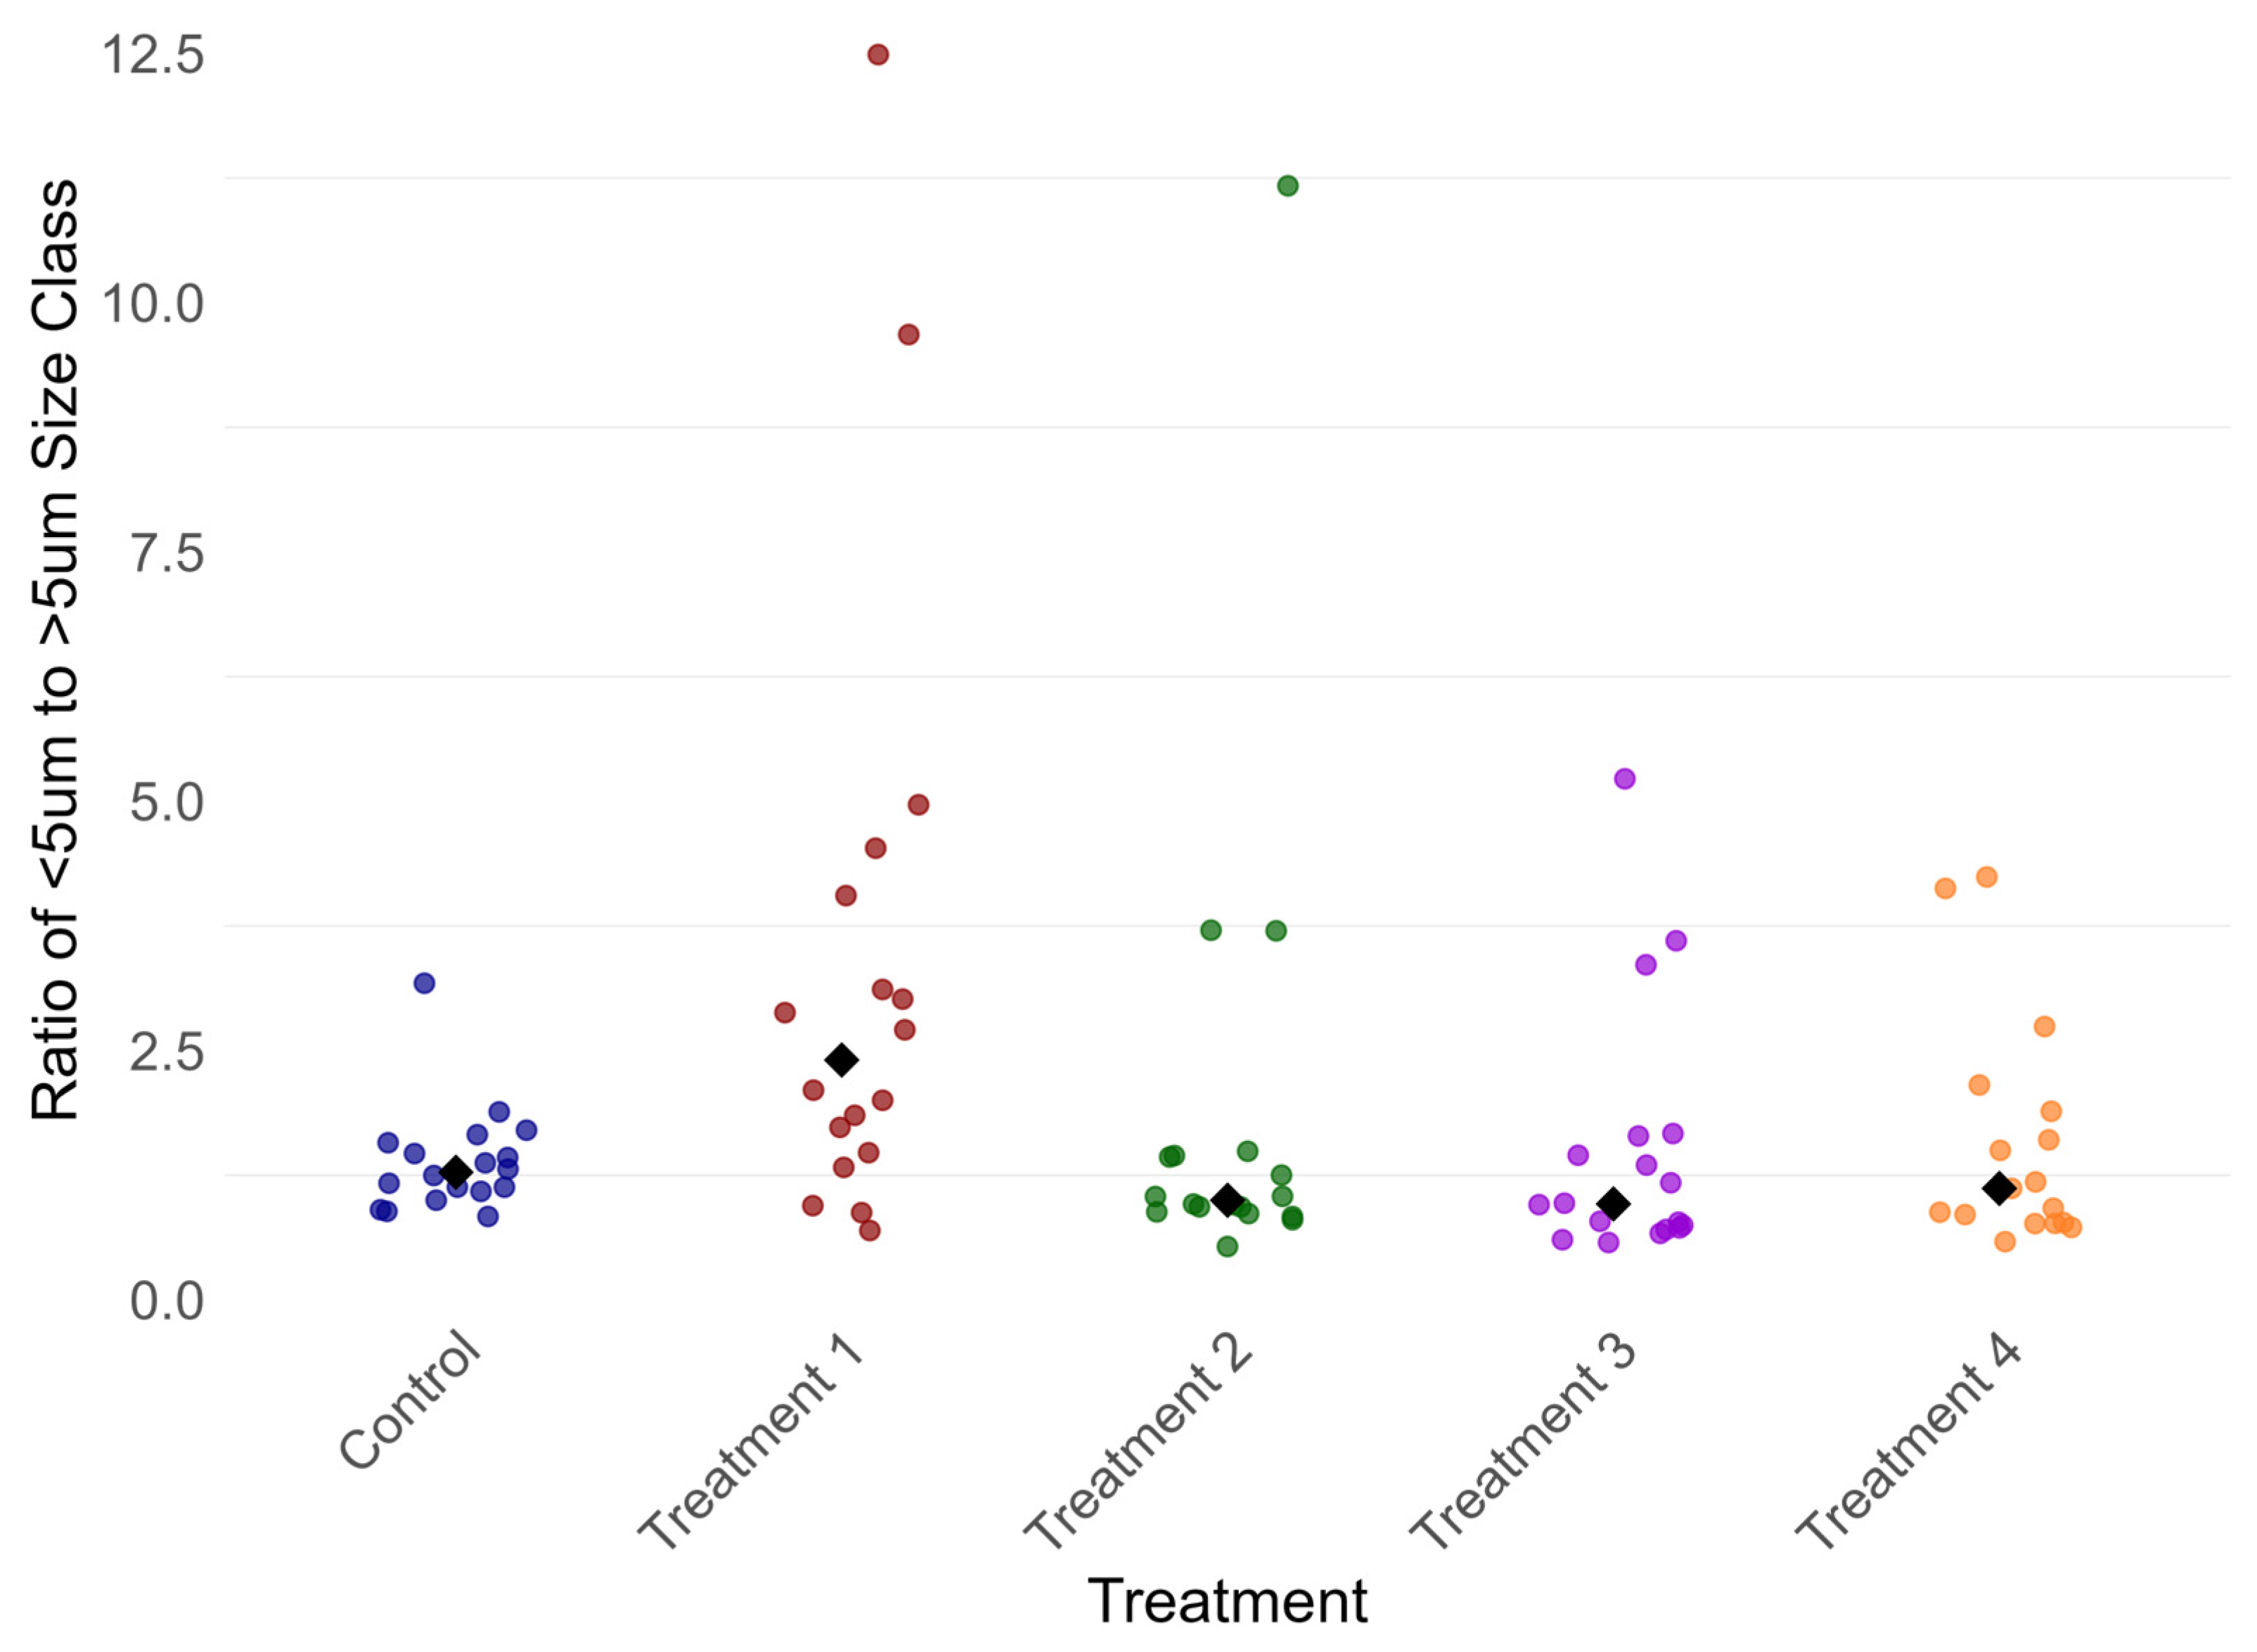
The ratios of the <5 μm to >5 μm phytoplankton size classes across the different treatments were highly variable between and within treatments and ranged from 0.1 to 12.5 (Figure 6). Assumptions of normality and homogeneity of variance were violated for one-way ANOVA, thus a Kruskal–Wallis test was used to evaluate differences in the phytoplankton size class ratios across treatments. Results showed a significant effect (ꭓ2 = 13.271, df = 4, p-value = 0.01003), indicating at least one group differed. Dunn’s post hoc tests with Benjamini–Hochberg correction (Table A2; Appendix A) revealed Treatment 1 differed significantly from Treatment 2 (p-value = 0.028), Treatment 3 (p-value = −0.010) and Treatment 4 (p-value = 0.022). No other pairwise comparisons were statistically significant (p-value > 0.05).

3.4.2. Zooplankton

The NMDs analysis provided a visualization of changes in zooplankton community composition across treatments and over time (Figure 7). The ordination produced a low stress value (0.037), indicating a good fit between the two-dimensional configuration and the original data. Total zooplankton abundances throughout the study were dominated by copepodites, followed by adult copepods of the generas Acartia, Pseudodiaptomus, and Oithona. The results of the NMDS show that the Control treatment exhibited a more distinct and variable community, shown by its large and dispersed ellipse. However, the ellipses for Treatments 1 through 4 were more compact and overlapping, suggesting greater similarity in the zooplankton community assemblages across the predator treatments. PERMANOVA revealed a significant effect of treatment on zooplankton community composition (R2 = 0.203, F = 5.86, p-value = 0.007). Therefore, approximately 20% of the variation in assemblages was attributable to treatment. The assumption of homogeneous multivariate dispersions was met (p-value = 0.36).
Consistent patterns in biomass shifts emerged across predator treatments. All predator treatments increased zooplankton biomass relative to the Control (LRR_zoo: 2.27 to 2.59), while simultaneously decreasing phytoplankton biomass (LRR_Chl-a range: −0.13 to −0.53) (Table A3, Appendix A).
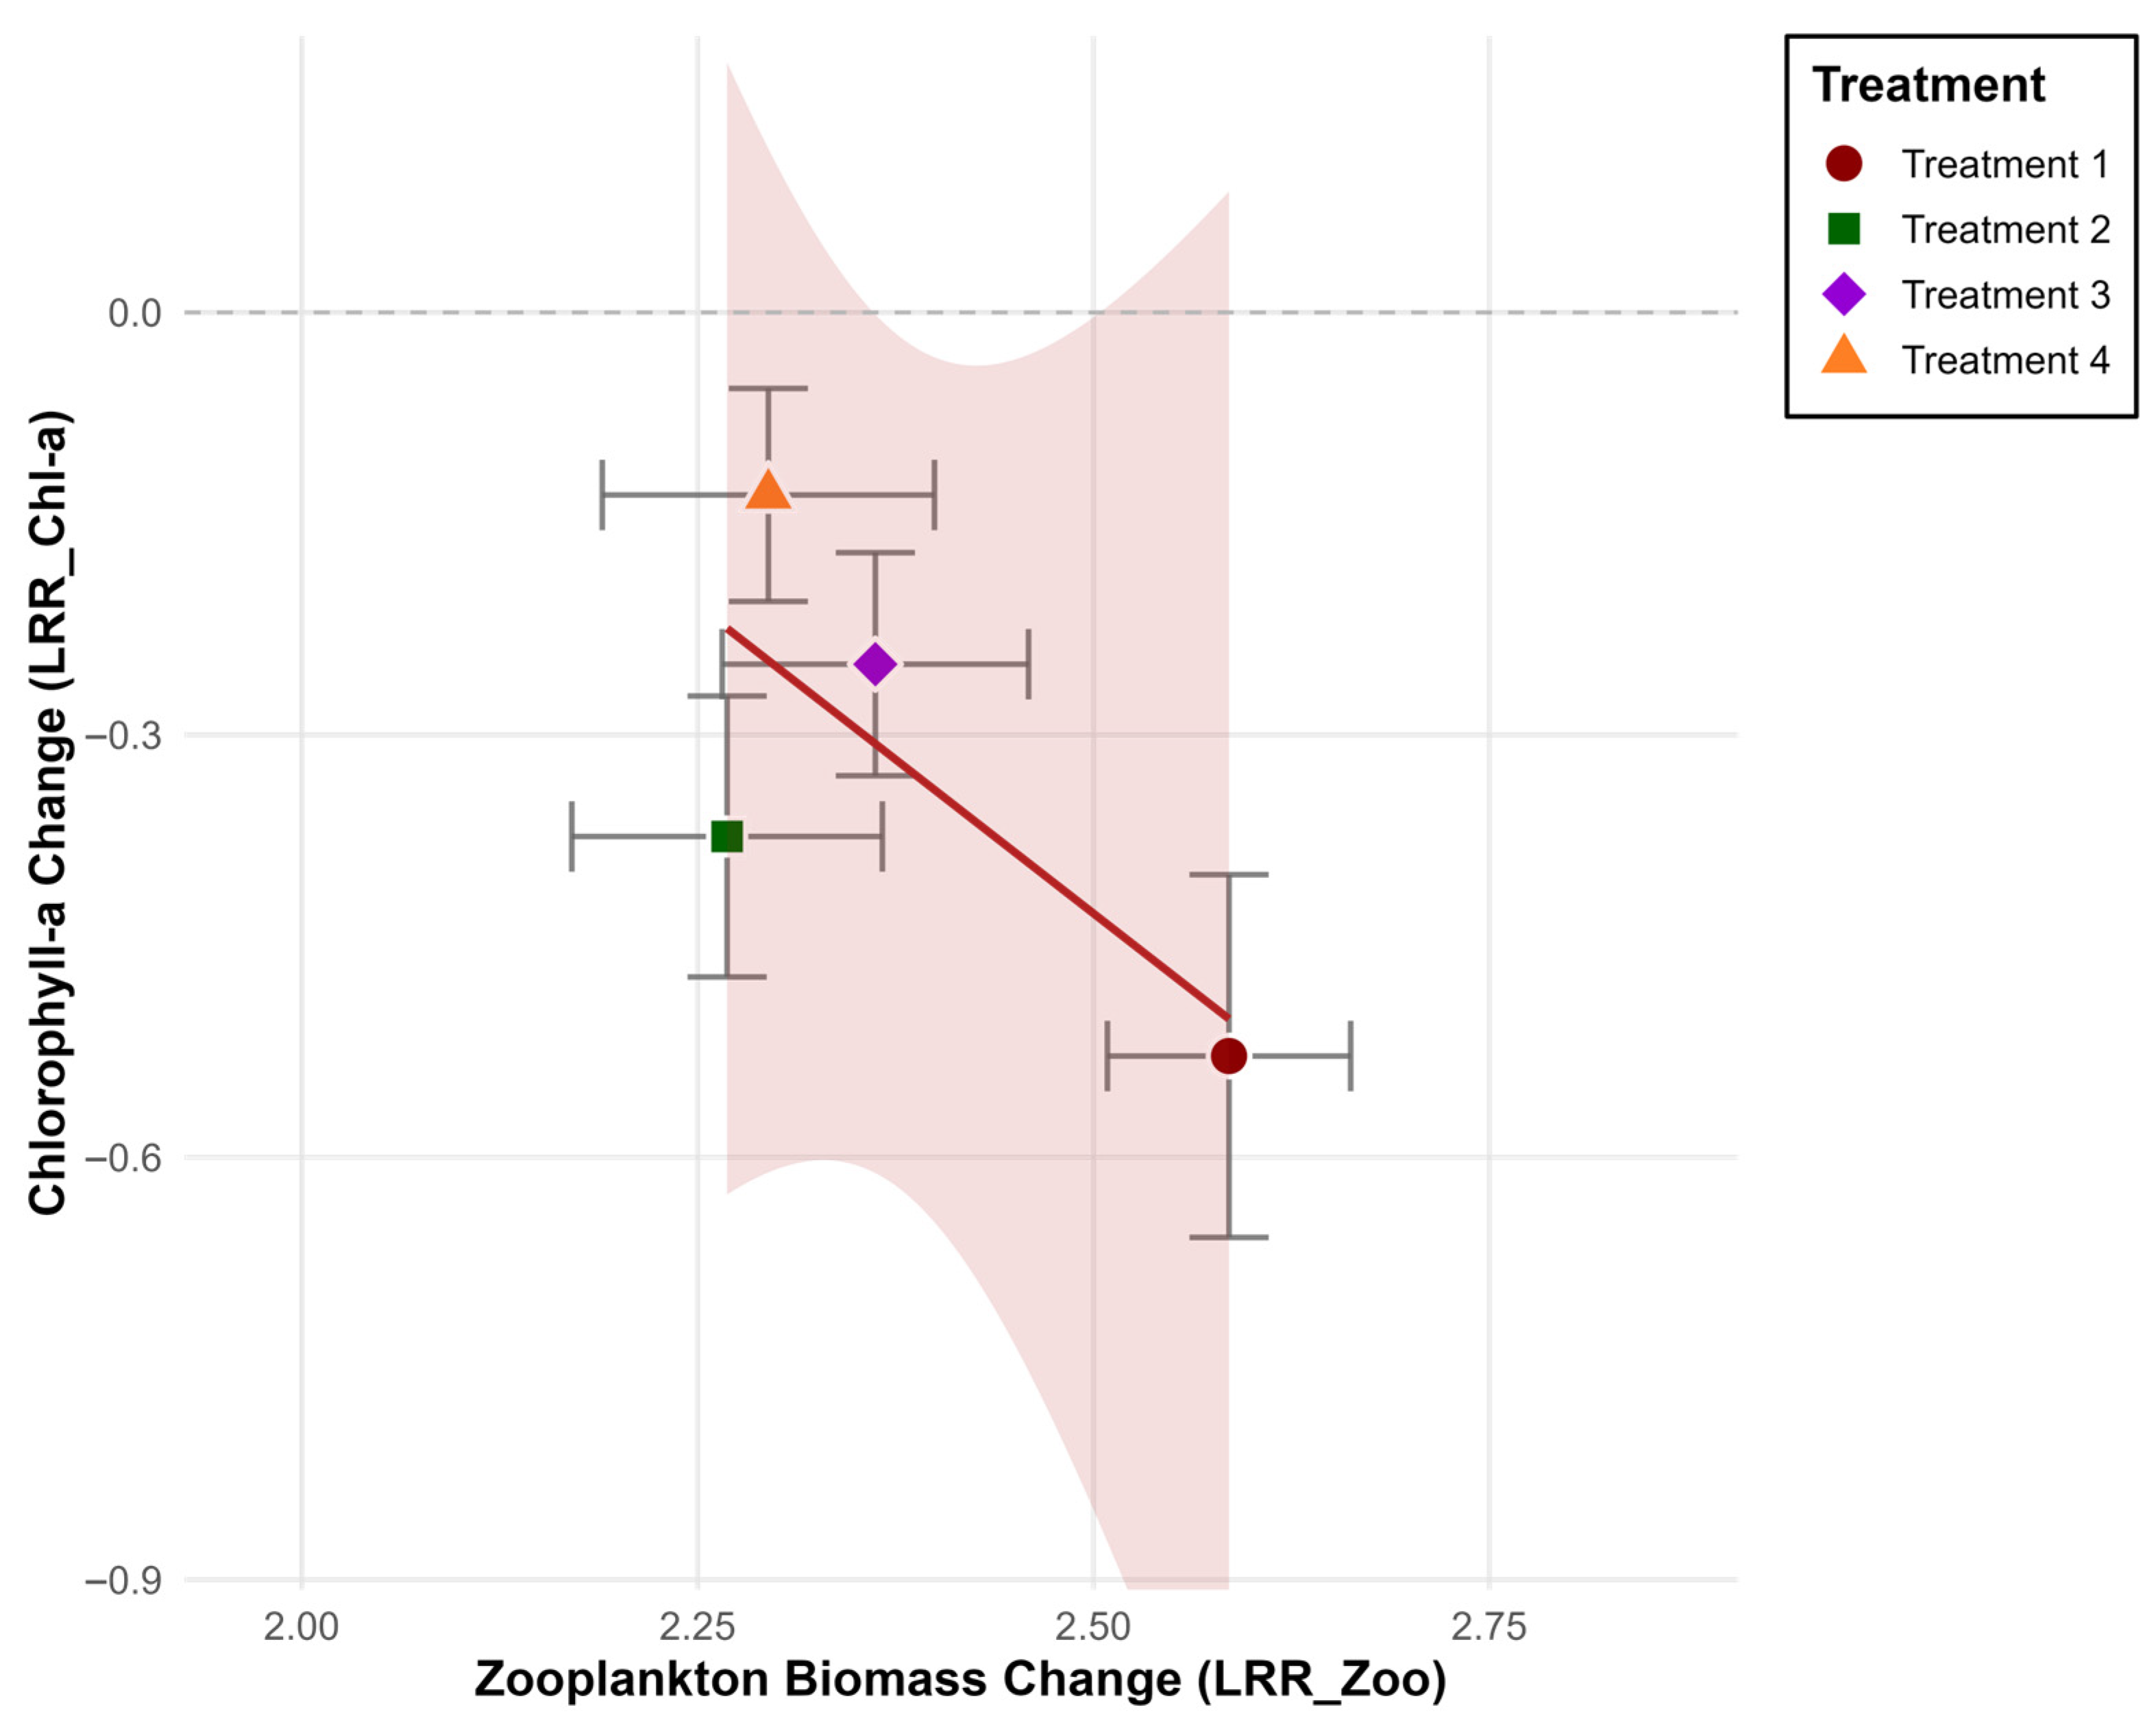
Log response ratios (LRRs) for zooplankton (x-axis) and producer (y-axis) biomass across predator treatments were visualized using a scatterplot (Figure 8).
All treatments exhibited positive LRR_Zoo values and negative LRR_Chl-a values. Treatment 1 showed the largest decrease in producer biomass, based on Chl-a concentrations. Treatment 2 and Treatment 3 showed similar intermediate reductions while Treatment 4 showed the smallest decrease (Figure 8). The magnitude of zooplankton biomass increase was similar across treatments. All points fell within the regression confidence band, indicating a consistent linear relationship between the two response variables.
A linear regression was performed to examine the relationship between zooplankton biomass changes (LRR_Zoo) and producer biomass changes (inferred from Chl-a concentrations; LRR_Chl-a) across predator treatments. The model estimated a negative slope (−0.875 ± 0.564   S E ) , indicating a negative trend between the variables. However, this relationships was not statistically significant (t = −1.552, p-value = 0.261). The model explained 32% of the variation in Chl-a concentration responses (adjusted R 2 = 0.32 ) .
Contrast analysis showed no significant difference in zooplankton biomass between the mixed predator treatment and the average of single predator treatments (contrast = −0.11; 95% CI: −0.23 to 0.01). By contrast, Chl-a concentrations were significantly higher in the mixed treatment (contrast = 0.25; 95% CI: 0.16 to 0.35).

4. Discussion

Predator–prey interactions are fundamental biological interactions that shape the structure and function of aquatic ecosystems, influencing biodiversity, species fitness, energy flow and nutrient dynamics [3,5]. The strength and nature of the interaction between predators and their prey are, however, complex and affected by, amongst others, physicochemical (such as temperature, turbidity, and oxygen concentration) and biological variables such as prey type, prey behaviour and size and availability [73,74]. Predator diversity has been suggested to significantly mediate the outcome of predator–prey interactions in aquatic systems [13,14,75,76].
A short term mesocosm study was employed to assess the role of predatory diversity in mediating the interactions between predators and prey and the ecological consequences of these interactions on the plankton community within a temporarily open/closed South African estuary. Mesocosm experiments provide a controlled framework for studying complex ecological interactions, bridging the gap between large-scale field studies and laboratory based experiments [44,77,78,79]. Critics have raised concerns that mesocosms may oversimplify the complexity of natural ecosystems, limiting the generalizability of results [44,80]. Species composition, size structure, and trophic interactions are often fixed, so experimental manipulations typically occur within established biological boundaries [81,82]. Local environmental conditions (like in the Kasouga estuary), such as salinity, nutrient levels and community composition strongly influence trophic dynamics, making it difficult to extrapolate results [34,35,82]. Additionally, mesocosm experiments are typically short-term, limiting their ability to capture long-term ecological dynamics or temporal variability [78,83]. Nonetheless, when designed using system-specific traits and conditions, mesocosms remain an invaluable tool for ecological research, offering controlled environments to test hypotheses that would be difficult or impossible to study in the field [44,78,79,83].
Results indicate that treatment had a significant effect on total Chl-a concentrations during the mesocosm study. Although some physiochemical variables changed significantly over time, these shifts were consistent across treatments and variables, as indicated by the non-significant interaction effects (Treatment × Day). The absence of any significant treatment effects for the selected physicochemical variables (p-value < 0.05 in all cases) suggests that the bottom-up control (resource availability) of primary production can be excluded as a source of the variability in the various treatments. Indeed, in the absence of zooplankton (Control), the total Chl-a concentration increased over the duration of the study and were significantly higher than in the treatments (p-value < 0.05).
Treatment 1 demonstrated a significant decline in Chl-a concentrations likely due to increased grazing pressure exerted by the elevated zooplankton abundances and biomass (Figure 3). This validates classic top-down control of a plankton food web [1,3,76]. By contrast, the presence of predators, dampened the decrease in total Chl-a concentrations (Figure 3) which likely reflected the effects of predation in reducing grazing pressure of the zooplankton, supporting the expectations of a trophic cascade [1,3,84].
There were no significant differences in the total zooplankton abundances and biomass in the different predator treatments (Figure 4 and Figure 5). The lack of any significant difference in the mixed predator treatment suggests the two predators considered act independently of one another. The absence of any difference may reflect trophic redundancy, where multiple predators exert similar pressures on the same prey [85,86]. The high degree of similarity in the zooplankton community composition in Treatments 2 and 3 further points to a lack of prey selection by the two predators (Figure 7). Field studies have showed that both M. wooldridgei and R. holubi can be considered as generalist zooplankton predators [27,87]. Trophic redundancy can enhance ecosystem stability and create stability in ecosystems, by preventing phase shifts to less productive states [86]. Sanders, Thébault, Kehoe and Frank van Veen [85] further emphasized that trophic redundancy can buffer ecosystems against extinction cascades, highlighting the critical role of diverse predator guilds in maintaining ecological stability amid environmental stressors. It is worth noting, however, that the duration of the mesocosm study may not have been sufficient for all the diversity effects to manifest in the different treatments.
While zooplankton responses were broadly consistent across predator treatments, variation in phytoplankton outcomes suggests that predator identity or predator–predator interactions may have influenced the strength of the cascading effects. Such patterns are consistent with mechanisms like intraguild predation, omnivory or behavioural interference [75,88,89,90]. The dual log-response ratio (LLR) plot (Figure 8) shows a general top-down pattern, with increased zooplankton biomass associated with reduced phytoplankton (inferred from Chl-a concentrations), consistent with predator-mediated trophic cascades observed in planktonic systems [91]. Although the regression between LRR_Zoo and LLR_Chl-a was not statistically significant, the negative slope aligns with expectations of top-down control [92]. All treatments exhibited this tendency, with data points falling within the model’s confidence band, indicating generally consistent but variable responses [93]. The strongest phytoplankton reduction occurred in Treatment 1, while the weakest was observed in the mixed-predator treatment. Contrast analysis further showed that phytoplankton concentrations were significantly higher in the mixed treatment than predicted from the average of single-predator treatments, potentially reflecting non-additive or compensatory interactions that weakened the cascade [94,95]. However, overlapping error bars and limited replication warrant cautious interpretation.
The ratio of small (<5 μm) to large (>5 μm) phytoplankton cells was highest in the treatment characterized by the absence of predators and elevated zooplankton abundance and biomass (Figure 6). Numerous studies have demonstrated that copepods preferentially consume particles in the nano-size (2–20 μm) class suggesting that the predominance of small cells in the treatment reflects the grazing activities of zooplankton [96,97,98]. By contrast, in the predation treatments, the ratios were similar and indeed comparable to the Control. This result is in contrast to Atkinson, et al. [99] which suggested that an absence of predation fosters a balanced distribution of phytoplankton size classes, promoting effective nutrient cycling. The shift towards smaller phytoplankton in the absence of predators is likely to have far reaching effects for the plankton community since smaller cells may be less accessible to larger grazers which ultimately may create a bottleneck in energy transfer through the food chain, potentially limiting the efficiency of carbon transfer to the higher trophic levels [96,97,98,100,101,102].

5. Conclusions

This study demonstrated that predator diversity did not influence the outcome of predator–prey interactions in a shallow water ecosystem. The hypothesis that increased predator diversity leads to more complex plankton dynamics was, therefore, rejected. Nonetheless, the presence of predators did not contribute to the establishment of a trophic cascade and indirectly, contributed to the stability of the food web within the mesocosms. The main findings of the study should, however, be viewed with caution. The limited number of predator types, prey species and simple food web, coupled with the short duration of the experiments, may not have fully captured the range of interactions and dynamics present in natural systems. In more complex webs, higher predator diversity can weaken these effects due to intraguild predation, leading to elevated herbivore densities and reduced plant biomass [75,103]. These intraguild effects can significantly influence prey survival [12]. Future research should explore how the effects of additional predator species or different zooplankton prey influence the outcome of predator–prey interactions. Furthermore, investigating how varying environmental conditions influence these interactions would enhance our understanding of the importance of predatory diversity in mediating the strength of the interactions between predators and prey, especially in the context of climate change.

Author Contributions

Conceptualisation, R.S.F. and W.F., formal analysis R.S.F. and W.F., resources W.F., data curation R.S.F., writing R.S.F. and W.F., review and edition R.S.F. and W.F., funding acquisition W.F. All authors have read and agreed to the published version of the manuscript.

Funding

This work was funded by a Joint Research Council (JRC) grant awarded to PW Froneman by Rhodes University, grant number 6621.

Institutional Review Board Statement

All necessary permits for collection and experimentation were acquired from the department of Agriculture, Forestry and Fisheries, Republic of South Africa (permit reference number: RES2021/46).

Data Availability Statement

Data are available on request from the corresponding author.

Acknowledgments

The authors would like to thank Rhodes University for providing the facilities to conduct the study.

Conflicts of Interest

The authors declare no competing financial interests or personal relationships that could have influenced the work reported in this paper.

Appendix A

Table A1. Experimental mesocosm setup for assessing predator effects on estuarine plankton Communities. Three replicate mesocosms were established for each of the four treatments (T1–T4) and a control. Control: Estuary water filtered through an 80 μm filter to remove all metazoans, retaining only phytoplankton. Treatment 1 (T1): Estuary water was filtered through 1000 μm filter to exclude larger predatory plankton, leaving only zooplankton. Treatment 2 (T2): Estuary water was filtered through 1000 μm filter with the addition of 10 adult Mesopodopsis wooldrigei (mysid) as the sole top predator. Treatment 3 (T3): Estuary water was filtered through 1000 μm filter with the addition of 10 juvenile Rhabdosargus holubi (fish). Treatment 4 (T4): Estuary water was filtered through 1000 μm filter with the addition of 5 Mesopodopsis wooldrigei and 5 Rhabdosargus holubi to examine the combined effects of these predator species.
TreatmentManipulation
ControlEstuary water filtered through 80 μm filter
T1Estuary water filtered through 1000 μm filter
T2Estuary water filtered through 1000 μm filter
10 adult, Mesopodopsis wooldrigei
T3Estuary water filtered through 1000 μm filter
10 juvenile, Rhabdosargus holubi
T4Estuary water filtered through 1000 μm filter
5 Mesopodopsis wooldrigei
5 Rhabdosargus holubi
Table A2. Dunn’s test with Benjamini–Hochberg correction of pairwise comparisons of the ratio of <5 μm to >5 μm phytoplankton size classes.
ComparisonsZ-ValueUnadjusted p-ValueAdjusted p-ValueSignificance
Control vs. T1−2.0410.04120.103Not significant
Control vs. T20.7270.46710.778Not significant
T1 vs. T22.7690.00560.028Significant
Control vs. T31.2500.21110.422Not significant
T1 vs. T33.2920.00100.001Significant
T2 vs. T30.5230.60090.668Not significant
Control vs. T40.6700.50290.718Not significant
T1 vs. T42.7110.00670.022Significant
T2 vs. T4−0.0570.95420.954Not significant
T3 vs. T4−0.5810.56150.702Not significant
Table A3. Log-response ratios (LRRs) of zooplankton (herbivores) and Chl-a (producer) biomass for each predator treatment relative to the control.
TreatmentLRR_ZooDirectionLRR Chl-aDirection
Treatment 12.586Increase−0.528Decrease
Treatment 22.269Increase−0.372Decrease
Treatment 32.362Increase−0.250Decrease
Treatment 42.295Increase−0.130Decrease

References

  1. Paine, R.T. Food webs: Linkage, interaction strength and community infrastructure. J. Anim. Ecol. 1980, 49, 667–685. [Google Scholar] [CrossRef]
  2. Hammerschlag, N.; Schmitz, O.J.; Flecker, A.S.; Lafferty, K.D.; Sih, A.; Atwood, T.B.; Gallagher, A.J.; Irschick, D.J.; Skubel, R.; Cooke, S.J. Ecosystem function and services of aquatic predators in the Anthropocene. Trends Ecol. Evol. 2019, 34, 369–383. [Google Scholar] [CrossRef] [PubMed]
  3. Carpenter, S.R.; Kitchell, J.F.; Hodgson, J.R. Cascading trophic interactions and lake productivity. BioScience 1985, 35, 634–639. [Google Scholar] [CrossRef]
  4. Schmitz, O.J.; Grabowski, J.H.; Peckarsky, B.L.; Preisser, E.L.; Trussell, G.C.; Vonesh, J.R. From individuals to ecosystem function: Toward an integration of evolutionary and ecosystem ecology. Ecology 2008, 89, 2436–2445. [Google Scholar] [CrossRef]
  5. Beauchamp, D.A.; Wahl, D.; Johnson, B.M. Predator–prey interactions. In Analysis and Interpretation of Freshwater Fisheries Data; American Fisheries Society: Bethesda, MD, USA, 2007; pp. 765–842. [Google Scholar]
  6. Miller, T.J.; Crowder, L.B.; Rice, J.A.; Marschall, E.A. Larval size and recruitment mechanisms in fishes: Toward a conceptual framework. Can. J. Fish. Aquat. Sci. 1988, 45, 1657–1670. [Google Scholar] [CrossRef]
  7. Dalton, C.M.; Tracy, K.E.; Hairston, N.G., Jr.; Flecker, A.S. Fasting or fear: Disentangling the roles of predation risk and food deprivation in the nitrogen metabolism of consumers. Ecology 2018, 99, 681–689. [Google Scholar] [CrossRef]
  8. Guariento, R.D.; Luttbeg, B.; Carneiro, L.S.; Caliman, A. Prey adaptive behaviour under predation risk modify stoichiometry predictions of predator-induced stress paradigms. Funct. Ecol. 2018, 32, 1631–1643. [Google Scholar] [CrossRef]
  9. McIntyre, P.B.; Jones, L.E.; Flecker, A.S.; Vanni, M.J. Fish extinctions alter nutrient recycling in tropical freshwaters. Proc. Natl. Acad. Sci. USA 2007, 104, 4461–4466. [Google Scholar] [CrossRef]
  10. Allgeier, J.E.; Valdivia, A.; Cox, C.; Layman, C.A. Fishing down nutrients on coral reefs. Nat. Commun. 2016, 7, 12461. [Google Scholar] [CrossRef]
  11. Hammerschlag, N.; Barley, S.C.; Irschick, D.J.; Meeuwig, J.J.; Nelson, E.R.; Meekan, M.G. Predator declines and morphological changes in prey: Evidence from coral reefs depleted of sharks. Mar. Ecol. Prog. Ser. 2018, 586, 127–139. [Google Scholar] [CrossRef]
  12. Griffen, B.D. Detecting emergent effects of multiple predator species. Oecologia 2006, 148, 702–709. [Google Scholar] [CrossRef]
  13. Sih, A.; Englund, G.; Wooster, D. Emergent impacts of multiple predators on prey. Trends Ecol. Evol. 1998, 13, 350–355. [Google Scholar] [CrossRef]
  14. Ives, A.R.; Cardinale, B.J.; Snyder, W.E. A synthesis of subdisciplines: Predator–prey interactions, and biodiversity and ecosystem functioning. Ecol. Lett. 2005, 8, 102–116. [Google Scholar] [CrossRef]
  15. Polis, G.A.; Holt, R.D. Intraguild predation: The dynamics of complex trophic interactions. Trends Ecol. Evol. 1992, 7, 151–154. [Google Scholar] [CrossRef]
  16. McCoy, M.W.; Stier, A.C.; Osenberg, C.W. Emergent effects of multiple predators on prey survival: The importance of depletion and the functional response. Ecol. Lett. 2012, 15, 1449–1456. [Google Scholar] [CrossRef] [PubMed]
  17. Vance-Chalcraft, H.D.; Soluk, D.A. Multiple predator effects result in risk reduction for prey across multiple prey densities. Oecologia 2005, 144, 472–480. [Google Scholar] [CrossRef] [PubMed]
  18. Schmitz, O.J. Behavior of predators and prey and links with population-level processes. In Ecology of Predator-Prey Interactions; Oxford Academic: New York, NY, USA, 2005; Volume 256. [Google Scholar]
  19. Power, M.E. Top-down and bottom-up forces in food webs: Do plants have primacy. Ecology 1992, 73, 733–746. [Google Scholar] [CrossRef]
  20. Kemp, J.; Froneman, P. Recruitment of ichthyoplankton and macrozooplankton during overtopping events into a temporarily open/closed southern African estuary. Estuar. Coast. Shelf Sci. 2004, 61, 529–537. [Google Scholar] [CrossRef]
  21. Strydom, N.A. Patterns in larval fish diversity, abundance, and distribution in temperate South African estuaries. Estuaries Coasts 2015, 38, 268–284. [Google Scholar] [CrossRef]
  22. James, N.C.; Leslie, T.D.; Potts, W.M.; Whitfield, A.K.; Rajkaran, A. The importance of different juvenile habitats as nursery areas for a ubiquitous estuarine-dependent marine fish species. Estuar. Coast. Shelf Sci. 2019, 226, 106270. [Google Scholar] [CrossRef]
  23. Wasserman, R.J.; Noyon, M.; Avery, T.S.; Froneman, P.W. Trophic level stability-inducing effects of predaceous early juvenile fish in an estuarine mesocosm study. PLoS ONE 2013, 8, e61019. [Google Scholar] [CrossRef]
  24. Morozov, A.; Arashkevich, E.; Nikishina, A.; Solovyev, K. Nutrient-rich plankton communities stabilized via predator—Prey interactions: Revisiting the role of vertical heterogeneity. Math. Med. Biol. A J. IMA 2011, 28, 185–215. [Google Scholar] [CrossRef]
  25. Johnson, J.B.; Belk, M.C. Predators as agents of selection and diversification. Diversity 2020, 12, 415. [Google Scholar] [CrossRef]
  26. Turner, A.M.; Mittelbach, G.G. Predator avoidance and community structure: Interactions among piscivores, planktivores, and plankton. Ecology 1990, 71, 2241–2254. [Google Scholar] [CrossRef]
  27. Froneman, P. Feeding ecology of the mysid, Mesopodopsis wooldridgei, in a temperate estuary along the eastern seaboard of South Africa. J. Plankton Res. 2001, 23, 999–1008. [Google Scholar] [CrossRef]
  28. Wasserman, R.J.; Strydom, N.A. The importance of estuary head waters as nursery areas for young estuary- and marine-spawned fishes in temperate South Africa. Estuar. Coast. Shelf Sci. 2011, 94, 56–67. [Google Scholar] [CrossRef]
  29. Blaber, S.J. The population structure and growth of juvenile Rhabdosargus holubi (Steindachner)(Teleostei: Sparidae) in a closed estuary. J. Fish Biol. 1974, 6, 455–460. [Google Scholar] [CrossRef]
  30. De Wet, P.; Marais, J. Stomach content analysis of juvenile Cape stumpnose Rhabdosargus holubi in the Swartkops Estuary, South Africa. S. Afr. J. Mar. Sci. 1990, 9, 127–133. [Google Scholar] [CrossRef]
  31. Froneman, P.W. Predator Diversity Does Not Contribute to Increased Prey Risk: Evidence from a Mesocosm Study. Diversity 2022, 14, 584. [Google Scholar] [CrossRef]
  32. Henninger, T.; Froneman, P.; Hodgson, A. The population dynamics of the estuarine isopod Exosphaeroma hylocoetes (Barnard, 1940) within three temporarily open/closed southern African estuaries. Afr. Zool. 2008, 43, 202–217. [Google Scholar] [CrossRef]
  33. Froneman, P. The importance of phytoplankton size in mediating trophic interactions within the plankton of a southern African estuary. Estuar. Coast. Shelf Sci. 2006, 70, 693–700. [Google Scholar] [CrossRef]
  34. Froneman, P. Seasonal changes in selected physico-chemical and biological variables in the temporarily open/closed Kasouga estuary, Eastern Cape, South Africa. Afr. J. Aquat. Sci. 2002, 27, 117–123. [Google Scholar] [CrossRef]
  35. Froneman, P.; Henninger, T. The influence of prolonged mouth closure on selected components of the hyperbenthos in the littoral zone of the temporarily open/closed Kasouga Estuary, South Africa. Estuar. Coast. Shelf Sci. 2009, 83, 326–332. [Google Scholar] [CrossRef]
  36. Wittmann, K.J. Morphogeographic variations in the genus Mesopodopsis Czerniavsky with descriptions of three new species (Crustacea, Mysidacea). Hydrobiologia 1992, 241, 71–89. [Google Scholar] [CrossRef]
  37. Steindachner, F. Ichthyologische Beiträge (X). In Sitzungsberichte der Kaiserlichen Akademie der Wissenschaften. Mathematisch-Naturwissenschaftliche Classe; Kaiserlichen Akademie der Wissenschaften: Wien, Austria, 1881. [Google Scholar]
  38. Wooldridge, T. Ecology of beach and surf-zone mysid shrimps in the Eastern Cape, South Africa. In Proceedings of the Sandy Beaches as Ecosystems: Based on the Proceedings of the First International Symposium on Sandy Beaches, Port Elizabeth, South Africa, 17–21 January 1983; pp. 449–460. [Google Scholar]
  39. Jerling, H.; Wooldridge, T. Plankton distribution and abundance in the Sundays River estuary, South Africa, with comments on potential feeding interactions. S. Afr. J. Mar. Sci. 1995, 15, 169–184. [Google Scholar] [CrossRef]
  40. Blaber, S. Population size and mortality of juveniles of the marine teleost Rhabdosargus holubi (Pisces: Sparidae) in a closed estuary. Mar. Biol. 1973, 21, 219–225. [Google Scholar] [CrossRef]
  41. Whitfield, A.; Paterson, A.; Bok, A.; Kok, H. A comparison of the ichthyofaunas in two permanently open eastern Cape estuaries. Afr. Zool. 1994, 29, 175–185. [Google Scholar] [CrossRef]
  42. Carassou, L.; Whitfield, A.; Bergamino, L.; Moyo, S.; Richoux, N. Trophic dynamics of the cape stumpnose (Rhabdosargus holubi, Sparidae) across three adjacent aquatic habitats. Estuaries Coasts 2016, 39, 1221–1233. [Google Scholar] [CrossRef]
  43. Blaber, S.J. Temperature and salinity tolerance of juvenile Rhabdosargus holubi [Steindachner (Teleostei: Sparidae)]. J. Fish Biol. 1973, 5, 593–598. [Google Scholar] [CrossRef]
  44. Spivak, A.C.; Vanni, M.J.; Mette, E.M. Moving on up: Can results from simple aquatic mesocosm experiments be applied across broad spatial scales? Freshw. Biol. 2011, 56, 279–291. [Google Scholar] [CrossRef]
  45. Holm-Hansen, O.; Riemann, B. Chlorophyll a determination: Improvements in methodology. Oikos 1978, 30, 438–447. [Google Scholar] [CrossRef]
  46. Broglio, E.; Saiz, E.; Calbet, A.; Trepat, I.; Alcaraz, M. Trophic impact and prey selection by crustacean zooplankton on the microbial communities of an oligotrophic coastal area (NW Mediterranean Sea). Aquat. Microb. Ecol. 2004, 35, 65–78. [Google Scholar] [CrossRef]
  47. Boltovskoy, D. South Atlantic Zooplankton; Backhuys Publishers: Leiden, The Netherlands, 1999. [Google Scholar]
  48. Girden, E.R. ANOVA: Repeated Measures; Sage Publications, Inc.: Thousand Oaks, CA, USA, 1992. [Google Scholar]
  49. Keselman, H.; Algina, J.; Kowalchuk, R.K. The analysis of repeated measures designs: A review. Br. J. Math. Stat. Psychol. 2001, 54, 1–20. [Google Scholar] [CrossRef]
  50. Singmann, H.; Bolker, B.; Westfall, J.; Aust, F.; Ben-Shachar, M.; Højsgaard, S.; Fox, J.; Lawrence, M.; Mertens, U.; Love, J. Package ‘afex’. 2015. Available online: https://github.Com/singmann/afex (accessed on 7 August 2025).
  51. Abdi, H. The greenhouse-geisser correction. Encycl. Res. Des. 2010, 1, 544–548. [Google Scholar]
  52. Lenth, R.V. emmeans: Estimated Marginal Means, aka Least-Squares Means. 2024. Available online: https://cran.r-project.org/web/packages/emmeans/emmeans.pdf (accessed on 7 August 2025).
  53. Lenth, R.; Lenth, M.R. Package ‘lsmeans’. Am. Stat. 2018, 34, 216–221. [Google Scholar]
  54. Kruskal, W.H.; Wallis, W.A. Use of ranks in one-criterion variance analysis. J. Am. Stat. Assoc. 1952, 47, 583–621. [Google Scholar] [CrossRef]
  55. Benjamini, Y.; Hochberg, Y. Controlling the false discovery rate: A practical and powerful approach to multiple testing. J. R. Stat. Soc. Ser. B (Methodol.) 1995, 57, 289–300. [Google Scholar] [CrossRef]
  56. Dunn, O.J. Multiple comparisons using rank sums. Technometrics 1964, 6, 241–252. [Google Scholar] [CrossRef]
  57. Dinno, A. Nonparametric pairwise multiple comparisons in independent groups using Dunn’s test. Stata J. 2015, 15, 292–300. [Google Scholar] [CrossRef]
  58. Anderson, M. PERMANOVA+ for PRIMER: Guide to Software and Statistical Methods; Primer-E Limited: Auckland, New Zealand, 2008. [Google Scholar]
  59. Hedges, L.V.; Gurevitch, J.; Curtis, P.S. The meta-analysis of response ratios in experimental ecology. Ecology 1999, 80, 1150–1156. [Google Scholar] [CrossRef]
  60. Viechtbauer, W. Conducting meta-analyses in R with the metafor package. J. Stat. Softw. 2010, 36, 1–48. [Google Scholar] [CrossRef]
  61. Su, H.; Feng, Y.; Chen, J.; Chen, J.; Ma, S.; Fang, J.; Xie, P. Determinants of trophic cascade strength in freshwater ecosystems: A global analysis. Ecology 2021, 102, e03370. [Google Scholar] [CrossRef]
  62. Osenberg, C.W.; Sarnelle, O.; Cooper, S.D.; Holt, R.D. Resolving ecological questions through meta-analysis: Goals, metrics, and models. Ecology 1999, 80, 1105–1117. [Google Scholar] [CrossRef]
  63. Gurevitch, J.; Hedges, L.V. Statistical issues in ecological meta-analyses. Ecology 1999, 80, 1142–1149. [Google Scholar] [CrossRef]
  64. R Core Team. R: A Language and Environment for Statistical Computing; R Foundation for Statistical Computing: Vienna, Austria, 2024. [Google Scholar]
  65. Wickham, H. ggplot2: Elegant Graphics for Data Analysis; Springer: New York, NY, USA, 2016. [Google Scholar]
  66. Wickham, H.; François, R.; Henry, L.; Müller, K.; Vaughan, D. dplyr: A Grammar of Data Manipulation, R package version 1.1.4; Springer: New York, NY, USA, 2023. [Google Scholar]
  67. Wickham, H.; Vaugh, D.; Girlich, M. tidyr: Tidy Messy Data, 1.3.1; CRAN; 2024. Available online: https://CRAN.R-project.org/package=tidyr (accessed on 7 August 2025).
  68. Fox, J.; Weisberg, S. An R Companion to Applied Regression; Sage Publications: Thousand Oaks, CA, USA, 2019. [Google Scholar]
  69. Ogle, D.H.; Doll, J.C.; Powell, W.A.; Dinno, A. FSA: Simple Fisheries Stock Assessment Methods, 0.9.5; CRAN; 2023. Available online: https://CRAN.R-project.org/package=FSA (accessed on 7 August 2025).
  70. Dinno, A. dunn.test: Dunn’s Test of Multiple Comparisons Using Rank Sums, 1.3.6; CRAN; 2024. Available online: https://CRAN.R-project.org/package=dunn.test (accessed on 7 August 2025).
  71. Oksanen, J.; Simpson, G.L.; Blanchet, F.G.; Kindt, R.; Legendre, P.; Minchin, P.R.; O’Hara, R.B.; Solymos, P.; Henry, M.; Stevens, H.; et al. vegan: Community Ecology Package, 2.6-6.1; CRAN; 2024. Available online: https://CRAN.R-project.org/package=vegan (accessed on 7 August 2025).
  72. Slowikowski, K. ggrepel: Automatically Position Non-Overlapping Text Labels with ‘ggplot2’, 0.9.5; CRAN; 2024. Available online: https://www.bcgsc.ca/downloads/morinlab/UMontreal_MLLT/renv/library/R-4.1/x86_64-pc-linux-gnu/ggrepel/html/00Index.html (accessed on 7 August 2025).
  73. Duffy, J.E. Biodiversity and ecosystem function: The consumer connection. Oikos 2002, 99, 201–219. [Google Scholar] [CrossRef]
  74. Denno, R.F.; Lewis, D. Predator-prey interactions. In The Princeton Guide to Ecology; Princeton University Press: Princeton, NJ, USA, 2009; pp. 202–212. [Google Scholar]
  75. Finke, D.L.; Denno, R.F. Predator diversity and the functioning of ecosystems: The role of intraguild predation in dampening trophic cascades. Ecol. Lett. 2005, 8, 1299–1306. [Google Scholar] [CrossRef]
  76. Baum, J.K.; Worm, B. Cascading top-down effects of changing oceanic predator abundances. J. Anim. Ecol. 2009, 78, 699–714. [Google Scholar] [CrossRef]
  77. Benton, T.G.; Solan, M.; Travis, J.M.; Sait, S.M. Microcosm experiments can inform global ecological problems. Trends Ecol. Evol. 2007, 22, 516–521. [Google Scholar] [CrossRef]
  78. Stewart, R.I.; Dossena, M.; Bohan, D.A.; Jeppesen, E.; Kordas, R.L.; Ledger, M.E.; Meerhoff, M.; Moss, B.; Mulder, C.; Shurin, J.B. Mesocosm experiments as a tool for ecological climate-change research. Adv. Ecol. Res. 2013, 48, 71–181. [Google Scholar]
  79. Piehler, M.F.; Currin, C.A.; Hall, N.S. Estuarine intertidal sandflat benthic microalgal responses to in situ and mesocosm nitrogen additions. J. Exp. Mar. Biol. Ecol. 2010, 390, 99–105. [Google Scholar] [CrossRef]
  80. Carpenter, S.R. Microcosm experiments have limited relevance for community and ecosystem ecology. Ecology 1996, 77, 677–680. [Google Scholar] [CrossRef]
  81. Petersen, J.E.; Hastings, A. Dimensional approaches to scaling experimental ecosystems: Designing mousetraps to catch elephants. Am. Nat. 2001, 157, 324–333. [Google Scholar] [CrossRef]
  82. Petersen, J.E.; Englund, G. Dimensional approaches to designing better experimental ecosystems: A practitioners guide with examples. Oecologia 2005, 145, 215–223. [Google Scholar] [CrossRef]
  83. Auffan, M.; Tella, M.; Santaella, C.; Brousset, L.; Paillès, C.; Barakat, M.; Espinasse, B.; Artells, E.; Issartel, J.; Masion, A. An adaptable mesocosm platform for performing integrated assessments of nanomaterial risk in complex environmental systems. Sci. Rep. 2014, 4, 5608. [Google Scholar] [CrossRef]
  84. Siegfried, C.A.; Kopache, M.E. Feeding of Neomysis mercedis (Holmes). Biol. Bull. 1980, 159, 193–205. [Google Scholar] [CrossRef]
  85. Sanders, D.; Thébault, E.; Kehoe, R.; van Veen, F.F. Trophic redundancy reduces vulnerability to extinction cascades. Proc. Natl. Acad. Sci. USA 2018, 115, 2419–2424. [Google Scholar] [CrossRef] [PubMed]
  86. Eisaguirre, J.H.; Eisaguirre, J.M.; Davis, K.; Carlson, P.M.; Gaines, S.D.; Caselle, J.E. Trophic redundancy and predator size class structure drive differences in kelp forest ecosystem dynamics. Ecology 2020, 101, e02993. [Google Scholar] [CrossRef]
  87. Whitfield, A.K. Biology and Ecology of Fishes in Southern African Estuaries; J.L.B. Smith Institute of Ichthyology: Grahamstown, South Africa, 1998. [Google Scholar]
  88. Reynolds, P.L.; Bruno, J.F. Multiple predator species alter prey behavior, population growth, and a trophic cascade in a model estuarine food web. Ecol. Monogr. 2013, 83, 119–132. [Google Scholar] [CrossRef]
  89. Johnson, K.D.; Grabowski, J.H.; Smee, D.L. Omnivory dampens trophic cascades in estuarine communities. Mar. Ecol. Prog. Ser. 2014, 507, 197–206. [Google Scholar] [CrossRef]
  90. Tumolo, B.B.; Flinn, M.B. Top-down effects of an invasive omnivore: Detection in long-term monitoring of large-river reservoir chlorophyll-a. Oecologia 2017, 185, 293–303. [Google Scholar] [CrossRef]
  91. Sommer, U. Trophic Cascades in Marine and Freshwater Plankton. Int. Rev. Hydrobiol. 2008, 93, 506–516. [Google Scholar] [CrossRef]
  92. Borer, E.T.; Gruner, D.S. Top-down and bottom-up regulation of communities. In The Princeton Guide to Ecology; Princeton University Press: Princeton, NJ, USA, 2009; pp. 296–304. [Google Scholar]
  93. Jochum, M.; Schneider, F.D.; Crowe, T.P.; Brose, U.; O’Gorman, E.J. Climate-induced changes in bottom-up and top-down processes independently alter a marine ecosystem. Philos. Trans. R. Soc. B Biol. Sci. 2012, 367, 2962–2970. [Google Scholar] [CrossRef]
  94. Otto, S.B.; Berlow, E.L.; Rank, N.E.; Smiley, J.; Brose, U. Predator diversity and identity drive interaction strength and trophic cascades in a food web. Ecology 2008, 89, 134–144. [Google Scholar] [CrossRef]
  95. Griffin, J.N.; Silliman, B.R. Predator size-structure and species identity determine cascading effects in a coastal ecosystem. Ecol. Evol. 2018, 8, 12435–12442. [Google Scholar] [CrossRef] [PubMed]
  96. Guidi, L.; Stemmann, L.; Jackson, G.A.; Ibanez, F.; Claustre, H.; Legendre, L.; Picheral, M.; Gorskya, G. Effects of phytoplankton community on production, size, and export of large aggregates: A world-ocean analysis. Limnol. Oceanogr. 2009, 54, 1951–1963. [Google Scholar] [CrossRef]
  97. Fuchs, H.L.; Franks, P.J. Plankton community properties determined by nutrients and size-selective feeding. Mar. Ecol. Prog. Ser. 2010, 413, 1–15. [Google Scholar] [CrossRef]
  98. Cottingham, K.L. Nutrients and zooplankton as multiple stressors of phytoplankton communities: Evidence from size structure. Limnol. Oceanogr. 1999, 44, 810–827. [Google Scholar] [CrossRef]
  99. Atkinson, C.L.; Capps, K.A.; Rugenski, A.T.; Vanni, M.J. Consumer-driven nutrient dynamics in freshwater ecosystems: From individuals to ecosystems. Biol. Rev. 2017, 92, 2003–2023. [Google Scholar] [CrossRef]
  100. Froneman, P. Seasonal changes in zooplankton biomass and grazing in a temperate estuary, South Africa. Estuar. Coast. Shelf Sci. 2001, 52, 543–553. [Google Scholar] [CrossRef]
  101. Froneman, P. Food web structure in three contrasting estuaries determined using stable isotope (∂ 13C) analysis. Afr. J. Aquat. Sci. 2002, 27, 107–115. [Google Scholar] [CrossRef]
  102. Froneman, P. Trophic cascading in an oligotrophic temperate estuary, South Africa. J. Plankton Res. 2002, 24, 807–816. [Google Scholar] [CrossRef]
  103. Finke, D.L.; Denno, R.F. Predator diversity dampens trophic cascades. Nature 2004, 429, 407–410. [Google Scholar] [CrossRef] [PubMed]
Figure 1. Geographic location of the medium-sized, warm temperate temporarily open/closed Kasouga Estuary, located along the coastline of the Eastern Cape Province of South Africa. The black rectangle indicates the deployment site of the mesocosms (adapted from Wasserman, Noyon, Avery and Froneman [23] and Froneman [31]).
Diversity 17 00591 g001
Figure 2. Temporal trends in physiochemical parameters across treatment groups during the 10-day mesocosm experiment. (A) Salinity, (B) Water temperature, (C) Dissolved Oxygen concentration, (D) Total Nitrogen concentration.
Diversity 17 00591 g002
Figure 3. Temporal changes in total Chlorophyll-a concentrations (μg L−1) in the different treatments during the 10-day mesocosm study. Error bars are standard deviation (n = 3 for each treatment). Experimental setup is outlined in the methods section.
Diversity 17 00591 g003
Figure 4. Temporal changes in total zooplankton abundances (Ind L−1) in the different treatments during the 10-day mesocosm study. Error bars are standard deviation (n = 3 for each treatment). Experimental setup is outlined in the methods section.
Diversity 17 00591 g004
Figure 5. Temporal changes in the total zooplankton biomass (ug dwt L−1) in the different treatments during the 10-day mesocosm study. Error bars are standard deviation (n = 3 for each treatment). Experimental setup is outlined in the methods section.
Diversity 17 00591 g005
Figure 6. Comparison of the ratio of chlorophyll-a concentration in phytoplankton size classes (<5 μm: >5 μm) across experimental treatments during the 10-day mesocosm study. Each point represents an individual replicate. The blue diamond indicates group medians. Details of the experimental setup and treatment structure are provided in the Methods section.
Diversity 17 00591 g006
Figure 7. Non-metric Multidimensional Scaling (NMDS) ordination plot illustrating zooplankton community composition across different treatments during the 10-day mesocosm experiment. The legend distinguishes between treatments: (0) Control, (1) Treatment 1, (2) Treatment 2, (3) Treatment 3, and (4) Treatment 4 (The numbers beside the points indicate sampling days (0, 2, 6, 8, 10)). Each treatment was replicated three times (n = 3). The stress value (0.037) indicates the goodness of fit of the NMDS ordination.
Diversity 17 00591 g007
Figure 8. Log-response rations (LRRs) of zooplankton and chlorophyll-a biomass across predator treatments relative to the control. Points represent treatments; error bars indicate 95% confidence intervals. The red regression line shows the relationship between LRR_Zoo and LRR_Chl-a, with shaded confidence bands. The dotted 1:1 line represents equal change in both variables.
Diversity 17 00591 g008
Disclaimer/Publisher’s Note: The statements, opinions and data contained in all publications are solely those of the individual author(s) and contributor(s) and not of MDPI and/or the editor(s). MDPI and/or the editor(s) disclaim responsibility for any injury to people or property resulting from any ideas, methods, instructions or products referred to in the content.