Article

Post-Fledging Survival, Movement, and Habitat Use of Wood Thrushes in a Suburbanized Landscape

1
Department of Environmental Conservation, University of Massachusetts, 160 Holdsworth Way, Amherst, MA 01003, USA
2
Northern Research Station, USDA Forest Service, University of Massachusetts, Amherst, 201 Holdsworth Hall, Amherst, MA 01003, USA
*
Author to whom correspondence should be addressed.
Diversity 2025, 17(8), 589; https://doi.org/10.3390/d17080589
Submission received: 30 June 2025 / Revised: 14 August 2025 / Accepted: 15 August 2025 / Published: 21 August 2025
(This article belongs to the Special Issue Biodiversity Conservation in Urbanized Ecosystems)

Abstract

Suburban forest patches can have important conservation value for birds. This is a hopeful trend because the extent of urbanization is increasing, many avian populations are declining, and urban areas are where most people interact with wildlife. There is evidence that, despite an increased density of potential predators, the breeding success of birds in urban or suburban forest patches is comparable to that in rural areas. However, extremely limited data exists on the fledgling life stage of birds in urban or suburban areas, even though it is known that the fledgling stage strongly influences population growth rates. We used radio telemetry to look at the survival, movement, and habitat use of fledgling Wood Thrushes (Hylocichla mustelina) originating from nests in suburban forest patches and in larger swaths of rural, undeveloped forests in western Massachusetts. We tracked 168 fledglings over four field seasons and found that survival was similar for rural and suburban fledglings. Fledglings had lower mortality as they aged. Force-fledging and being left outside the nest after radio-tagging had a negative effect on survival, and we developed techniques to minimize its occurrence. We also found that rural fledglings moved farther from their natal nests, at any given age, than suburban fledglings. Fledglings in both suburban and rural sites selected denser understory growth, and the use of non-forested land cover increased as they aged.

1. Introduction

As many bird species experience population decline [1], viable habitats within urban and suburban areas, including forest patches, can be key for conservation [2]. Despite numerous ecological changes occurring with urbanization, including changes in species assemblages [3,4], many bird species have been found to occupy [5,6] and breed in urban or suburban forest patches [7,8,9,10,11]. However, there is a lack of research on the success of birds in these habitats, especially during the post-fledging life stage [12,13,14,15].
Numerous changes that occur with urbanization can alter the ecological and species interactions within and around urban and suburban forest patches [3,4,16]. Habitat loss and fragmentation; altered air temperatures, hydrology, and soil moisture; and increased stream erosion [4] are all characteristic of urbanized landscapes. Species interactions, including competitive interactions [16] and trophic dynamics [17], are also altered. What this means for lower trophic levels and, in particular, for the predation of nesting birds has been the subject of numerous studies and discussions [18,19,20]. Despite these dramatic changes induced by urbanization, it is widely reported that avian nesting success is similar in urban and nonurbanized natural habitat, a phenomenon deemed “the predation paradox” [19]. It posits that, often, in urbanized areas, there are more potential predators for nesting birds and small mammals, as compared to rural areas, yet there is no increase in predation rates [7,18,19,21,22,23]. Despite more than a decade of research on urbanization and avian reproductive success, since the predation paradox was first described, consensus on both the patterns and the mechanisms remains elusive [13].
For birds, the predation paradox has primarily been investigated during the nesting life stage, and research on the consequences of altered urban trophic dynamics for birds in the post-fledging life stage (hereafter, “fledglings”) has been minimal [13,23,24]. While young successfully fledging from the nest is considered a “success” in most studies of avian nest survival, a bird must also survive the weeks or months after it leaves the nest before it can become a (potentially) breeding adult. This life stage plays an important demographic role, possibly even more than that of nest survival [25,26]. The rate of mortality soon after fledging can also be higher than mortality during the nestling stage [9,27]. Despite its demographic importance, the post-fledging life stage, during which time the young birds of many passerine species become increasingly mobile and independent, is understudied compared to other life stages [26], particularly in urbanized areas [14]. Little information exists about the survival, movement, or habitat use of fledgling birds in urbanized areas [9,12,26].
Key differences between the nesting and post-fledging life stages warrant investigation of predation during the post-fledging period. When nestling birds leave the nest and become fledglings, they are much more mobile and, theoretically, may not stay within forest patches. Therefore, they may experience new sources of mortality, such as from car and window strikes [9]. Predation and survival can be markedly different between the nesting and post-fledging life stages [28,29,30]. Thus, relationships between predation and survival in the fledgling stage cannot necessarily be predicted from those of the nesting phase.
Our previous work investigated the predation paradox in the Wood Thrush (Hylocichla mustelina), a declining, forest-nesting, neotropical migrant [31]. We found support for the predation paradox phenomenon when comparing nest survival and predation between suburban forest patches and a larger, contiguous forested site in western Massachusetts. However, whether these patterns hold true for the post-fledging life stage is unknown. There is some evidence that Wood Thrushes may experience local population decline associated with urbanized areas, even while enjoying high nest success [12]. While a handful of studies have looked at the survival of post-fledging Wood Thrushes, most have been in intact or managed forest habitats [30,32,33,34,35] and a few in agricultural landscapes [24,36]. A few studies have investigated post-fledging survival of the Wood Thrush in suburban or urban areas [9,10,11], but no study that we know of has compared suburban and rural fledgling survival of this species. Of particular interest are differences in dispersal movements between rural and suburban fledglings. Fledglings in forested landscapes have been documented frequently dispersing over 1.5 k [32,33,35]. If fledglings in suburban landscapes exhibited these same dispersal movements, it may result in them encountering different hazards, such as roads and predators, than their rural counterparts. Alternatively, it raises the question of whether birds in suburban conservation areas might constrain their movements to smaller areas to remain within a suburban forest patch, as well as how that might impact survival. These questions are key to understanding the value of suburban forest patches for and the impacts of urbanization on Wood Thrushes and can provide valuable information on suburban predator–prey dynamics, in general.
Given the uncertainty about the effects of urbanization on fledging birds, we aimed to quantify whether fledgling Wood Thrush survival in western Massachusetts is influenced by urbanization and how fledglings cope with small urban habitat patches, since their movements are known to be extensive in forested landscapes [10,32,33,35]. We tracked radio-tagged fledglings in both suburban forest fragments and larger swaths of rural, undeveloped forests, and we analyzed their survival and movement. Specifically, we examined the distance fledglings traveled from their nest; their relative use of forested, developed, and open land; and the variation in microhabitat structure and composition. Based on our previous work at the nestling stage, we predicted that the survival of fledglings would not differ between suburban and rural forests, but no a priori predictions could be made about differences in the distance of movement or microhabitat use between suburban and rural fledglings. Investigating the survival, movement, and habitat use of fledgling Wood Thrushes in suburban forest patches and rural forests can help us better understand the conservation value of suburban forest patches for this declining species. This information will be useful to researchers interested in post-fledging ecology, as well as planners and conservationists who need to evaluate their urban conservation efforts vis-à-vis land conservation within their municipalities.

2. Study Area and Design

We collected data on Wood Thrush fledglings originating from nests in suburban and rural forests in western Massachusetts, USA. Fledgling birds in both rural and suburban sites were tagged and tracked during two field seasons (2011 and 2012), as part of a study of avian reproductive success in managed and unmanaged forests in the region. In 2016 and 2017, we had the opportunity to conduct additional tracking of birds in suburban forests but did not have additional resources to track more birds in rural forests for those years. We address the analytical challenges posed by this study design in the statistical methods section below.
For the rural study areas, we used five forested areas (Figure 1) in the region, approximately 10–30 km north and east of Amherst (Figure 1). The five sites were located within state-owned forest preserves: the Mount Toby State Forest (>1200 ha), the Montague State Forest (>700 ha), and three locations within the 10,000 ha Quabbin Reservoir, a contiguously forested watershed protection area. The sites were approximately 6–25 km apart, heavily forested, undeveloped landscapes (mean developed area within 2 km = 0.5%). Two of the rural forests (Mount Toby Forest and Montague State Forest) consisted of unmanaged forests, with little recent logging. The other three were in heavily managed forests with a mean of 21% of the area in an early-successional stage (Figure 1). Prior work revealed that the reproductive success and post-fledging survival of the Wood Thrush did not differ between managed and unmanaged rural sites [34], so we grouped them to compare with suburban forests in this study. The average elevation of the rural study areas was 282 m above sea level.
For the suburban study sites (Figure 1), we identified forested areas containing potential Wood Thrush habitats, primarily in the town of Amherst (42°23′ N, 72°31′ W), Hampshire County, Massachusetts. Sites were randomly selected from the pool of potentially suitable sites, spanning the available size gradient; many of the sites were owned by the municipality as conservation land. Five forest sites were used in 2011–2012, and 10 sites were added in 2016–2017, for a total of 15 sites. Forest sites were approximately 0.85–10.4 km apart and were surrounded by low- to mid-intensity suburban development and some agricultural lands. Since most sites were contiguous with or connected to other forests by strips of riparian or upland forests, it was not meaningful to consider “patch” size or include it in the analyses. The area used for nest searching and monitoring in each patch ranged from <5 ha to ~36 ha. An analysis of a subset of our study sites from a concurrent study found that development occupied a mean of 34% of the land area within 2 km of the study sites [31]. Sites generally consisted of mature forests with dense understory, largely consisting of invasive shrub species. Because these sites were selected across the gradient of patch sizes, we considered them representative of suburban sites and combined them in the analyses to provide an overall estimate of fledgling survival and movement. The average elevation of the suburban study sites was 67 m above sea level.
Dominant tree species across all study sites include the red maple (Acer rubrum), red oaks (Quercus rubra and Quercus velutina), and the white pine (Pinus strobus). Other common tree species include black birch (Betula lenta), eastern hemlock (Tsuga canadensis), Ash (Fraxinus spp.), the white oak (Quercus alba), and the sugar maple (Acer saccharum). Common mid-understory plants include a number of invasive shrub species [multiflora rose (Rosa multiflora), honeysuckle (Lonicera spp.), and Japanese barberry (Berberis thunbergii)], as well as native shrubs such as Rubus spp., the highbush blueberry (Vaccinium corymbosum), and witch hazel (Hamamelis virginiana), and seedlings and saplings of tree species.

3. Materials and Methods

3.1. Field Methods

3.1.1. Nest Searching and Monitoring

We searched for Wood Thrush nests each year, from early to mid-May, as nesting activity was just being initiated, and through mid–late July, when Wood Thrush nesting activity declined. Nests were located using behavioral cues and by searching for suitable habitats. We visited each nest every 2–4 days and took precautions, such as avoiding dead-end trails and checking nests with extendible mirrors or binoculars, to avoid disturbance and abandonment [38,39]. A subset of nests was monitored with weatherproof video cameras as part of a related study. We monitored nests containing older chicks more frequently (sometimes daily), from a distance, with binoculars.

3.1.2. Radio-Tagging and Tracking Fledglings

When possible, we radio-tagged chicks from each nest. Chicks were briefly removed from the nest, banded with a USGS band and a unique color band combination (to aid in tracking resighting), measured, and radio-tagged at 8 to 10 days post-hatch in 2011–2012 and at 10 to 12 days post-hatch in 2016–2017. Up to 3 chicks (median = 2) were banded from each nest. Radio transmitters (Blackburn Transmitters, Nacogdoches, TX, USA) were attached using leg-loop harnesses, following the method by Streby et al. [40]. Transmitters and harnesses, combined, weighed ~1.5 g. If chicks force-fledged while approaching the nest, we attempted to capture them. In 2011–2012, some birds were captured incidentally, after force-fledging from high nests. Because the researchers could not access those high nests, the birds were left on the ground or on a branch below the nest after radio-tagging and banding. In 2011–2012, birds that failed to remain in the nest after being replaced (i.e., “force-fledged”) were returned to the nest once after jumping out, and if they jumped out again, they were left on the ground or on a branch below the nest. Due to concerns about the negative effects of force-fledging on survival [34], in 2016–2017 we took precautions when removing chicks from nests and when returning them to nests. When removing chicks, we approached slowly, remaining out of sight and below the nest, when possible, until we could reach in with a hand and place it gently over the chicks. We removed all chicks and kept them together during processing. Before returning the chicks to the nest, we packed up all equipment and moved away from the nest. Then, one or two observers approached the nest to return the chicks; the chicks were positioned carefully inside the nest, with their heads facing out. The observer then gently placed an open hand over the chicks for a few seconds, holding the hand there longer if the birds were active upon returning. Observers then left, staying out of view of the chicks if possible (i.e., the observer’s hand, which was covering the nest, was higher than the observer’s head). Most chicks stayed in the nest when returned; if a chick force-fledged upon return to the nest, we attempted to return it again and followed the same procedure. If a bird repeatedly force-fledged, we left it under the nest on the ground, but this was an extremely rare occurrence (1 out of 38 fledglings).
After nestlings were radio-tagged, an observer returned to the nest 1–2 days later. If birds were no longer in the nest, the fledged birds were located using a handheld receiver (Communication Specialists, Inc., Orange, CA, USA or Telonics, Inc., Mesa, AZ, USA) and a Yagi antenna (Advanced Telemetry Systems, Isanti, MN, USA). An observer returned to locate each fledgling approximately every 2–3 days. When fledglings were located, the GPS location, bird status (alive/dead), and any other family members present were recorded. Fledglings were tracked until there was evidence of mortality (e.g., transmitter recovered with fledgling body parts), until their tags had been recovered, or until their tags had been active for 6–8 weeks (when the radio transmitter batteries were reaching the end of their lives) and the observer could no longer obtain a clear signal. For birds that were confirmed alive outside of the nest but later had uncertain fates (i.e., the observer could not confirm whether or not they were alive after some number of visits), we censored their observations at the last observation where the bird’s status (alive or dead) was known.

3.1.3. Vegetation Surveys

To investigate differences between available (but uninhabited) and inhabited habitats by fledglings, we collected vegetation data for each radio-tagged fledgling when possible. Vegetation data was collected at each of the first three locations where a fledgling was resighted (not including the nest site and not including visits when the location of the bird could not be clearly pinpointed). For each of the three locations, we also collected vegetation data at a paired point (50 m away in a randomly selected direction). At each fledgling and random location, in a five-meter radial plot centered around the point, we collected two kinds of vegetation data: (1) We counted all live, woody stems reaching knee height (0.5 m) in two size classes (≤2.5 cm, or “small” and 2.5–8 cm, or “large”). And (2) we conducted a pole contact sub-survey at 12 locations within each radial plot, at one, three, and five meters from the center of the plot, along the cardinal axes. At each sub-survey, the highest vegetation contacting the pole, in two categories (≤0.5 m and 0.5–3 m), was identified to the genus or species level.

3.2. Summary Data and Statistical Analyses

We radio-tagged 177 fledglings over four field seasons. Nine birds were removed from the dataset for the mark–recapture analysis because they were never confirmed alive outside of the nest and their fate was unknown. This left 168 fledglings: 99 rural birds from 43 nests and 69 suburban birds from 37 nests (mean fledglings per nest = 2.1; Table 1). During the study, 30 birds were left on the ground after tagging: 29 out of 130 (~22%) fledglings in 2011–2012 and 1 out of 38 (<3%) fledglings in 2016–2017. Of the 168 birds in the survival analysis, 18 rural birds and 13 suburban birds were found dead during our study. None were located near roads, windows, or other human structures in such a manner as to suggest death by collision.
We used the program Mark [41], which was run through the R [42] package RMark [43], to conduct mark–recapture analysis of post-fledging survival. The program Mark numerically derives maximum likelihood estimates of daily survival rates (DSRs) and variances and allows for the inclusion of environmental covariates [44]. We used “Nest Survival” models in RMark, as these models are appropriate for “ragged” (birds were tagged throughout the season) telemetry data such as ours. Group covariates included were “SiteType” (suburban or rural), “Year”, and “Ground”. The “Year” term was included both to control for annual variation and due to the fact that the years differed between suburban (2011, 2012, 2016, and 2017) versus rural (2011 and 2012) sites. The Ground variable coded for whether the bird was left on the ground (i.e., force fledged/not successfully returned) or remained inside the nest cup when the observers left the nest. We initially included group covariates for suburban forest patch identity and for nests, but neither of these models converged well, and we did not include these in the final model set. Individual covariates included were “Time” (a continuous variable for the day of the season, starting from the first day a fledgling was tracked) and “FAge” (the age of the fledgling on each day of the season, starting from the day it left the nest). The Fage covariate was included because post-fledging survival tends to improve with the age of the bird and because most mortality occurs within the first few days or weeks of fledging [27,45]. Because the Year and SiteType variables were correlated (r = 0.49), we included a Year × SiteType interaction model. Because the Ground and SiteType variables were slightly correlated (r = −0.29) (leaving the bird on the ground after tagging was more frequent in the rural sites, in part due to the difference in field protocol), we included a Ground × SiteType interaction model. We treated all tagged birds as independent, based on evidence that sibling Wood Thrush fledging fates are not correlated [9]. We ran the survival analysis with and without the individuals left on the ground. For the dataset with these birds removed, there were 138 fledglings: 72 rural birds from 30 nests and 66 suburban birds from 36 nests.
We used ArcMap (version 10.8.2) to identify the land use cover type for each resighting location for each fledgling. Land use cover categories, obtained from MassGIS [37], were binned into three groups: forested, non-forested developed, and non-forested open (see Supplementary S1). We included several fledglings in the survival analysis (above) that were tracked for only one visit when we found the bird dead. This meant that we had no reliable habitat use data for those birds. The dataset for the land use tests, therefore, contained 149 fledglings: 92 rural birds from 41 nests and 57 suburban birds from 34 nests.
To compare land use between suburban and rural birds, we calculated the percentage of all resights for each bird in each land use category. We then used a Kruskal–Wallis test for each of the three land use bins to test for a difference between suburban and rural sites. To look at land use over time, we calculated the total resights, over all birds, in each of the three land use groups (forested, non-forested developed, and non-forested open). We then split the resights into the first 3 weeks post-fledging, or “early” (roughly the age when fledglings start becoming independent from adults [35,46]), and 3+ weeks after fledging, or “late”, and compared them with a chi-squared test of all birds, as well as a chi-squared test for suburban-only and rural-only birds. For significant chi-squared test results (p < 0.05), we conducted a post hoc test on the residuals.
We used the same dataset for movement tests as we did for the land use tests. For each resight location of each bird, we used ArcMap to calculate the distance (in meters) from the nest (or, occasionally, from the first tracking location due to missing nest data). We then conducted a generalized mixed-model (GLMM) test with a log gamma link to compare the distance from nests between suburban and rural birds. Fixed effects were site type (suburban vs. rural) and days since fledge, while random effects were tag number (i.e., individual bird ID) and nest ID. We compared the full model and nested models with AIC. We used a gamma link, as it works well for continuous, positive data with overdispersion and a right skew. However, because a gamma distribution cannot contain zeros, we replaced the zeros (indicating fledglings that remained at or returned to the nest site or very near to it) with 0.25 m (a distance within the margin of error of our GPS units). One fledgling made one much greater movement (over twice the distance of the next largest movement) than any other fledgling. This was a rural bird that apparently crossed the Quabbin Reservoir in 2012. This movement was over 15 standard deviations (sds) from the mean, while other outliers in this dataset were between three and six sds from the mean. We ran the GLMM with and without this outlier.
We had sufficient data and were able to analyze the vegetation structure at resight (“used”) and random (“available”) points for 105 birds: 82 rural birds from 37 nests and 23 suburban birds from 19 nests. We used paired Wilcoxon tests to compare small and large stem density between fledgling resight and random points. We used unpaired Wilcoxon tests to compare small and large stems between suburban and rural sites (for used and available points separately).
We had sufficient data and were able to analyze vegetation composition using 118 birds: 95 rural birds and 23 suburban birds. To examine vegetation composition, we calculated the percentage of upper pole contacts (0.5–3 m) of each plant species or plant category across all birds in four categories (used—suburban, used—rural, available—suburban, and available—rural). We combined unidentified or inconsistently identified plant species, as well as species with <5 contacts per category into “other”. This resulted in eight categories of plants (Supplementary S2). We then ran chi-squared tests to compare used and available vegetation for suburban birds, used and available vegetation for rural birds, and used suburban vs. used rural vegetation. Finally, we used chi-square post hoc tests to determine which plant groups accounted for differences between groups.

4. Results

4.1. Fledgling Survival

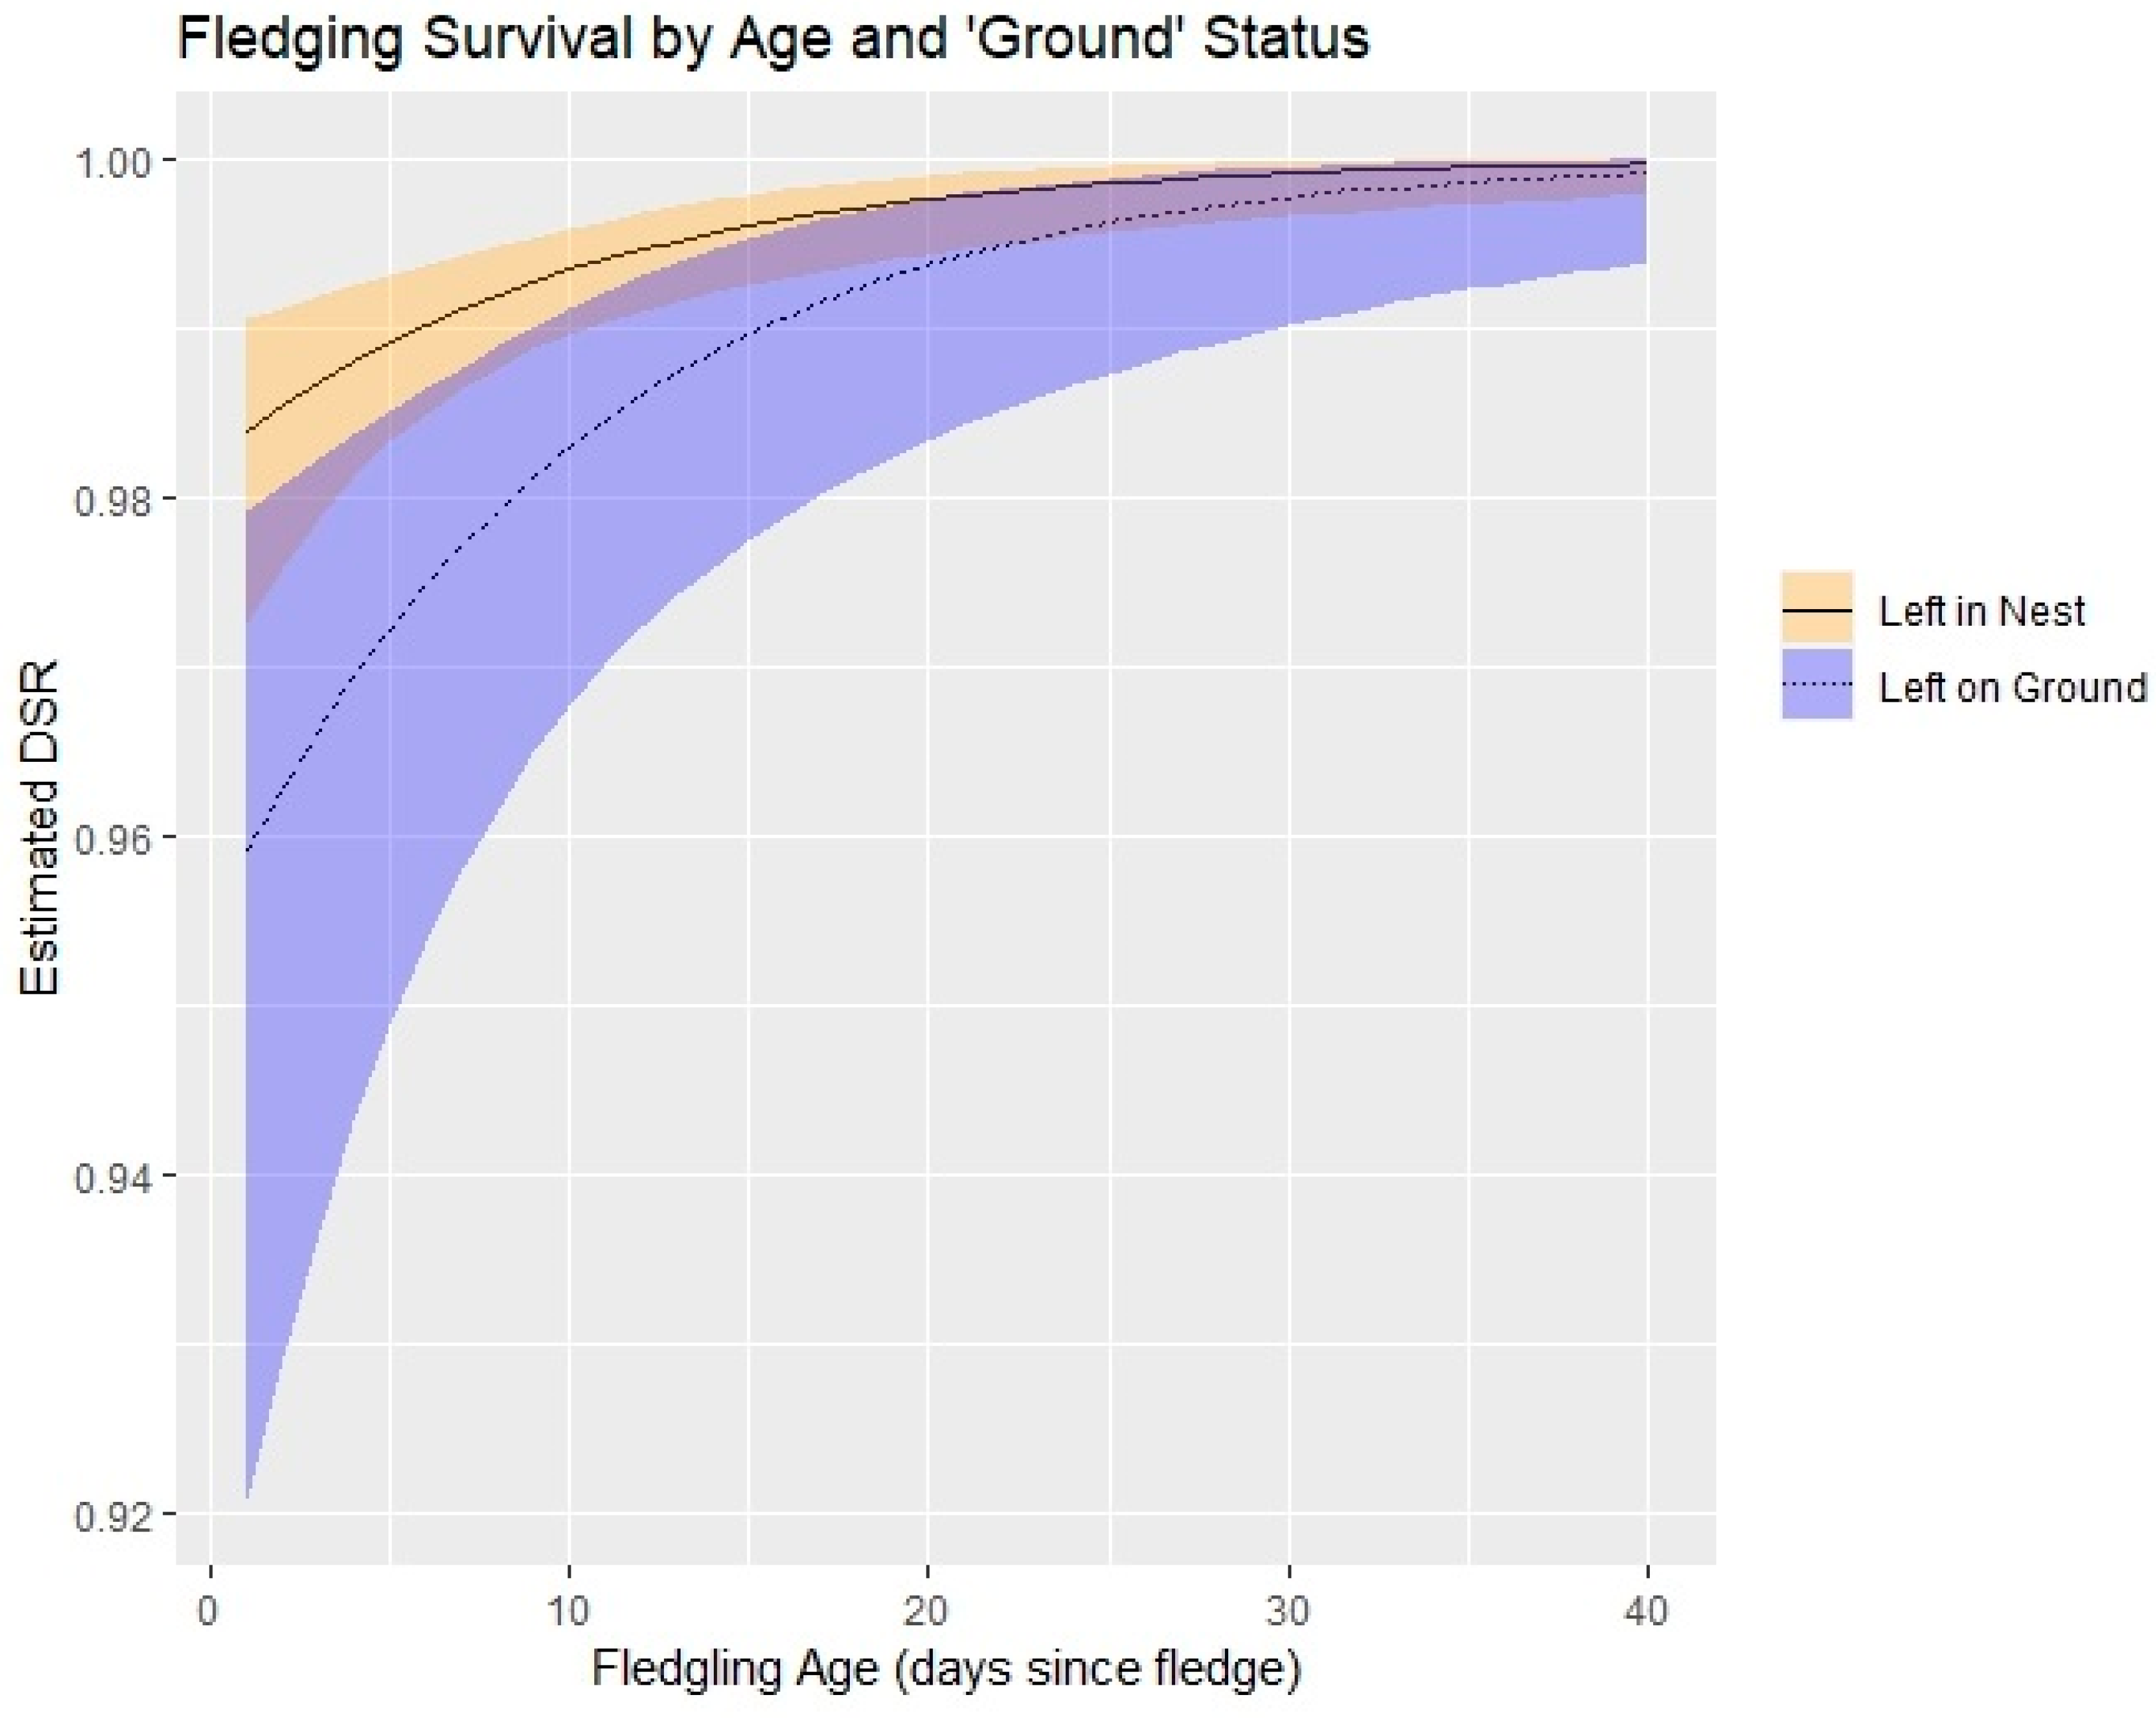
In the survival analysis, fledgling age (FAge) and being left on the ground after radio-tagging (Ground) were the only parameters that affected fledgling survival. Fledgling age positively affected daily survival rates (DSRs), while being left on the ground after radio-tagging negatively affected DSRs (Figure 2). Confidence intervals (CIs) did not overlap zero for the intercept-only model, the fledgling age model, the Ground model, nor the (Ground + FAge) model. Interaction effects of both interaction models (Ground × FAge, Ground × SiteType) had CIs that overlapped zero. The confidence intervals for the Time (ordinal day), Year, and SiteType models overlapped zero. AICc ranked the Ground × FAge interaction model as the top model, followed by the additive Ground + FAge model (within two delta AICc; Table 2). We did not include the Year × SiteType interaction model in our final model set because the CIs of both single-variable models overlapped zero.
For the survival dataset with force-fledged birds removed, all models, aside from the null model and the fledgling age model, had confidence intervals overlapping zero. AICc ranked fledgling age as the top model and no other models within two AICc.

4.2. Fledgling Land Use

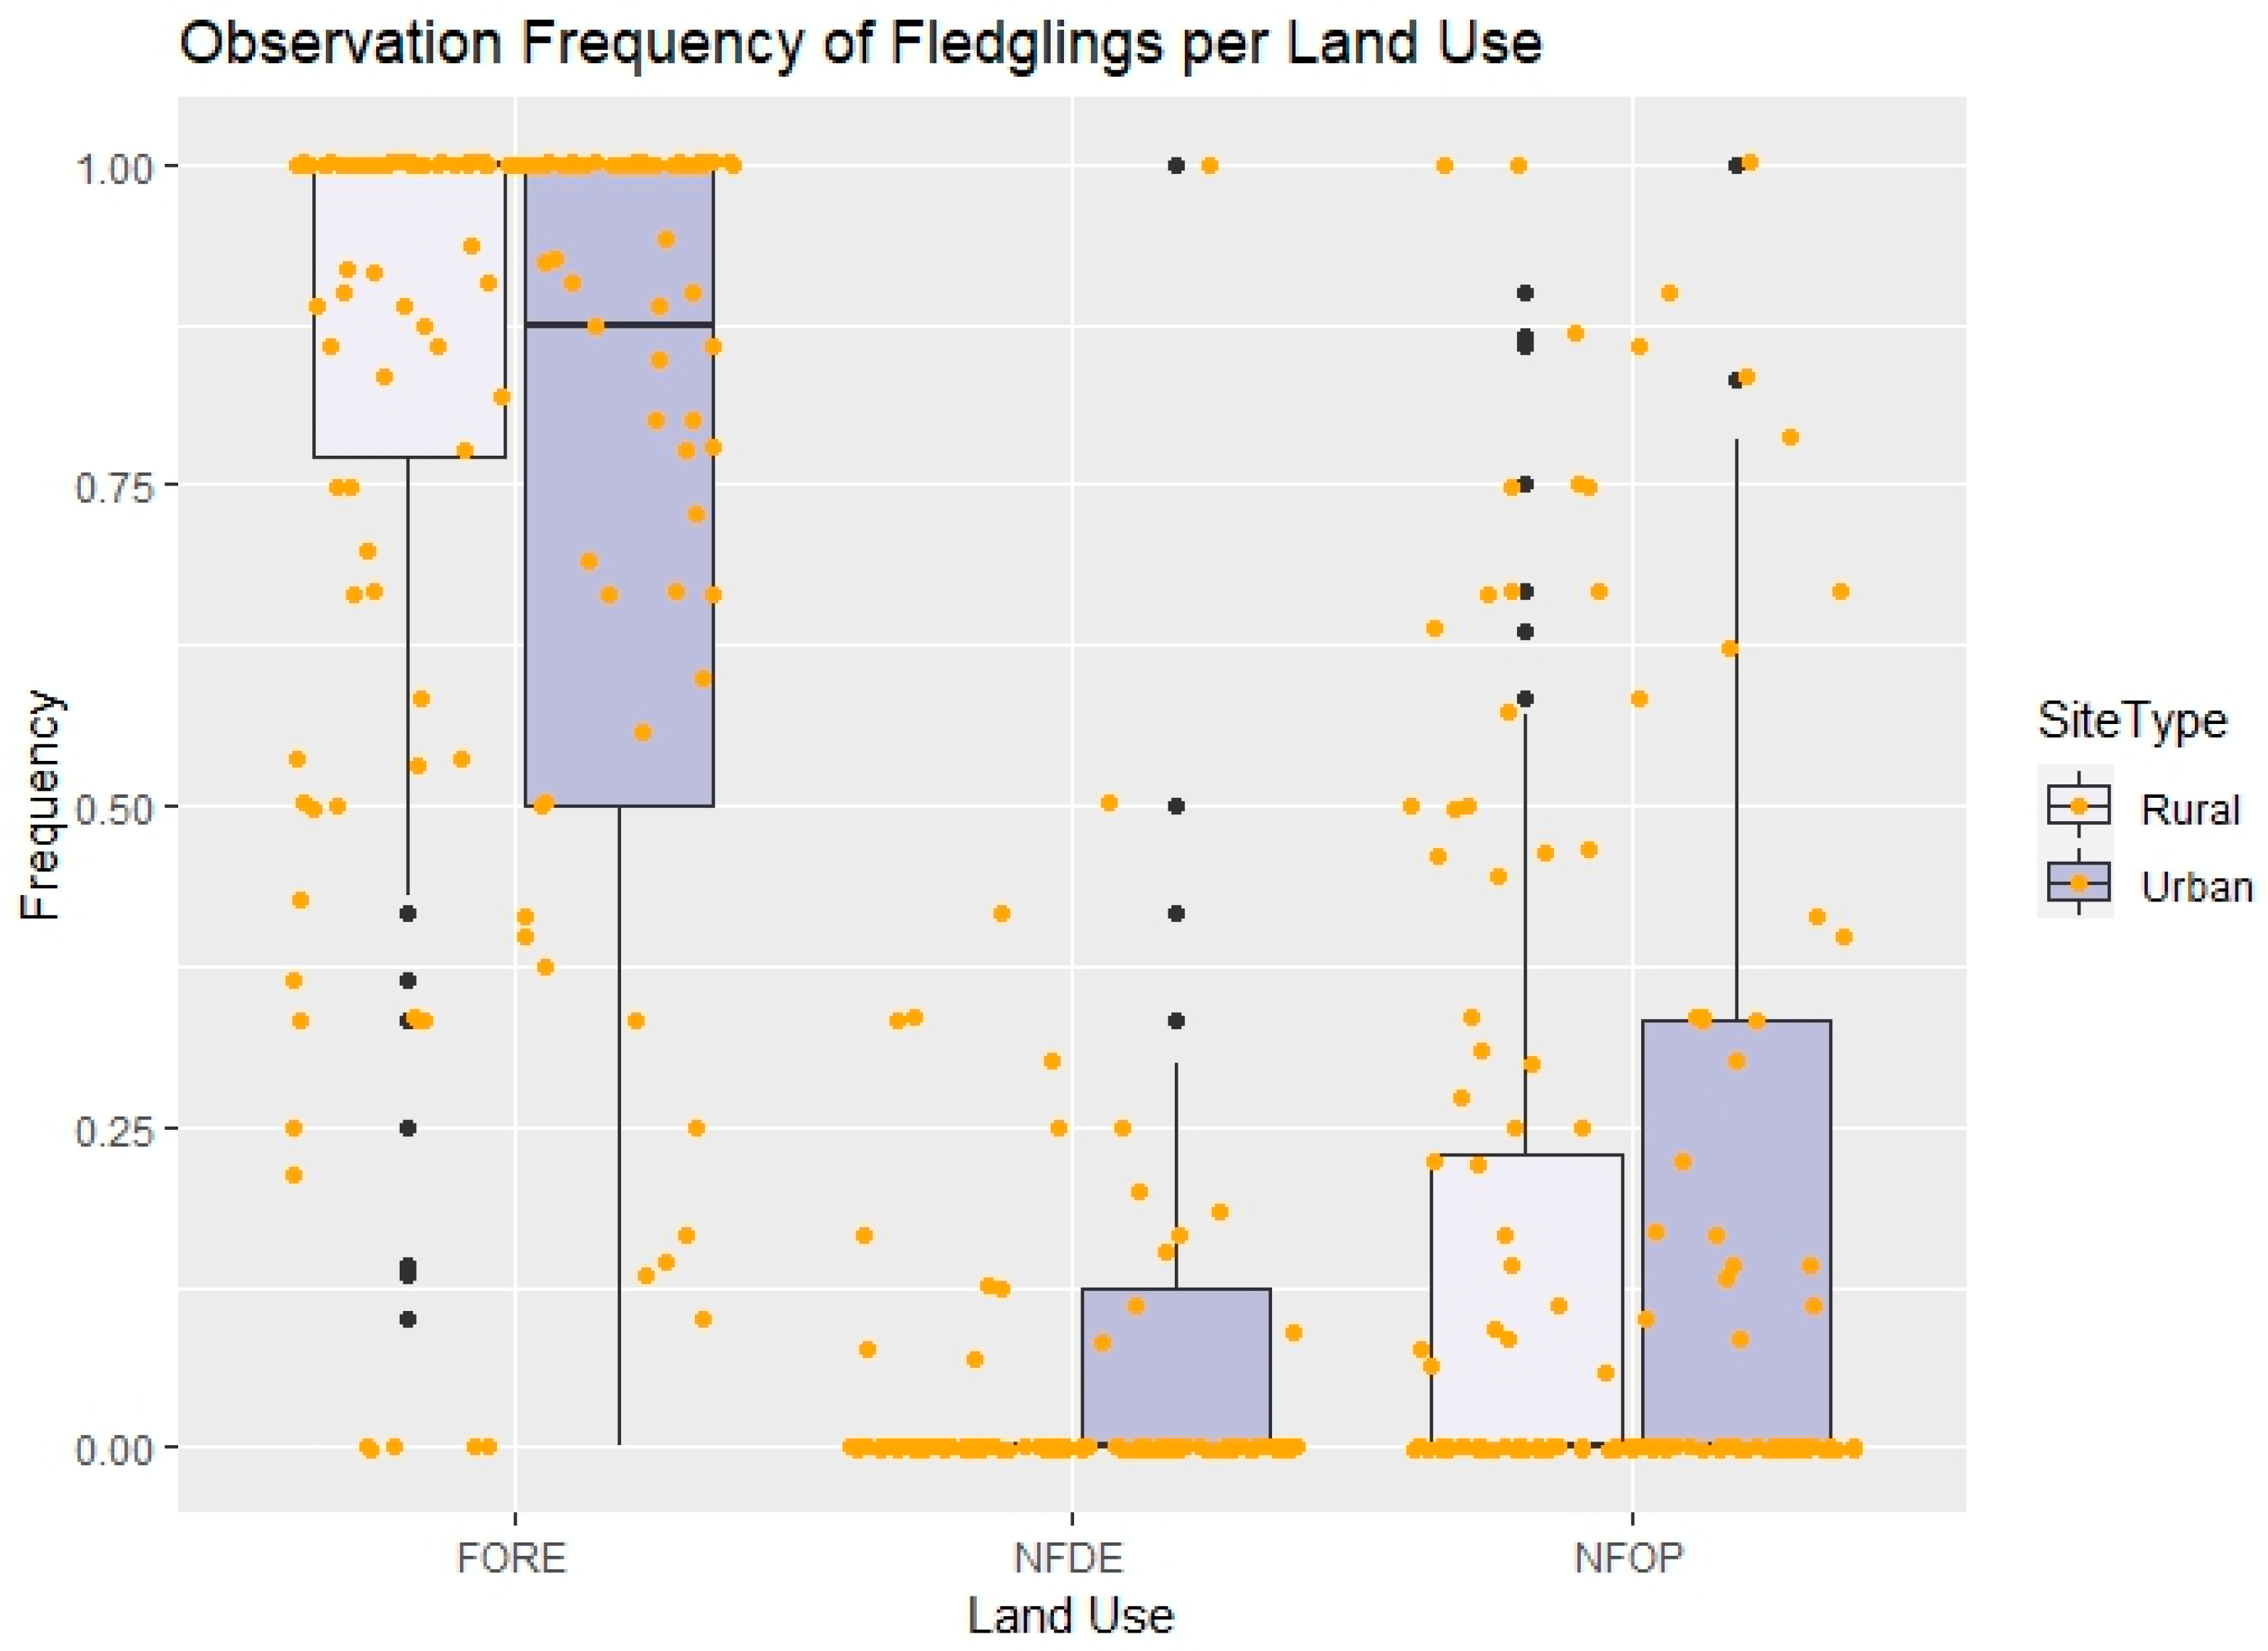
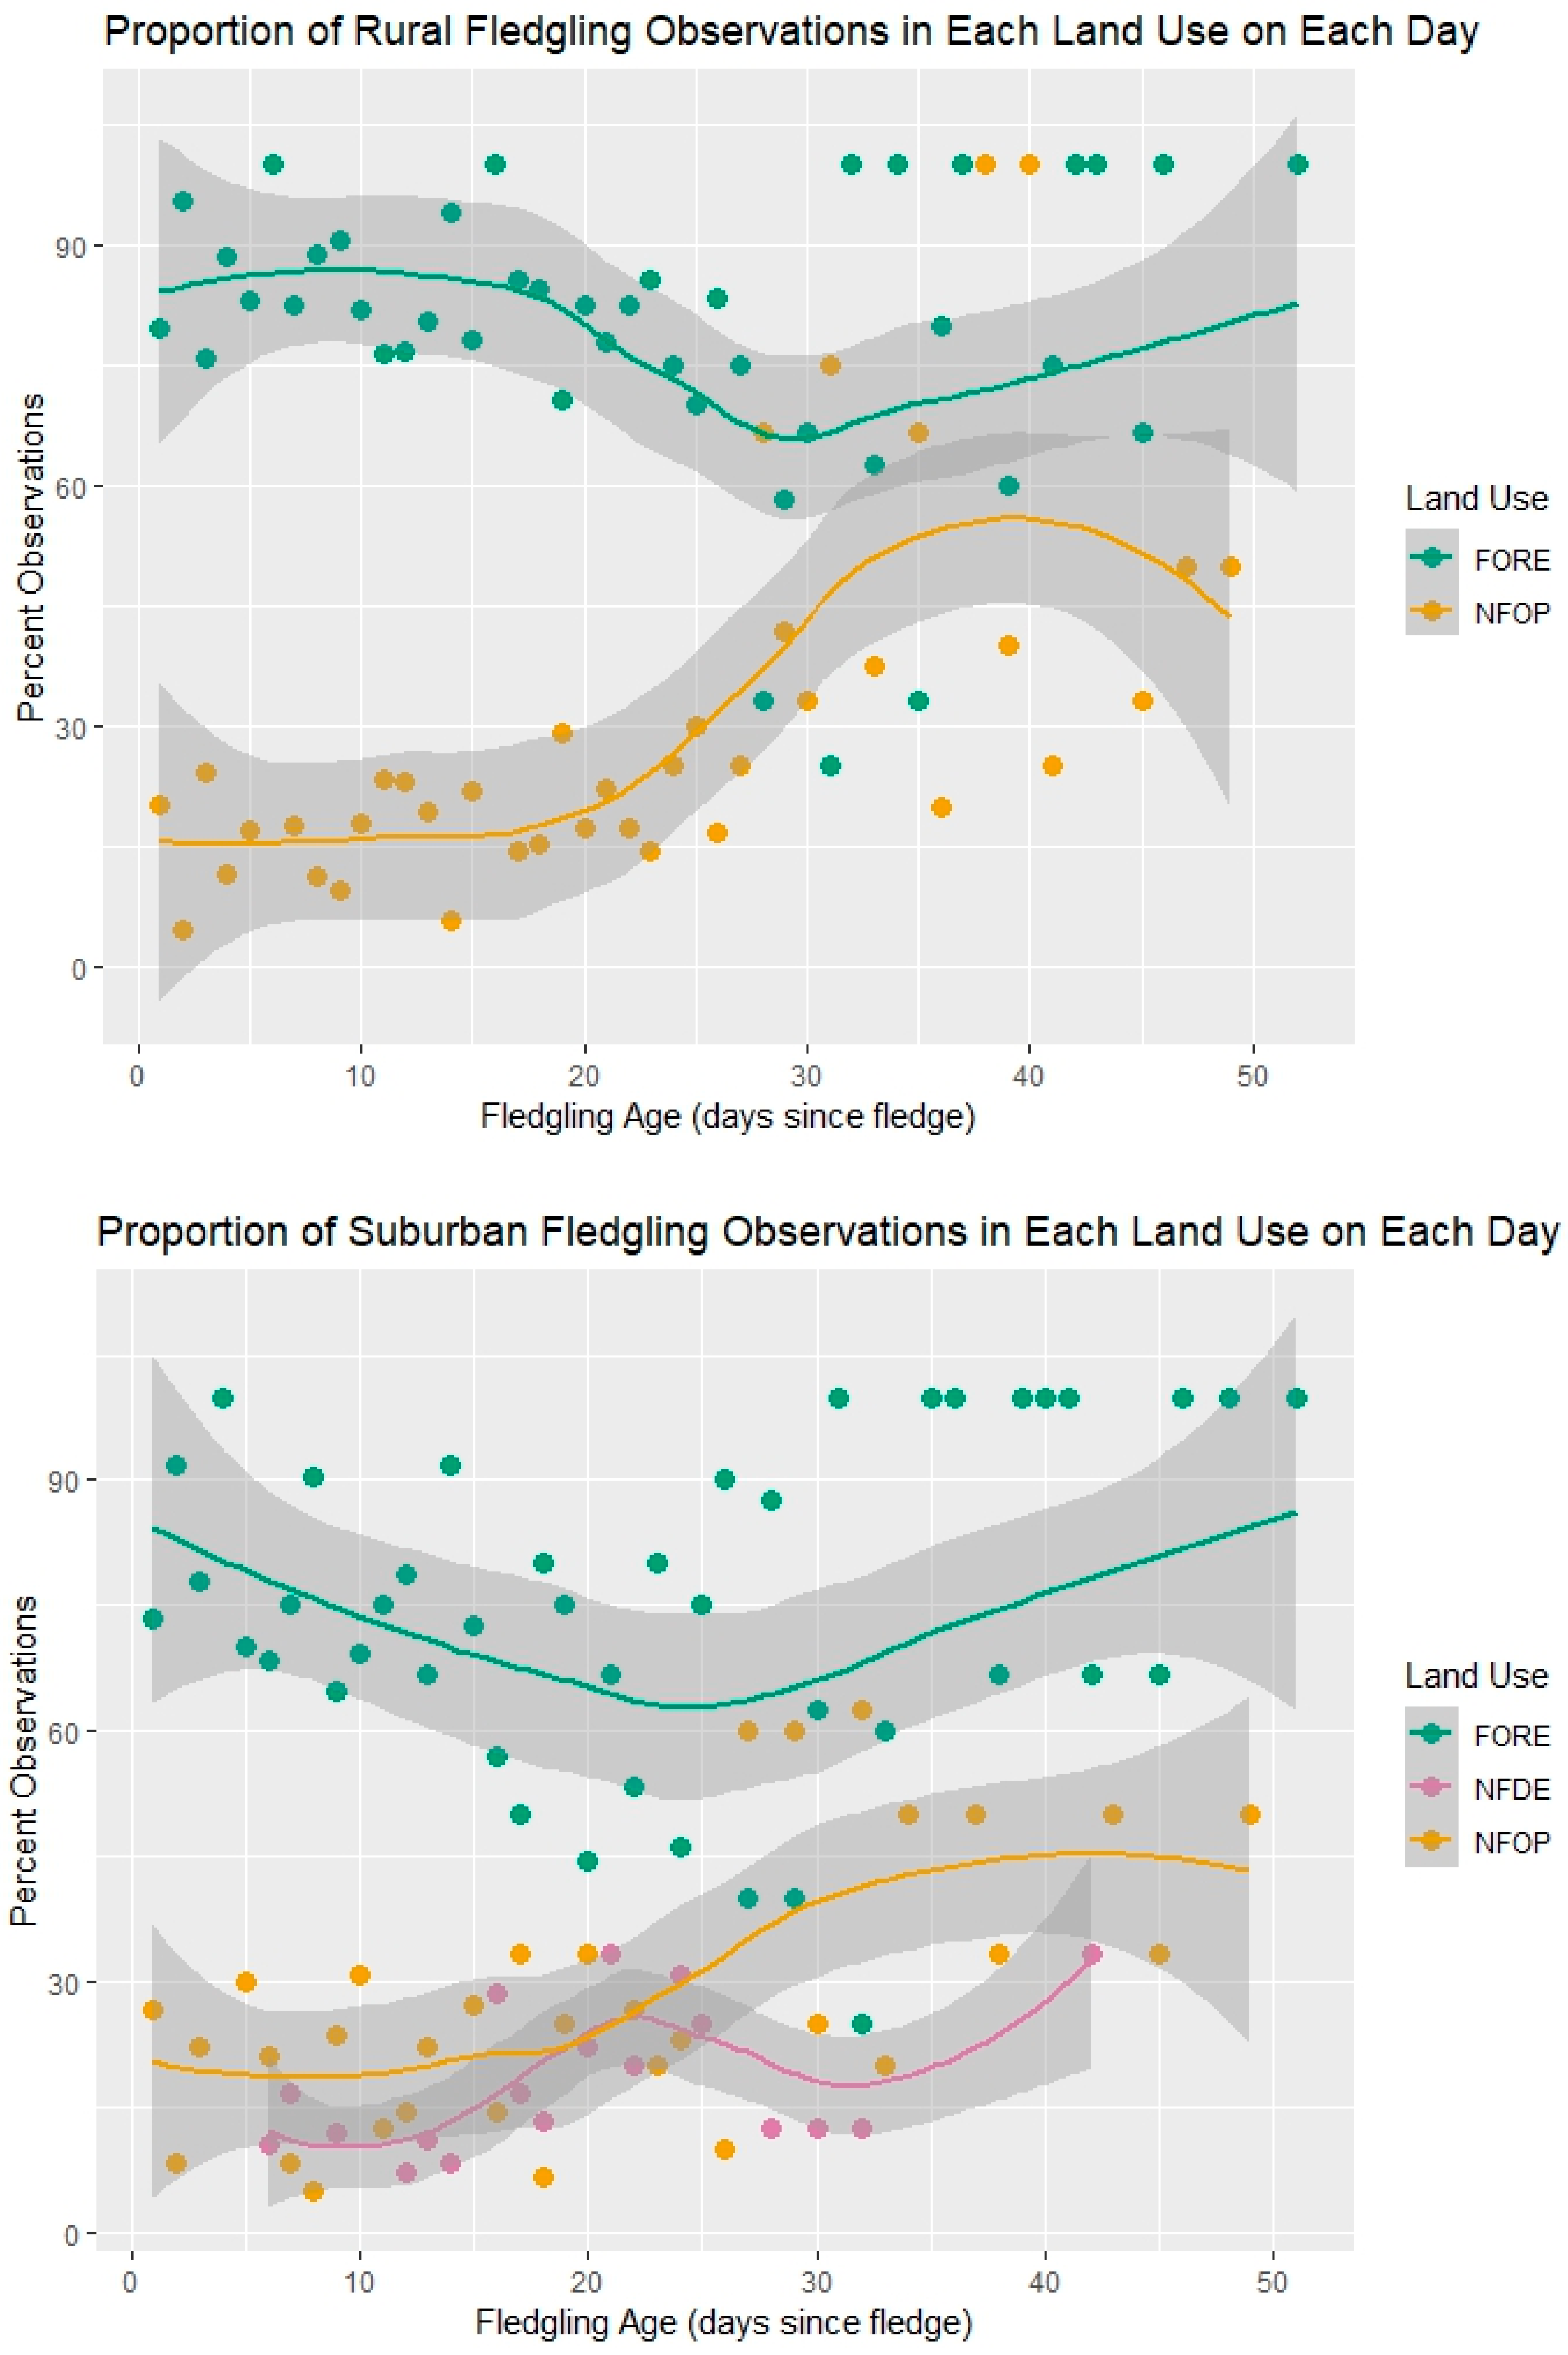
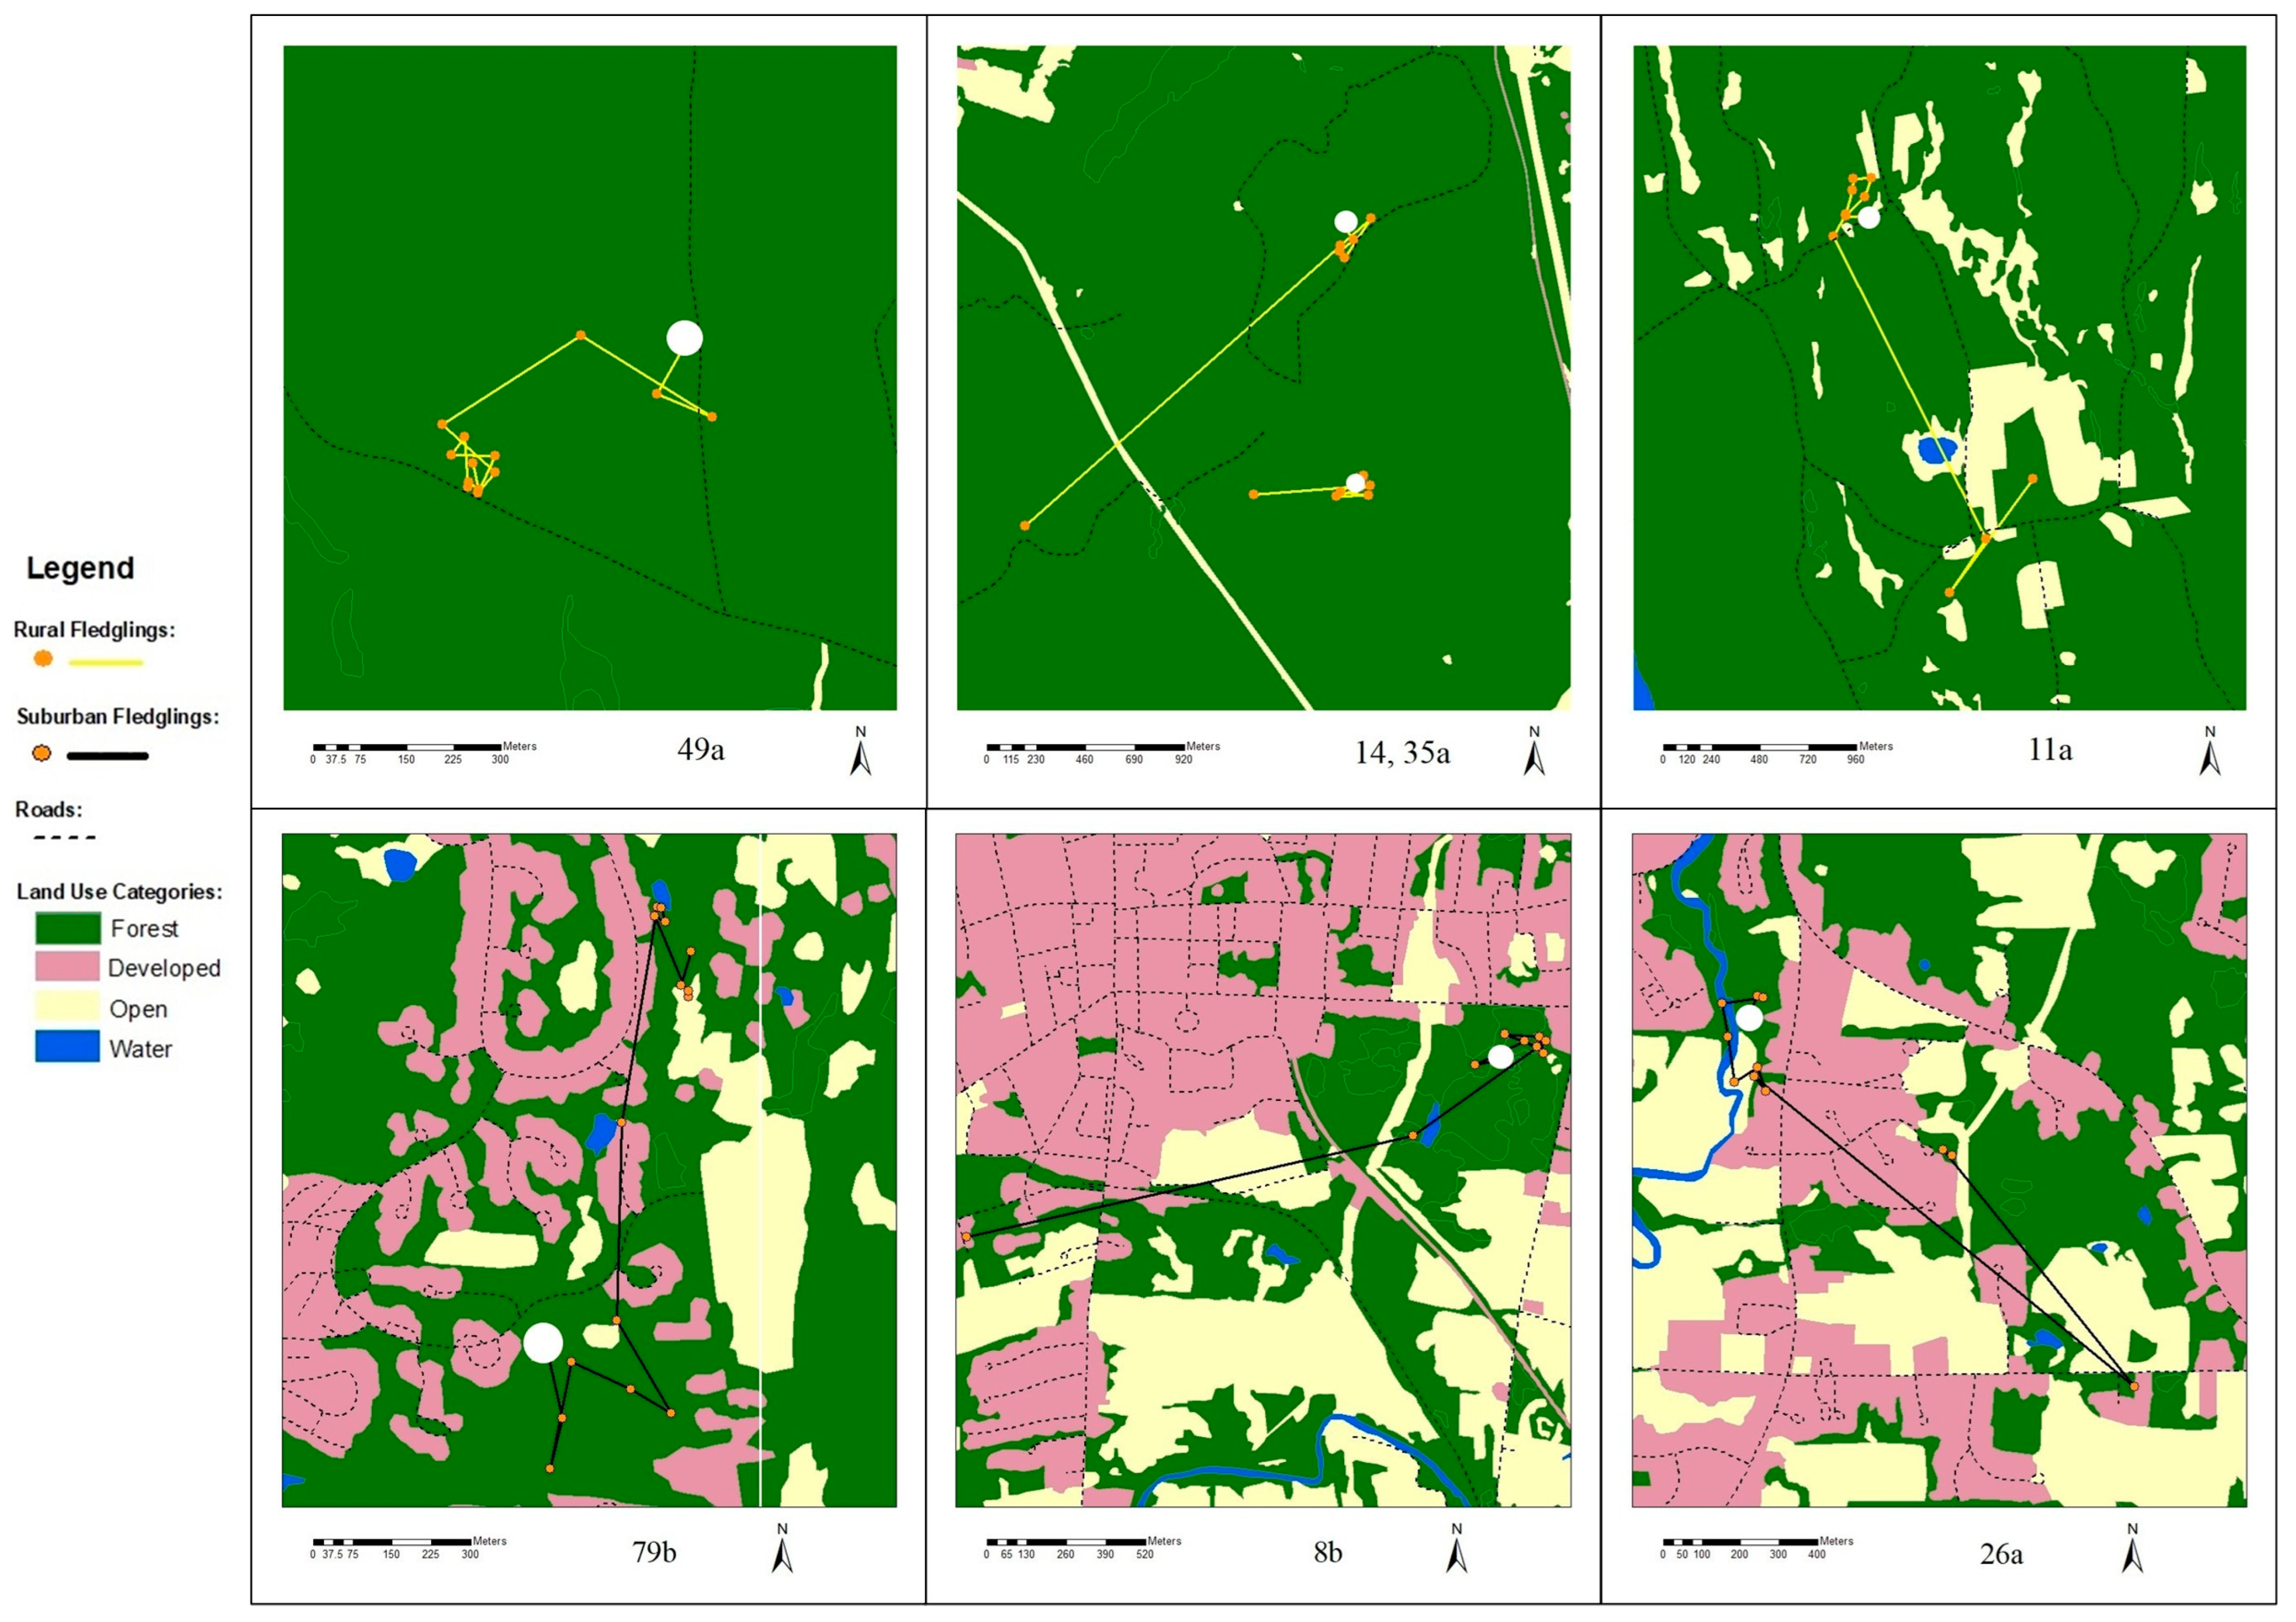
Fledglings from both suburban and rural forests used a high proportion of forested land (Figure 3), but fledglings from rural sites used a higher proportion of forested land compared to fledglings from suburban sites (Kruskal–Wallis test: H = 10.28, p = 0.001; Figure 3). Fledglings from suburban sites used a higher proportion of developed land compared to fledglings from rural sites (Kruskal–Wallis test: H = 36.78, p < 0.001; Figure 3). There was no difference in proportion of open land used between fledglings from suburban and rural sites (Kruskal–Wallis test: H = 1.31, p = 0.25; Figure 3). Land use by fledglings changed over time for all birds (chi-square test: χ2 = 25.45, p < 0.001) and for rural birds only (chi-square test: χ2 = 15.92, p < 0.001). The proportion of open land used was less in the first three weeks post-fledging compared to later weeks for all birds combined (chi-square post hoc test: p < 0.001) and for rural birds only (chi-square post hoc test: p < 0.001; Figure 4). Conversely, the proportion of forested land used was greater in the first three weeks post-fledging compared to later weeks for all birds combined (chi-square post hoc test: p < 0.001) and for rural birds only (chi-square post hoc test: p < 0.001; Figure 4). Suburban fledglings spent a large percentage of their time inside their natal forested area, but several did move into or near the surrounding suburban and agricultural matrix (Figure 5).

4.3. Fledgling Dispersal Distance

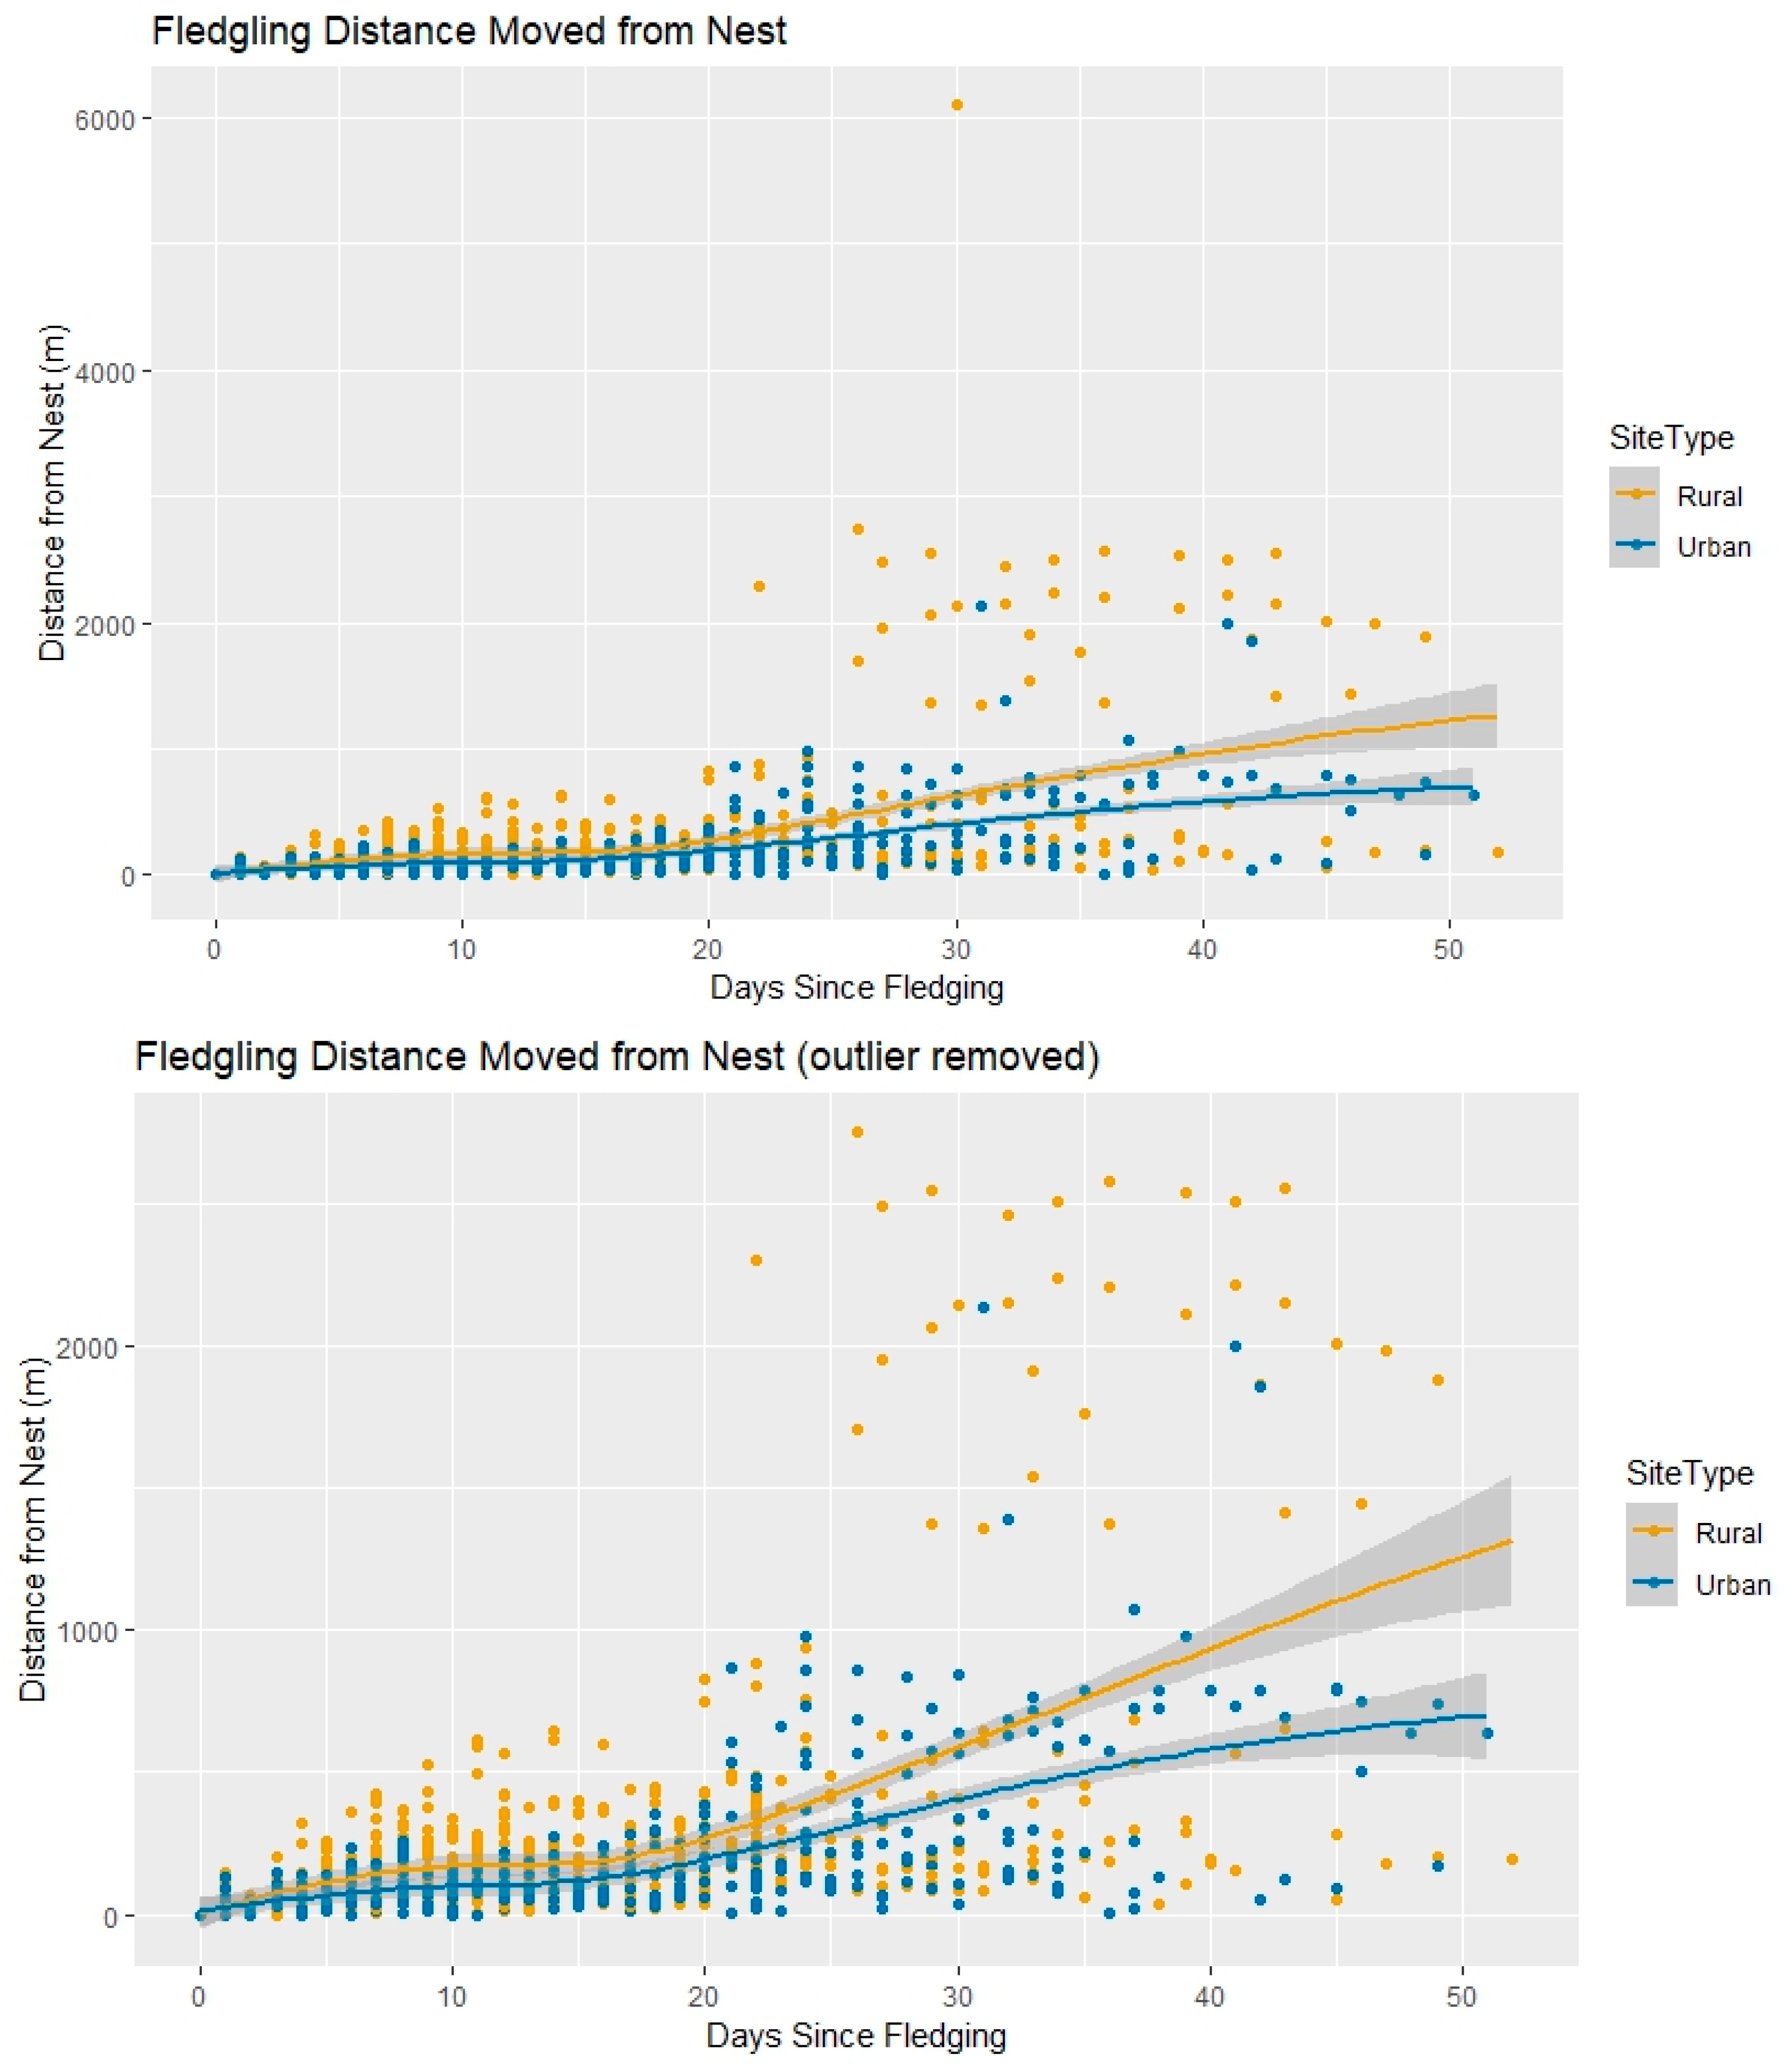
Distances traveled by fledglings in the weeks and months after fledging ranged from less than 1 km to over 6 km. Neither the direction nor the significance of any GLMM coefficient was affected by the removal of the largest outlier (Figure 6), so the outlier was retained. The AIC ranked the full model (Fixed effects: site type and days since fledge; random effects: tag number and nest ID) as the top model (Table 3). The distance from the nest increased with time since fledging (β = 0.07, p < 0.001; Figure 6), and rural birds traveled significantly farther than suburban birds (β = −0.41, p < 0.001; Figure 6). We subsequently included year as a random effect, given the relationship (see statistical methods) between site type and year, but this did not have any effect on the results so we do not report those values.

4.4. Fledgling Vegetation Use

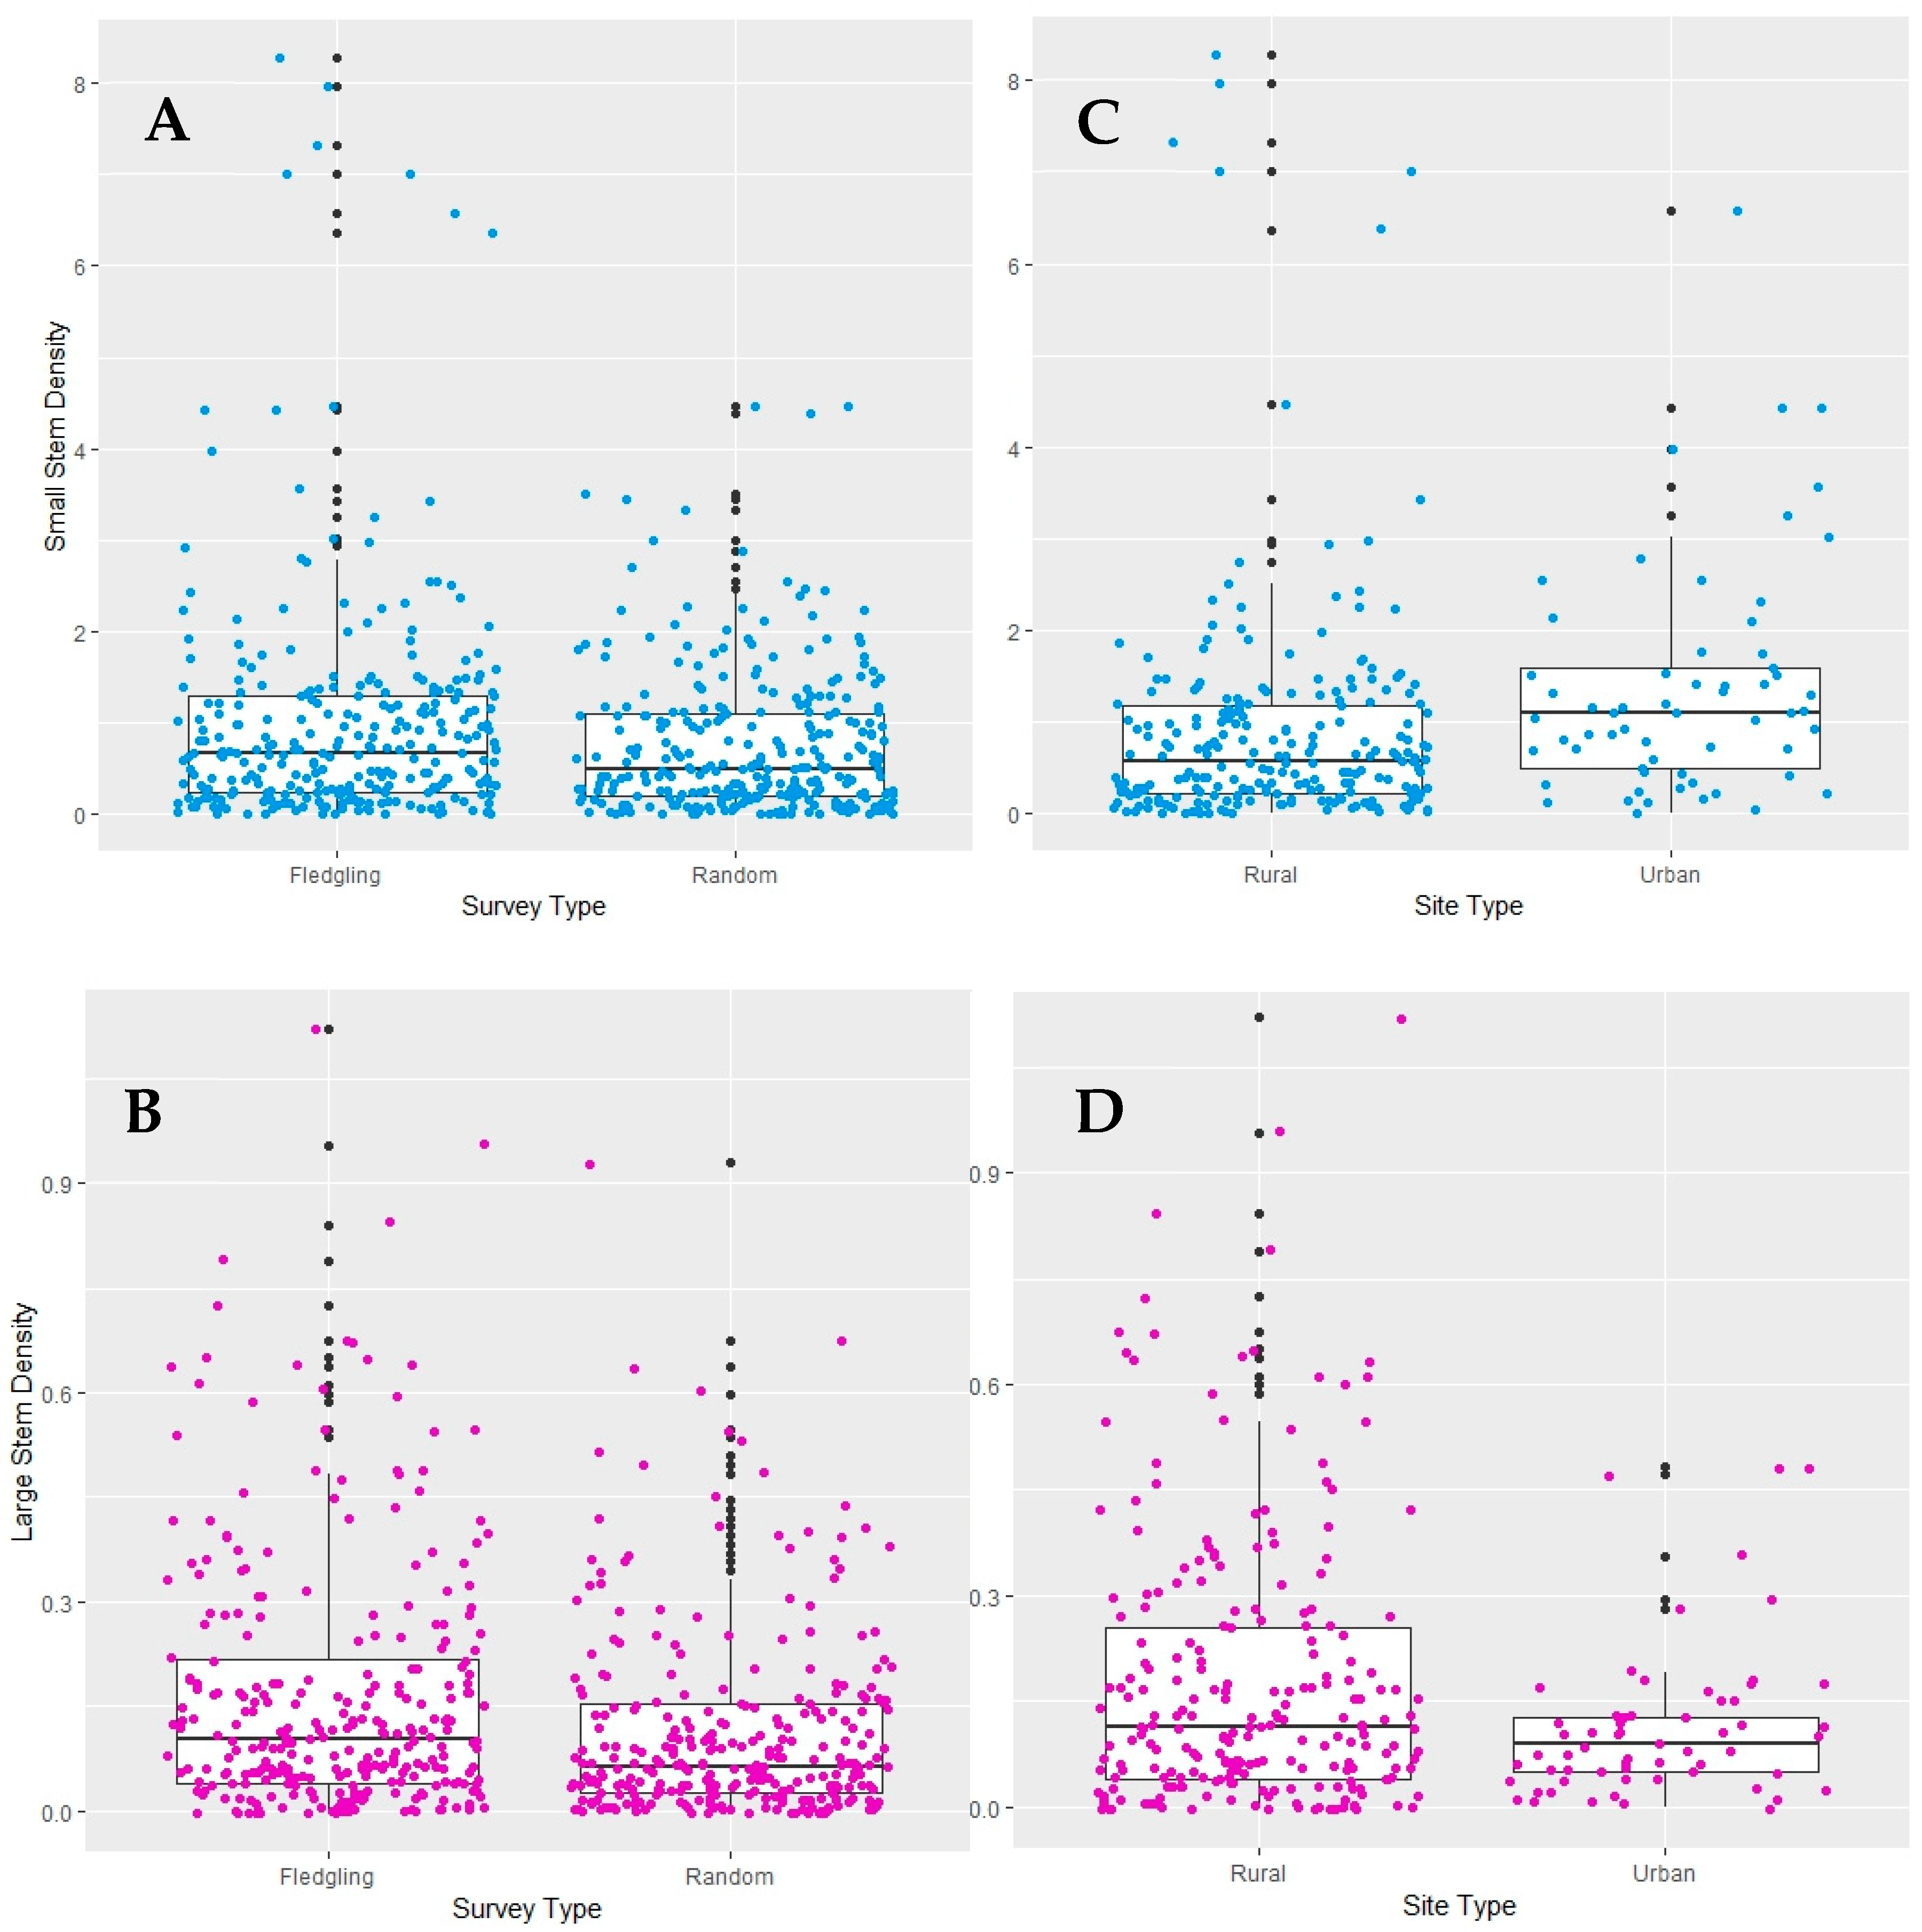
Vegetation stem density was greater at used points than at available points for both suburban and rural fledglings (paired Wilcoxon tests; suburban small stems: V = 1287.5; p = 0.01; suburban large stems: V = 1111, p < 0.001; rural small stems: V = 16,614; p = 0.004; and rural large stems: V = 15,754, p < 0.001; Figure 7A,B). The density of small stems was significantly greater at used suburban points compared to used rural points (Wilcoxon test: W = 4880.5; p < 0.001) and was also significantly greater at available suburban points compared to available rural points (Wilcoxon test: W = 5501.5; p = 0.005). The density of large stems was marginally greater at used rural points than at used suburban points (Wilcoxon test: W = 8169; p = 0.09; Figure 7C,D) and was significantly greater at available rural points than at available suburban points (Wilcoxon test: W = 8861.5, p = 0.004).
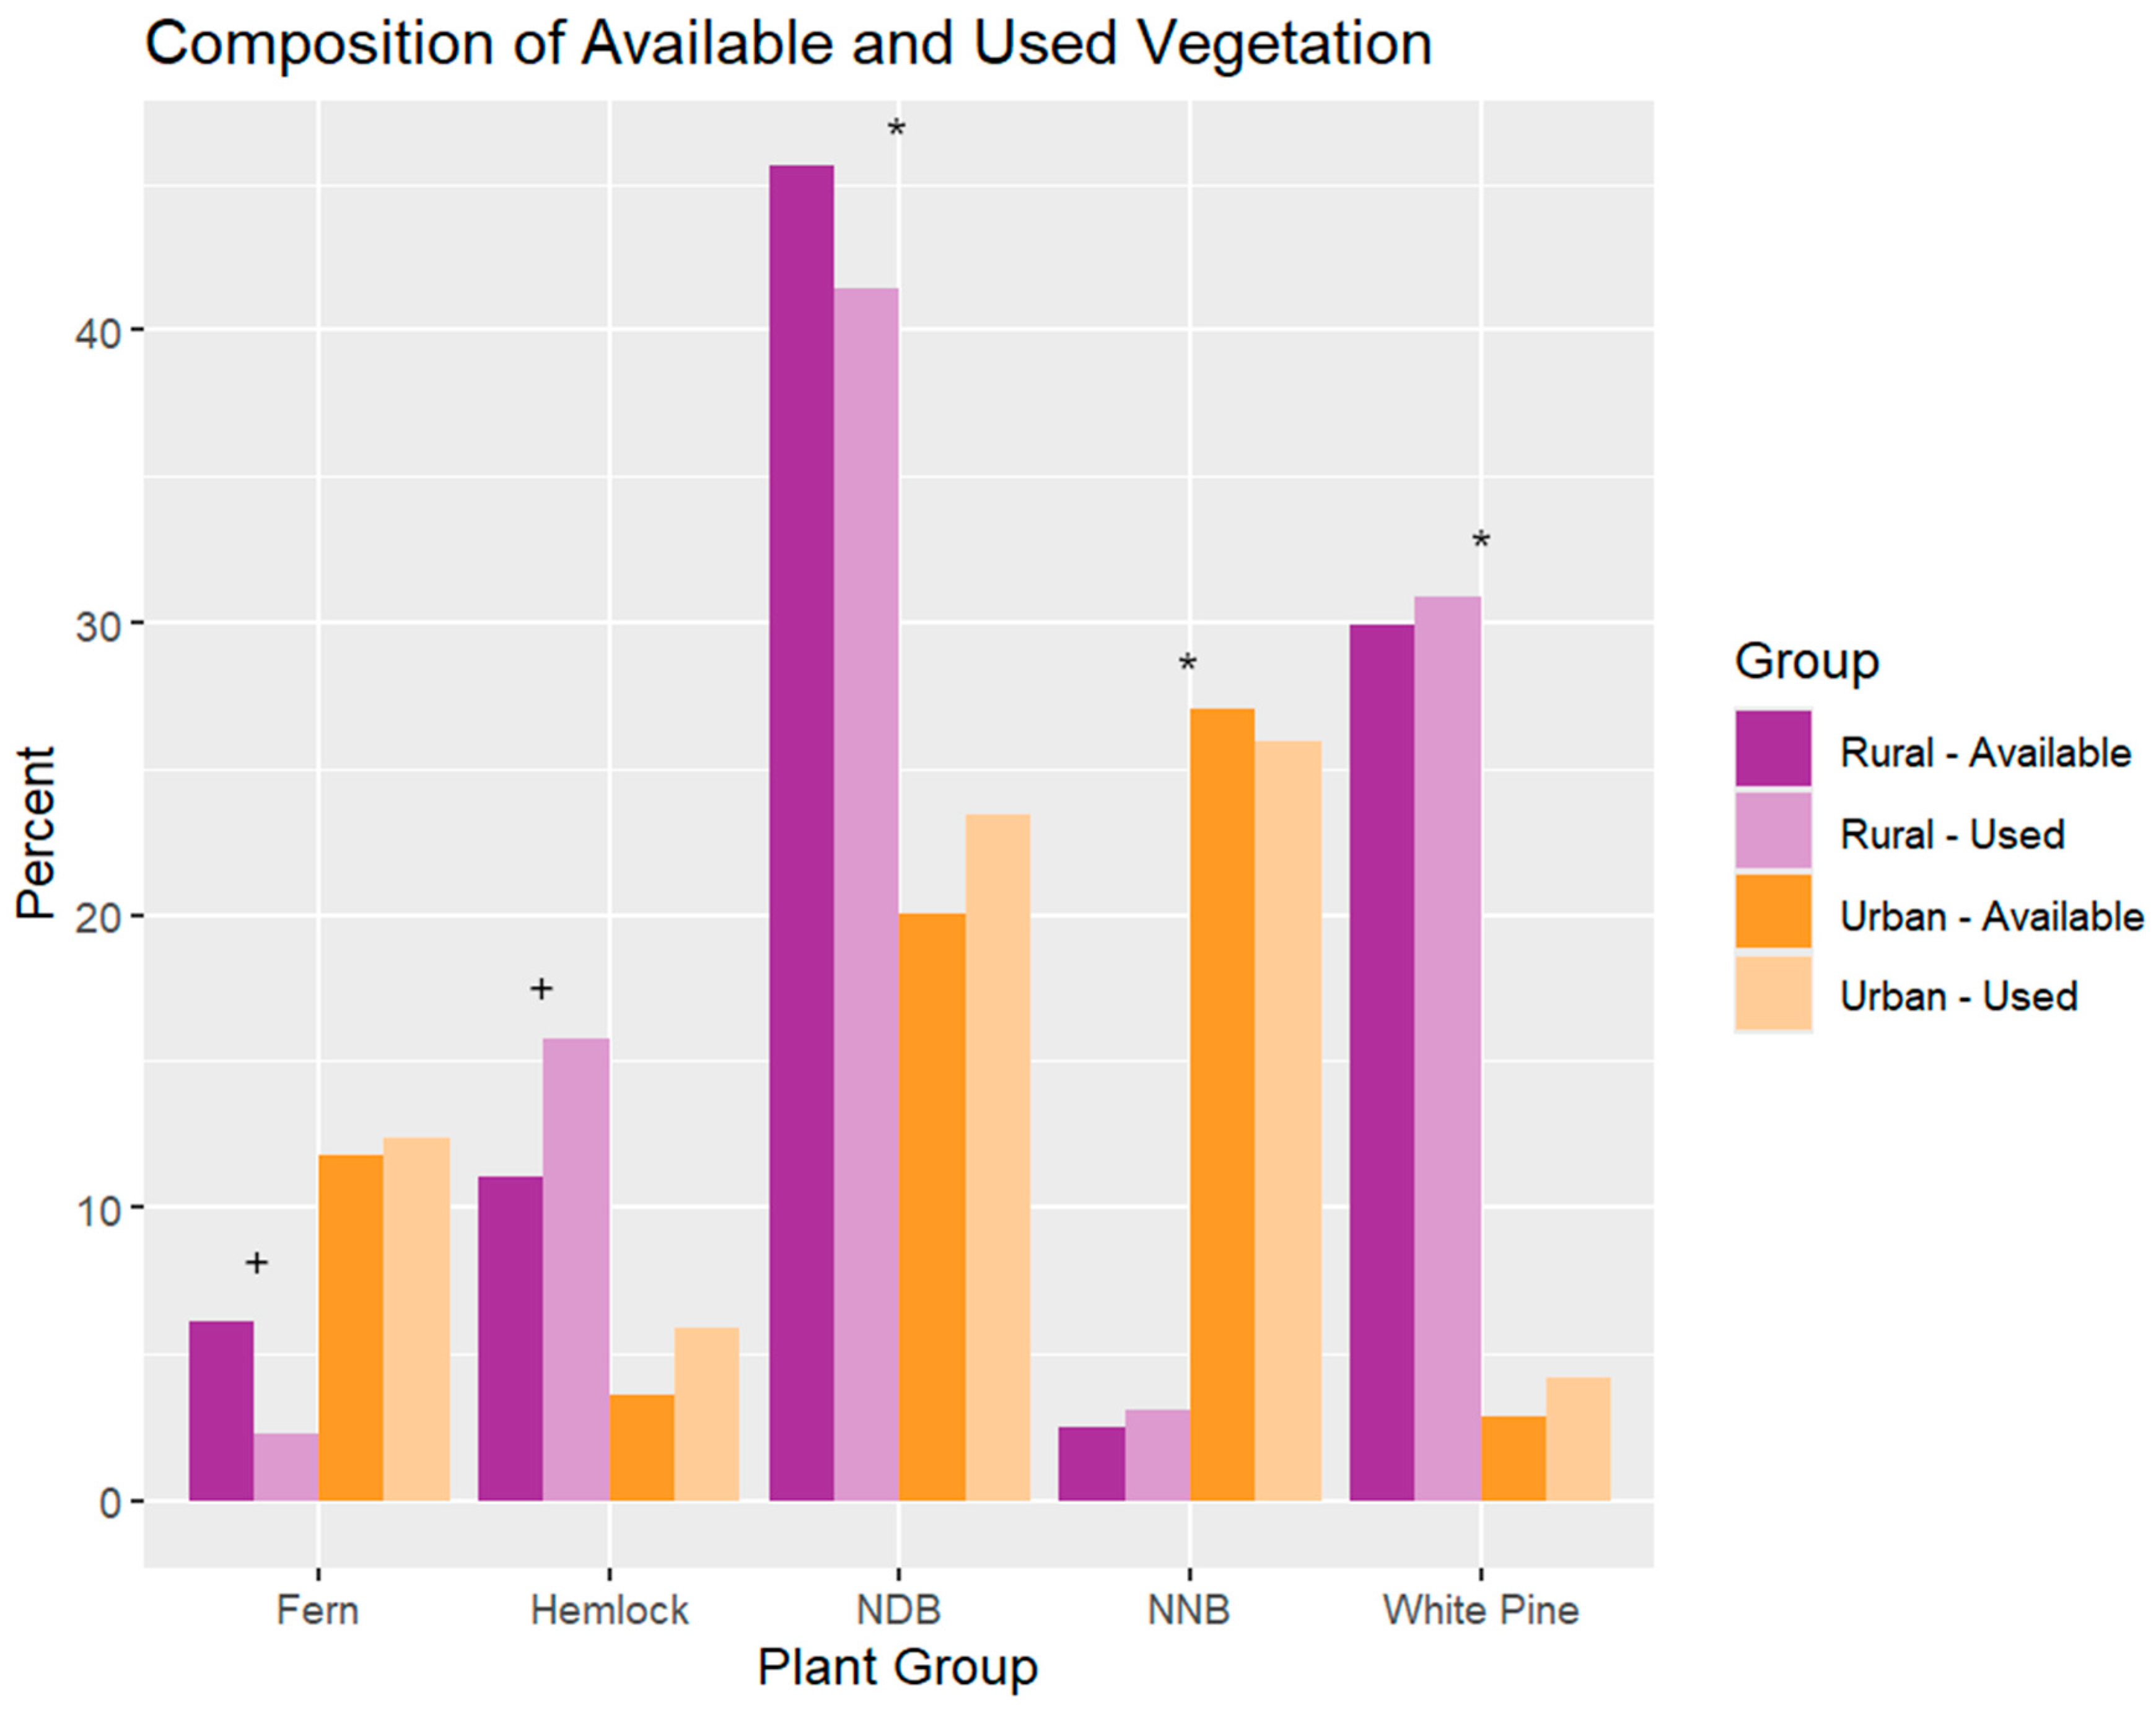
Suburban birds used vegetation groups proportionally to availability (chi-square test: χ2 = 9.16, p = 0.1; Figure 8), while rural birds used eastern hemlock more and ferns less than would be expected based on availability (Chi-square test: χ2 = 66.86, p < 0.001; Figure 8). The composition of available plants was different for rural sites than for suburban sites (Chi-square test: χ2 = 466.9, p < 0.001; Figure 8). The white pine and native deciduous broadleaf plants each made up a greater proportion of the available vegetation at rural points compared to suburban points, while nonnative broadleaf plants made up a greater proportion of the vegetation at suburban points compared to rural points (see Supplementary S3 for post hoc test p-values). Accordingly, rural birds used a higher proportion of the white pine and a lower proportion of non-native broadleaf plants than suburban birds. Rural birds also used a higher proportion of eastern hemlock than suburban birds (Chi-square test: χ2 = 445.17, p < 0.001; Figure 8).

5. Discussion

The survival of fledgling Wood Thrushes in this study did not differ between suburban sites and rural sites. This is a hopeful indication of the ability of suburban forest patches to support viable populations of this declining species, particularly given the critical importance of the fledging life stage for driving population trends. While minimal prior research exists on Wood Thrush fledgling survival in suburban forests, this does support at least one prior study that found that Wood Thrush fledglings can succeed in small forest fragments (with a primarily agricultural matrix in that case) [24] as well as a study suggesting that the fledglings of forest birds can succeed in suburban areas [14]. The movement and habitat use of Wood Thrush fledglings in our study system supports the viability of suburban forest patches, as most suburban fledglings spent the majority of their first few weeks post-fledging within their natal forest patch, and the differences between suburban and rural habitat use were not drastic. However, our results did highlight some clear differences in the movement or mobility of suburban and rural birds, as well as some differences in plant species used.

5.1. Fledglings and the Predation Paradox

Our results on fledgling survival align with previous findings on nest survival and the predation paradox in the literature [7,18,19,21,22,23] and in our previous work [31]. Despite evidence from an overlapping set of study sites, where there are significantly more potential predators for young Wood Thrushes in suburban areas than in rural areas [31], fledgling survival did not differ significantly between suburban and rural sites. To the best of our knowledge, this is one of the first studies comparing fledging survival between urban or suburban and rural habitats (but see [14]), providing evidence of the predation paradox beyond the nesting life stage for birds.
Several hypotheses for mechanisms accounting for the predation paradox have been proposed [19]. We did not directly test these in this study, but our findings may support two of these hypotheses. First, the predator composition hypothesis posits that the suite of predator species is altered in urban or suburban sites, compared to that in rural sites; specifically, it posits that the urban predator species are weaker or more omnivorous than the species in rural predator communities [19]. Data from our previous work suggests that the composition of suburban and rural predators are different from each other in our study landscape [31]. Furthermore, some of the most common confirmed predators on eggs or nestling Wood Thrushes in that study, such as species in the sciurid family, are small-bodied and may not be able to depredate fledglings easily. The second hypothesis is the predator subsidy consumption hypothesis, which posits that the diet of predators in suburban or urban areas shifts to contain fewer depredated animals and more anthropogenic food resources [18,19]. Sciurids are common potential predators in our suburban study landscape [31], and they are an omnivorous and opportunistic species that is known to take advantage of human-provided food resources. Other common potential predators in our study system, including raccoons (Procyon lotor), Virginia opossums (Didelphis virginiana), and birds in the corvid family [31], are also omnivorous and may use suburban resource subsidies [18,19]. These two hypotheses are not mutually exclusive. Further research is needed to identify mechanisms for the predation paradox patterns for both nesting and fledgling birds.
While predation has been documented as the primary source of mortality for fledgling birds, even in urbanized landscapes [9,14,27,28], some studies have recorded anthropogenic causes of mortality as well. Adalsteinsson et al. [9] documented both car and building strikes as a cause of death for some post-dispersal Gray Catbird and Wood Thrush fledglings, and Jackson et al. [47] observed mortality due to window strikes in Eastern Bluebird (Sialia sialis) fledglings. We did not record any sources of direct anthropogenic mortality in this study.

5.2. Fledgling Habitat Use, Movement, and Urbanization

The distances that we observed fledglings traveling in our study were comparable to dispersal distances discussed in other work [10,33,35,46]. We found that rural fledglings moved significantly farther from the nest than their suburban counterparts. Because fledgling Wood Thrushes stay with one or more adults in the first few weeks after fledging [35,36,46,48], this could be a function of adult habitat selection, at least during the first few weeks post-fledging. Research has shown that adult Wood Thrushes and similar species can be either relatively sedentary or relatively mobile while tending to fledgling birds [46,49], in part based on whether or not they are raising another brood [48]. However, given that rural fledglings moved farther than suburban fledglings at all ages (Figure 5), it is likely that fledgling habitat selection itself also played a role in this trend. This could suggest that, similar to Wood Thrushes in other fragmented habitats [36], suburban birds face more barriers to dispersal than rural birds. Another possibility is that suburban fledglings were able to take advantage of resources, such as fruit, which was more readily available in forest patches than in at least some of our rural sites (Straley et al.’s unpublished data), thereby reducing their need to travel. Vega Rivera et al. [35] suggested that foraging is a key factor motivating fledgling movement.
As in other studies [50], fledglings in our study moved farther from the nest as they got older (Figure 5). Regardless of age, however, most suburban birds were found in forested land cover (Figure 3 and Figure 4), supporting the idea that developed land cover may have created barriers to movement for fledglings. Maps of fledging movement (Figure 6) suggest that suburban fledglings that did move outside of forest patches followed forested, and possibly open-land, corridors.
While fledglings of all ages were found primarily in forested land cover (Figure 3 and Figure 4), rural fledglings used a lower proportion of forested habitat and a higher proportion of open habitat as they aged (Figure 4). Visualizing the data over time suggests similar patterns for suburban birds (Figure 4). This supports our prediction that older, more mobile fledglings would use a greater proportion of early successional habitats than younger fledglings. It also supports the literature suggesting that fledglings of mature forest nesting bird species may prefer early successional habitats [46,51,52,53]. Suburban fledglings used developed land at a similar rate to open land, at least initially. We observed a small number of older (post-dispersal age) fledglings using suburban yard vegetation, and we observed fledglings of varying ages using edge habitats in a quarry. However, most fledglings did not use developed landcover (Figure 3), and, overall, our findings suggest that developed areas in our study area were generally avoided by suburban fledglings. Developed land was virtually unavailable for rural fledglings.
Both suburban and rural fledglings used areas with denser stems than would be expected based on availability. This supports our prediction and aligns with other studies that have found that fledgling Wood Thrushes [35,46] and fledglings of other mature forest nesting bird species use denser-than-average vegetation [52]. Furthermore, despite differences in stem density between our rural and suburban sites (rural sites had a greater density of large stems and a lower density of small stems than suburban sites), fledgling survival did not differ, suggesting that fledglings were able to find protective cover in both types of sites. This finding is in line with other work, which has found that the use of dense, understory vegetation may help protect fledglings from predation in both fragmented and unfragmented habitats [26,36] and that dense tangles of invasive shrubs have no negative effect on fledgling bird survival [14]. The differences in stem density between suburban and rural sites is likely a reflection of species composition. We found a higher proportion of white pines in rural sites, with a tendency toward stands of “large”-stemmed saplings. And we found a higher proportion of nonnative woody shrubs in suburban sites, often forming thickets with many “small” stems. The relatively minor differences in the composition of used vegetation between suburban and rural fledglings (Figure 7) also support the idea that fledglings can find the vegetative habitat they require in both types of sites.

5.3. Force-Fledging Reduced Fledgling Survival

Force-fledging, when a nestling leaves the nest before the expected age and level of development, is usually a response to a potential predator. The effects of force-fledging by research observers on the health or later survival of birds has not been studied extensively [54]. The little work that exists found no negative effects of observer force-fledging on fledgling survival [54]. Our findings and our previous work on a subset of the same birds [34] demonstrate that observer force-fledging can have detrimental effects on the survival of fledging Wood Thrushes, at least when radio-tagged birds are not successfully returned to the nest after handling (Figure 2). This has important implications for studies of nesting passerines, particularly for vulnerable or declining species. We developed techniques that successfully encouraged nestlings to stay in the nest: approximately 22% of fledglings were left outside the nest in 2011–2012, before the adoption of these techniques, while <3% of fledglings were left outside the nest in 2016–2017, after the adoption of these techniques. We suggest that similar methods be used, as well as the use of extra caution when handling nestling Wood Thrushes and other vulnerable species.

5.4. Study Limitations and Future Directions

Although the suburban sites in our study were located in closer proximity to each other than the rural sites, which were more widely distributed, fledglings within our suburban sites were exposed to a wide range of conditions typical of the rural to urban interface that characterizes our region. Suburban sites ranged from forest patches adjacent to developed areas but contiguous with extensive forests as well as isolated patches surrounded by residential or commercial development and agricultural land. Furthermore, the midpoint of the range of distances between the closest and farthest apart suburban sites was on a similar order of magnitude as rural sites (5.6 km and 15. 5 km, respectively), and even the distance between the closest suburban sites was greater than the distance recommended to ensure independence among point count survey locations for birds (250 m; [55]). The restriction of fledglings to their natal area for the first few weeks out of the nest further suggests that movements and thus interactions and influences of Wood Thrush pairs do not extend beyond site boundaries. A final consideration is given that site effects were not supported for suburban birds; the comparison of the combined suburban sites to rural sites represents a lack of replication for the former group. We concede that there could conceivably be some characteristic of the Amherst/Hadley area that uniquely influenced fledgling survival and that the results of our study might have been different if we had conducted the study in a different municipality, although the mechanism for that is unclear.
While our rural and suburban data were collected by different observers and in different years, we do not believe that this impacted our results. Radio-tracking methods were consistent across years, except where discussed above. Neither Year nor SiteType were top models in our survival analysis, and the interaction of these terms was not significant. Including a random effect of year in our GLMM did not alter the results. One other limitation comes from the technology we used. Battery life likely limited the amount of data we could collect on older fledglings. It is also possible that tracking birds that dispersed was more difficult in suburban sites than in rural sites, given the barriers and interference that can be caused by buildings and infrastructure. Finally, our sample size of suburban birds was smaller than that of rural birds. This, combined with the high survival of fledglings in our study, reduced the power of subsets of survival data, and therefore we could not include land use or the distance from the nest in the survival models.
Given the differences in distance moved from the nest between suburban and rural fledglings in our study, future work including distance moved from the nest in suburban and rural sites in survival analysis would be valuable. The one study that we know of that looked at distance traveled by suburban Wood Thrush fledglings found that moving farther actually increased survival [9]. Furthermore, asking the same questions that we asked here in an urbanized landscape with less connected forest patches or with forest patches surrounded by a denser urban matrix will give further insight into the generalizability of our findings.

5.5. Conservation Implications and Conclusions

This study, along with our previous work [31], suggests that suburban forest patches can support viable populations of Wood Thrushes. While some important differences in movement and land use exist between suburban and rural fledglings and warrant further study, we suggest that suburban forest patches, especially those with high connectivity, not be overlooked as important habitats for vulnerable, forest-nesting birds such as the Wood Thrush.

Supplementary Materials

The following supporting information can be downloaded at: https://www.mdpi.com/article/10.3390/d17080589/s1.

Author Contributions

Conceptualization: M.L.K., D.I.K., P.S.W. and S.S.; data curation: M.L.K. and S.S.; formal analysis: M.L.K.; funding acquisition: M.L.K., D.I.K., P.S.W. and S.S.; investigation: M.L.K., S.S. and K.S.; methodology: M.L.K., D.I.K. and S.S.; project administration: M.L.K., S.S. and K.S.; resources: D.I.K. and P.S.W.; software: M.L.K.; supervision: D.I.K. and P.S.W.; validation: D.I.K. and P.S.W.; visualization: M.L.K.; writing—original draft: M.L.K.; writing—review and editing: M.L.K., D.I.K., P.S.W., K.S. and S.S. All authors have read and agreed to the published version of the manuscript.

Funding

Funding was from the National Science Foundation (NSF DGE-0907995), U.S. Forest Service Northern Research Station, University of Massachusetts Experiment Station project #MAS00020 (NIFA MacIntire-Stennis), USGS Science Support, and the Bradford G. Blodget Scholarship Fund for Ornithological Studies.

Institutional Review Board Statement

All survey protocols were reviewed and approved by the Institutional Animal Care and Review Committees (IACUC) at the University of Massachusetts Amherst (protocol 2011-0026/2014-0043; approved in 2011 and edited/reapproved in 2013, 2014, and 2015.

Data Availability Statement

Data are provided as private-for-peer review via the following links: https://figshare.com/s/d4ae3b1acc8f1af63505 (accessed on 22 June 2025); https://figshare.com/s/3491a634929f3e7a8edf (accessed on 22 June 2025); https://figshare.com/s/4d29756f6de627357709 (accessed on 22 June 2025); and https://figshare.com/s/0b4b0de4bf25b63f45a1 (accessed on 22 June 2025).

Acknowledgments

Fieldwork would not have been possible without the gracious permission from several private landowners, the Town of Amherst, the City of Springfield, the Massachusetts Department of Conservation and Recreation, the Massachusetts Division of Fisheries and Wildlife, and the University of Massachusetts Amherst. We thank our hardworking field technicians: Brett Bailey, Thomas Cardona, Matt Cleveland, Evan Dalton, Kevin DeGiacomo, Corinne Hultman, Erika Kane, Kallin Lang, Meghan Lout, Nate Sacks, Jeff Ritterson, Matt Smith, Chris Villante, and Arianna Wills. We thank Todd Fuller and Robert Ryan for manuscript review and Mike Akresh for statistical assistance. We thank the developers of several R packages (Dplyr, Tidyr, Magrittr) that made cleaning and organizing our data much less onerous. These include S. Bache, R. François, M. Girlich, L. Henry, K. Müller, and H. Wickham.

Conflicts of Interest

The authors declare no conflicts of interest.

References

  1. Rosenberg, K.V.; Dokter, A.M.; Blancher, P.J.; Sauer, J.R.; Smith, A.C.; Smith, P.A.; Stanton, J.C.; Panjabi, A.; Helft, L.; Parr, M.; et al. Decline of the North American Avifauna. Science 2019, 366, 120–124. [Google Scholar] [CrossRef]
  2. Wintle, B.A.; Kujala, H.; Whitehead, A.; Cameron, A.; Veloz, S.; Kukkala, A.; Moilanen, A.; Gordon, A.; Lentini, P.E.; Cadenhead, N.C.R.; et al. Global Synthesis of Conservation Studies Reveals the Importance of Small Habitat Patches for Biodiversity. Proc. Natl. Acad. Sci. USA 2019, 116, 909–914. [Google Scholar] [CrossRef]
  3. Iossa, G.; Soulsbury, C.D.; Baker, P.J.; Harris, S. A Taxonomic Analysis of Urban Carnivore Ecology. In Urban Carnivores: Ecology, Conflict, and Conservation; Gehrt, S.D., Riley, S.P.D., Cypher, B.L., Eds.; John Hopkins University Press: Baltimore, MD, USA, 2010; pp. 173–180. [Google Scholar]
  4. Pickett, S.T.A.; Cadenasso, M.L.; Grove, J.M.; Nilon, C.H.; Pouyat, R.V.; Zipperer, W.C.; Costanza, R. Urban Ecological Systems: Linking Terrestrial Ecological, Physical, and Socioeconomic Components of Metropolitan Areas. Annu. Rev. Ecol. Syst. 2001, 32, 127–157. [Google Scholar] [CrossRef]
  5. Duren, A.M.; Williams, C.K.; D’Amico, V. Microhabitat Factors Associated with Occupancy of Songbirds in Suburban Forest Fragments in the Eastern United States. Am. Midl. Nat. 2017, 178, 189–202. [Google Scholar] [CrossRef]
  6. Croci, S.; Butet, A.; Georges, A.; Aguejdad, R.; Clergeau, P. Small Urban Woodlands as Biodiversity Conservation Hot-Spot: A Multi-Taxon Approach. Landsc. Ecol. 2008, 23, 1171–1186. [Google Scholar] [CrossRef]
  7. Rodewald, A.D.; Shustack, D.P. Urban Flight: Understanding Individual and Population-Level Responses of Nearctic-Neotropical Migratory Birds to Urbanization. J. Anim. Ecol. 2008, 77, 83–91. [Google Scholar] [CrossRef]
  8. Rodewald, A.D.; Kearns, L.J.; Shustack, D.P. Consequences of Urbanizing Landscapes to Reproductive Performance of Birds in Remnant Forests. Biol. Conserv. 2013, 160, 32–39. [Google Scholar] [CrossRef]
  9. Adalsteinsson, S.A.; Buler, J.J.; Bowman, J.L.; D’Amico, V.; Ladin, Z.S.; Shriver, W.G. Post-Independence Mortality of Juveniles Is Driven by Anthropogenic Hazards for Two Passerines in an Urban Landscape. J. Avian Biol. 2018, 49, e01555. [Google Scholar] [CrossRef]
  10. Powell, L.A.; Scott, L.J.; Hass, J.T.; Fragment, F. Nesting Success and Juvenile Survival for Wood Thrushes in an Eastern Iowa Forest Fragment. Pap. Nat. Resour. 2003, 419, 120–127. [Google Scholar]
  11. Brown, W.P.; Roth, R.R. Juvenile Survival and Recruitment of Wood Thrushes Hylocichla Mustelina in a Forest Fragment. J. Avian Biol. 2004, 35, 316–326. [Google Scholar] [CrossRef]
  12. Heide, K.T.; Friesen, L.E.; Martin, V.E.; Cheskey, E.D.; Cadman, M.D.; Norris, D.R. Before-and-after Evidence That Urbanization Contributes to the Decline of a Migratory Songbird. Avian Conserv. Ecol. 2023, 18, 15. [Google Scholar] [CrossRef]
  13. Morozov, N.S. The Role of Predators in Shaping Urban Bird Populations. 4. The Urban Predation Paradox and Its Probable Causes. Biol. Bull. 2022, 49, 1406–1432. [Google Scholar] [CrossRef]
  14. Ausprey, I.J.; Rodewald, A.D. Postfledging Survivorship and Habitat Selection Across a Rural-to-Urban Landscape Gradient. Auk 2011, 128, 293–302. [Google Scholar] [CrossRef]
  15. Morozov, N.S. The Role of Predators in Shaping Urban Bird Populations: 2. Is Predation Pressure Increased or Decreased in Urban Landscapes? Biol. Bull. 2022, 49, 1081–1104. [Google Scholar] [CrossRef]
  16. Shochat, E.; Lerman, S.B.; Anderies, J.M.; Warren, P.S.; Faeth, S.H.; Nilon, C.H. Invasion, Competition, and Biodiversity Loss in Urban Ecosystems. BioScience 2010, 60, 199–208. [Google Scholar] [CrossRef]
  17. Faeth, S.H.; Warren, P.S.; Shochat, E.; Marussich, W.A. Trophic Dynamics in Urban Communities. Bioscience 2005, 55, 399–407. [Google Scholar] [CrossRef]
  18. Rodewald, A.D.; Kearns, L.J. Anthropogenic Resource Subsidies Decouple Predator–Prey Relationships. Ecol. Appl. 2011, 21, 936–943. [Google Scholar] [CrossRef]
  19. Fischer, J.D.; Cleeton, S.H.; Lyons, T.P.; Miller, J.R. Urbanization and the Predation Paradox: The Role of Trophic Dynamics in Structuring Vertebrate Communities. Bioscience 2012, 62, 809–818. [Google Scholar] [CrossRef]
  20. Patten, M.A.; Bolger, D.T. Variation in Top-down Control of Avian Reproductive Success across a Fragmentation Gradient. Oikos 2003, 101, 479–488. [Google Scholar] [CrossRef]
  21. Rodewald, A.D.; Shustack, D.P. Consumer Resource Matching in Urbanizing Landscapes: Are Synanthropic Species over-Matching? Ecology 2008, 89, 515–521. [Google Scholar] [CrossRef]
  22. Chamberlain, D.E.; Cannon, A.R.; Toms, M.P.; Leech, D.I.; Hatchwell, B.J.; Gaston, K.J. Avian Productivity in Urban Landscapes: A Review and Meta-Analysis. Ibis 2009, 151, 1–18. [Google Scholar] [CrossRef]
  23. Vincze, E.; Seress, G.; Lagisz, M.; Nakagawa, S.; Dingemanse, N.J.; Sprau, P. Does Urbanization Affect Predation of Bird Nests? A Meta-Analysis. Front. Ecol. Evol. 2017, 5, 29. [Google Scholar] [CrossRef]
  24. Hayes, S.M.; Boyd, B.P.; Israel, A.M.; Stutchbury, B.J.M. Natal Forest Fragment Size Does Not Predict Fledgling, Pre-Migration or Apparent Annual Survival in Wood Thrushes. Ornithol. Appl. 2024, 126, duad054. [Google Scholar] [CrossRef]
  25. Donovan, T.M.; Thompson, F.R.I. Modeling the Ecological Trap Hypothesis: A Habitat and Demographic Analysis for Migrant Songbirds. Ecol. Appl. 2001, 11, 871–882. [Google Scholar] [CrossRef]
  26. Cox, W.A.; Thompson, F.R.; Cox, A.S.; Faaborg, J. Post-Fledging Survival in Passerine Birds and the Value of Post-Fledging Studies to Conservation. J. Wildl. Manag. 2014, 78, 183–193. [Google Scholar] [CrossRef]
  27. Naef-Daenzer, B.; Grüebler, M.U. Post-Fledging Survival of Altricial Birds: Ecological Determinants and Adaptation. J. Field Ornithol. 2016, 87, 227–250. [Google Scholar] [CrossRef]
  28. Shipley, A.A.; Murphy, M.T.; Elzinga, A.H. Residential Edges as Ecological Traps: Postfledgling Survival of a Ground-Nesting Passerine in a Forested Urban Park. Auk 2013, 130, 501–511. [Google Scholar] [CrossRef]
  29. Jenkins, J.M.A.; Thompson, F.R.; Faaborg, J. Contrasting Patterns of Nest Survival and Postfledging Survival in Ovenbirds and Acadian Flycatchers in Missouri Forest Fragments. Condor 2016, 118, 583–596. [Google Scholar] [CrossRef]
  30. Schmidt, K.A.; Rush, S.A.; Ostfeld, R.S. Wood Thrush Nest Success and Post-Fledging Survival across a Temporal Pulse of Small Mammal Abundance in an Oak Forest. J. Anim. Ecol. 2008, 77, 830–837. [Google Scholar] [CrossRef] [PubMed]
  31. Klein, M. Conservation Value of Suburban Woodlands for a Declining Songbird. Ph.D. Thesis, University of Massachusetts, Amherst, MA, USA, 2023. [Google Scholar]
  32. Anders, A.D.; Dearborn, D.C.; Faaborg, J.; Thompson, F.R.I. Juvenile Survival in a Population of Neotropical Migrant Birds. Conserv. Biol. 1997, 11, 698–707. [Google Scholar] [CrossRef]
  33. Lang, J.D.; Powell, L.A.; Krementz, D.G.; Conroy, M.J. Wood Thrush Movements and Habitat Use: Effects of Forest Management for Red-Cockaded Woodpeckers. Auk 2002, 119, 109–124. [Google Scholar] [CrossRef]
  34. Schlossberg, S.; King, D.I.; Destefano, S.; Hartley, M. Effects of Early-Successional Shrubland Management on Breeding Wood Thrush Populations. J. Wildl. Manag. 2018, 82, 1572–1581. [Google Scholar] [CrossRef]
  35. Vega Rivera, J.H.; Rappole, J.H.; McShea, W.J.; Haas, C.A. Wood Thrush Postfledging Movements and Habitat Use in Northern Virginia. Condor 1998, 100, 69–78. [Google Scholar] [CrossRef]
  36. Fink, M.L. Post-Fledgling Ecology of Juvenile Wood Thrush in Fragmented and Contiguous Landscapes; ProQuest Information and Learning: Ann Arbor, MI, USA, 2003. [Google Scholar]
  37. Bureau of Geographic Information (MassGIS) Commonwealth of Massachusetts; Executive Office of Technology and Security Services: Boston, MA, USA, 2005.
  38. Ralph, C.J.; Sauer, J.R.; Droege, S. Monitoring Bird Populations by Point Counts; U.S. Department of Agriculture, Forest Service, Pacific Southwest Research Station: Albany, NY, USA, 1995; p. 187. [Google Scholar]
  39. Martin, T.E.; Geupel, G.R. Nest-Monitoring Plots—Methods for Locating Nests and Monitoring Success. J. Field Ornithol. 1993, 64, 507–519. [Google Scholar]
  40. Streby, H.M.; McAllister, T.L.; Peterson, S.M.; Kramer, G.R.; Lehman, J.A.; Andersen, D.E. Minimizing Marker Mass and Handling Time When Attaching Radiotransmitters and Geolocators to Small Songbirds. Condor 2015, 117, 249–255. [Google Scholar] [CrossRef]
  41. White, G.C.; Burnham, K.P. Program Mark: Survival Estimation from Populations of Marked Animals. Bird Study 1999, 46, S120–S139. [Google Scholar] [CrossRef]
  42. R Core Team. R: A Language and Environment for Statistical Computing; R Foundation for Statistical Computing: Vienna, Austria, 2022. [Google Scholar]
  43. Laake, J. RMark: An R Interface for Analysis of Capture-Recapture Data with MARK; National Marine Mammal Laboratory: Seattle, WA, USA, 2013. [Google Scholar]
  44. Dinsmore, S.J.; Dinsmore, J.J. Modeling Avian Nest Survival in Program Mark. Stud. Avian Biol. 2007, 34, 73–83. [Google Scholar]
  45. King, D.I.; DeGraaf, R.M.; Smith, M.L.; Buonaccorsi, J.P. Habitat Selection and Habitat-Specific Survival of Fledgling Ovenbirds (Seiurus aurocapilla). J. Zool. 2006, 269, 414–421. [Google Scholar] [CrossRef]
  46. Anders, A.D.; Faaborg, J.; Thompson, F.R.I. Postfledging Dispersal, Habitat Use, and Home-Range Size of Juvenile Wood Thrushes. Auk 1998, 115, 349–358. [Google Scholar] [CrossRef]
  47. Jackson, A.K.; Froneberger, J.P.; Cristol, D.A. Postfledging Survival of Eastern Bluebirds in an Urbanized Landscape. J. Wildl. Manag. 2011, 75, 1082–1093. [Google Scholar] [CrossRef]
  48. Rivera, J.H.V.; Haas, C.A.; Rappole, J.H.; Mcshea, W.J. Parental Care of Fledgling Wood Thrushes. Wilson Bull. 2000, 112, 233–237. [Google Scholar] [CrossRef]
  49. White, J.D.; Faaborg, J. Post-Fleding Movement and Spatial Habitat-Use Patterns of Juvenile Swainson’s Thrushes. Wilson J. Ornithol. 2008, 120, 62–73. [Google Scholar] [CrossRef]
  50. Zhou, B.; Ye, H.; Shi, J.; Xia, C.W.; Deng, W.H. Postfledging Survival and Movements of Juvenile Gray-Backed Thrushes (Turdus hortulorum). Wilson J. Ornithol. 2021, 133, 651–659. [Google Scholar] [CrossRef]
  51. Marshall, M.R.; DeCecco, J.A.; Williams, A.B.; Gale, G.A.; Cooper, R.J. Use of Regenerating Clearcuts by Late-Successional Bird Species and Their Young during the Post-Fledging Period. For. Ecol. Manag. 2003, 183, 127–135. [Google Scholar] [CrossRef]
  52. Vitz, A.C.; Rodewald, A.D. Can Regenerating Clearcuts Benefit Mature-Forest Songbirds? An Examination of Post-Breeding Ecology. Biol. Conserv. 2006, 127, 477–486. [Google Scholar] [CrossRef]
  53. Chandler, C.C.; King, D.I.; Chandler, R.B. Do Mature Forest Birds Prefer Early-Successional Habitat during the Post-Fledging Period? For. Ecol. Manag. 2012, 264, 1–9. [Google Scholar] [CrossRef]
  54. Streby, H.M.; Peterson, S.M.; Lehman, J.A.; Kramer, G.R.; Iknayan, K.J.; Andersen, D.E. The Effects of Force-Fledging and Premature Fledging on the Survival of Nestling Songbirds. Ibis 2013, 155, 616–620. [Google Scholar] [CrossRef]
  55. Ralph, C.J.; Droege, S.; Sauer, J.R. Managing and Monitoring Birds Using Point Counts: Standards and Applications; USDA Forest Service General Technical Report; Department of Agriculture, Forest Service, Pacific Southwest Research Station: Albany, CA, USA, 1995; pp. 161–168. [Google Scholar]
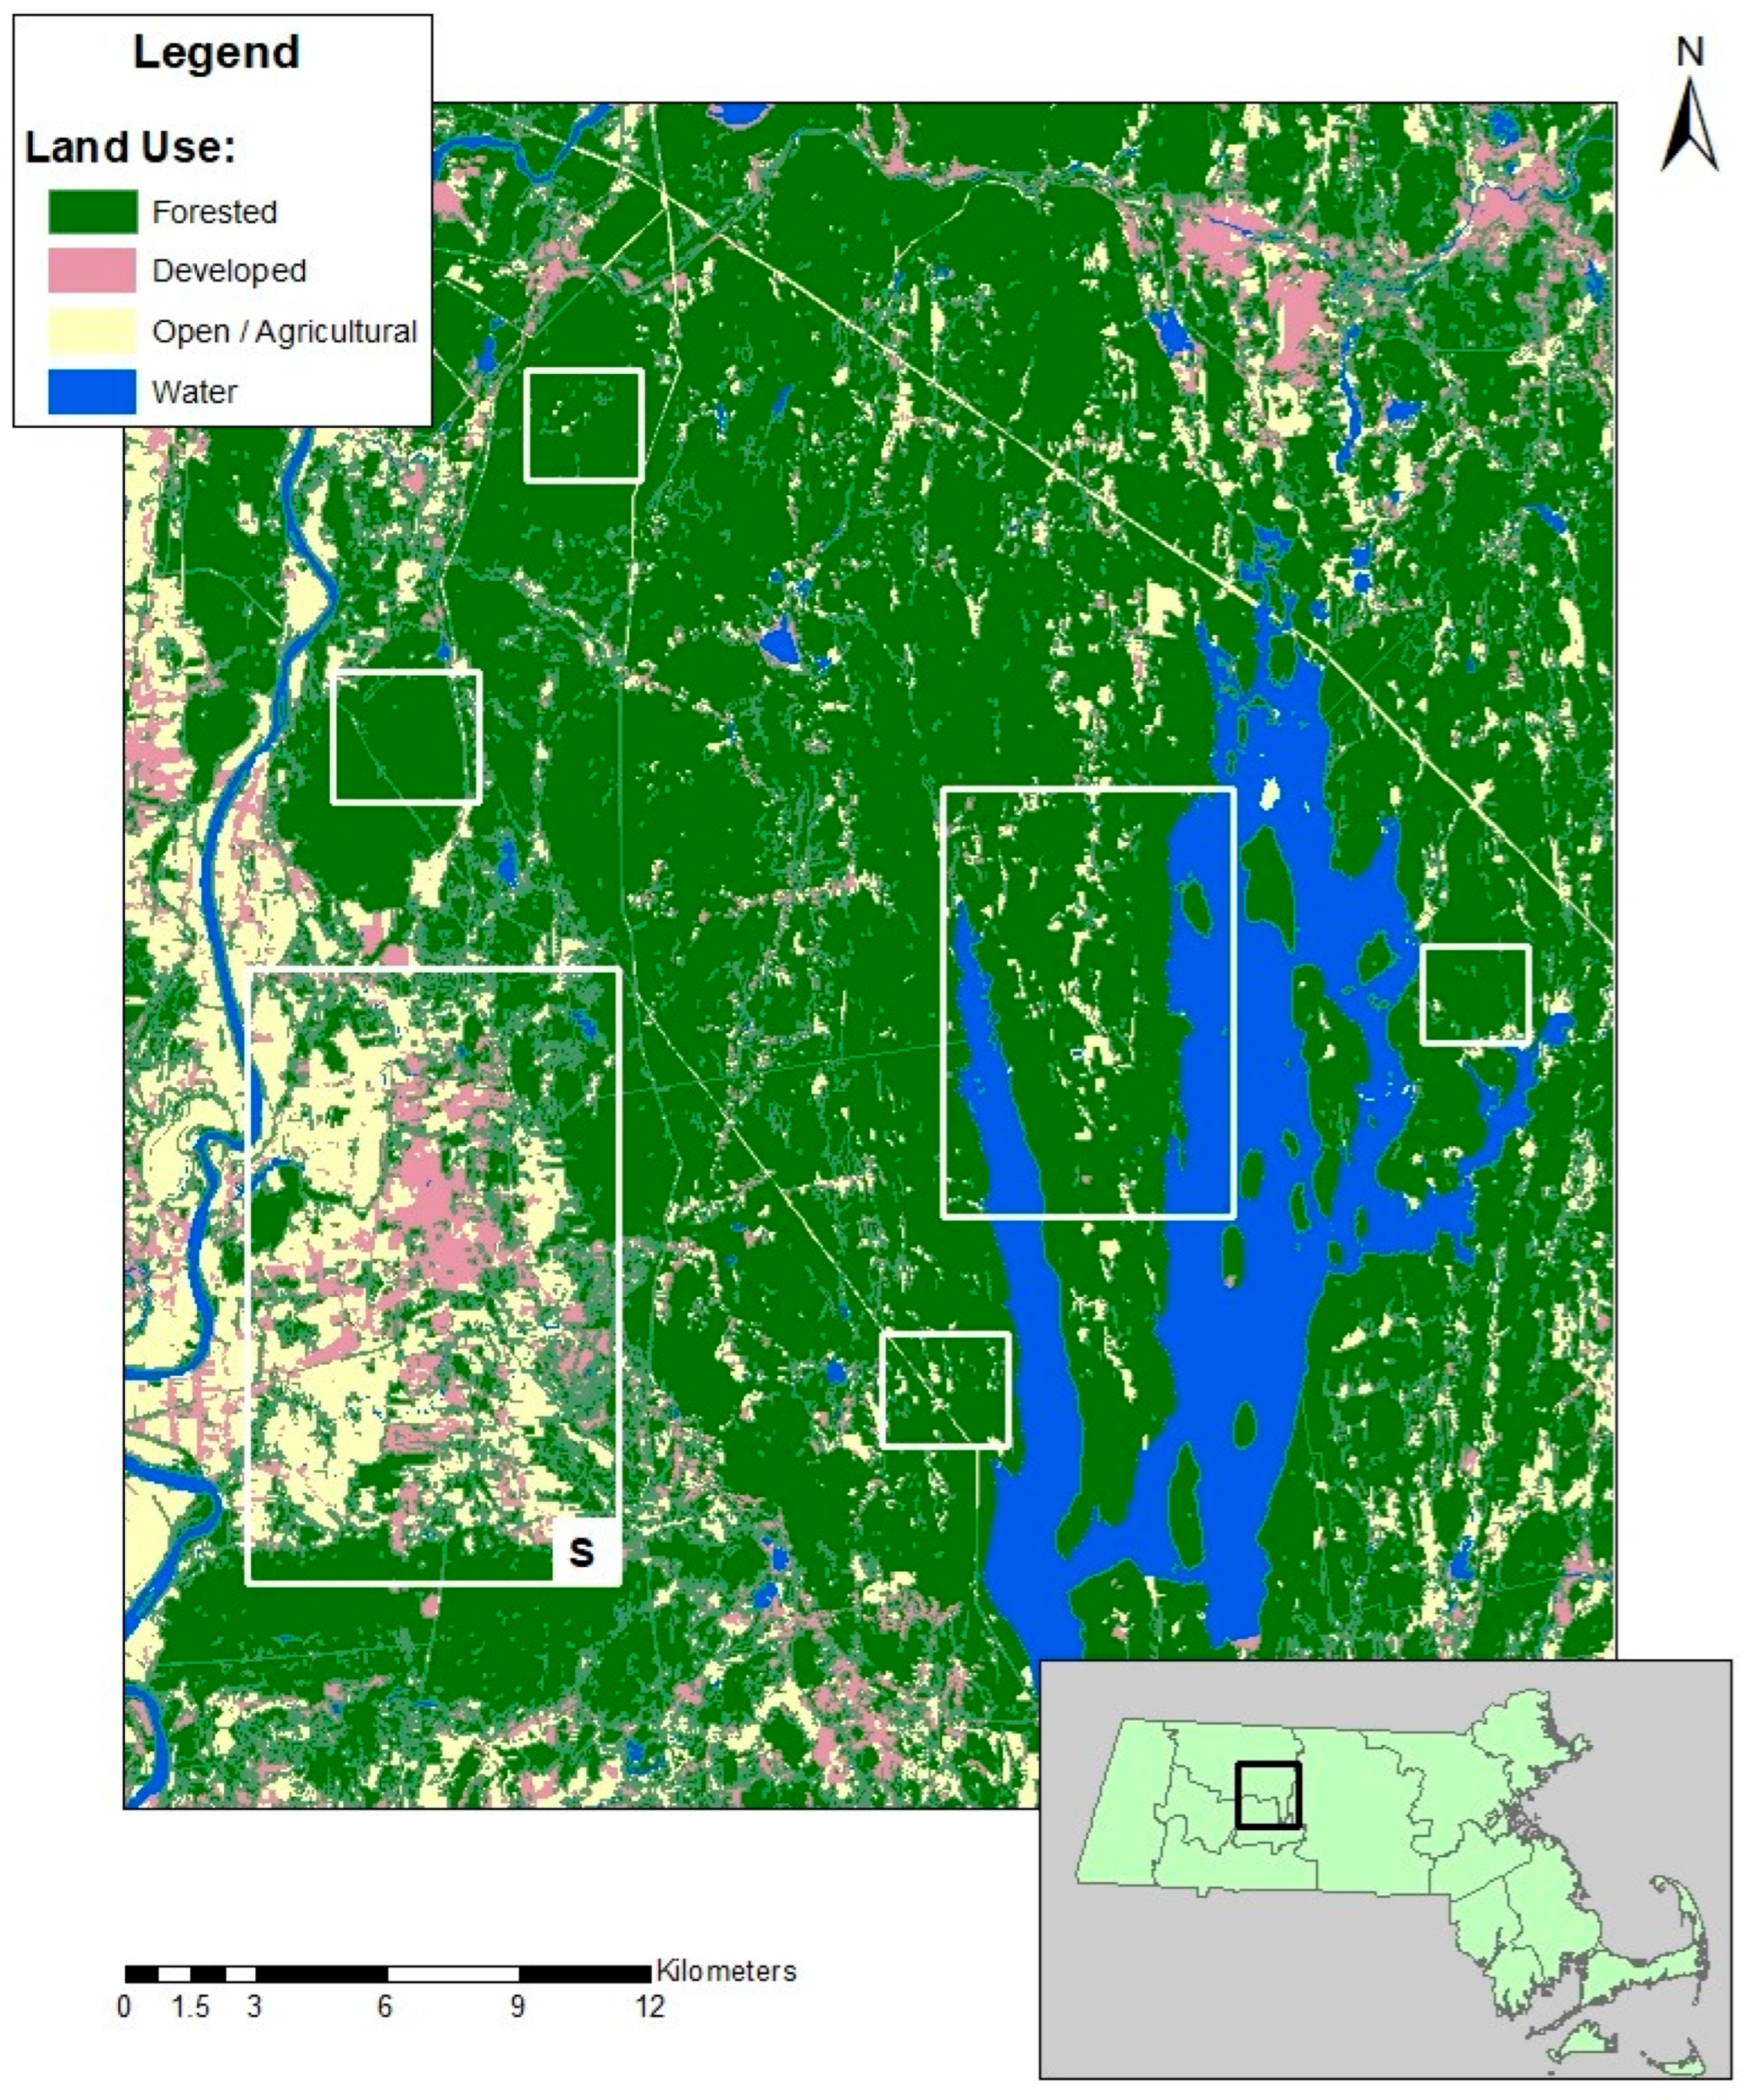
Figure 1. Map of the study areas where fledglings were tagged: The box marked with “S” demarcates the suburban study area, while the other 5 boxes demarcate rural study areas. Land use categories are shown. The inset map of Massachusetts shows county boundaries and the broader study area with a black rectangle. The land use layer is from MassGIS [37].
Diversity 17 00589 g001
Figure 2. Daily survival rate (DSR) of Wood Thrush fledglings, based on the additive (Ground + FAge) survival model. Ground = the binary covariate for leaving a bird on the ground after force-fledgling vs. leaving it back in the nest, and Fage = the age of the fledgling, starting the day of leaving the nest. The plot was created in R using the ggplot2 package (v. 3.5.2).
Diversity 17 00589 g002
Figure 3. Frequency of observations in each land use category [forested (FORE), non-forested developed (NFDE), and non-forested open (NFOP)] for each fledgling over the entire sampling period. Individual data points (individual birds) are in yellow, while outliers for boxplots are in black. “Jitter” has been applied to the points, introducing random noise so that points are not overlapping for easier viewing. The plot was created in R using the ggplot2 package (v. 3.5.2).
Diversity 17 00589 g003
Figure 4. Proportion of fledglings using each land use category [Forest (FORE), non-forested developed (NFDE), and non-forested open (NFOP)] on each day (top: rural and bottom: suburban). LOESS curves were plotted. The plot was created in R using the ggplot2 package (v. 3.5.2).
Diversity 17 00589 g004
Figure 5. Examples of dispersal movements over time by individual fledglings in rural (top) and suburban (bottom) sites. Larger, white circles indicate the first location recorded for each fledgling. Note that the scale bar changes for each bird’s map. Radio tag number(s)/letter(s) of the fledgling(s) is under each map. The land use layer is from MassGIS [37].
Diversity 17 00589 g005
Figure 6. Distance from the nest by the number of days post-fledge for suburban and rural birds with outliers (top) and without outliers (bottom). LOESS curves were plotted. The plot was created in R using the ggplot2 package (v 3.5.2).
Diversity 17 00589 g006
Figure 7. Stem density of small (topA,C) and large (bottomB,D) stems by survey type (leftA,B) and site type (rightC,D). Colored dots are individual survey points (jitter applied), while black points are box plot outliers. “Jitter” has been applied to the points, introducing random noise so that points are not overlapping for easier viewing. The plot was created in R using the ggplot2 package (v 3.5.2).
Diversity 17 00589 g007
Figure 8. Plant composition (percent of all pole contacts) use and availability for fledglings. NDB = native deciduous broadleaf, NNB = non-native broadleaf. * = significantly different (p < 0.05) based on the chi-squared test between available suburban and rural points; + = significantly different (p < 0.05) between fledgling and random points. The plot was created in R using the ggplot2 package (v. 3.5.2).
Diversity 17 00589 g008
Table 1. Summary data of radio-tagged Wood Thrush fledglings included in the survival analysis. * Because the study sites were used in more than one year, the number of sites in each year sums to greater than 100%.
2011201220162017All Years
Total fledglings4090362168
  Total rural fledglings29700099
  Total suburban fledglings 112036269
      
Total nests193920280
  Total rural nests14290043
Mean fledglings per nest2.12.4NANA2.3
  Total suburban nests51020237
Mean fledglings per nest2.22.01.81.01.9
      
Total sites51012120 *
  Total rural sites35005
  Total suburban sites2512115
Mean fledglings per site89328.4
Table 2. Akaike information criterion (AIC) comparison, corrected for small sample sizes, of RMark “nest survival” models for Wood Thrush fledglings. ~1 = null/intercept only model. Continuous covariates are “FAge” (the age of the fledgling, starting the day of leaving the nest) and “Time” (the day of the year). Categorical covariates are “Ground” (the binary covariate for leaving a bird on the ground after force-fledgling vs. leaving it back in the nest), “SiteType” (suburban vs. rural site), and “Year” (year of the survey 2011, 2012, 2016, or 2017). An asterisk indicates an interaction model. All models are single-variable models except for those indicated with an interaction or addition sign. S = survival.
ModelNparAICcDeltaAICcWeightDeviance
S(~Ground × FAge)4265.295306.70 × 10−1257.2847
S(~Ground + FAge)3267.05541.7600562.78 × 10−1261.049
S(~FAge)2270.38815.092825.25 × 10−2266.385
S(~Ground)2283.115417.82019.04 × 10−5279.1122
S(~Ground × SiteType)4284.988519.693213.54 × 10−5276.9779
S(~1)1287.841322.5459798.51 × 10−6285.8402
S(~Time)2289.243923.948564.22 × 10−6285.2407
S(~SiteType)2289.827124.531753.15 × 10−6285.8239
S(~Year)4293.038427.743096.33 × 10−7285.027
Table 3. Generalized linear mixed-model (log gamma link) results for fledgling distance from the nest. The full model contains fixed effects, namely site type (suburban vs. rural), days since fledging, and random effects, namely individual bird/tag ID and nest ID. Nest and bird models contain all but the other random effect. DaysOnly and SiteOnly contain both random effects.
ModelDegrees of FreedomAIC
Full614,930.03
Nests514,949.21
Birds514,944.38
Fixed Only415,109.68
DaysOnly315,163.86
SiteOnly315,868.86
Disclaimer/Publisher’s Note: The statements, opinions and data contained in all publications are solely those of the individual author(s) and contributor(s) and not of MDPI and/or the editor(s). MDPI and/or the editor(s) disclaim responsibility for any injury to people or property resulting from any ideas, methods, instructions or products referred to in the content.