Article

Predicting Range Shifts in the Distribution of Arctic/Boreal Plant Species Under Climate Change Scenarios

1
MOE Key Laboratory of Biodiversity Science and Ecological Engineering, Beijing Normal University, Beijing 100875, China
2
College of Life Sciences, Beijing Normal University, Beijing 100875, China
3
Kunming No. 1 High School, Kunming 650031, China
4
Forestry Bureau of Longmen County, Huizhou 516800, China
*
Author to whom correspondence should be addressed.
These authors contributed equally to this work.
Diversity 2025, 17(8), 558; https://doi.org/10.3390/d17080558
Submission received: 24 June 2025 / Revised: 21 July 2025 / Accepted: 30 July 2025 / Published: 7 August 2025
(This article belongs to the Section Plant Diversity)

Abstract

Climate warming is anticipated to significantly alter the distribution and composition of plant species in the Arctic, thereby cascading through food webs and affecting both associated fauna and entire ecosystems. To elucidate the trend in plant distribution in response to climate change, we employed the MaxEnt model to project the future ranges of 25 representative Arctic and Circumpolar plant species (including grasses and shrubs). Species distribution data, in conjunction with bioclimatic variables derived from climate projections of three selected General Circulation Models (GCMs), ESM2, IPSl, and MPIE, were utilized to fit the MaxEnt models. Subsequently, we predicted the potential distributions of these species under three Shared Socioeconomic Pathways (SSPs)—SSP126, SSP245, and SSP585—across a timeline spanning 2010, 2050, 2100, 2200, 2250, and 2300 AD. Range shift indices were applied to quantify changes in plant distribution and range sizes. Our results show that the ranges of nearly all species are projected to diminish progressively over time, with a more pronounced rate of reduction under higher emission scenarios. The species are generally expected to shift northward, with the distances of these shifts positively correlated with both the time intervals from the current state and the intensity of thermal forcing associated with the SSPs. Arctic species (A_Spps) are anticipated to face higher extinction risks compared to Boreal–Arctic species (B_Spps). Additional indices, such as range gain, loss, and overlap, consistently corroborate these patterns. Notably, the peak range shift speeds differ markedly between SSP245 and SSP585, with the latter extending beyond 2100 AD. In conclusion, under all SSPs, A_Spps are generally expected to experience more significant range shifts than B_Spps. In the SSP585 scenario all species are projected to face substantial range reductions, with Arctic species being more severely affected and consequently facing the highest extinction risks. These findings provide valuable insights for developing conservation recommendations for polar plant species and have significant ecological and socioeconomic implications.

1. Introduction

Biodiversity confronts significant challenges in an increasingly warming world, leading to the malfunction of ecosystem processes and a diminished provision of ecosystem services and benefits [1,2,3,4,5], thereby disrupting nature’s multifaceted contributions to people (NCP) [6,7,8]. The Arctic is at the forefront of climate change-induced ecosystem upheaval [9,10,11,12] and species reshuffling within biological communities [13,14,15,16], attributable to three major situations in the region: a rate of temperature increases above the global average [17,18]; dead ends for cold-dependent species [19]; and ‘Arctic squeezing’ due to competition from lower latitude counterparts [20].
Current research in the Arctic has primarily focused on ecosystem-level responses or the responses of functional groups, with a disproportionately low emphasis on species-level dynamics [9,14,21,22,23,24]. However, ecosystem function and biodiversity cannot be adequately addressed in climate change studies without incorporating species-level information [25], especially when forecasting future trends is essential for climate-adaptive management and conservation efforts. Keystone species are fundamental to ecosystem health. Green plants, as primary producers, play a critical role in this process [26,27,28]. Most species have unique evolutionary histories that enable them to adapt to the specific environmental conditions they have encountered and thus may respond differently to climate change [29,30], in line with the multidimensional characteristics of anthropogenically induced climate change through additional greenhouse gas (GHG) emissions [31,32,33]. Surprisingly, species-level studies on the climate responses of Arctic plants, especially multi-species research across the entire Arctic, are scarce. Arctic greening and browning, in addition to shrubification, have been highlighted in global change studies for over a decade [34,35,36,37,38,39,40,41,42]; however, their taxonomic resolutions are not satisfactory.
Admittedly, well-designed ground surveys and in situ research are challenging to conduct over large spatial extents, with plot-level surveys and experiments being the most prevalent methods in the Arctic region [22,43,44,45,46]. Remote sensing studies are also popular, typically covering the entire Arctic land areas and focusing on vegetation indices (Normalized Difference Vegetation Index, Enhanced Vegetation Index), ecosystem productivity, vegetation type conversion, and disturbances [37,38,47,48], making it difficult to reach the species level. Species distribution models (SDMs), alternatively known as ecological niche models (ENMs), are particularly suitable for filling this research gap between fine-scaled field studies and broad-scale remote sensing analyses in Arctic climate change-induced biodiversity response studies [49]. When carefully implemented, SDMs can generally overcome issues related to patchy sampling and records by combining multiple sources of occurrence data and data cleaning and thinning processes [50,51,52,53,54]. Resampling partial occurrences from the entire dataset provides a method to estimate uncertainty caused by data paucity after cleaning and thinning [55,56].
Look forward with a long time frame to compare the effectiveness of efforts to conserve biodiversity through reducing greenhouse gas (GHG) emissions (denoted by the Shared Socioeconomic Pathways (SSPs) applied in the IPCC Sixth Assessment) in order to support this high-cost action [57]. Addressing the status of Arctic plant species (range size and position) and their extinction risks in this context is valuable [19]. SDMs are especially apt for achieving this goal when combined with General Circulation Model (GCM)-projected future climates [58]. Unlike most other ecological studies, which typically project future responses of species distributions or ecosystem functioning up to the end of 2100 AD [59,60], we have decided to extend our time frame to 2300 AD in this study. The rationale is that the warming trends for the high emission scenario (SSP585) in 2100 AD are far from being stabilized due to energy balances, but are at the peak warming stage [61]. Biodiversity may respond more dramatically than the warming itself, with many Arctic species potentially surpassing their thermal thresholds (probably after 2100 AD), leading to extinction [62]. We aim to convey a warning message for this worst-case scenario. We will implement this analysis using a widely recognized SDM, MaxEnt [63].
The objective of this paper is to address the following key questions regarding Arctic/Boreal plant species in response to future climate changes:
  • What are the major environmental factors governing the distribution of focal plants, and thereby influencing their future range shifting responses?
  • How do different SSPs play pivotal roles in determining the fates of these plants in future climate scenarios?
  • Are Arctic plants (A_Spps) more vulnerable than Boreal plants (B_Spps) in general, as widely hypothesized, in changing climate scenarios?
  • Are there general patterns in the timing of rapid range shift stages for Arctic/Boreal plants?
  • Where are the possible climate refugia for species that are critically endangered as a result of climate change?
Answering these questions may support broad environmental protection actions in reducing GHG emissions (Q2), have important conservation implications both in general (Q3) and for temporal–spatial-contingent conservation plans (Q4–5), and deepen our understanding of Arctic plant biology for biodiversity conservation purposes (Q1).

2. Methods

2.1. Research Area

The study area was defined as the entire terrestrial region north of 45° N latitude, encompassing all Arctic regions. This boundary is consistent with the conventions of the Arctic Flora and Fauna (CAFF) [64] and the Arctic Climate Impact Assessment (ACIA) plans [65], and includes sufficient buffer zones in the northern Boreal regions. The spatial patterns of basic geographical and bioclimatic variables are illustrated in Figure 1.

2.2. Species Selection and Occurrence Data Preparation

We conducted a literature review to identify plant species belonging to the Arctic tundra, focusing exclusively on herbaceous and shrub species. Lichens and mosses were excluded due to the scarcity of species-level information. To ensure the generality of our research goals, we further narrowed down the list of species to those occurring in the main landmasses of the Arctic, including North America, Eurasia, and Greenland. This was achieved by consulting the Global Biodiversity Information Facility (GBIF) data portal [66]. We downloaded occurrence data from GBIF, collected within the time period corresponding to the “current” climate layers defined in the WorldClim dataset (1960–1990) [67]. The data were cleaned using a standardized procedure and thinned to a spatial resolution of 10 km [68], matching the resolution of the environmental data layers used in this study. Species with fewer than 40 occurrences after thinning were excluded to ensure the accuracy of species distribution models (SDMs). The final species list, comprising 25 herbaceous and woody tundra plant species (15 woody and 10 herbaceous), is presented in Table S1. The species were ordered by ascending centroid latitudes, with those having centroid latitudes greater than 64° N classified as pure Arctic species (hereafter A_Spps), and those occurring in both Boreal and Arctic regions classified as Boreal–Arctic species (B_Spps). In total, 9 species were classified as A_Spps (6 herbaceous and 3 woody), and 16 species as B_Spps (4 herbaceous and 12 woody). The centroid latitudes ranged from 54.7° N to 69.9° N, with a median of 62.5° N. The number of occurrences after thinning ranged from 45 to 1641, with a median of 493.

2.3. BioPlantPolar Dataset Preparation

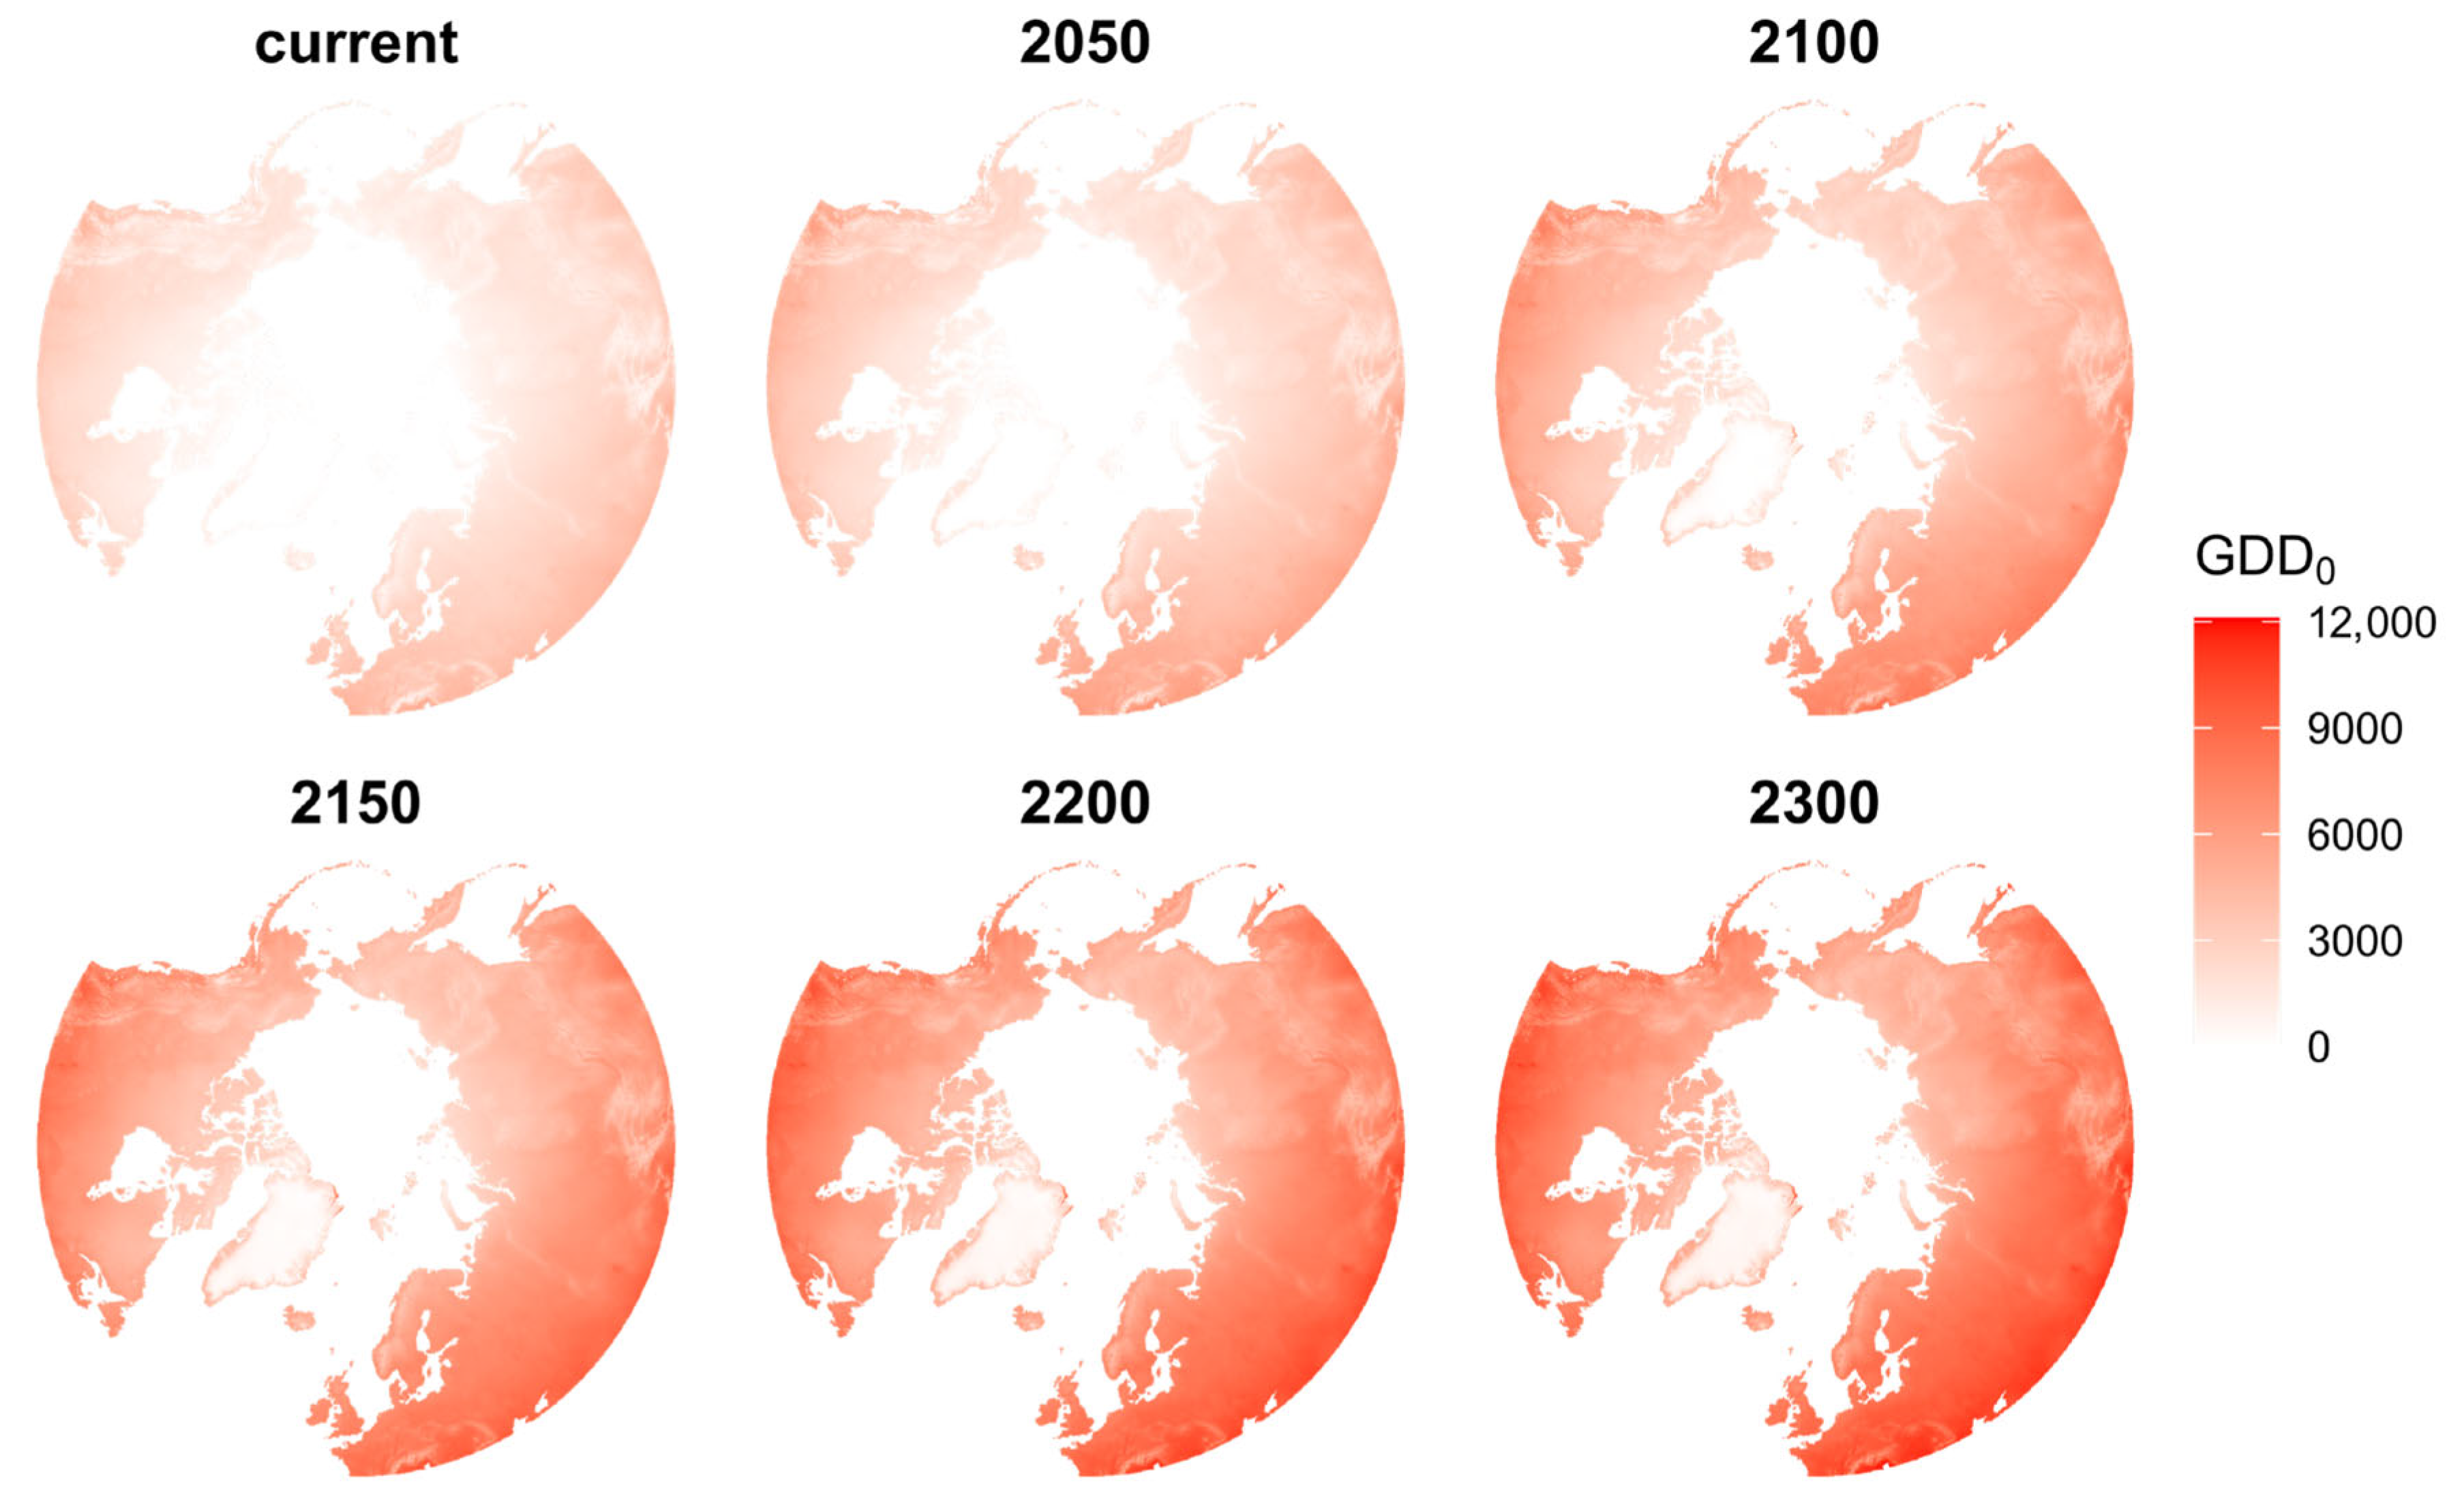
The BioPlantPolar dataset comprises seven bioclimatic variables, with brief descriptions provided in Table S2. These include two temperature-only variables (T_Cold and GDD0), two precipitation-only variables (P_total and P_Season), two temperature–precipitation interaction variables (TP_syn and Aridity), and one topographical variable (TRI). The dataset was derived from the BioPlant dataset, previously developed by one of the authors (Kou) [69], with modifications to the spatial extent, raster data layer resolution, projection, time frame, and General Circulation Models (GCMs) used for spatial downscaling. These modifications were made to meet the requirements of SDM modeling and projection. The dataset covers all terrestrial areas north of 45° N, with a spatial resolution of 10 km in an Arctic-centered map projection (WGS_1984_Azimuthal_Equidistant, in ArcGIS 10.7). The dataset is based solely on monthly temperature and precipitation data, commonly provided by climate scientists running GCMs. The dataset is named BioPlantPolar and is available in an open data repository (https://doi.org/10.6084/m9.figshare.29377646.v1, accessed on 23 June 2025) [70]. The dataset includes 30-year averages of climate data, named by the central year of each time interval (e.g., 2100 AD represents data averaged from 2086 to 2115 AD). The time frames used in this study are 1985, 2010, 2050, 2100, 2150, 2200, 2250, and 2300 AD. Data layers were linearly interpolated to achieve approximately 50-year intervals, as yearly data layers may be absent in the first and last time periods. Three Shared Socioeconomic Pathways (SSPs) were considered, SSP126, SSP245, and SSP585, representing low, moderate, and high greenhouse gas (GHG) emission scenarios, and hence extra heat forcing, respectively. Three GCM outputs were used to derive the dataset, ESM2 (https://www.wdc-climate.de/ui/entry?acronym=C6_5243961, accessed on 23 June 2025) [71], IPSL (https://hdl.handle.net/21.14106/f8270bc2151936dffc83a10d69720a61f9de8eaa, accessed on 23 June 2025) [72], and MPIE (https://doi.org/10.1594/WDCC/CMIP5.MXELr8, accessed on 23 June 2025) [73], and they conform to the required time frame and contain all three SSP scenarios [74]. Figure 2 presents an example sub-dataset, illustrating the dataset structure and visual attributes of map layers. Time series map layers of Growing Degree Days (GDD0) in the SSP585 scenario, derived from the IPSL GCM, are shown to highlight the major warming process in the Arctic region.

2.4. Model Selection

Maintaining low dimensionality is crucial for projecting future distributions using SDMs to avoid false range diminution due to overfitting [75]. Instead of using Principal Component Analysis (PCA), we selected predictor variables directly from the original data layers to preserve the transparency of the species distribution mechanisms (Q1 in the Introduction). A mixed two-step variable selection scheme was employed. First, candidate variables were chosen based on ecological understanding of Arctic and Boreal plants, ensuring that each species pair had correlation coefficients less than 0.8. This resulted in seven candidate variables. Subsequently, the number of predictor variables was narrowed down to three or four by balancing model accuracy and dimensionality. The variable contribution functionality in MaxEnt was used to estimate the mean and standard error of each variable’s contribution for each species, based on 75% of the thinned occurrences resampled 20 times. The first three ranked variables were found to be sufficient for each plant species (as measured using performance indices AUC, Max Kappa, and TSS), and these three-variable models were used for future species distribution projections.

2.5. Species Suitability Projections

The MaxEnt model, implemented in the R package (version 4.3.0) “dismo (version 1.3-14),” was used for model fitting and performance evaluation. Default parameters were retained, as they had minimal influence on model output. The standard procedure involved fitting models using occurrence data and “current” predictors, and projecting the models to future suitability maps by incorporating “future” predictor data layers. This process was repeated for each occurrence resample (10 times in total), each GCM-derived data layer (ESM2, IPSL, and MRIE), each SSP (SSP126, SSP245, and SSP585), and each time period (2010, 2050, …, 2300 AD). The logistical outputs of the suitability maps (as raster layers) were stored as raster stacks in RData format for subsequent analysis.

2.6. Range Shift Indices Calculation and Summarization

Shift Index Calculation from Each Projected Map: Shift indices were defined based on the methodological foundations developed by Kou et al. (2014) (https://doi.org/10.1371/journal.pone.0098643, accessed on 23 June 2025) [76], with modifications to accommodate the unique situation of the polar region. The traditional Dx and Dy indices were replaced by a single index, D_pole, representing the shift distance of the range centroid towards the North Pole (see shift_pole_func.R for R codes in FigShare) (https://doi.org/10.6084/m9.figshare.29377646.v2, accessed on 23 June 2025) [70]. This new R function was used to calculate a set of indices (D_pole, Dz, I, O, Loss, and Gain) for each future suitability map compared to the current suitability map, and the values were stored in CSV format tables.
Mean and Standard Error Calculations: To compare range shift indices across different SSPs and time periods, and to assess the impact of GCMs and occurrence resampling on index accuracy, we calculated the arithmetic mean and standard error for each index, SSP, time period, and species. This involved 10 occurrence replications × 3 GCMs = 30 samples. These data were stored in CSV format files as final results and later plotted for visual inspection.
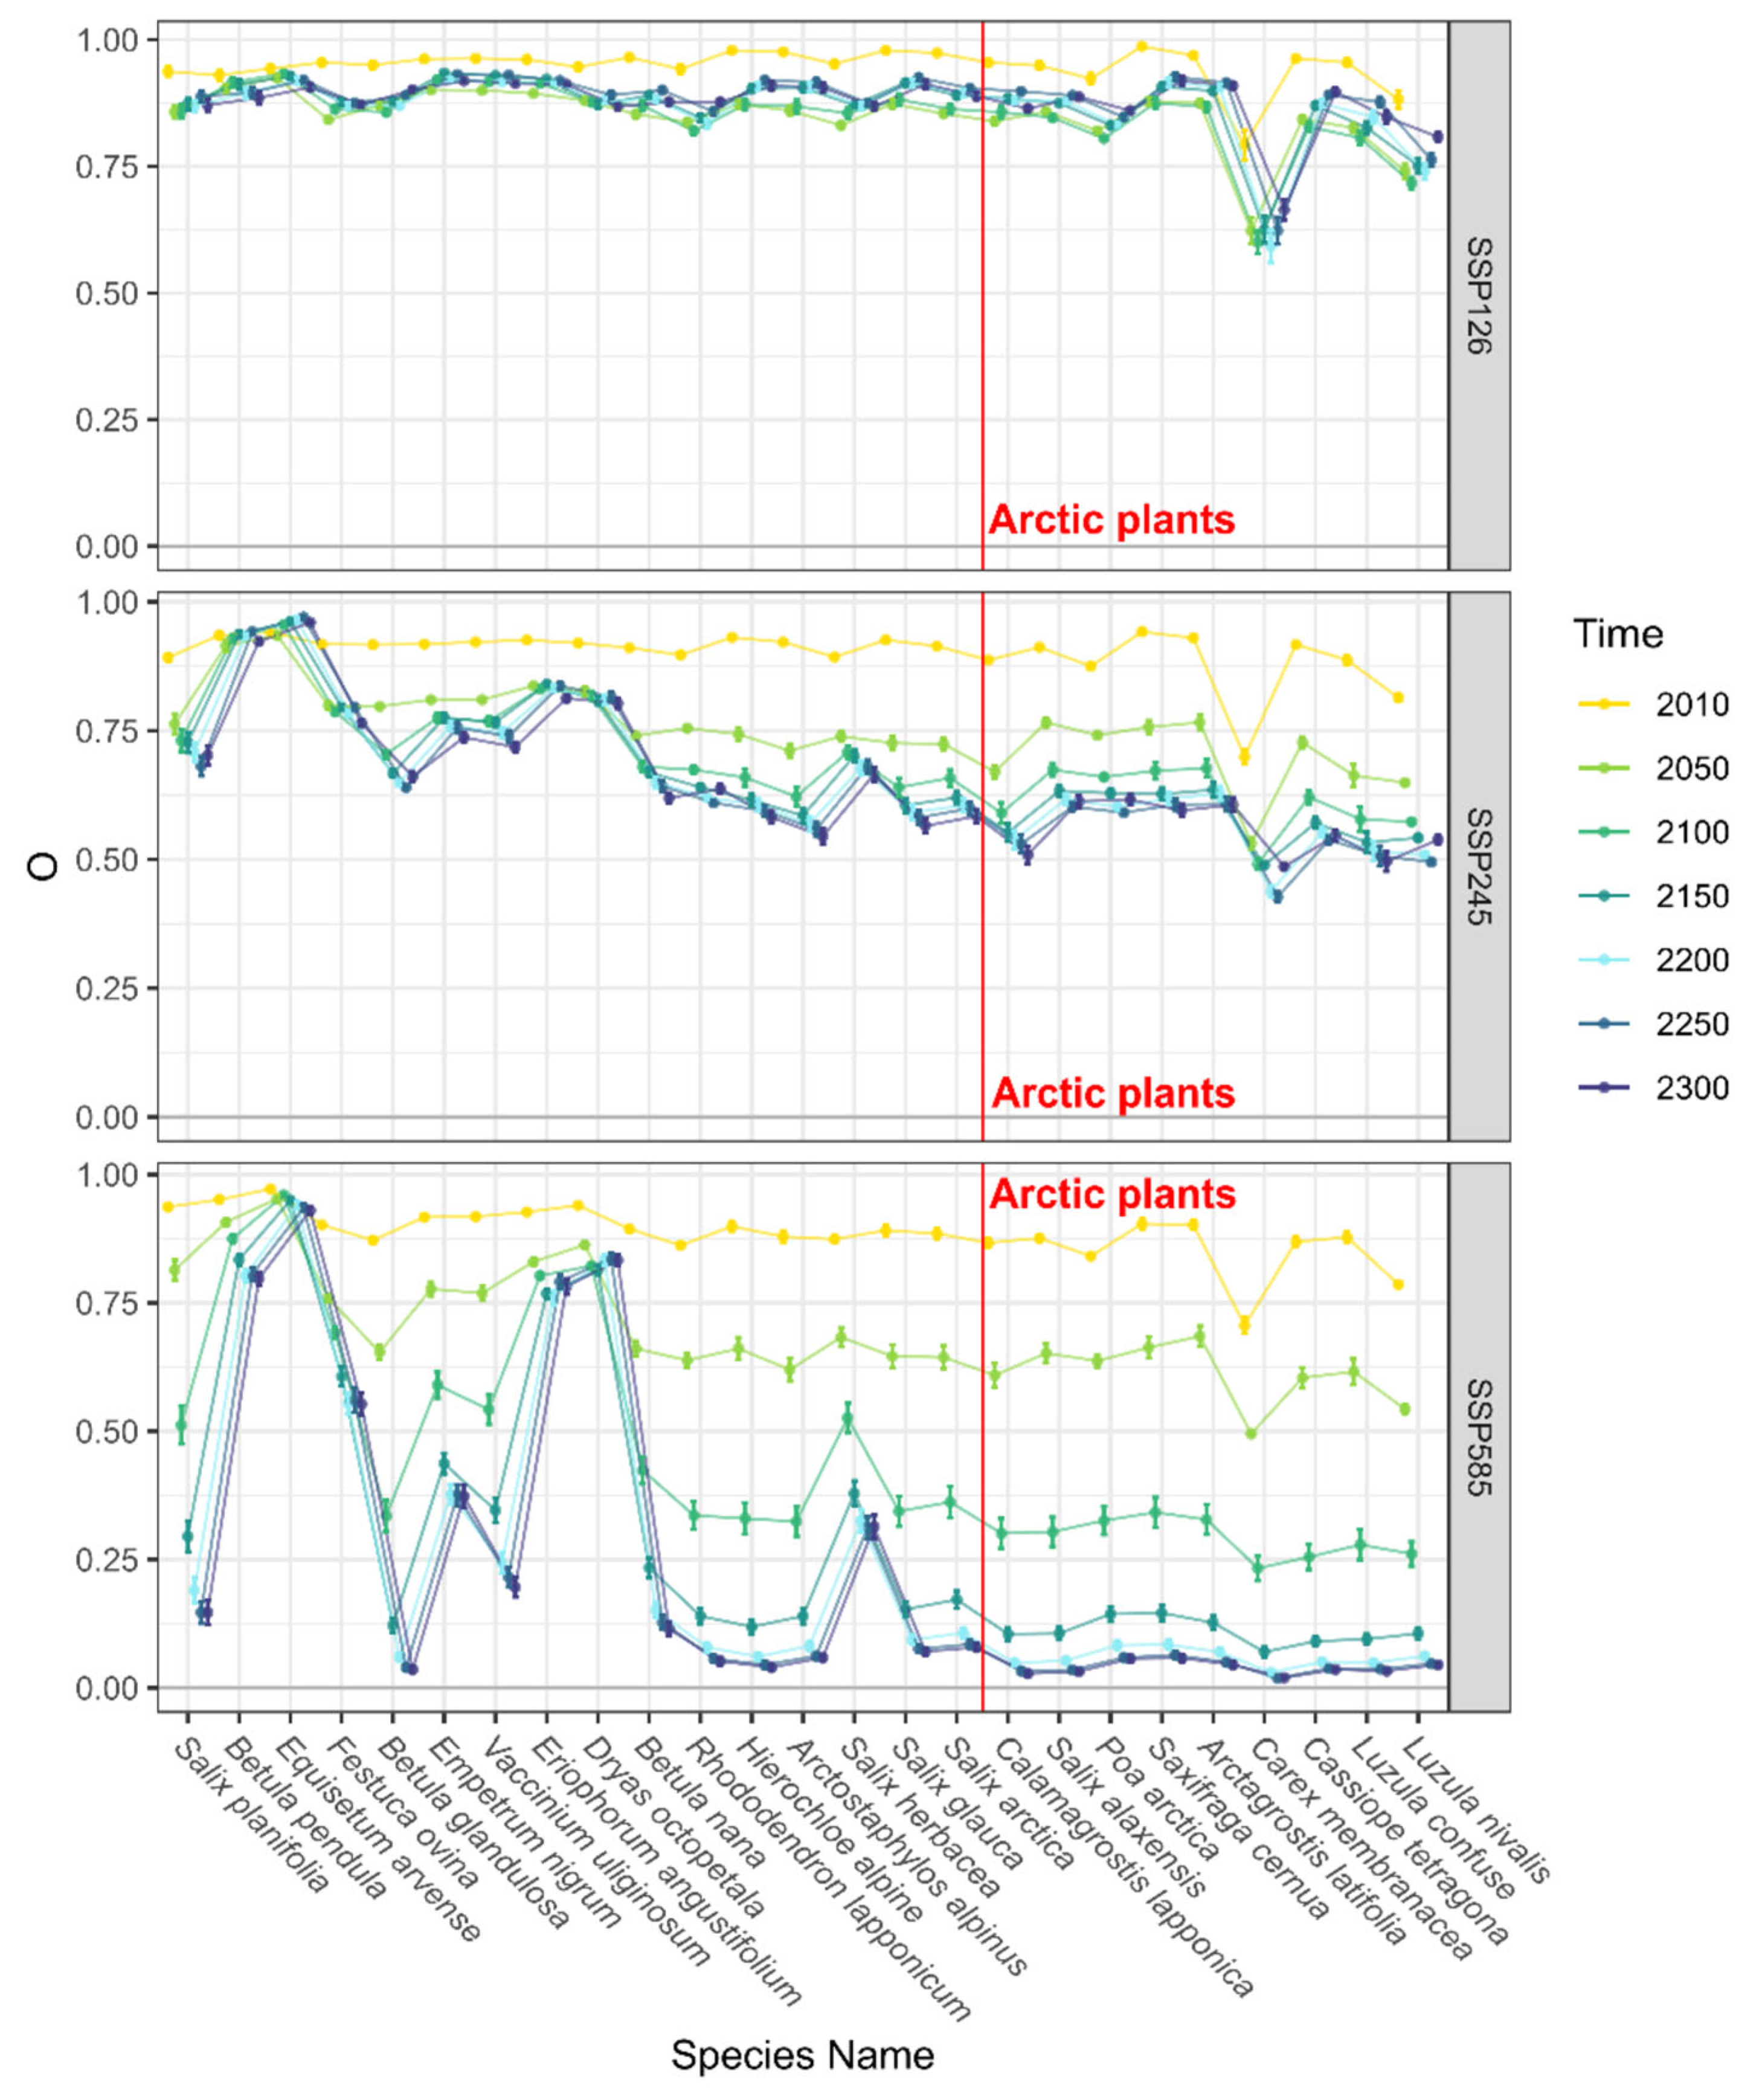
Curve Plotting: Figures were organized based on indices and SSPs, with each index presented in a separate figure and each SSP in a separate panel for inter-SSP comparisons. In each figure panel, time curves were marked by color and point symbols, with standard errors represented as error bars. Species were aligned along the x-axis in ascending order of the mean latitudes of centroids of thinned occurrences. The R package ggplot2 (version 3.5.2) was used to generate these figures.

3. Results

3.1. Model Selection and Performances

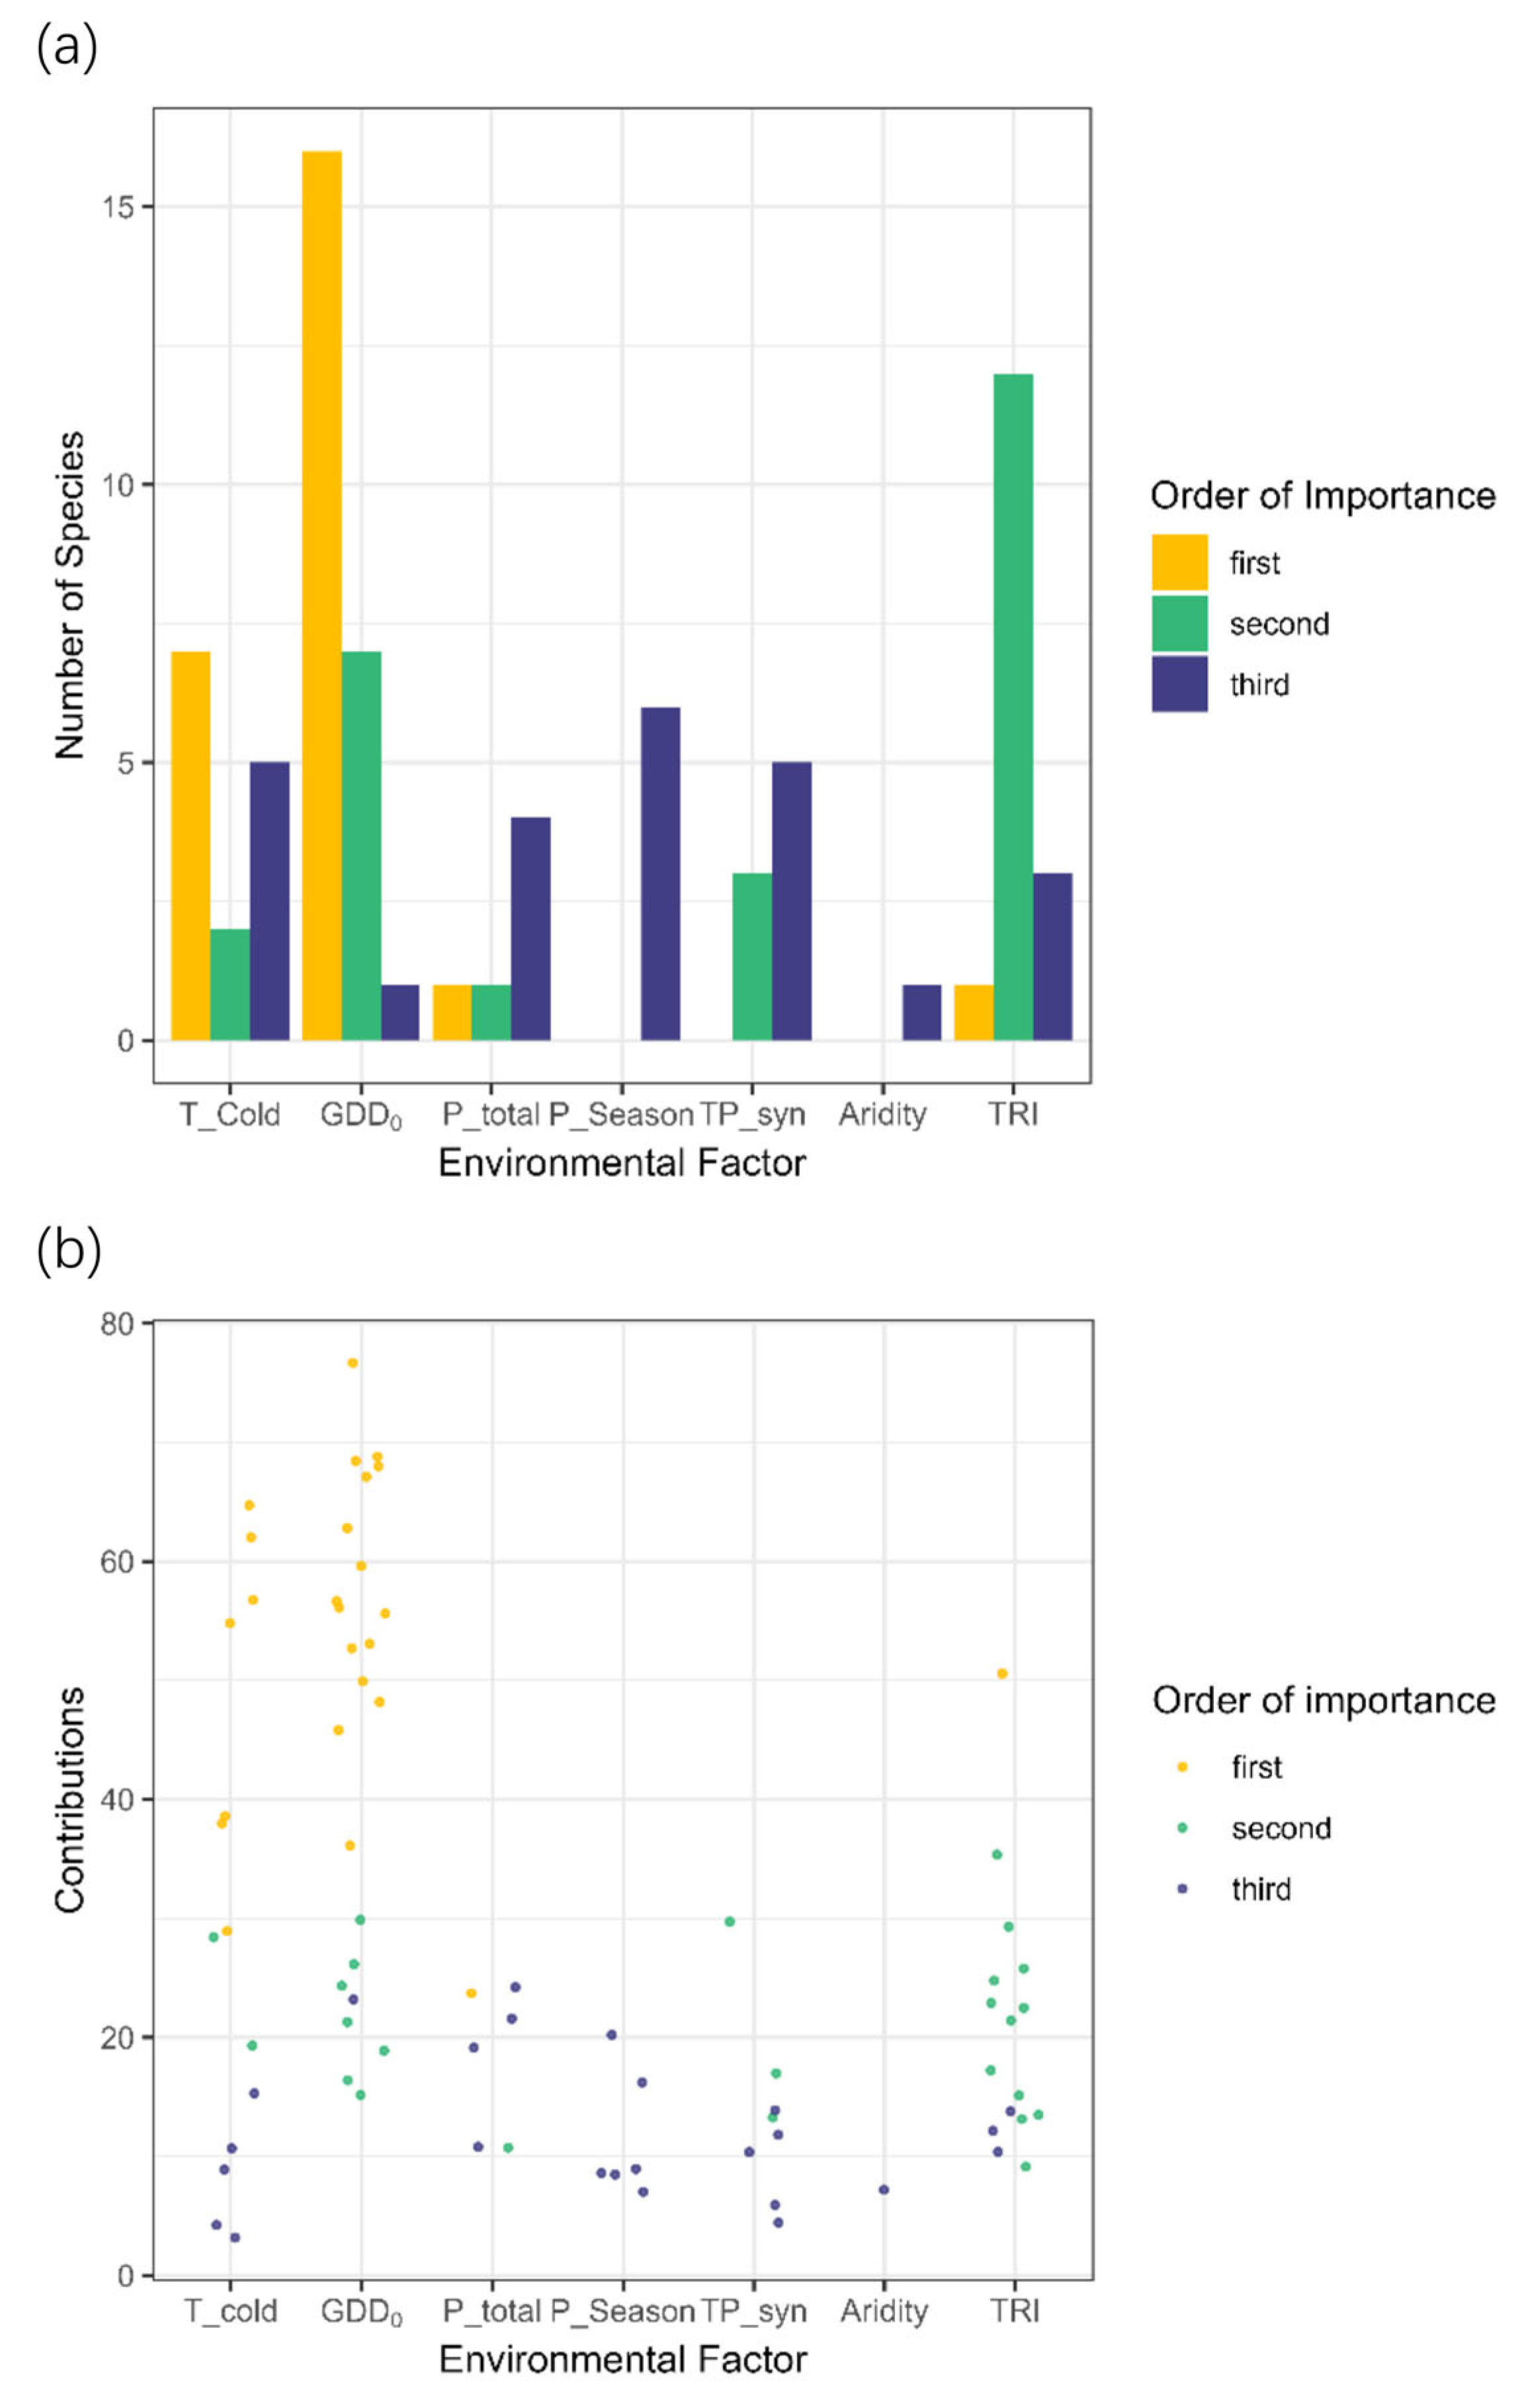
For the 25 modeled species, the variables that ranked within the top three in terms of importance are depicted in Figure 3a. Overall, the variable GDD0 was identified as the most significant, with 16 species ranking it first and 7 ranking it second. This indicates that GDD0 is a predominant factor in the species distribution models (SDMs) for the majority of the modeled species. The variable T_Cold also exerted considerable influence, ranked first for seven species, second for two, and third for five, further emphasizing the dominant role of thermal variables in the SDMs.
The topographic variable TRI was another significant predictor, with 1 species ranking it first, 12 ranking it second, and 3 ranking it third. In contrast, other variables generally ranked third, with P_total achieving first and second rank in one instance each. Aridity was found to be the least influential factor among the modeled species.
The contribution percentages for the top three ranked variables are illustrated in Figure 3b. The first-ranked variable contributed approximately 30% to 80% to each model, while the third-ranked variable contributed less than 25%. The cumulative contributions of the top three ranked variables accounted for approximately 80–90% of the total (as detailed in Table S3), suggesting that the three-dimensional niche was sufficiently comprehensive for species distribution modeling. The standard errors associated with the 20 resampled occurrences were minimal (less than 0.5), which underscores the reliability of our variable selection methodology.
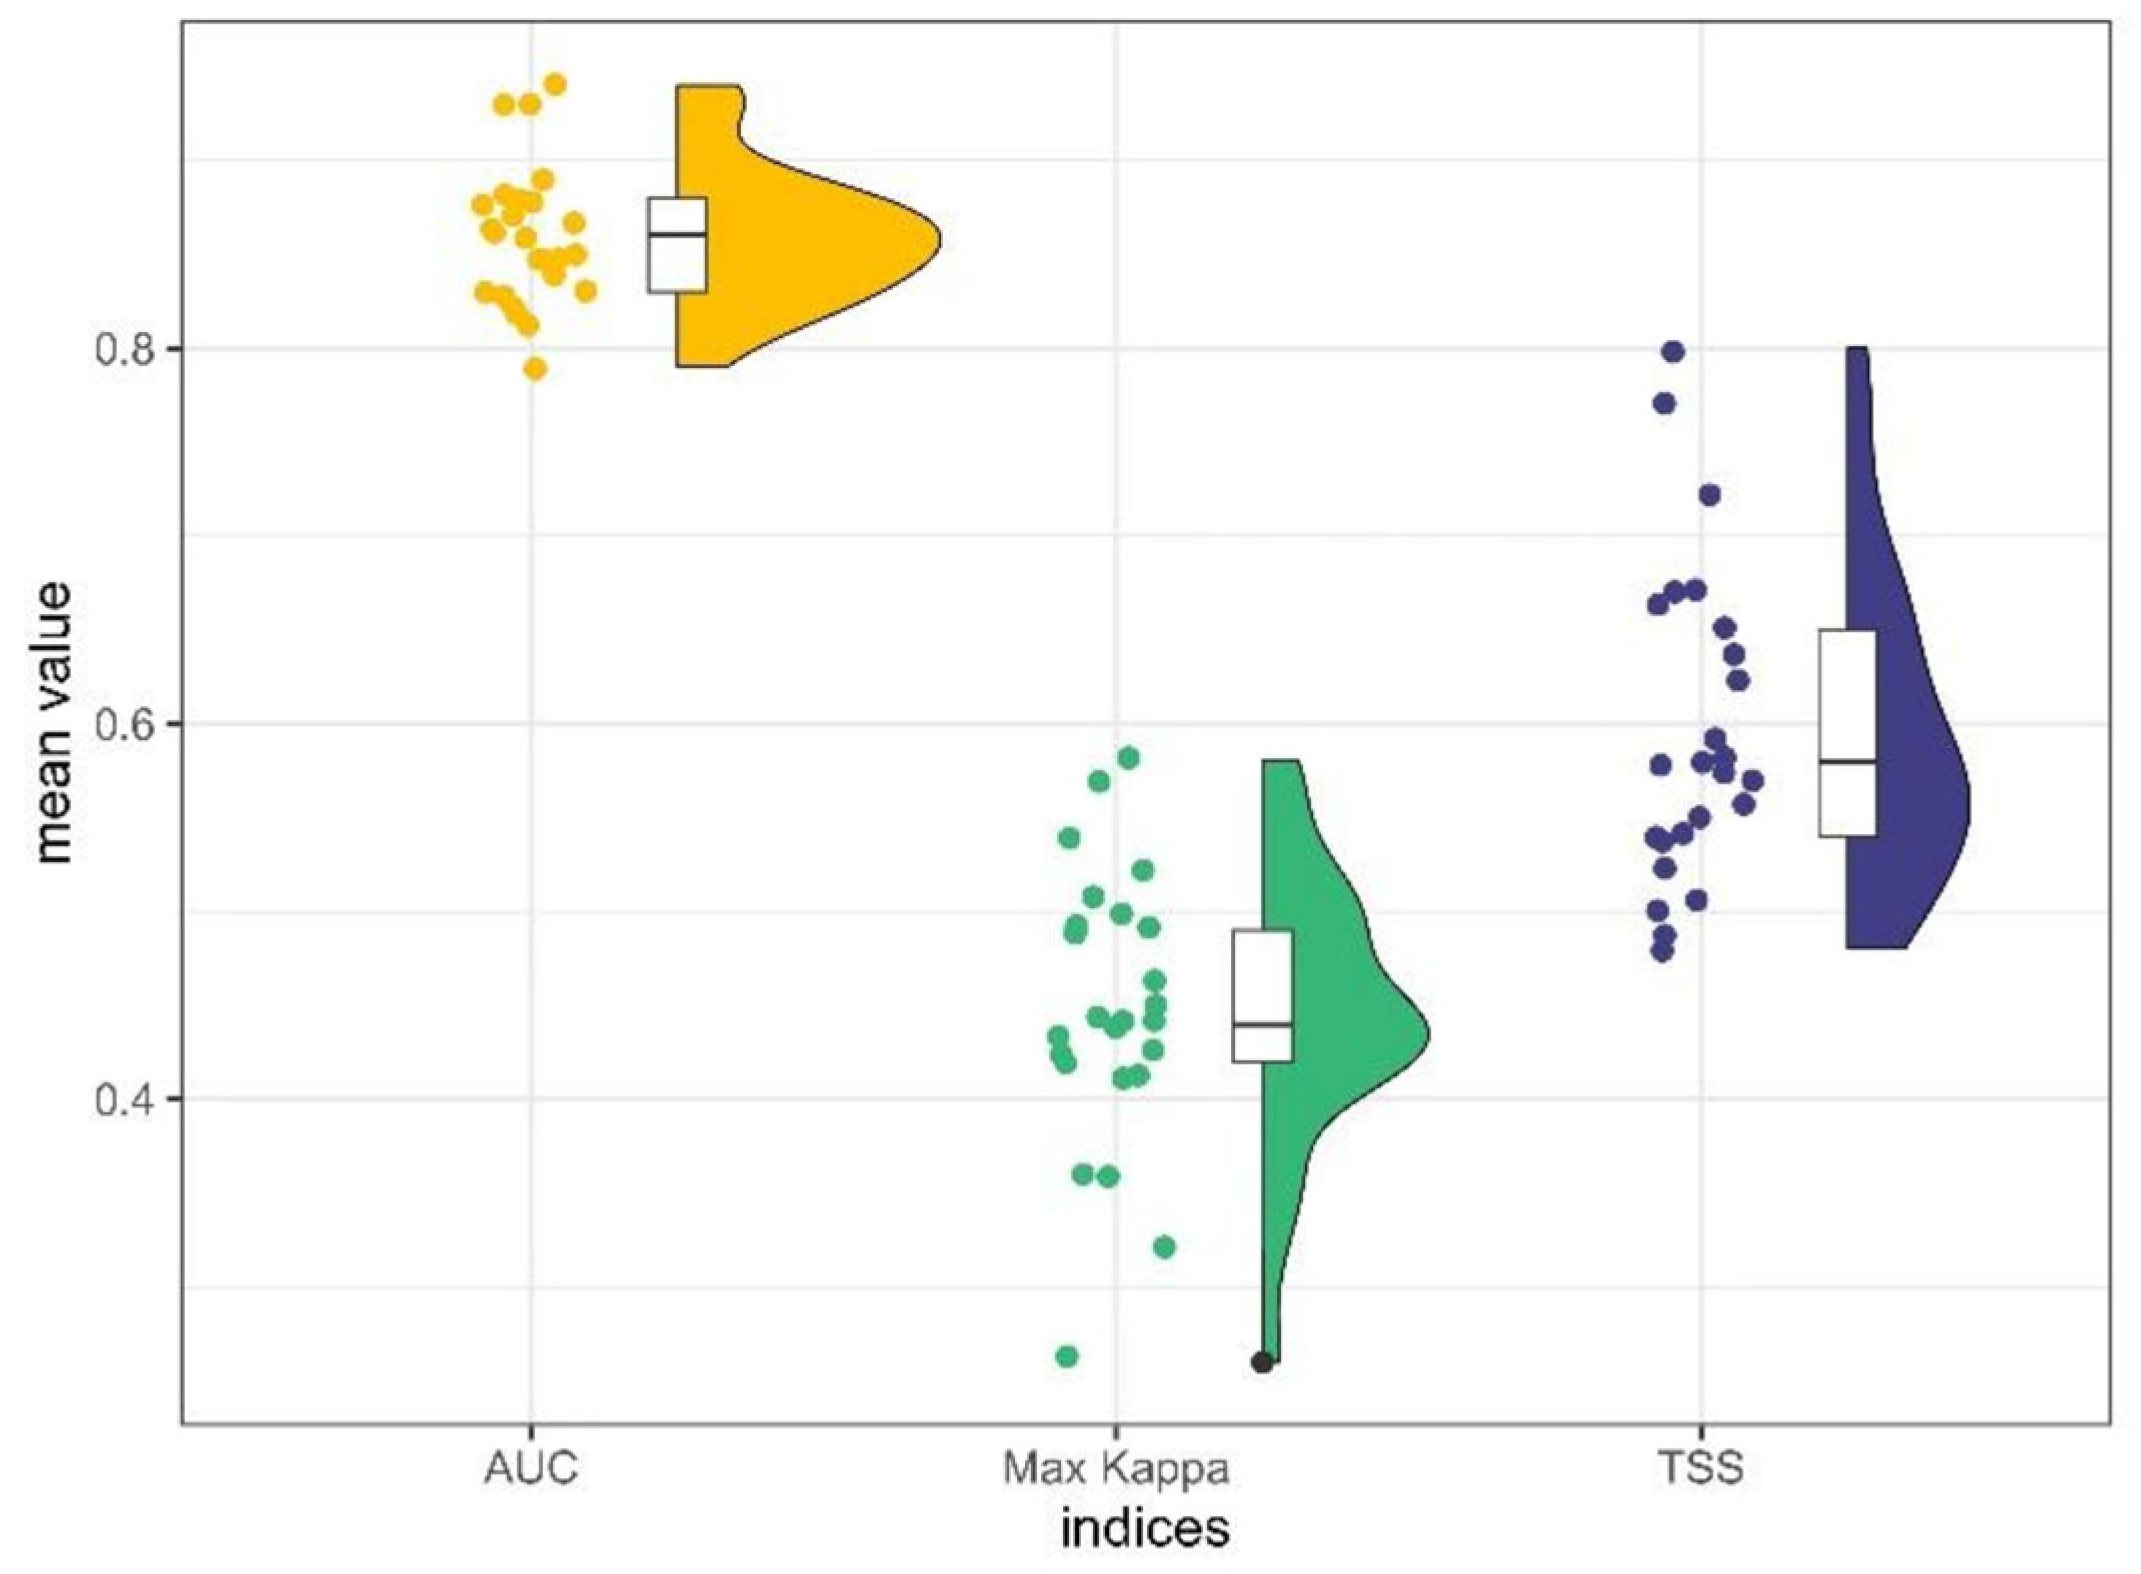
The three-dimensional niche model demonstrated robust performance across all focal species when evaluated using the Area Under the Curve (AUC), maximum Kappa, and True Skill Statistic (TSS) indices (as shown in Figure 4 and detailed in Table S4). The median AUC was 0.86, with the first and third quartiles being 0.83 and 0.88, respectively. Correspondingly, the max Kappa and TSS indices exhibited median values, first quartiles, and third quartiles of 0.44, 0.42, 0.49, and 0.58, 0.54, 0.65, respectively. The minimal standard errors associated with these three performance indices (as indicated in Table S4) further substantiate the reliability and robustness of the SDM. These findings underscore the model’s effectiveness in accurately predicting species distributions.

3.2. Trends in Range Shifts

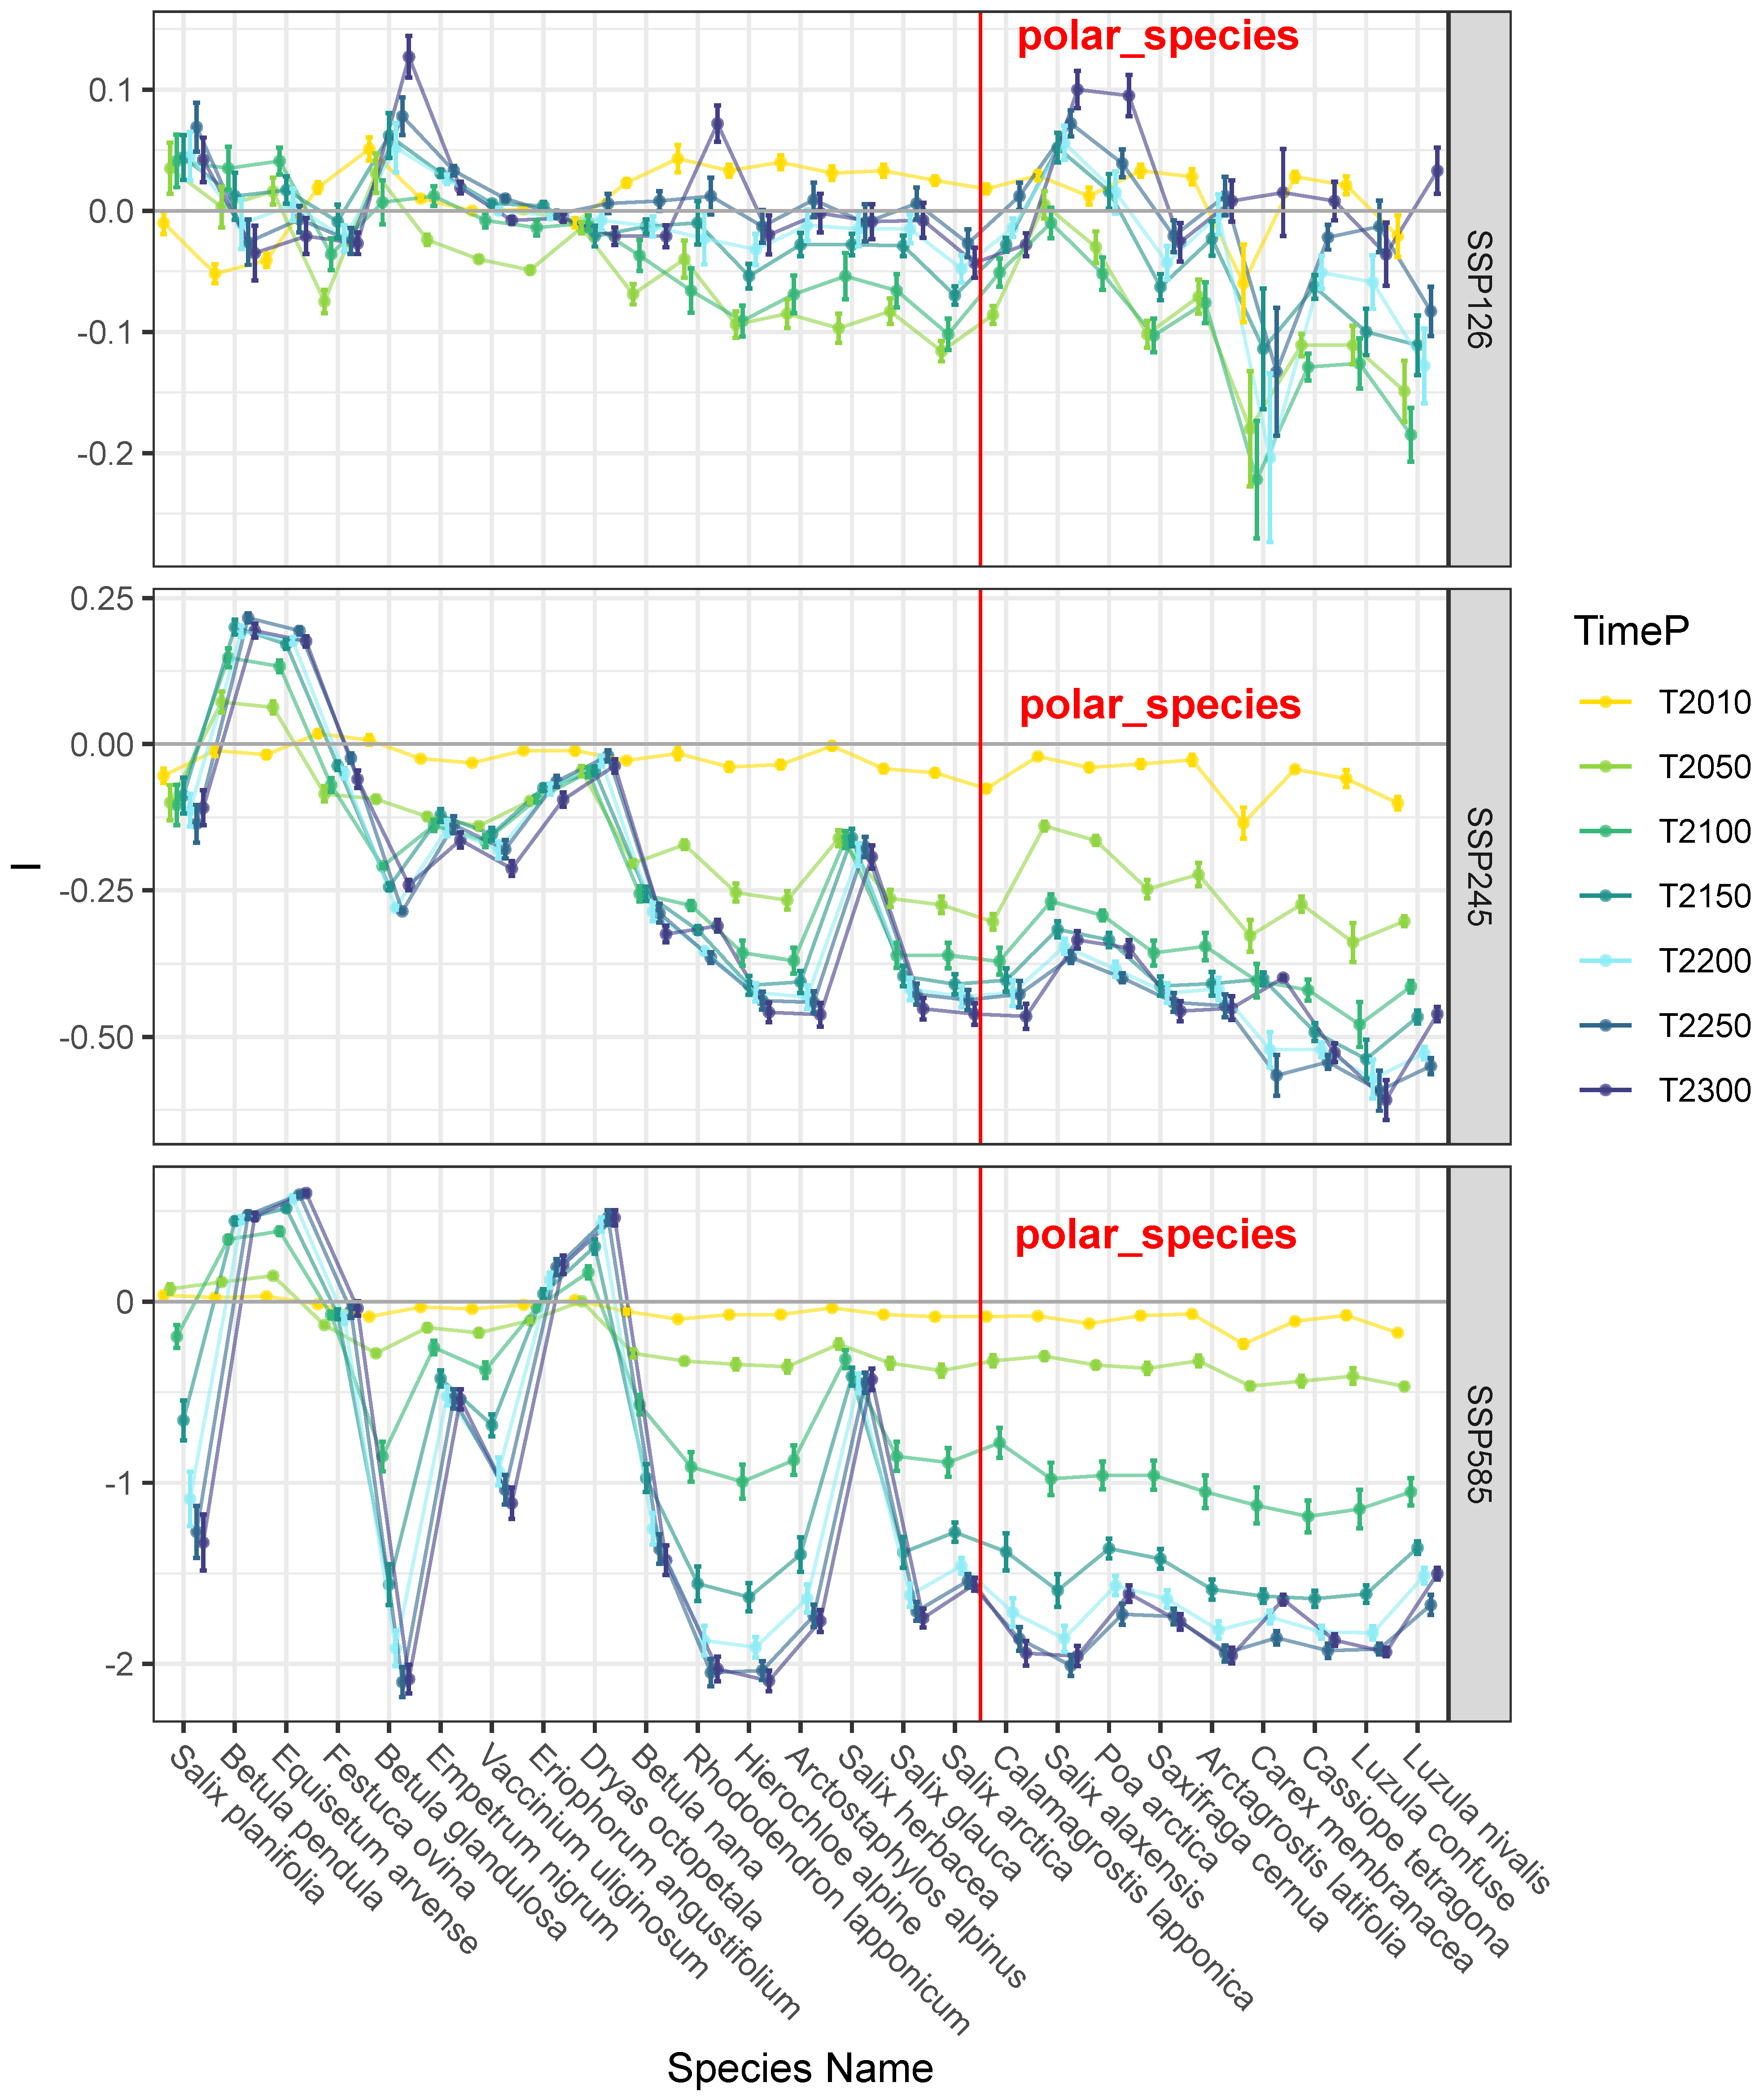
Range Size (I Index): Change in range size plays a pivotal role in assessing a species’ performance and extinction risk (as depicted in Figure 5) in changing climates. Analysis of the high-emission scenario SSP585 reveals a progressive reduction in the range size of Arctic specialist species (A_Spps) over time, with the most significant decline occurring between 2050 and 2100 AD, continuing until 2200 AD, and then tapering off. However, Boreal–Arctic species (B_Spps) exhibited interspecific variability, with several species following a pattern similar to that of A_Spps (e.g., Salix planifolia and Rhododendron lapponicum), while a few species even experienced an expansion in their range sizes (e.g., Betula pendula and Dryas octopetala). The I index values will generally reach −1.5 after 2200 AD for all A_Spps, whereas B_Spps showed a considerably lower reduction extent for the majority of species.
In the moderate-emission scenario SSP245, a pattern analogous to that observed in SSP585 was evident for both A_Spps and B_Spps, albeit with a significantly reduced magnitude. Contrary to SSP585, the maximum I index values for each species in A_Spps reached only around −0.5, peaked between 2010 and 2050 AD, and then stabilized post-2100 AD. In the most conservative scenario SSP126, changes in range size were minimal, with the I index fluctuating between −0.2 and 0.1. It appears that A_Spps exhibited slightly more variation than B_Spps, and that A_Spps tended to experience a greater reduction in range size compared to B_Spps.
The extinction risk status was defined based on the proportional range size lost, as measured by the I index, across four categories: non-vulnerable (I > −0.4, less than one-third lost); vulnerable (I < −0.4, more than 1/3 lost); endangered (I < −0.7, more than 1/2 lost); and critically endangered (I < −1.6, more than 4/5 lost).
Under scenario SSP585, A_Spps generally became vulnerable by 2050 AD, endangered by 2100 AD and 2150 AD, and critically endangered after 2200 AD. For B_Spps, similar extinction risks were observed for a few species, such as Betula glandulosa, Rhododendron lapponicum, and Hierochloe alpine, which paralleled those of A_Spps. However, the majority of B_Spps had a lower risk status compared to A_Spps, with a few species even benefiting from global change, as indicated by an expansion in range size (e.g., Betula pendula and Dryas octopetala). In scenario SSP245, most A_Spps reached vulnerable status after 2100 AD, with no instances of endangerment observed throughout the entire time period. A few B_Spps marginally reached vulnerable status after 2100 AD (e.g., Hierochloe alpine and Salix arctica). In scenario SSP126, all plant species, both A_Spps and B_Spps, remained in a non-vulnerable state throughout all time periods (Figure 5).
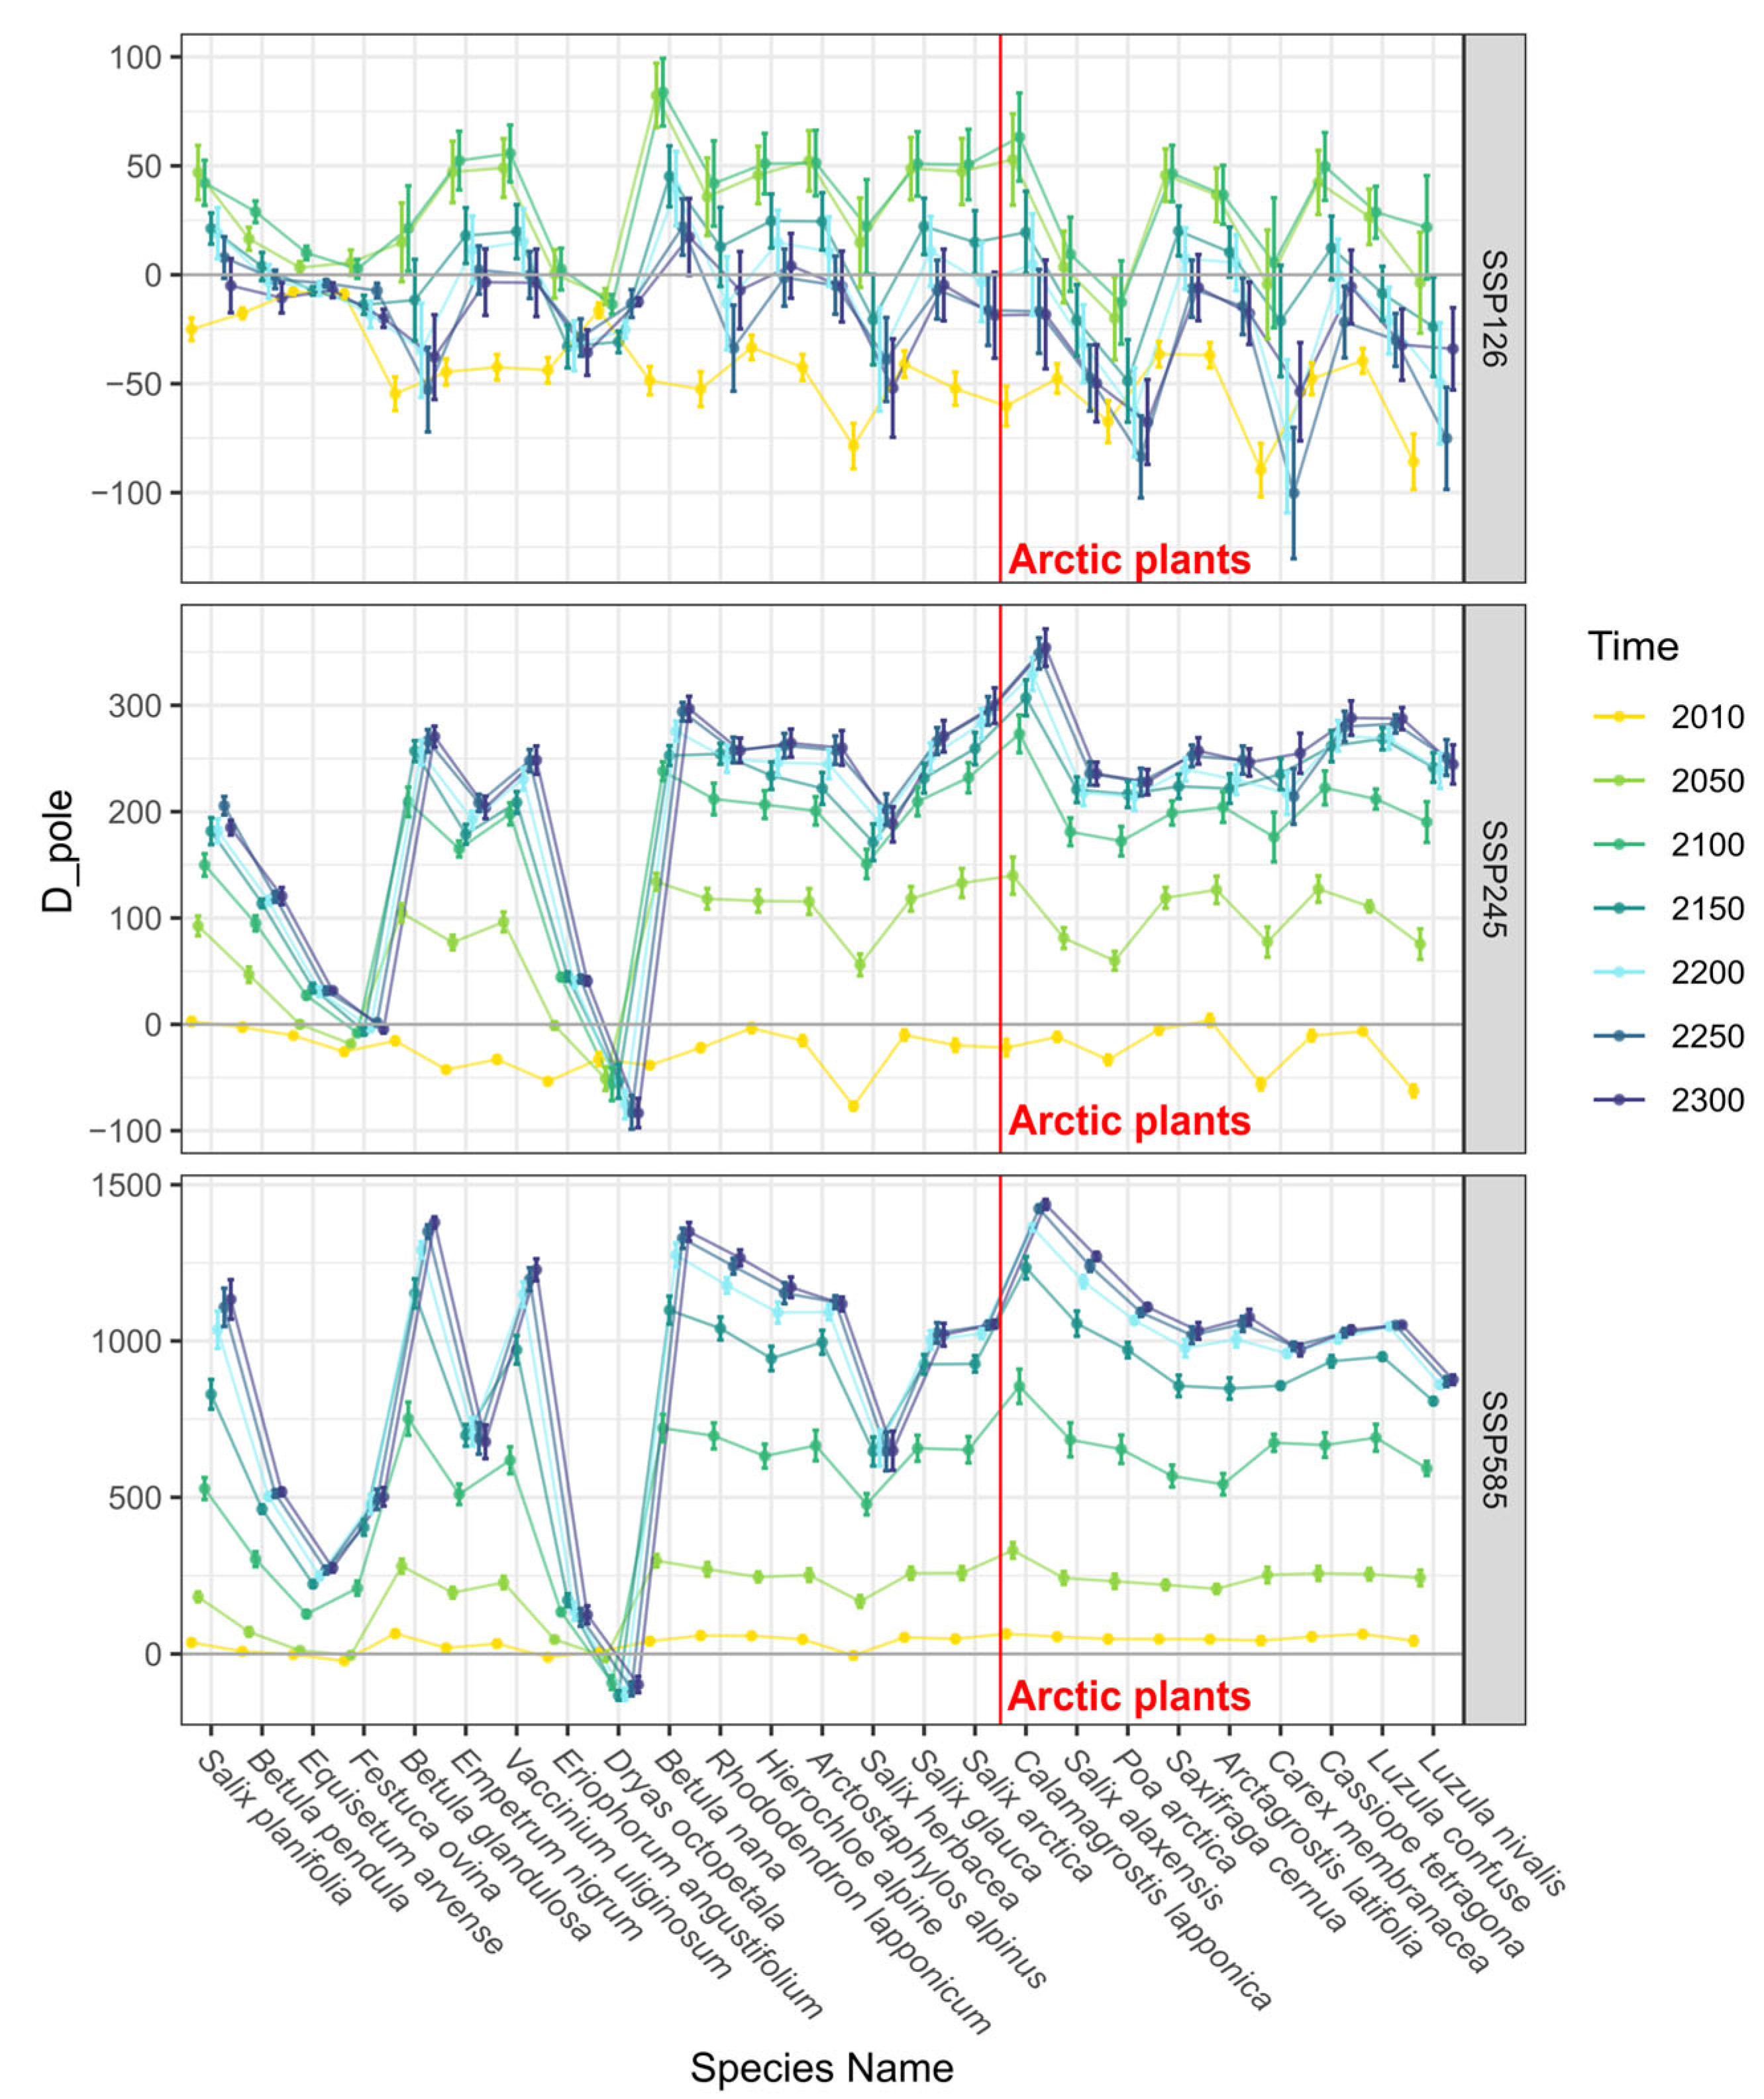
Centroid Position (D_pole, Dz): In Arctic regions, the distance of a species’ range centroid to the North Pole (D_pole, measured in kilometers) serves as a critical metric for assessing the poleward shift in response to global warming (as depicted in Figure 6) [77]. Under the high-emission scenario SSP585, Arctic specialist species (A_Spps) exhibited a progressive northward migration with a consistent pattern, whereas Boreal–Arctic species (B_Spps) displayed significant heterogeneity in their migration trends. Some B_Spps mirrored the trend and extent of A_Spps, others followed a similar trend but with a lesser extent, and a few, such as Eriophorum angustifolium and Dryas octopetala, deviated from this pattern. For A_Spps, the rate of northward movement peaked between 2050 and 2100 AD, continued until 2200 AD, and then stabilized. The maximum displacement for most species reached approximately 1000 km after 2200 AD. In the moderate-emission scenario SSP245, a pattern similar to SSP585 was observed, albeit with a significantly reduced extent, with the maximum displacement for most species being around 250 km after 2200 AD. In the low-emission scenario SSP126, latitudinal movements were essentially negligible, with no discernible poleward trend and no apparent differences between A_Spps and B_Spps.
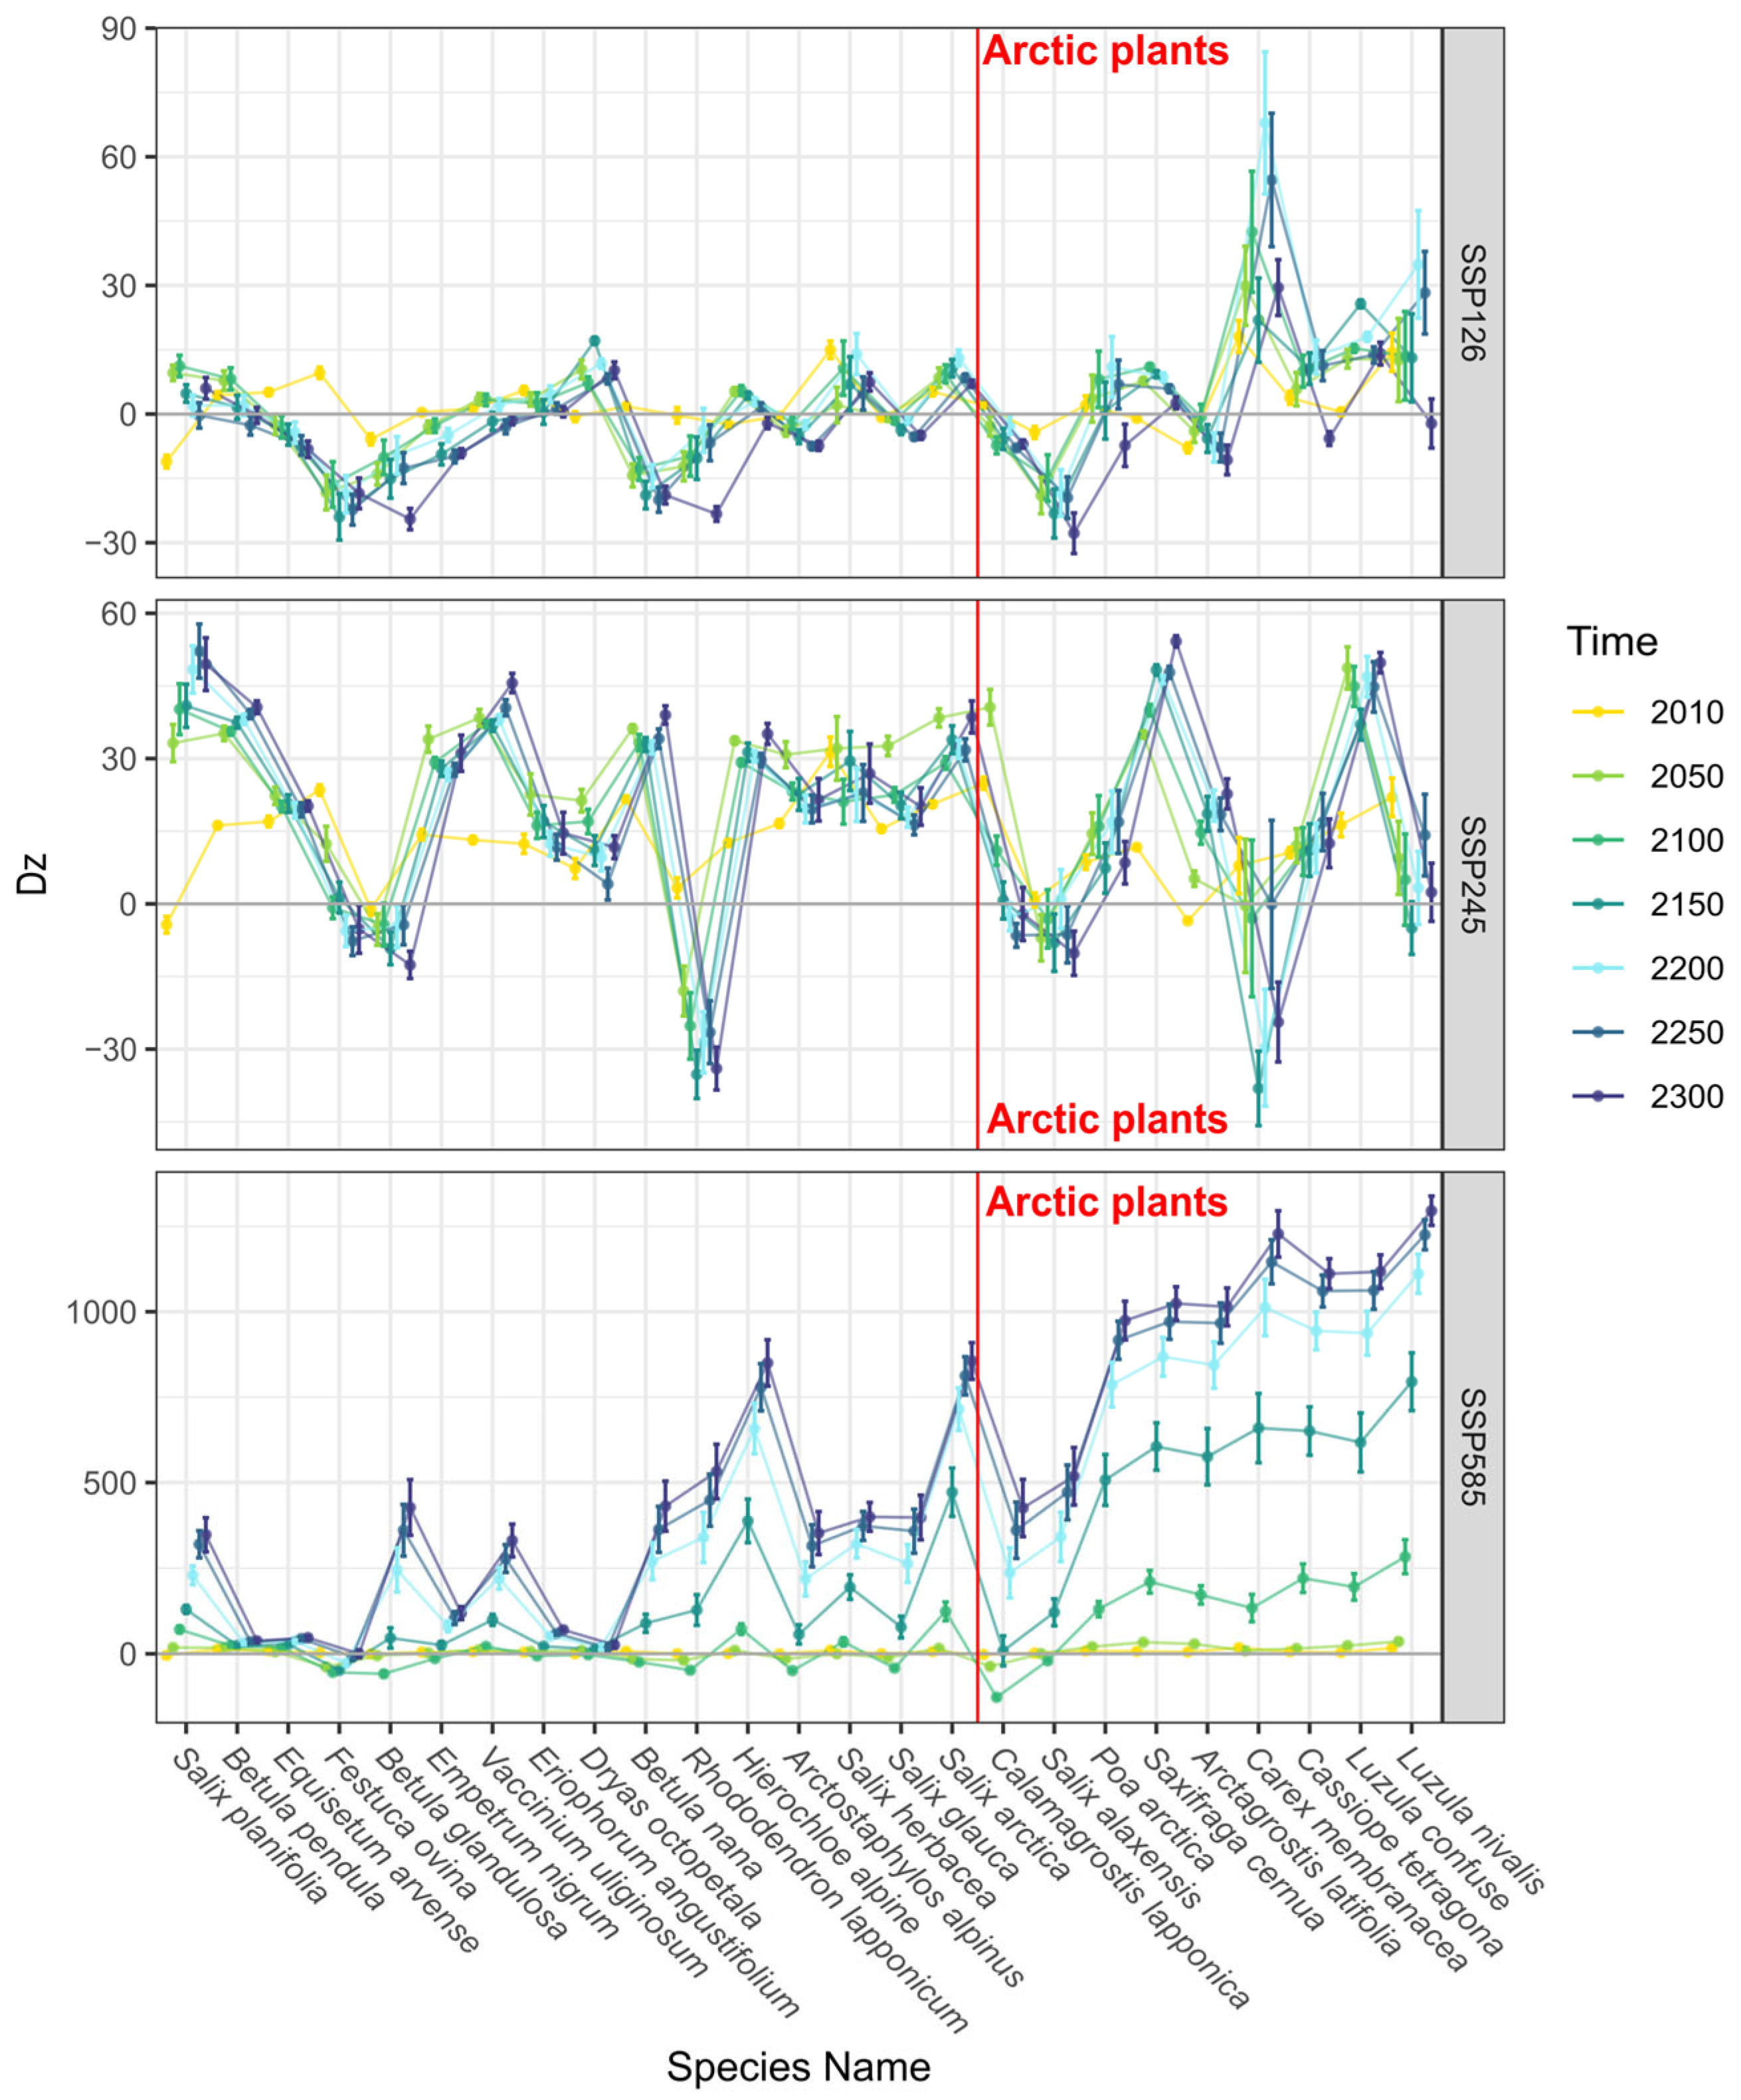
The elevational shift (Dz, measured in meters) represents another adaptive strategy for species to cope with a warming climate [78]. Unlike the responses observed in D_pole, species in the low-emission scenarios SSP126 and SSP245 (Figure 7) did not consistently exhibit an upward migration trend, and no significant differences were observed between A_Spps and B_Spps. However, Dz did show a progressive increase in elevation in the high-emission scenario SSP585, with the peak rate of upward movement occurring between 2050 and 2100 AD (Figure 7). Analysis of suitable maps (refer to Figure S2) suggests that this elevational shift can be largely attributed to the tendency of nearly all species to colonize the highlands of Greenland. The maximum elevational displacement for each species of A_Spps was positively correlated with their centroid latitudes, ranging from 400 m to 1250 km.
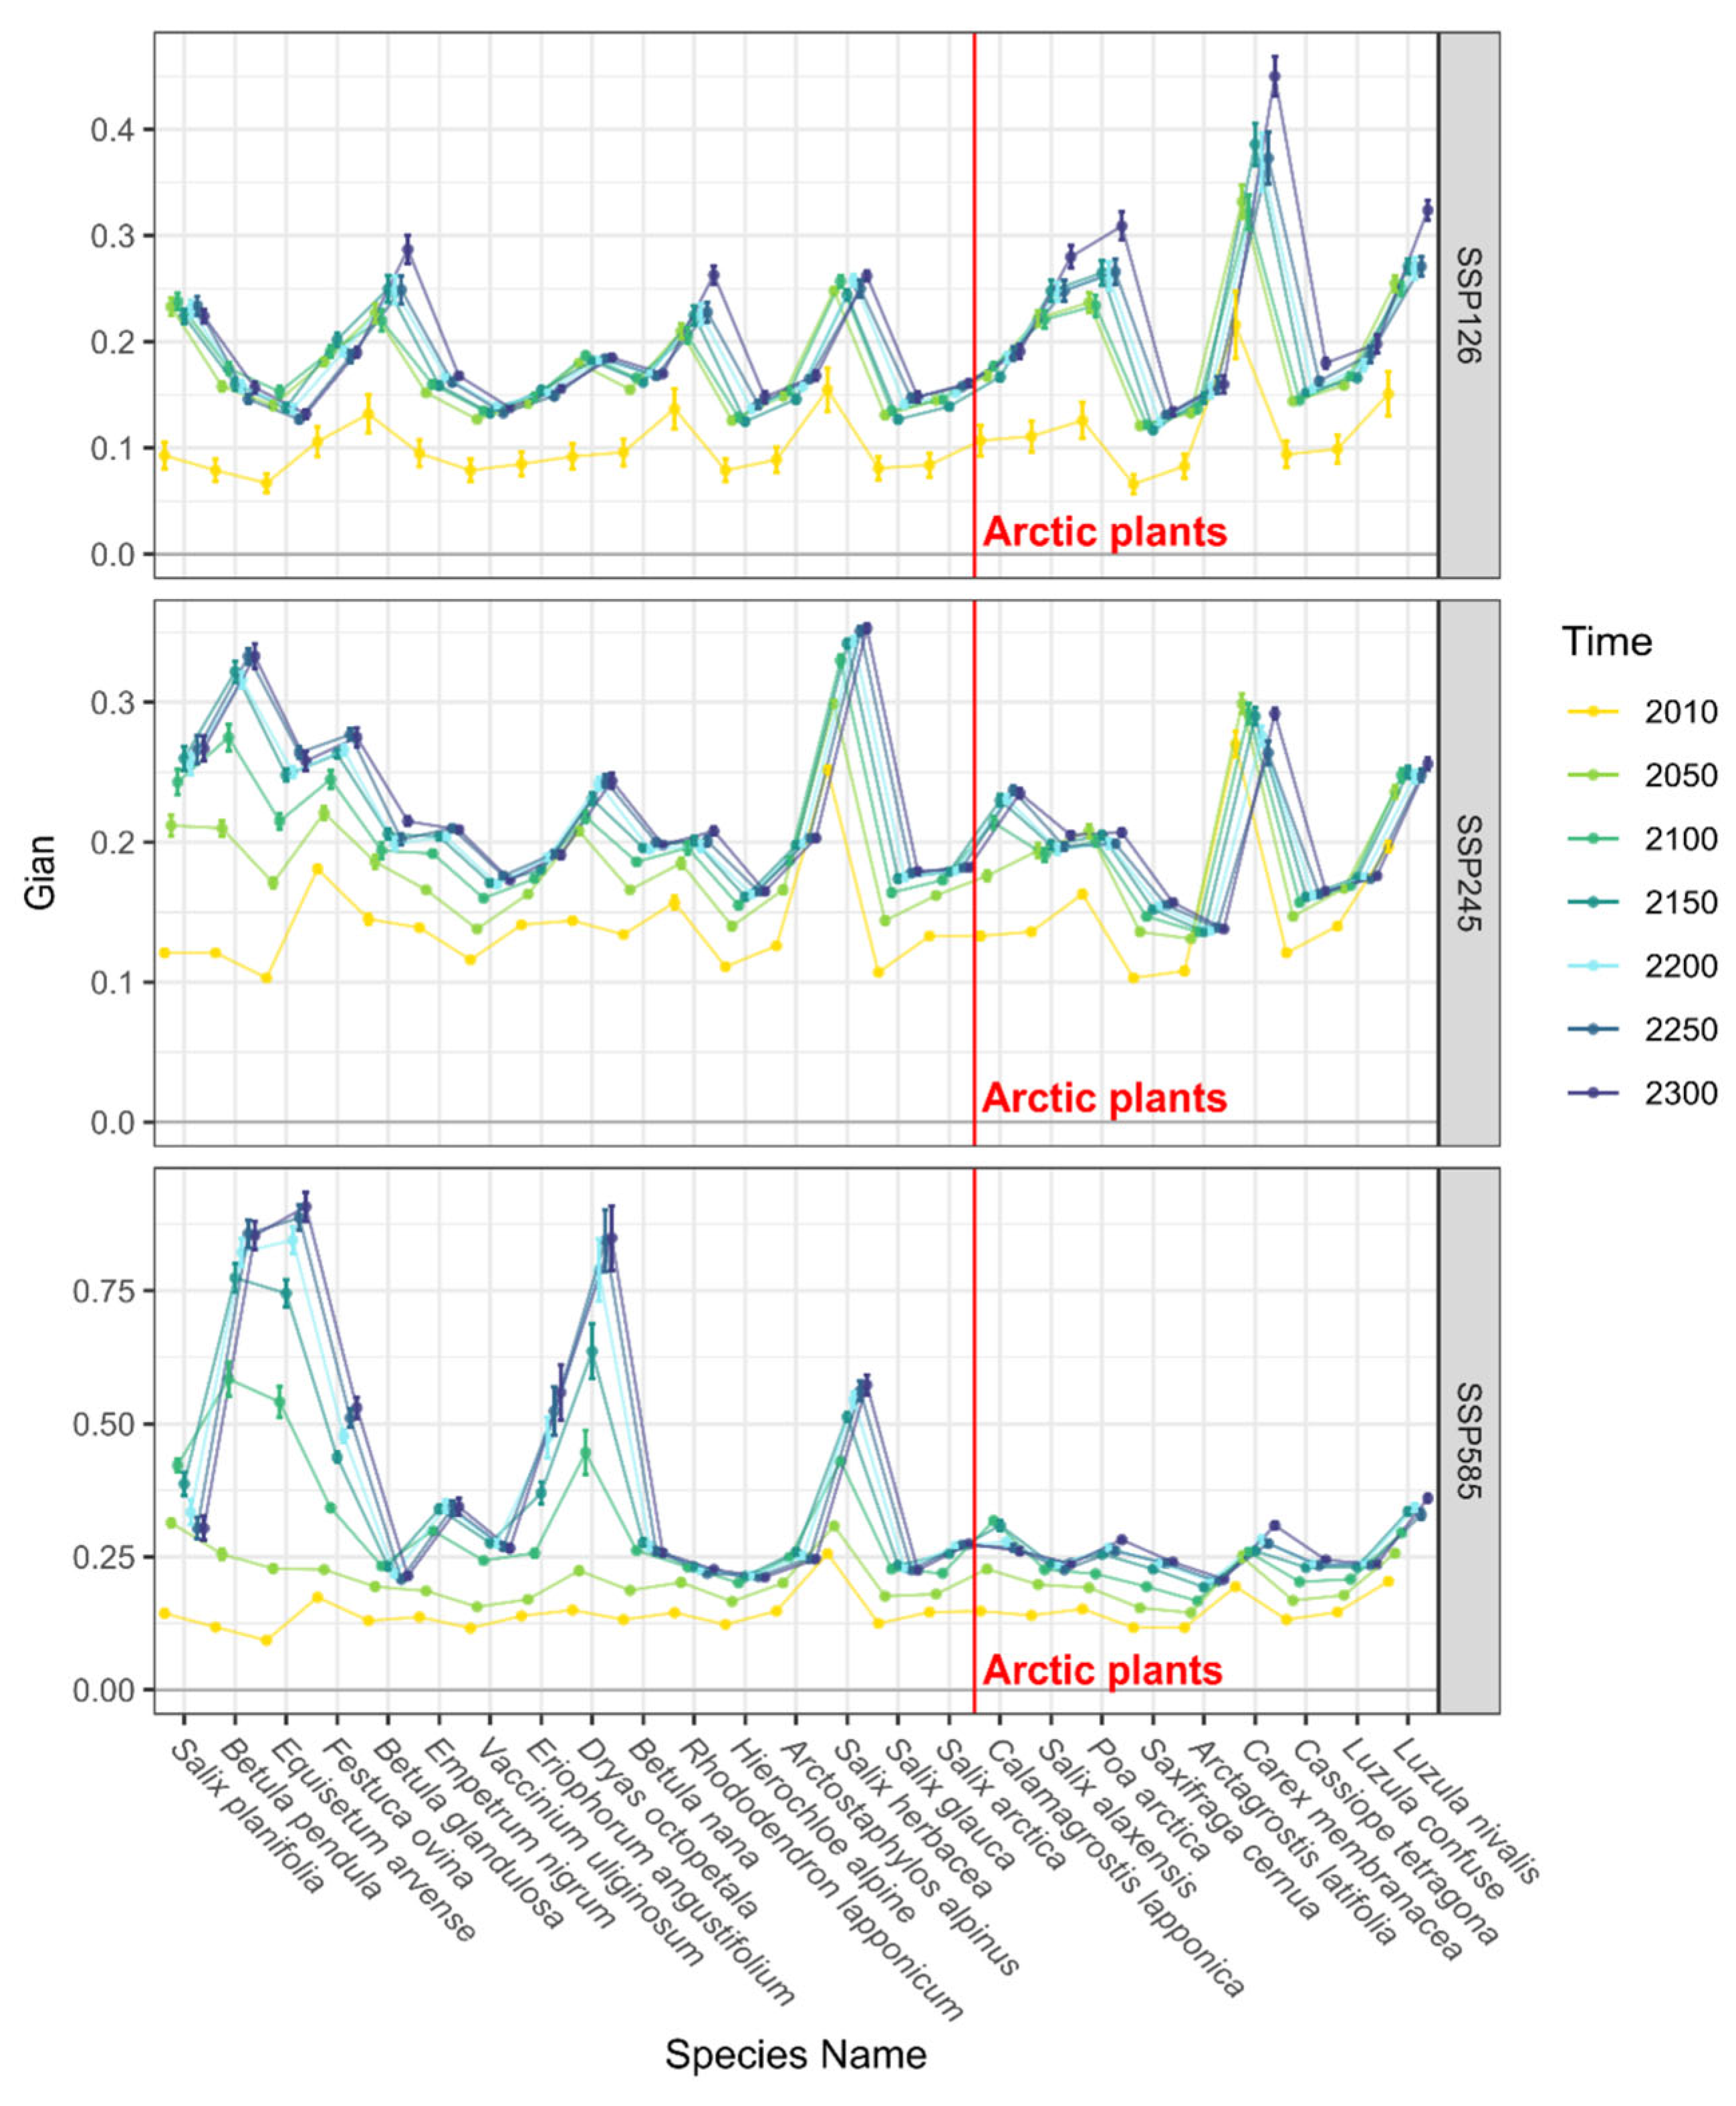
Range Dynamics (Gain, Loss, and O): Contrary to the I index, which solely reflects the final outcome of changes in range size over time, the Gain index, Loss index, and Overlap index (O index) provide a more nuanced understanding of range dynamics in response to climate change by comparing them to current range maps. The patterns of the Gain index, which represents the area of new habitat in proportion to the current range area (as shown in Figure 8), can be summarized as follows: (1) The values of range gain generally increased with the intensity of heating forcing, ordered from SSP126 to SSP245 and then SSP585. (2) The peak range gain occurred between 2010 and 2050 AD for both SSP126 and SSP245, stabilizing thereafter, whereas the gain continued until 2200 AD in SSP585. (3) No significant differences were observed among Arctic specialist species (A_Spps) and Boreal–Arctic species (B_Spps) in SSP126 or SSP245; however, a distinct stabilization in change was noted for A_Spps in SSP585, in contrast to the highly variable changes observed in B_Spps (Figure 8).
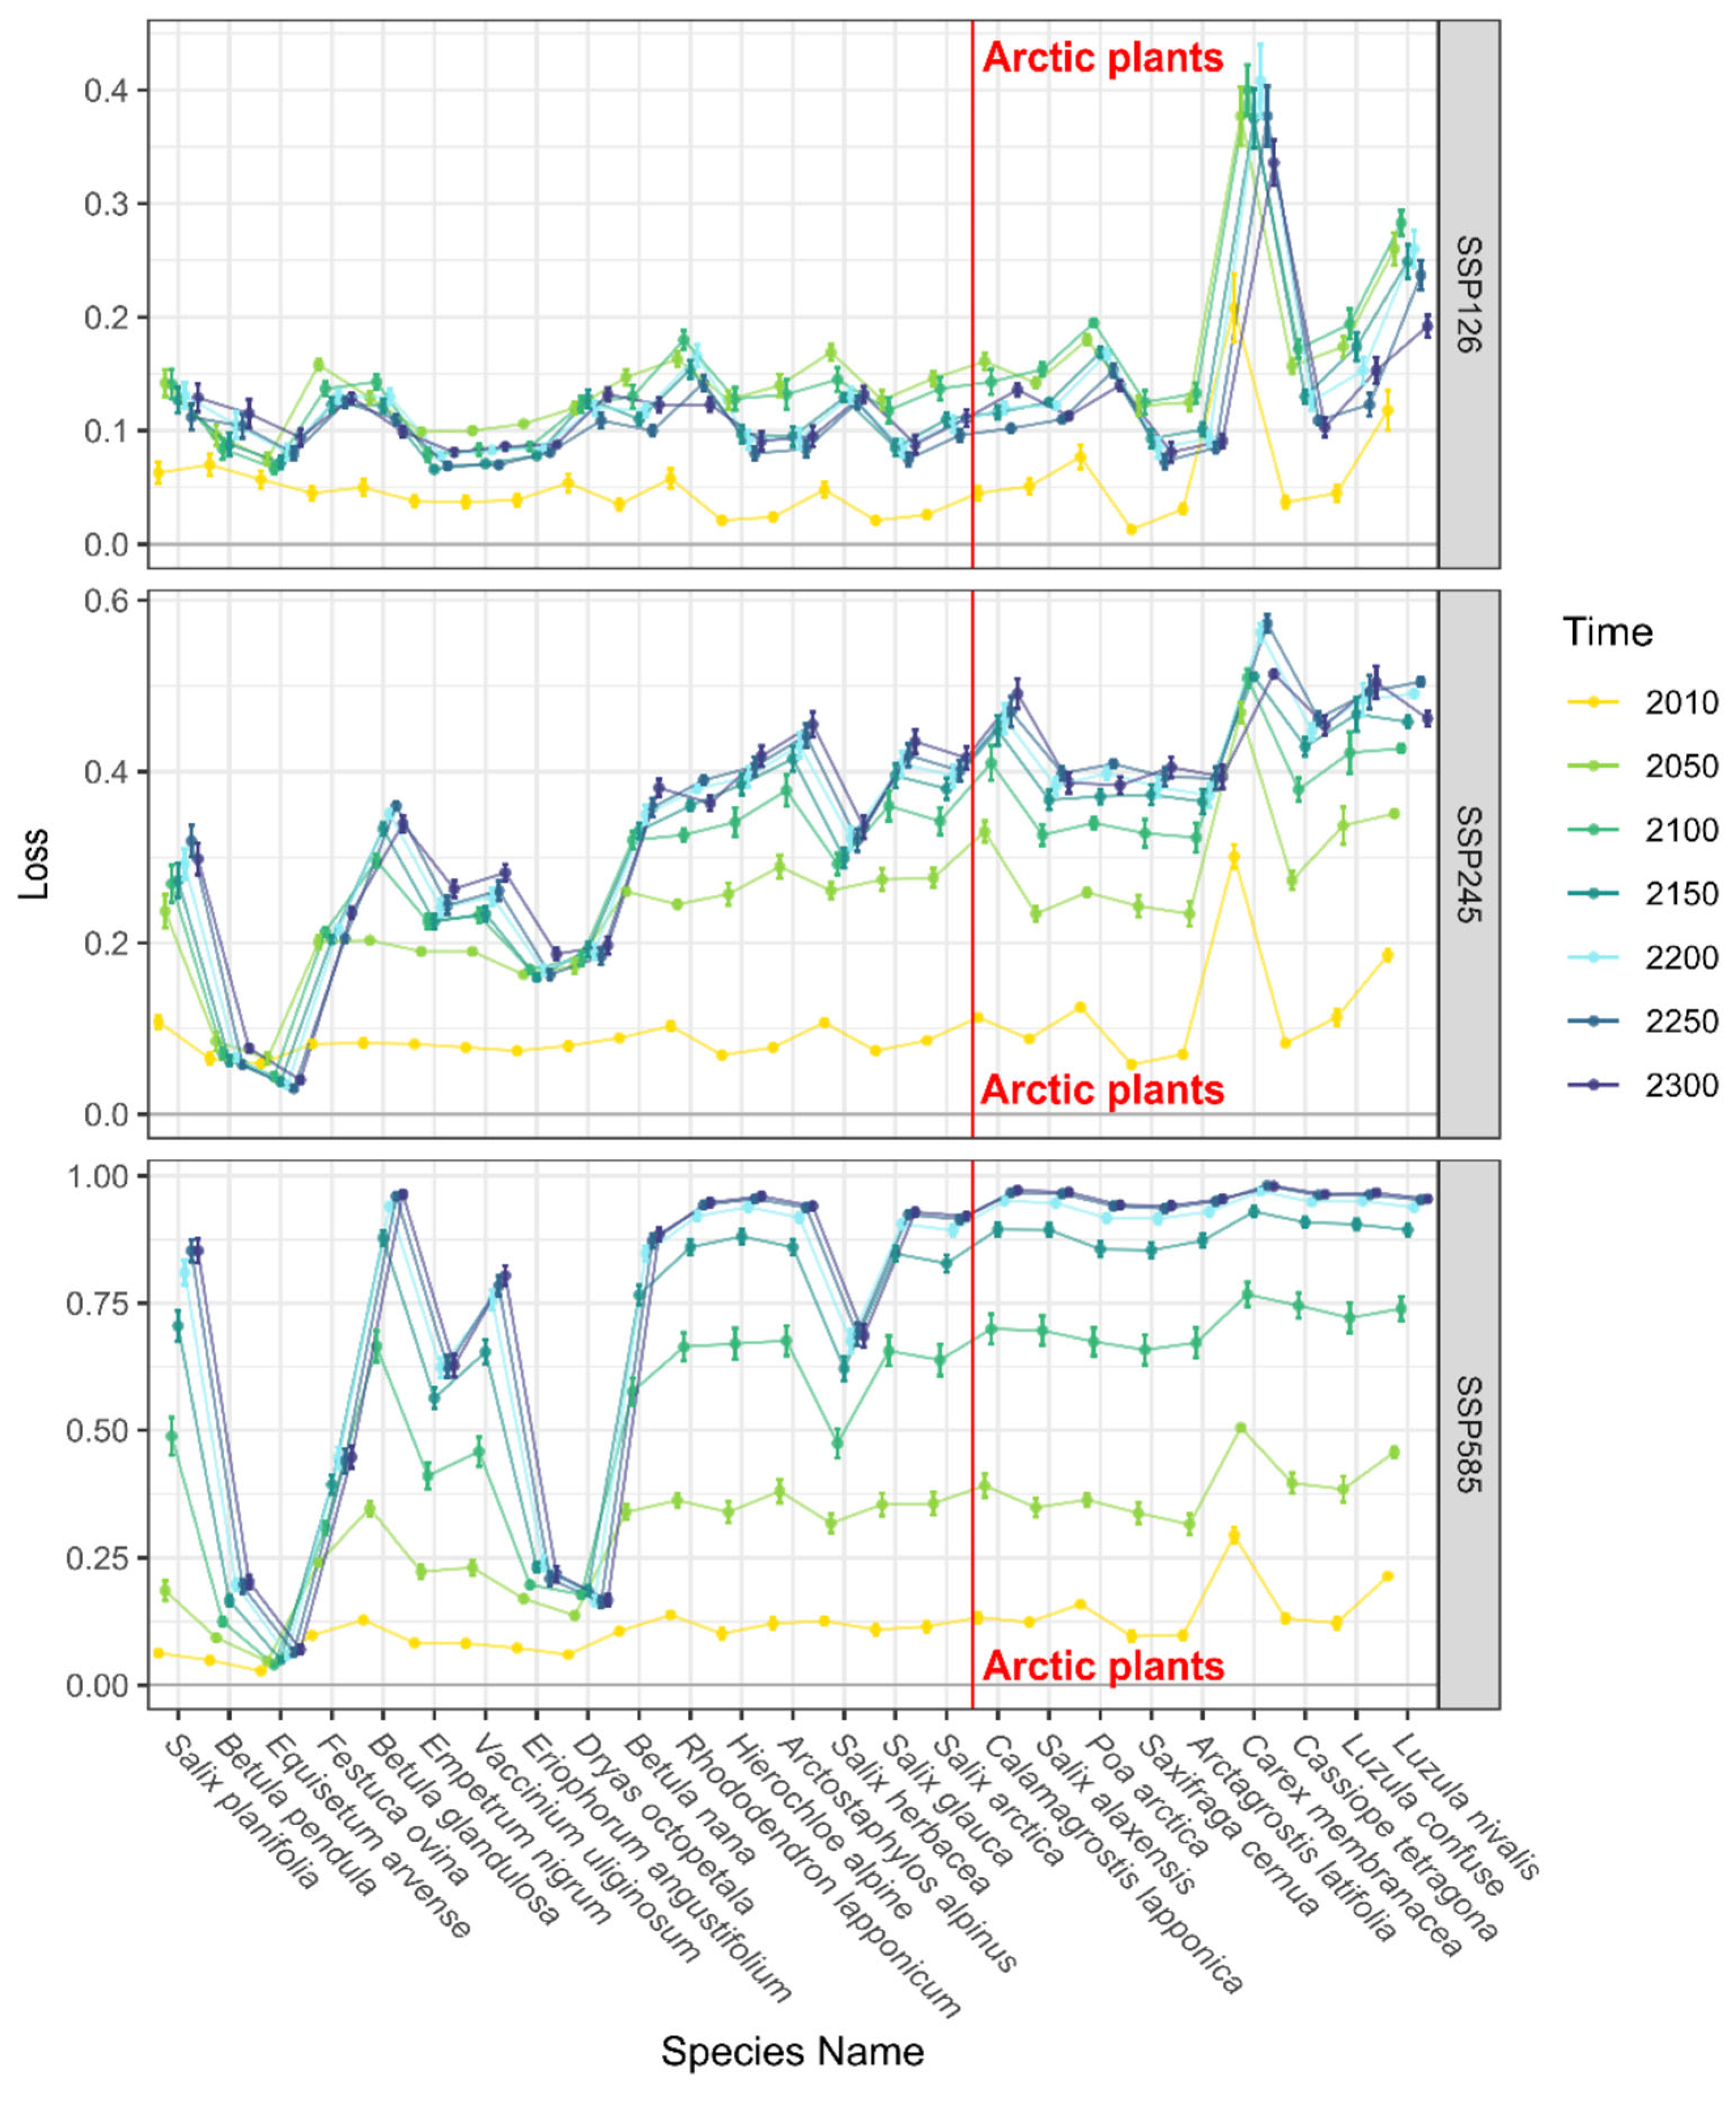
For the Loss index, which denotes the area of lost habitat in proportion to the current range area (as depicted in Figure 9), clear differences emerged between A_Spps and B_Spps across all emission scenarios. Range loss was generally higher for A_Spps than for B_Spps, although a few B_Spps exhibited a similar extent of loss. This finding may partially explain the increased vulnerability of A_Spps to climate change. It is also evident that range loss intensified with increasing heating forces from SSP126 to SSP585. The peak period for range loss in SSP126 and SSP245 was between 2010 and 2050 AD, while in SSP585, the peak was delayed to between 2050 and 2100 AD, with the trend dampening until 2200 AD. The near 1.0 Loss values (Figure 9) and limited Gain values (Figure 8) in SSP585 after 2200 AD consistently indicate severe extinction risks for A_Spps.
The range overlap ratio between predicted and current ranges (O index) offers another perspective on extinction risks. This index serves as a safety measure when migration ability is not considered, thus providing valuable insights for species inhabiting fragmented landscapes or inland geographical settings (as depicted in Figure 10). Range overlapping was generally high for all species in scenario SSP126, with a slight decline between 2010 and 2050 AD, followed by stabilization. The sole exception was the A_Spp Carex membranacea, which had a minimum O value of less than 0.6, while most other species remained above 0.75. In SSP245, the O index progressively decreased over time, peaking between 2010 and 2050 AD, and then declining thereafter. The majority of O index values were above 0.50, with A_Spps experiencing a slightly greater decline than B_Spps. In SSP585, range overlapping dropped much more significantly than in previous scenarios, with nearly all A_Spps approaching 0.1 after 2150 AD. This implies that A_Spps face very high extinction risks in the relatively distant future (2150 AD) under the high-emission scenario (SSP585) if they fail to migrate into new suitable habitats. The fragmented landscape structure and insular geographical setting near the North Pole make this threat particularly likely. The time series of species O values indicate that they will encounter critical challenges between 2100 and 2150 AD. Some B_Spps will face similar challenges, but others will be considerably less affected.

4. Discussion and Conclusions

The results indicate that Arctic plant species will undergo significant range size reductions and poleward range shifts progressing over time, with greater intensity and longer distances associated with increased heating due to more severe greenhouse gas (GHG) emissions (as indicated by Shared Socioeconomic Pathway (SSP) scenarios). Although these patterns align with expectations, this study presents, for the first time, the varying paces of range shifting processes across different SSPs. The peak timing for SSP245 occurs between 2010 and 2100, whereas for SSP585 it spans from 2010 to 2200. These findings suggest that commonly applied conservation plans should be extended to a longer timeframe should SSP245 scenarios fail. At the very least, conservation communities must assess biodiversity loss for worst-case scenarios (SSP585) rather than that anticipated under scenario SSP245.
We validated the species sink hypothesis, which posits that polar and mountain-top species are more vulnerable in a warming world due to limited migration routes, making them more prone to extinction than other species. This is demonstrated by showing that Arctic species (A_Spps) are more vulnerable to climate warming than Boreal species (B_Spps), without accounting for species squeezing effects.
The world’s Northernmost islands, such as Greenland and the Svalbard Islands, are critically important destinations for future species (refer to Figures S1 and S2) and should be recognized as future biodiversity refugia, necessitating an increase in their conservation priority. Although Greenland appears large enough to support many species, its extensive glacial coverage limits suitable plant habitats [79]. We recommend that ice-free areas in these islands are designated as nature reserves for biodiversity conservation purposes, which may conflict with Arctic development aspirations and trends [80]. The consideration of human-assisted migration for A_Spps with exceptionally high expected extinction risks is imperative due to the inability of many plants to migrate across seas [81].
Methodologically, cross-species comparison of species distribution model (SDM)-projected range shifts presents challenges [52], including (1) determining niche dimensionality to balance model fitting precision and avoid overfitting; (2) selecting variables based on model fitting degree or ecological common sense; (3) small sample occurrences leading to low model robustness; and (4) converting continuous suitability projections into binary maps to measure range shifts. We have navigated these obstacles and identified an acceptable approach that ensures the major conclusions are robust and reliable.
Firstly, the niche dimension (the number of variables in SDM) affects both model performance and projected future suitability in the SDM [82]. We decided to maintain consistent niche dimensions for all species to avoid bias due to the number of variables selected. Secondly, we sought a suitable niche dimension to balance model performance and overfitting, considering all species modeled in this study collectively. High dimensions would seriously underestimate future suitability due to overfitting. In this study, we aimed for the lowest possible niche dimensionality while maintaining moderate to good model fitting based on three model performance indices (AUC, Max Kappa, and TSS). To our satisfaction, we found that a three-dimensional niche achieved acceptable fitting performance for all species.
Secondly, we employed a mixed strategy to select prediction variables for the SDM. We initially selected candidate variables based on our ecological understanding of the bioclimatic requirements or limitations of Arctic plants, balancing thermal factors, water supplies, and their interactions. We additionally included a topographical factor (TRI) due to its complex overall effects on many important microclimate and soil conditions for plants [83]. We then applied a quantitative function in MaxEnt to calculate each variable’s contribution to the best model for each species. Variables with contributions in the top three percentiles were retained for the final model used for future predictions. We found that thermal requirements (GDD0) or limitations (T_Cold) were the leading contributors for most species, indicating that thermal factors are major driving forces for Arctic plant distributions. The results showed that including TRI was a prudent decision because the contribution percentages in MaxEnt represented the second most important dimension after thermal factors for many species. Other variables sporadically occupied the second and third ranks in a species-specific manner. The very low standard errors of contributions for all species (by randomization of partial occurrence points) indicate that the variable selection procedure is robust in our cases.
We did not encounter issues with low-occurrence data points causing instability in model production due to the well-known good performance of MaxEnt with small sample sizes and due to our sufficiently large number of effective (cleaned) occurrence data points (the minimum being 45). The small standard error in range shift indices verified this assertion.
Finally, we applied a set of shift indices based on fuzzy logic notation [76], which calculate indices directly from continuous suitable maps. This approach avoided threshold selection uncertainty in converting suitability maps to traditional binary range maps, potentially providing another way to maintain our range shifting predictions within a very low standard error range.
We fully acknowledge that a major limitation of this pilot study is the selection of representative plant species. Firstly, we omitted lower plant species (such as ferns, mosses, and lichens) due to technical difficulties in obtaining occurrence data at the species level. Secondly, we chose Arctic species that are widely distributed within Arctic regions and frequently appear in the literature. This choice may bias the results towards a less severe biodiversity crisis due to the well-recognized assumption that narrow-niche/range species are more vulnerable to climate change stress. Thus, we suspect our results may underestimate the extinction risks of polar plants as a whole based on the sample species used in this study. As for the selection of Boreal species, we attempted to match life forms, range sizes, and densities of occurrences in biodiversity datasets. However, this was carried out based on intuition without more rigorous criteria.
Therefore, we propose a more comprehensive follow-up study on Arctic plant biodiversity in response to climate change, incorporating the methodological pipeline here and some of the qualitative conclusions to form a comprehensive and quantitative study with a more rigorous study design. Firstly, focal plant species need to be sampled without bias towards broad-range and well-known species. Balancing the niche/range breadth would provide unbiased risk estimation in this critically important future biodiversity and species sink hotspot. It may be possible to analyze all plant species with the help of big data techniques and biodiversity datasets, using advanced statistical methods to offset the unbalanced sampling on the number of species with different characteristics and phylogenetic dependencies. Phylogenetically corrected multivariate regression models could be applied to quantitatively analyze the driving forces and reveal temporal and/or spatial patterns of those range shift indices [84]. With these deeper understandings and new information on range shifts and extinction risks, a holistic and detailed plant biodiversity conservation plan could be envisioned to cope with future climate change challenges in the Arctic.
In summary, it can be concluded that A_Spps will generally experience more intense and rapid range shifts than B_Spps under all SSPs. All species will face drastic range reductions in SSP585, with A_Spps being most severely affected and thus facing the highest extinction risk. Our careful methodological approach and the low standard errors of the resultant range shift indices ensure the robustness of these conclusions. Our primary research results and feasible analytical pipeline could provide significant assistance in forming conservation strategies to address the plant biodiversity crisis in this species sink hotspot.

Supplementary Materials

The following supporting information can be downloaded at: https://www.mdpi.com/article/10.3390/d17080558/s1, Figure S1: Suitability maps for the modeled species for SSP245; Figure S2: Suitability maps for the modeled species for SSP585; Table S1: Species information for the plants in Arctic/Boreal terrestrial areas; Table S2: Variable definitions of the BioPlantPolar dataset for the Arctic terrestrial plants; Table S3: Variable contributions in MaxEnt for the top-three selected variables; Table S4: Model performance indices for each species.

Author Contributions

X.K. did the overall design and supervised the production of this paper; Y.Z. and S.L. processed all the data and developed R codes for data analysis; S.L., B.Y. and Y.S. performed code running and checked resultant data layers; Y.Z. and X.K. prepared the figures and tables; and X.K. and Y.Z. wrote the paper. All authors have read and agreed to the published version of the manuscript.

Funding

This work was funded by the National Key Research and Development Program of China (Grant No. 2020YFA0608504).

Institutional Review Board Statement

Not applicable.

Data Availability Statement

Data and codes for ecological niche modeling and in producing figures of this paper are available at: https://doi.org/10.6084/m9.figshare.29377646.v2, accessed on 23 June 2025.

Conflicts of Interest

The authors declare no conflict of interest.

References

  1. Thuiller, W.; Guéguen, M.; Renaud, J.; Karger, D.N.; Zimmermann, N.E. Uncertainty in ensembles of global biodiversity scenarios. Nat. Commun. 2019, 10, 1446. [Google Scholar] [CrossRef] [PubMed]
  2. Abrahms, B.; DiPietro, D.; Graffis, A.; Hollander, A. Managing biodiversity under climate change: Challenges, frameworks, and tools for adaptation. Biodivers. Conserv. 2017, 26, 2277–2293. [Google Scholar] [CrossRef]
  3. Bellard, C.; Bertelsmeier, C.; Leadley, P.; Thuiller, W.; Courchamp, F. Impacts of climate change on the future of biodiversity. Ecol. Lett. 2012, 15, 365–377. [Google Scholar] [CrossRef] [PubMed]
  4. Garcia, R.A.; Cabeza, M.; Rahbek, C.; Araujo, M.B. Multiple Dimensions of Climate Change and Their Implications for Biodiversity. Science 2014, 344, 1247579. [Google Scholar] [CrossRef]
  5. Trew, B.T.; Maclean, I.M.D. Vulnerability of global biodiversity hotspots to climate change. Glob. Ecol. Biogeogr. 2021, 30, 768–783. [Google Scholar] [CrossRef]
  6. Kass, J.M.; Fukaya, K.; Thuiller, W.; Mori, A.S. Biodiversity modeling advances will improve predictions of nature’s contributions to people. Trends Ecol. Evol. 2024, 39, 338–348. [Google Scholar] [CrossRef]
  7. Poertner, H.O.; Scholes, R.J.; Arneth, A.; Barnes, D.K.A.; Burrows, M.T.; Diamond, S.E.; Duarte, C.M.; Kiessling, W.; Leadley, P.; Managi, S.; et al. Overcoming the coupled climate and biodiversity crises and their societal impacts. Science 2023, 380, 6642. [Google Scholar] [CrossRef] [PubMed]
  8. Antunes, A.C.; Berti, E.; Brose, U.; Hirt, M.R.; Karger, D.N.; O’Connor, L.M.J.; Pollock, L.J.; Thuiller, W.; Gauzens, B. Linking biodiversity, ecosystem function, and Nature’s contributions to people: A macroecological energy flux perspective. Trends Ecol. Evol. 2024, 39, 427–434. [Google Scholar] [CrossRef]
  9. Myrsky, E.; Mikola, J.; Kaarlejarvi, E.; Olofsson, J.; Sjogersten, S.; Tupek, B.; Mannisto, M.K.; Stark, S. Higher vascular plant abundance associated with decreased ecosystem respiration after 20 years of warming in the forest-tundra ecotone. Funct. Ecol. 2024, 38, 219–232. [Google Scholar] [CrossRef]
  10. Manlick, P.J.; Perryman, N.L.; Koltz, A.M.; Cook, J.A.; Newsome, S.D. Climate warming restructures food webs and carbon flow in high-latitude ecosystems. Nat. Clim. Change 2024, 14, 120–121. [Google Scholar] [CrossRef]
  11. Higgins, S.I.I.; Conradi, T.; Muhoko, E. Shifts in vegetation activity of terrestrial ecosystems attributable to climate trends. Nat. Geosci. 2023, 16, 147–153. [Google Scholar] [CrossRef]
  12. Schuur, E.A.G.; Abbott, B.W.; Commane, R.; Ernakovich, J.; Euskirchen, E.; Hugelius, G.; Grosse, G.; Jones, M.; Koven, C.; Leshyk, V.; et al. Permafrost and Climate Change: Carbon Cycle Feedbacks From the Warming Arctic. Annu. Rev. Environ. Resour. 2022, 47, 343–371. [Google Scholar] [CrossRef]
  13. Markley, P.T.; Gross, C.P.; Daru, B.H. The changing biodiversity of the Arctic flora in the Anthropocene. Am. J. Bot. 2025, 112, e16466. [Google Scholar] [CrossRef]
  14. Schaefer, J.A. Increases in graminoids after three decades of change in the High Arctic. Polar Res. 2023, 42. [Google Scholar] [CrossRef]
  15. Jonsdottir, I.S.; Halbritter, A.H.; Christiansen, C.T.; Althuizen, I.H.J.; Haugum, S.V.; Henn, J.J.; Bjornsdottir, K.; Maitner, B.S.; Malhi, Y.; Michaletz, S.T.; et al. Intraspecific trait variability is a key feature underlying high Arctic plant community resistance to climate warming. Ecol. Monogr. 2023, 93, e1555. [Google Scholar] [CrossRef]
  16. Mörsdorf, M.A.; Cooper, E.J. Habitat determines plant community responses to climate change in the High Arctic1. Arct. Sci. 2022, 8, 722–743. [Google Scholar] [CrossRef]
  17. Rantanen, M.; Karpechko, A.Y.; Lipponen, A.; Nordling, K.; Hyvärinen, O.; Ruosteenoja, K.; Vihma, T.; Laaksonen, A. The Arctic has warmed nearly four times faster than the globe since 1979. Commun. Earth Environ. 2022, 3, 168. [Google Scholar] [CrossRef]
  18. Chylek, P.; Folland, C.; Klett, J.D.; Wang, M.Y.; Hengartner, N.; Lesins, G.; Dubey, M.K. Annual Mean Arctic Amplification 1970–2020: Observed and Simulated by CMIP6 Climate Models. Geophys. Res. Lett. 2022, 49, e2022GL099371. [Google Scholar] [CrossRef]
  19. Niskanen, A.K.J.; Niittynen, P.; Aalto, J.; Väre, H.; Luoto, M. Lost at high latitudes: Arctic and endemic plants under threat as climate warms. Divers. Distrib. 2019, 25, 809–821. [Google Scholar] [CrossRef]
  20. Post, E.; Alley, R.B.; Christensen, T.R.; Macias-Fauria, M.; Forbes, B.C.; Gooseff, M.N.; Iler, A.; Kerby, J.T.; Laidre, K.L.; Mann, M.E.; et al. The polar regions in a 2 °C warmer world. Sci. Adv. 2019, 5, eaaw9883. [Google Scholar] [CrossRef] [PubMed]
  21. Gallois, E.C.; Myers-Smith, I.H.; Iversen, C.M.; Salmon, V.G.; Turner, L.L.; An, R.; Elmendorf, S.C.; Collins, C.G.; Anderson, M.J.R.; Young, A.; et al. Tundra Vegetation Community Type, Not Microclimate, Controls Asynchrony of Above- and Below-Ground Phenology. Glob. Change Biol. 2025, 31, e70153. [Google Scholar] [CrossRef]
  22. Finne, E.A.; Bjerke, J.W.; Stordal, F.; Tallaksen, L.M. Lichens are more tolerant against winter warming stress than vascular and non-vascular plants: Insights from an alpine field experiment. J. Ecol. 2025, 113, 518–530. [Google Scholar] [CrossRef]
  23. Quan, Q.; He, N.; Zhang, R.; Wang, J.; Luo, Y.; Ma, F.; Pan, J.; Wang, R.; Liu, C.; Zhang, J.; et al. Plant height as an indicator for alpine carbon sequestration and ecosystem response to warming. Nat. Plants 2024, 10, 890–900. [Google Scholar] [CrossRef] [PubMed]
  24. Berner, L.T.; Orndahl, K.M.; Rose, M.; Tamstorf, M.; Arndal, M.F.; Alexander, H.D.; Humphreys, E.R.; Loranty, M.M.; Ludwig, S.M.; Nyman, J.; et al. The Arctic Plant Aboveground Biomass Synthesis Dataset. Sci. Data 2024, 11, 305. [Google Scholar] [CrossRef]
  25. Labrecque-Foy, J.-P.; Gaspard, A.; Simard, M.; Boudreau, S. Radial growth of subarctic tree and shrub species: Relationships with climate and association with the greening of the forest-tundra ecotone of subarctic Quebec, Canada. Arct. Sci. 2024, 10, 201–214. [Google Scholar] [CrossRef]
  26. Johnson, S.A.; Ober, H.K.; Adams, D.C. Are keystone species effective umbrellas for habitat conservation? A spatially explicit approach. J. Nat. Conserv. 2017, 37, 47–55. [Google Scholar] [CrossRef]
  27. Marjakangas, E.-L.; Santangeli, A.; Kujala, H.; Mammola, S.; Lehikoinen, A. Identifying ‘climate keystone species’ as a tool for conserving ecological communities under climate change. Divers. Distrib. 2023, 29, 1341–1354. [Google Scholar] [CrossRef]
  28. Narango, D.L.; Tallamy, D.W.; Shropshire, K.J. Few keystone plant genera support the majority of Lepidoptera species. Nat. Commun. 2020, 11, 5751. [Google Scholar] [CrossRef]
  29. Patsopoulos, N.A.; Baranzini, S.E.; Santaniello, A.; Shoostari, P.; Cotsapas, C.; Wong, G.; Beecham, A.H.; James, T.; Replogle, J.; Vlachos, I.S.; et al. Multiple sclerosis genomic map implicates peripheral immune cells and microglia in susceptibility. Science 2019, 365, eaav7188. [Google Scholar] [CrossRef]
  30. Parmesan, C. Ecological and evolutionary responses to recent climate change. Annu. Rev. Ecol. Evol. Syst. 2006, 37, 637–669. [Google Scholar] [CrossRef]
  31. Warren, R.; Price, J.; Graham, E.; Forstenhaeusler, N.; VanDerWal, J. The projected effect on insects, vertebrates, and plants of limiting global warming to 1.5 °C rather than 2 °C. Science 2018, 360, 791–795. [Google Scholar] [CrossRef]
  32. Parmesan, C.; Yohe, G. A globally coherent fingerprint of climate change impacts across natural systems. Nature 2003, 421, 37–42. [Google Scholar] [CrossRef]
  33. Walther, G.R.; Post, E.; Convey, P.; Menzel, A.; Parmesan, C.; Beebee, T.J.C.; Fromentin, J.M.; Hoegh-Guldberg, O.; Bairlein, F. Ecological responses to recent climate change. Nature 2002, 416, 389–395. [Google Scholar] [CrossRef]
  34. Phoenix, G.K.; Bjerke, J.W.; Bjork, R.G.; Blok, D.; Bryn, A.; Callaghan, T.V.; Christiansen, C.T.; Cunliffe, A.M.; Davidson, S.J.; Epstein, H.E.; et al. Browning events in Arctic ecosystems: Diverse causes with common consequences. PLoS Clim. 2025, 4, e0000570. [Google Scholar] [CrossRef]
  35. Choler, P.; Bayle, A.; Fort, N.; Gascoin, S. Waning snowfields have transformed into hotspots of greening within the alpine zone. Nat. Clim. Change 2025, 15, 80–85. [Google Scholar] [CrossRef]
  36. Karlsen, S.R.; Elvebakk, A.; Stendardi, L.; Hogda, K.A.; Macias-Fauria, M. Greening of Svalbard. Sci. Total Environ. 2024, 945, 174130. [Google Scholar] [CrossRef]
  37. Phoenix, G.K.; Treharne, R. Arctic greening and browning: Challenges and a cascade of complexities. Glob. Change Biol. 2022, 28, 3481–3483. [Google Scholar] [CrossRef]
  38. Phoenix, G.K.; Bjerke, J.W. Arctic browning: Extreme events and trends reversing arctic greening. Glob. Change Biol. 2016, 22, 2960–2962. [Google Scholar] [CrossRef]
  39. Myers-Smith, I.H.; Elmendorf, S.C.; Beck, P.S.A.; Wilmking, M.; Hallinger, M.; Blok, D.; Tape, K.D.; Rayback, S.A.; Macias-Fauria, M.; Forbes, B.C.; et al. Climate sensitivity of shrub growth across the tundra biome. Nat. Clim. Change 2015, 5, 887–891. [Google Scholar] [CrossRef]
  40. Myers-Smith, I.H.; Forbes, B.C.; Wilmking, M.; Hallinger, M.; Lantz, T.; Blok, D.; Tape, K.D.; Macias-Fauria, M.; Sass-Klaassen, U.; Levesque, E.; et al. Shrub expansion in tundra ecosystems: Dynamics, impacts and research priorities. Environ. Res. Lett. 2011, 6, 045509. [Google Scholar] [CrossRef]
  41. Seider, J.H.; Lantz, T.C.; Bone, C. Tundra shrub expansion in a warming climate and the influence of data type on models of habitat suitability. Arct. Antarct. Alp. Res. 2022, 54, 488–506. [Google Scholar] [CrossRef]
  42. Mekonnen, Z.A.; Riley, W.J.; Berner, L.T.; Bouskill, N.J.; Torn, M.S.; Iwahana, G.; Breen, A.L.; Myers-Smith, I.H.; Criado, M.G.; Liu, Y.; et al. Arctic tundra shrubification: A review of mechanisms and impacts on ecosystem carbon balance. Environ. Res. Lett. 2021, 16, 053001. [Google Scholar] [CrossRef]
  43. Taylor, J.J.; Lawler, J.P.; Aronsson, M.; Barry, T.; Bjorkman, A.D.; Christensen, T.; Coulson, S.J.; Cuyler, C.; Ehrich, D.; Falk, K.; et al. Arctic terrestrial biodiversity status and trends: A synopsis of science supporting the CBMP State of Arctic Terrestrial Biodiversity Report. Ambio 2020, 49, 833–847. [Google Scholar] [CrossRef] [PubMed]
  44. van der Wal, R.; Stien, A. High-arctic plants like it hot: A long-term investigation of between-year variability in plant biomass. Ecology 2014, 95, 3414–3427. [Google Scholar] [CrossRef]
  45. Henry, G.H.R.; Hollister, R.D.; Klanderud, K.; Bjork, R.G.; Bjorkman, A.D.; Elphinstone, C.; Jónsdóttir, I.S.; Molau, U.; Petraglia, A.; Oberbauer, S.F.; et al. The International Tundra Experiment (ITEX): 30 years of research on tundra ecosystems1. Arct. Sci. 2022, 8, 550–571. [Google Scholar] [CrossRef]
  46. Bjorkman, A.D.; Criado, M.G.; Myers-Smith, I.H.; Ravolainen, V.; Jonsdottir, I.S.; Westergaard, K.B.; Lawler, J.P.; Aronsson, M.; Bennett, B.; Gardfjell, H.; et al. Status and trends in Arctic vegetation: Evidence from experimental warming and long-term monitoring. Ambio 2020, 49, 678–692. [Google Scholar] [CrossRef]
  47. Zong, S.; Lembrechts, J.J.; Du, H.; He, H.S.; Wu, Z.; Li, M.; Rixen, C. Upward range shift of a dominant alpine shrub related to 50 years of snow cover change. Remote Sens. Environ. 2022, 268, 112773. [Google Scholar] [CrossRef]
  48. Nill, L.; Grunberg, I.; Ullmann, T.; Gessner, M.; Boike, J.; Hostert, P. Arctic shrub expansion revealed by Landsat-derived multitemporal vegetation cover fractions in the Western Canadian Arctic. Remote Sens. Environ. 2022, 281, 113228. [Google Scholar] [CrossRef]
  49. Chardon, N.I.; Pironon, S.; Peterson, M.L.; Doak, D.F. Incorporating intraspecific variation into species distribution models improves distribution predictions, but cannot predict species traits for a wide-spread plant species. Ecography 2020, 43, 60–74. [Google Scholar] [CrossRef]
  50. Freeman, M.S.; Dick, J.T.; Reid, N. Dealing with non-equilibrium bias and survey effort in presence-only invasive Species Distribution Models (iSDM); Predicting the range of muntjac deer in Britain and Ireland. Ecol. Inform. 2022, 69, 101683. [Google Scholar] [CrossRef]
  51. Koldasbayeva, D.; Tregubova, P.; Gasanov, M.; Zaytsev, A.; Petrovskaia, A.; Burnaev, E. Challenges in data-driven geospatial modeling for environmental research and practice. Nat. Commun. 2024, 15, 10700. [Google Scholar] [CrossRef]
  52. Soley-Guardia, M.; Alvarado-Serrano, D.F.; Anderson, R.P. Top ten hazards to avoid when modeling species distributions: A didactic guide of assumptions, problems, and recommendations. Ecography 2024, 2024, e06852. [Google Scholar] [CrossRef]
  53. Zurell, D.; Franklin, J.; Koenig, C.; Bouchet, P.J.; Dormann, C.F.; Elith, J.; Fandos, G.; Feng, X.; Guillera-Arroita, G.; Guisan, A.; et al. A standard protocol for reporting species distribution models. Ecography 2020, 43, 1261–1277. [Google Scholar] [CrossRef]
  54. Riva, F.; Martin, C.J.; Acedo, C.G.; Bellon, E.N.; Keil, P.; Moran-Ordonez, A.; Fahrig, L.; Guisan, A. Incorporating effects of habitat patches into species distribution models. J. Ecol. 2024, 112, 2162–2182. [Google Scholar] [CrossRef]
  55. Santini, L.; Benitez-Lopez, A.; Maiorano, L.; Cengic, M.; Huijbregts, M.A.J. Assessing the reliability of species distribution projections in climate change research. Divers. Distrib. 2021, 27, 1035–1050. [Google Scholar] [CrossRef]
  56. Wang, F.; Sahana, M.; Pahlevanzadeh, B.; Pal, S.C.; Shit, P.K.; Piran, M.J.; Janizadeh, S.; Band, S.S.; Mosavi, A. Applying different resampling strategies in machine learning models to predict head-cut gully erosion susceptibility. Alex. Eng. J. 2021, 60, 5813–5829. [Google Scholar] [CrossRef]
  57. Tanaka, K.; Boucher, O.; Ciais, P.; Johansson, D.J.A.; Morfeldt, J. Cost-effective implementation of the Paris Agreement using flexible greenhouse gas metrics. Sci. Adv. 2021, 7, eabf9020. [Google Scholar] [CrossRef]
  58. Schoeman, D.S.; Sen Gupta, A.; Harrison, C.S.; Everett, J.D.; Brito-Morales, I.; Hannah, L.; Bopp, L.; Roehrdanz, P.R.; Richardson, A.J. Demystifying global climate models for use in the life sciences. Trends Ecol. Evol. 2023, 38, 843–858. [Google Scholar] [CrossRef]
  59. Pecl, G.T.; Araújo, M.B.; Bell, J.D.; Blanchard, J.; Bonebrake, T.C.; Chen, I.-C.; Clark, T.D.; Colwell, R.K.; Danielsen, F.; Evengård, B. Biodiversity redistribution under climate change: Impacts on ecosystems and human well-being. Science 2017, 355, eaai9214. [Google Scholar] [CrossRef]
  60. Sala, O.E.; Stuart Chapin, F.; Armesto, J.J.; Berlow, E.; Bloomfield, J.; Dirzo, R.; Huber-Sanwald, E.; Huenneke, L.F.; Jackson, R.B.; Kinzig, A. Global biodiversity scenarios for the year 2100. Science 2000, 287, 1770–1774. [Google Scholar] [CrossRef]
  61. Meinshausen, M.; Nicholls, Z.R.; Lewis, J.; Gidden, M.J.; Vogel, E.; Freund, M.; Beyerle, U.; Gessner, C.; Nauels, A.; Bauer, N. The shared socio-economic pathway (SSP) greenhouse gas concentrations and their extensions to 2500. Geosci. Model. Dev. 2020, 13, 3571–3605. [Google Scholar] [CrossRef]
  62. Patil, J.; Sharma, P.; Mhatre, K. Global warming induced stress and its impact on biodiversity. Sci. Technol. 2021, 6, 34–45. [Google Scholar]
  63. Elith, J.; Phillips, S.J.; Hastie, T.; Dudik, M.; Chee, Y.E.; Yates, C.J. A statistical explanation of MaxEnt for ecologists. Divers. Distrib. 2011, 17, 43–57. [Google Scholar] [CrossRef]
  64. Tórshavn, F.I. Conservation of Arctic Flora and Fauna (CAFF) Flora Group Workshop. Available online: https://www.geobotany.org/library/pubs/TalbotSS2008_caff_Report15.pdf (accessed on 23 June 2025).
  65. Nilsson, A.E. A changing Arctic climate: Science and policy in the Arctic Climate Impact Assessment. In Climate Governance in the Arctic; Springer: Berlin/Heidelberg, Germany, 2009; pp. 77–95. [Google Scholar]
  66. Lane, M.A.; Edwards, J.L. The global biodiversity information facility (GBIF). Syst. Assoc. Spec. Vol. 2007, 73, 1. [Google Scholar]
  67. Fick, S.E.; Hijmans, R.J. WorldClim 2: New 1-km spatial resolution climate surfaces for global land areas. Int. J. Climatol. 2017, 37, 4302–4315. [Google Scholar] [CrossRef]
  68. Steen, V.A.; Tingley, M.W.; Paton, P.W.; Elphick, C.S. Spatial thinning and class balancing: Key choices lead to variation in the performance of species distribution models with citizen science data. Methods Ecol. Evol. 2021, 12, 216–226. [Google Scholar] [CrossRef]
  69. Kou, X.; Li, Q.; Liu, S. High-resolution bioclimatic dataset derived from future climate projections for plant species distribution modeling. Ecol. Inform. 2011, 6, 196–204. [Google Scholar]
  70. Kou, X. Polar Plant Dataset; Figshare: London, UK, 2025. [Google Scholar]
  71. Yukimoto, S.; Koshiro, T.; Kawai, H.; Oshima, N.; Yoshida, K.; Urakawa, S.; Tsujino, H.; Deushi, M.; Tanaka, T.; Hosaka, M.; et al. MRI MRI-ESM2.0 Model Output Prepared for CMIP6 CMIP. World Data Center for Climate (WDCC) at DKRZ. 2023. Available online: https://www.wdc-climate.de/ui/entry?acronym=C6_5243961 (accessed on 23 June 2025).
  72. Boucher, O.; Denvil, S.; Levavasseur, G.; Cozic, A.; Caubel, A.; Foujols, M.-A.; Meurdesoif, Y.; Gastineau, G. IPSL IPSL-CM6A-LR Model Output Prepared for CMIP6 DAMIP. World Data Center for Climate (WDCC) at DKRZ. 2023. Available online: https://hdl.handle.net/21.14106/f8270bc2151936dffc83a10d69720a61f9de8eaa (accessed on 23 June 2025).
  73. Giorgetta, M.; Jungclaus, J.; Reick, C.; Legutke, S.; Brovkin, V.; Crueger, T.; Esch, M.; Fieg, K.; Glushak, K.; Gayler, V. CMIP5 Simulations of the Max Planck Institute for Meteorology (MPI-M) based on the MPI-ESM-LR model: The rcp85 Experiment, Served by ESGF. 2011. Available online: https://ipcc-browser.ipcc-data.org/browser/dataset/1260 (accessed on 23 June 2025).
  74. O’Neill, B.C.; Tebaldi, C.; Van Vuuren, D.P.; Eyring, V.; Friedlingstein, P.; Hurtt, G.; Knutti, R.; Kriegler, E.; Lamarque, J.-F.; Lowe, J. The scenario model intercomparison project (ScenarioMIP) for CMIP6. Geosci. Model. Dev. 2016, 9, 3461–3482. [Google Scholar] [CrossRef]
  75. Zhang, H.T.; Guo, W.Y.; Wang, W.T. The dimensionality reductions of environmental variables have a significant effect on the performance of species distribution models. Ecol. Evol. 2023, 13, e10747. [Google Scholar] [CrossRef] [PubMed]
  76. Kou, X.; Li, Q.; Beierkuhnlein, C.; Zhao, Y.; Liu, S. A new tool for exploring climate change induced range shifts of conifer species in China. PLoS ONE 2014, 9, e98643. [Google Scholar] [CrossRef]
  77. Oke, T.A.; Stralberg, D.; Reid, D.G.; Bennett, B.A.; Cannings, S.; Willier, C.; Fulkerson, J.R.; Cooke, H.A.; Mantyka-Pringle, C.S. Warming drives poleward range contractions of Beringian endemic plant species at high latitudes. Divers. Distrib. 2023, 29, 509–523. [Google Scholar] [CrossRef]
  78. Rew, L.J.; McDougall, K.L.; Alexander, J.M.; Daehler, C.C.; Essl, F.; Haider, S.; Kueffer, C.; Lenoir, J.; Milbau, A.; Nuñez, M.A.; et al. Moving up and over: Redistribution of plants in alpine, Arctic, and Antarctic ecosystems under global change. Arct. Antarct. Alp. Res. 2020, 52, 651–665. [Google Scholar] [CrossRef]
  79. Rastner, P.; Bolch, T.; Mölg, N.; Machguth, H.; Le Bris, R.; Paul, F. The first complete inventory of the local glaciers and ice caps on Greenland. Cryosphere 2012, 6, 1483–1495. [Google Scholar] [CrossRef]
  80. Bartsch, A.; Pointner, G.; Nitze, I.; Efimova, A.; Jakober, D.; Ley, S.; Högström, E.; Grosse, G.; Schweitzer, P. Expanding infrastructure and growing anthropogenic impacts along Arctic coasts. Environ. Res. Lett. 2021, 16, 115013. [Google Scholar] [CrossRef]
  81. Charles, K.M.; Stehlik, I. Assisted species migration and hybridization to conserve cold-adapted plants under climate change. Conserv. Biol. 2021, 35, 559–566. [Google Scholar] [CrossRef]
  82. Brun, P.; Thuiller, W.; Chauvier, Y.; Pellissier, L.; Wüest, R.O.; Wang, Z.; Zimmermann, N.E. Model complexity affects species distribution projections under climate change. J. Biogeogr. 2020, 47, 130–142. [Google Scholar] [CrossRef]
  83. Dilts, T.E.; Blum, M.E.; Shoemaker, K.T.; Weisberg, P.J.; Stewart, K.M. Topographic Ruggedness Indices in Ecology: Past, Present and Future. 2022. [CrossRef]
  84. Revell, L.J. Phylogenetic signal and linear regression on species data. Methods Ecol. Evol. 2010, 1, 319–329. [Google Scholar] [CrossRef]
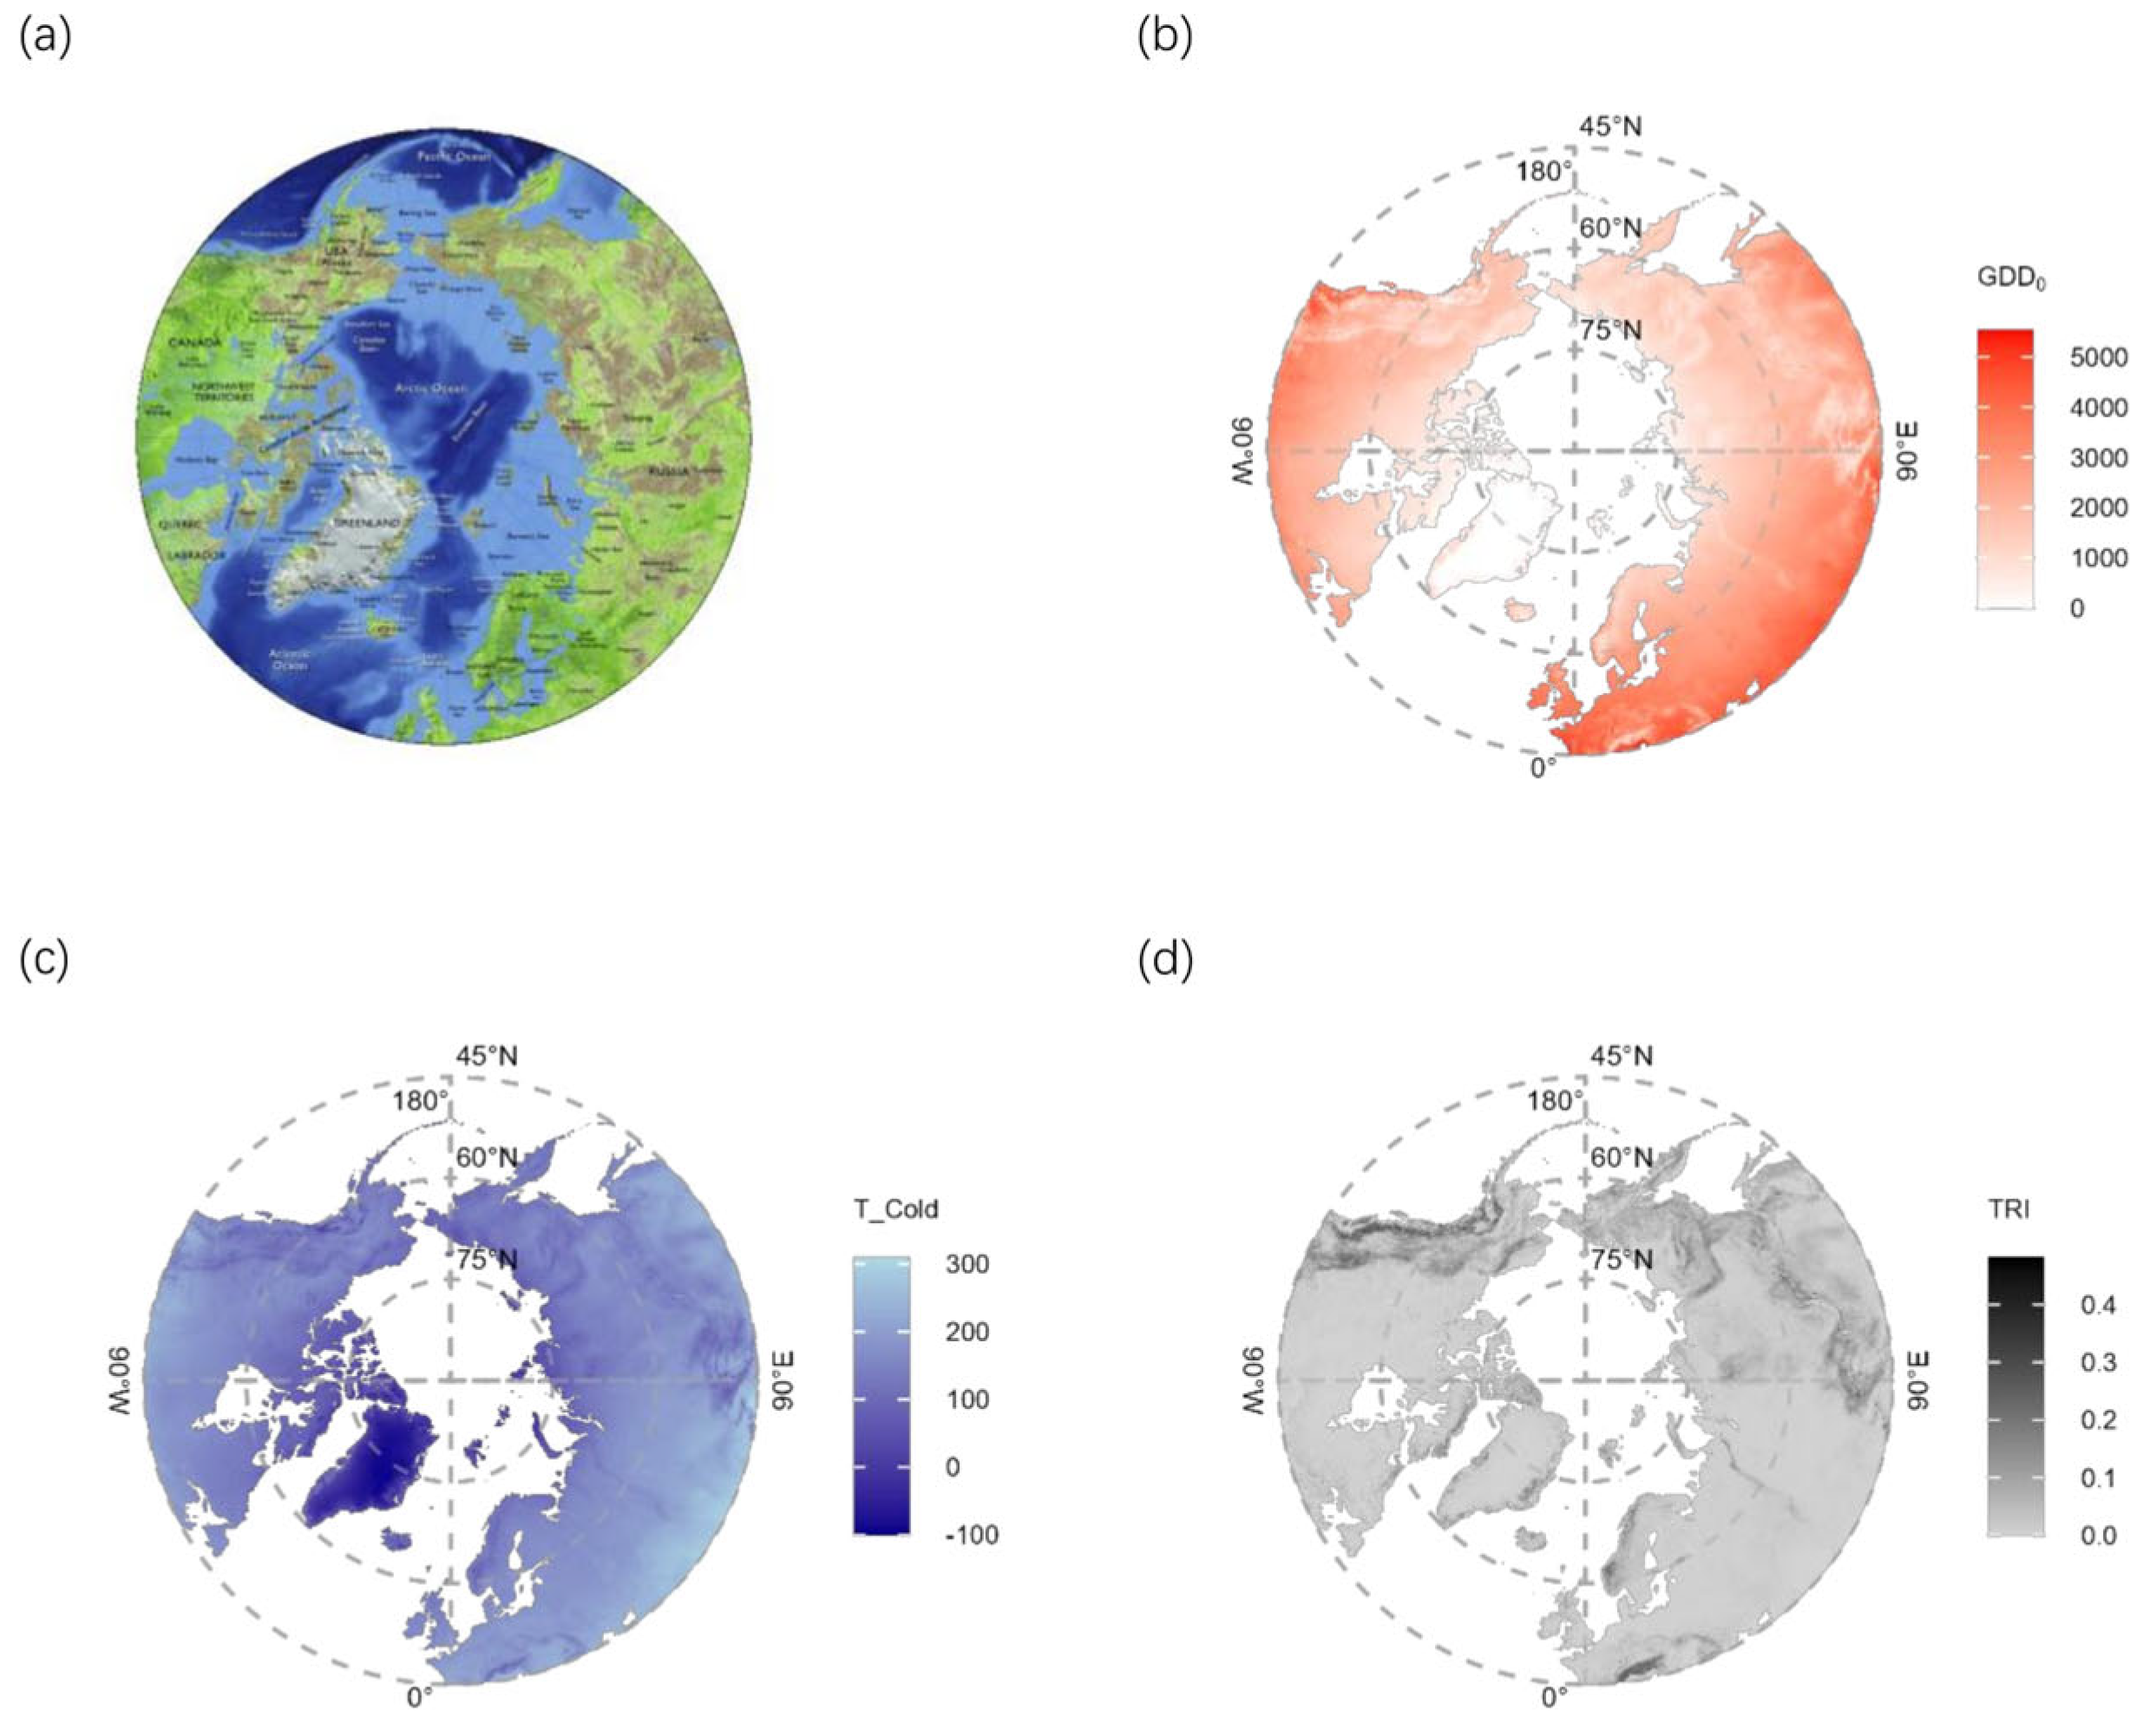
Figure 1. Maps of research area and key environmental factors. (a) Geographical location of the research boundary, rendered by elevation data of both seas and lands; (b) Map of the bioclimatic variable GDD0 (growing degree days above 0 °C); (c) Map of the bioclimatic variable T Cold (mean temperature of the coldest month); (d) Map of TRl (topographical raggedness index).
Diversity 17 00558 g001
Figure 2. Exemplar maps of variable GDD0 for BioPlantPolar dataset. Time-series map layers of BioPlantPolar growing degree days (GDD0) under the SSP585 scenario, derived from the GCM IPSL.
Diversity 17 00558 g002
Figure 3. Variable importance information for the modeled species derived from MaxEnt species distribution model. (a) Histogram of cases (species) where variables appeared as the top three most important factors; (b) percentages of importance for the top three variables of each species, derived from MaxEnt.
Diversity 17 00558 g003
Figure 4. Information on the model performances indices for the modeled species. Each point represents the mean values of model performance indices (AUC, Max Kappa, and TSS), derived from 20 replications of resampled occurrences.
Diversity 17 00558 g004
Figure 5. Time series curves of range size increment index (I) for modeled species in three GHG emission scenarios. The panels in the figure depict three Shared Socioeconomic Pathways (SSPs), representing the most conservative, average, and high-end GHG emission scenarios, respectively. Species are arranged along the x-axis in ascending order of the latitudes of their range centroids. Boreal–Arctic species (B Spps) are positioned to the left of the red bar, while pure Arctic species (A Spps) are located to the right. The error bar indicates the standard error calculated from 30 replications (10 resampled occurrences × 3 General Circulation Models).
Diversity 17 00558 g005
Figure 6. Time series curves of distances of range centroids to North Pole (D_pole) index for modeled species in three GHG emission scenarios. With the same notes as in Figure 5.
Diversity 17 00558 g006
Figure 7. Time series curves of mean elevation of species range (Dz) for modeled species in three GHG emission scenarios. With the same notes as in Figure 5.
Diversity 17 00558 g007
Figure 8. Time series curves of range gain index (Gain) for modeled species in three GHG emission scenarios. With the same notes as in Figure 5.
Diversity 17 00558 g008
Figure 9. Time series curves of range loss index (Loss) for modeled species in three GHG emission scenarios. With the same notes as in Figure 5.
Diversity 17 00558 g009
Figure 10. Time series curves of range overlap index (O) for modeled species in three GHG emission scenarios. With the same notes as in Figure 5.
Diversity 17 00558 g010
Disclaimer/Publisher’s Note: The statements, opinions and data contained in all publications are solely those of the individual author(s) and contributor(s) and not of MDPI and/or the editor(s). MDPI and/or the editor(s) disclaim responsibility for any injury to people or property resulting from any ideas, methods, instructions or products referred to in the content.