Article

Environmental Heterogeneity Drives Diversity Across Forest Strata in Hopea hainanensis Communities

1
School of Ecology, Hainan University, Haikou 570228, China
2
Rubber Research Institute, Sanya Research Institute, China Academy of Tropical Agricultural Sciences, Haikou 571101, China
*
Authors to whom correspondence should be addressed.
Diversity 2025, 17(8), 556; https://doi.org/10.3390/d17080556
Submission received: 21 June 2025 / Revised: 4 August 2025 / Accepted: 5 August 2025 / Published: 7 August 2025
(This article belongs to the Special Issue Biodiversity Conservation Planning and Assessment—2nd Edition)

Abstract

Species and phylogenetic diversity play vital roles in sustaining the structure, function, and resilience of plant communities, particularly in tropical rainforests. However, the mechanisms according to which environmental filtering and competitive exclusion influence diversity across forest layers remain insufficiently understood. In this study, we investigated the species and phylogenetic diversity patterns in two representative tropical rainforest sites—Bawangling and Jianfengling—within Hainan Tropical Rainforest National Park, China, focusing on communities associated with the endangered species Hopea hainanensis. We employed a one-way ANOVA and Pearson’s correlation analyses to examine the distribution characteristics and interrelationships among diversity indices and used Mantel tests to assess the correlations with environmental variables. Our results revealed that the plant community in Jianfengling exhibited a significantly higher species richness at the family, genus, and species levels (a total of 288 plant species have been recorded, belonging to 82 families and 183 genera) compared to that in Bawangling (a total of 212 plant species, belonging to 75 families and 162 genera). H. hainanensis held the highest importance value in the middle tree layer across both sites (IV(BWL) = 12.44; IV(JFL) = 5.73), while dominant species varied notably among other forest layers, indicating strong habitat specificity. Diversity indices, including the Simpson index, the Shannon–Wiener index, and Pielou’s evenness, were significantly higher in the large shrub layer of Jianfengling, whereas Bawangling showed a relatively higher Shannon–Wiener index in the middle shrub layer. Phylogenetic diversity (PD) and the phylogenetic structure indices (NRI and NTI) displayed distinct vertical stratification patterns between sites. Furthermore, the PD in Bawangling’s large shrub layer was positively correlated with total phosphorus in the soil, while community evenness was influenced by soil organic carbon and total nitrogen. In Jianfengling, species richness was significantly associated with soil bulk density, altitude, and pH. These findings enhance our understanding of the ecological and evolutionary processes shaping biodiversity in tropical rainforests and highlight the importance of incorporating both species and phylogenetic metrics into the conservation strategies for endangered species such as Hopea hainanensis.

1. Introduction

Biodiversity plays a fundamental role in maintaining ecosystem functionality and stability. It also forms the material basis for human survival, linking closely to human well-being and sustainable development [1]. However, biodiversity is being lost at an unprecedented rate worldwide. The 2020 United Nations Biodiversity Summit highlighted the rapid decline in global biodiversity, emphasizing its impacts on human well-being through the disruption of food chains, environmental degradation, and reduced resilience to natural disasters [2,3,4]. Therefore, protecting biodiversity is an urgent task in maintaining the Earth’s life systems and achieving sustainable human development [5]. Species diversity, as a core component of biodiversity, directly reflects the taxonomic differences among coexisting species in communities, thereby revealing the spatiotemporal changes in species composition [6,7], whereas phylogenetic diversity reflects the diversity patterns of plant communities from the perspective of phylogenetic relationships and evolutionary history by considering the traits accumulated by species during long-term evolutionary processes [8,9]. A profound correlation exists between species diversity and phylogenetic diversity: species diversity reflects the compositional differences in species within the current community, while phylogenetic diversity reveals the differentiation processes of kinship relationships and functional traits among these species throughout evolutionary history. Together, they constitute two complementary dimensions for understanding the mechanisms of biodiversity formation [10]. Therefore, research on the formation and maintenance mechanisms of community biodiversity should consider both species diversity and phylogenetic diversity in order to clarify the patterns of species diversity formation within communities from a broader perspective [11].
The occurrence of biodiversity and the mechanisms maintaining its stability have always been central topics in community ecology research [12]. Traditional studies have predominantly focused on the mechanisms of diversity maintenance at the species level within a single forest layer, rarely integrating community ecology with phylogenetics [13,14]. However, community assembly processes often exhibit distinct vertical stratification characteristics, particularly evident in tropical rainforest ecosystems, where different forest layers may be driven by distinct ecological processes [15,16]. Moreover, research on phylogenetic diversity has provided new perspectives for understanding the mechanisms of biodiversity maintenance. By quantifying the phylogenetic relationships among coexisting species, we can infer the primary ecological processes governing community assembly: phylogenetic clustering typically reflects the role of environmental filtering, while phylogenetic overdispersion indicates that competitive exclusion mechanisms have a significant influence on community assembly [17]. The current research still faces two major limitations: first, most studies have focused on the overall community level, overlooking potential differences in phylogenetic structures across different forest strata; second, there is limited research on the phylogenetic patterns of endangered plant communities, which often possess unique evolutionary histories and environmental adaptation mechanisms. These knowledge gaps not only restrict our comprehensive understanding of the mechanisms maintaining biodiversity but also, to some extent, affect the scientific rigor and effectiveness of biodiversity conservation strategies.
Hopea hainanensis, a member of the Dipterocarpaceae family, is a keystone and characteristic tree species in Hainan’s tropical rainforests. The Bawangling and Jianfengling branches of the National Park of Hainan Tropical Rainforest are the primary habitats of wild H. hainanensis populations. However, widespread cultivation of economic crops such as rubber (Hevea brasiliensis) and betel nut (Areca catechu), along with unsustainable land use practices and deforestation, has caused substantial biodiversity loss and poses a serious threat to the survival of H. hainanensis. It is classified as a Class I nationally protected wild plant in China and is listed as “Critically Endangered” by the International Union for Conservation of Nature (IUCN) [18,19]. Owing to its high wood density and resistance to disease, H. hainanensis, known for its high wood density and resistance to diseases, has become the target of extensive illegal logging, resulting in a significant decline in its population [20]. Once a dominant species in tropical rainforests, it has now been reduced to a rare species [21]. This shift may be attributed to (1) the intensification of environmental filtering, such as changes in soil nutrients; (2) a decline in its competitive ability, possibly due to phylogenetic isolation; or (3) the differential impacts of these factors across various forest layers. However, the existing research has primarily focused on resource inventories, community structure, biological traits, and genetic conservation of H. hainanensis [20,22,23,24]. However, little is known about how species and phylogenetic diversity vary across vertical forest layers in H. hainanensis communities or how these patterns are shaped by environmental factors. We aimed to investigate the distribution patterns of the species diversity and phylogenetic diversity of dominant tree species across different forest layers in the communities where H. hainanensis is located in two regions and clarify the impact of environmental heterogeneity on the species diversity and phylogenetic diversity of the communities where H. hainanensis is located in Hainan, with the aim of providing a scientific basis for the conservation and restoration of the communities where H. hainanensis is located.
This study focuses on the H. hainanensis communities in the Bawangling and Jianfengling regions of the National Park of Hainan Tropical Rainforest. Using field surveys and analyses of species and phylogenetic diversity indices, we assess the patterns of diversity across vertical forest layers. In addition, we use Mantel tests to examine the influence of environmental variables—including soil properties, topography, and climate—on diversity patterns. This research aims to address the following key questions: (1) How do environmental filtering and dispersal limitations influence the differences in species composition between the H. hainanensis communities in Bawangling and Jianfengling, considering the spatial heterogeneity of soil and topographic factors? (2) Do different forest layers (e.g., the tree layer and shrub layer) exhibit distinct phylogenetic structure patterns? (3) How do key environmental factors, such as total phosphorus, organic carbon, and microtopography, influence diversity patterns through layer-specific pathways?

2. Materials and Methods

2.1. The Study Area

The Bawangling branch and the Jianfengling branch of the National Park of Hainan Tropical Rainforest are located in the southwestern part of Hainan Island. The Bawangling branch (18°57′–19°11′ N, 109°03′–109°17′ E) spans an elevation range of 50–1654 m, while the Jianfengling branch (18°34′–18°52′ N, 108°44′–109°04′ E) has an elevation range of 112–1654 m [25]. Both areas are characterized by a tropical monsoon climate and host abundant plant resources, including nationally protected species such as Hainanodendron hainanensis, Vatica mangachapoi, and Cephalotaxus hainanensis. In Bawangling, the annual average temperature is 23.6 °C, with an average annual precipitation of 1657 mm. The soil is predominantly laterite, formed from weathered granite and limestone, which helps maintain year-round moisture within the forest. In contrast, Jianfengling experiences a slightly higher annual average temperature of 24.5 °C and an average annual precipitation of 2265.8 mm. The soil types found in this area include latosol, lateritic yellow soil, yellow soil, and dry red soil, with lateritic yellow soil and latosol being the most widespread [26].
Based on multiple field surveys, an investigation into H. hainanensis was conducted within the Bawangling and Jianfengling divisions from October to December 2024. Random sampling and typical plot methods were employed to establish 20 × 20 m plots, centered around well-developed H. hainanensis trees (11 plots in Bawangling and 10 plots in Jianfengling), with their distribution shown in Figure 1. Each plot was subdivided into four 10 × 10 m quadrats for tree surveys. Additionally, five 5 × 5 m shrub quadrats and five 1 × 1 m herb quadrats were further delineated at the plot center and each of the four corners. Comprehensive surveys were conducted within these quadrats, recording the species names, DBH (diameter at breast height), tree height, and crown width for all trees, shrubs, and herbs. Plot elevation, coordinates, canopy density, slope gradient, and other relevant parameters were also measured and documented.

2.2. Data Processing and Analysis

2.2.1. Stratification of the Forest Layers and Calculation of the Importance Values and the Similarity Indices

No tree species were recorded in the canopy layer (H ≥ 25 m) during the community survey, and the number of herbaceous layer plants (0.5 m < H) was relatively low. Based on the field survey data and following the methodology of Wang Guohong et al. [27], the data were categorized into the sub-canopy layer (8 m ≤ H < 25 m), the small tree layer (5 m ≤ H < 8 m), the tall shrub layer (5 m ≤ H < 2 m), and the medium shrub layer (2 m ≤ H < 0.5 m). The importance value was calculated using the method outlined by Zhao Y et al. [28]. To assess the similarity of the species composition between the two regions, the Jaccard index (SIJa) and the Sørensen index (SISo) were applied to calculating the species similarity across different forest layers [29].

2.2.2. Acquisition of Environmental Factors

This study examines 14 environmental factors, categorized into topographic, soil, and climatic factors. The topographic factors include altitude (AL), slope (SL), and aspect (SA). Climatic factors are represented by the mean annual temperature (MAT) and mean annual precipitation (MAP). The soil factors encompass soil pH (pH), soil bulk density (SBD), soil moisture (SM), soil organic carbon (SOC), total phosphorus (TP), total nitrogen (TN), total potassium (TK), available phosphorus (AP), and available potassium (AK). Climatic data were sourced from the WorldClimate website and extracted using the longitude and latitude coordinates in ArcGIS 10.8 [30,31]. The soil’s physical and chemical properties were determined following the procedures outlined in Soil Agricultural Chemical Analysis [32].

2.2.3. Calculation of Species Diversity and Phylogenetic Diversity Indices

Species diversity was assessed using species importance values, and the following indices were chosen to characterize the diversity of the community: The Simpson index (D) quantifies community diversity by combining species richness and relative abundance [33]. The Shannon–Wiener index (H) reflects community species diversity by considering both species richness and evenness [34]. The Margalef index (DM) provides a comprehensive measure of species richness, factoring in both the number of species and individuals in the community [35]. The Pielou index (J) serves as an evenness metric that is independent of species richness [33].
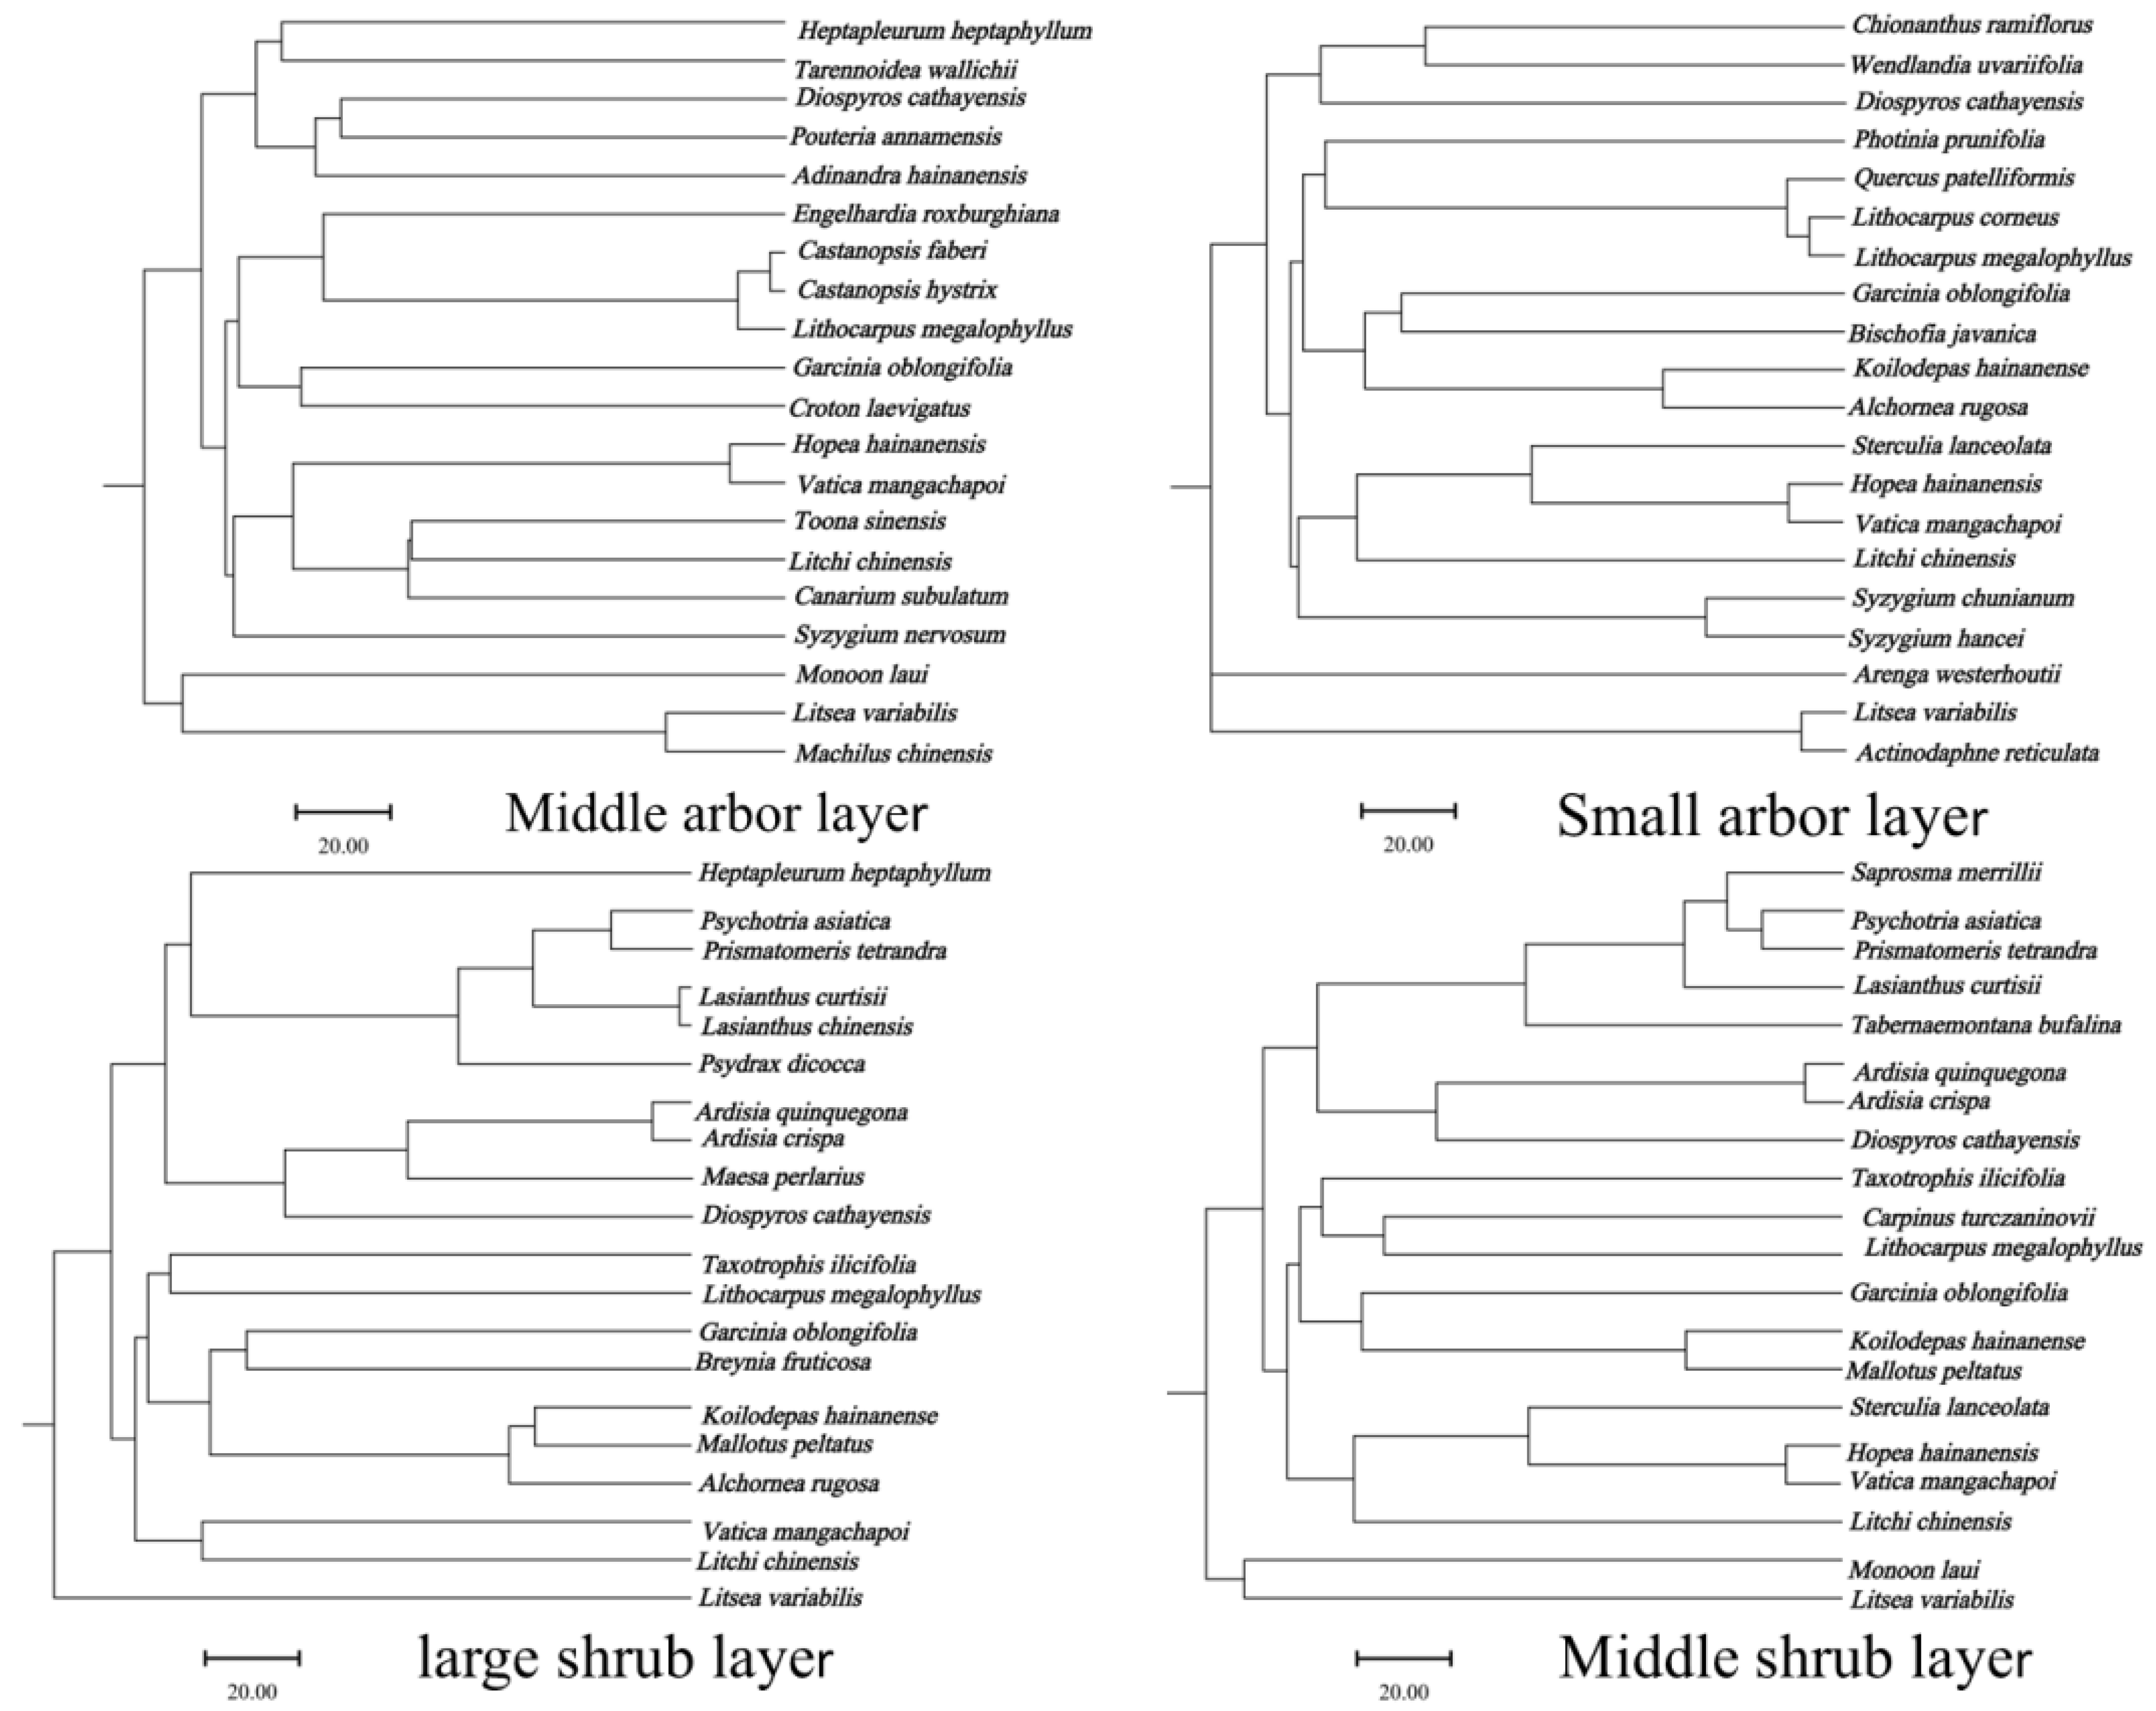
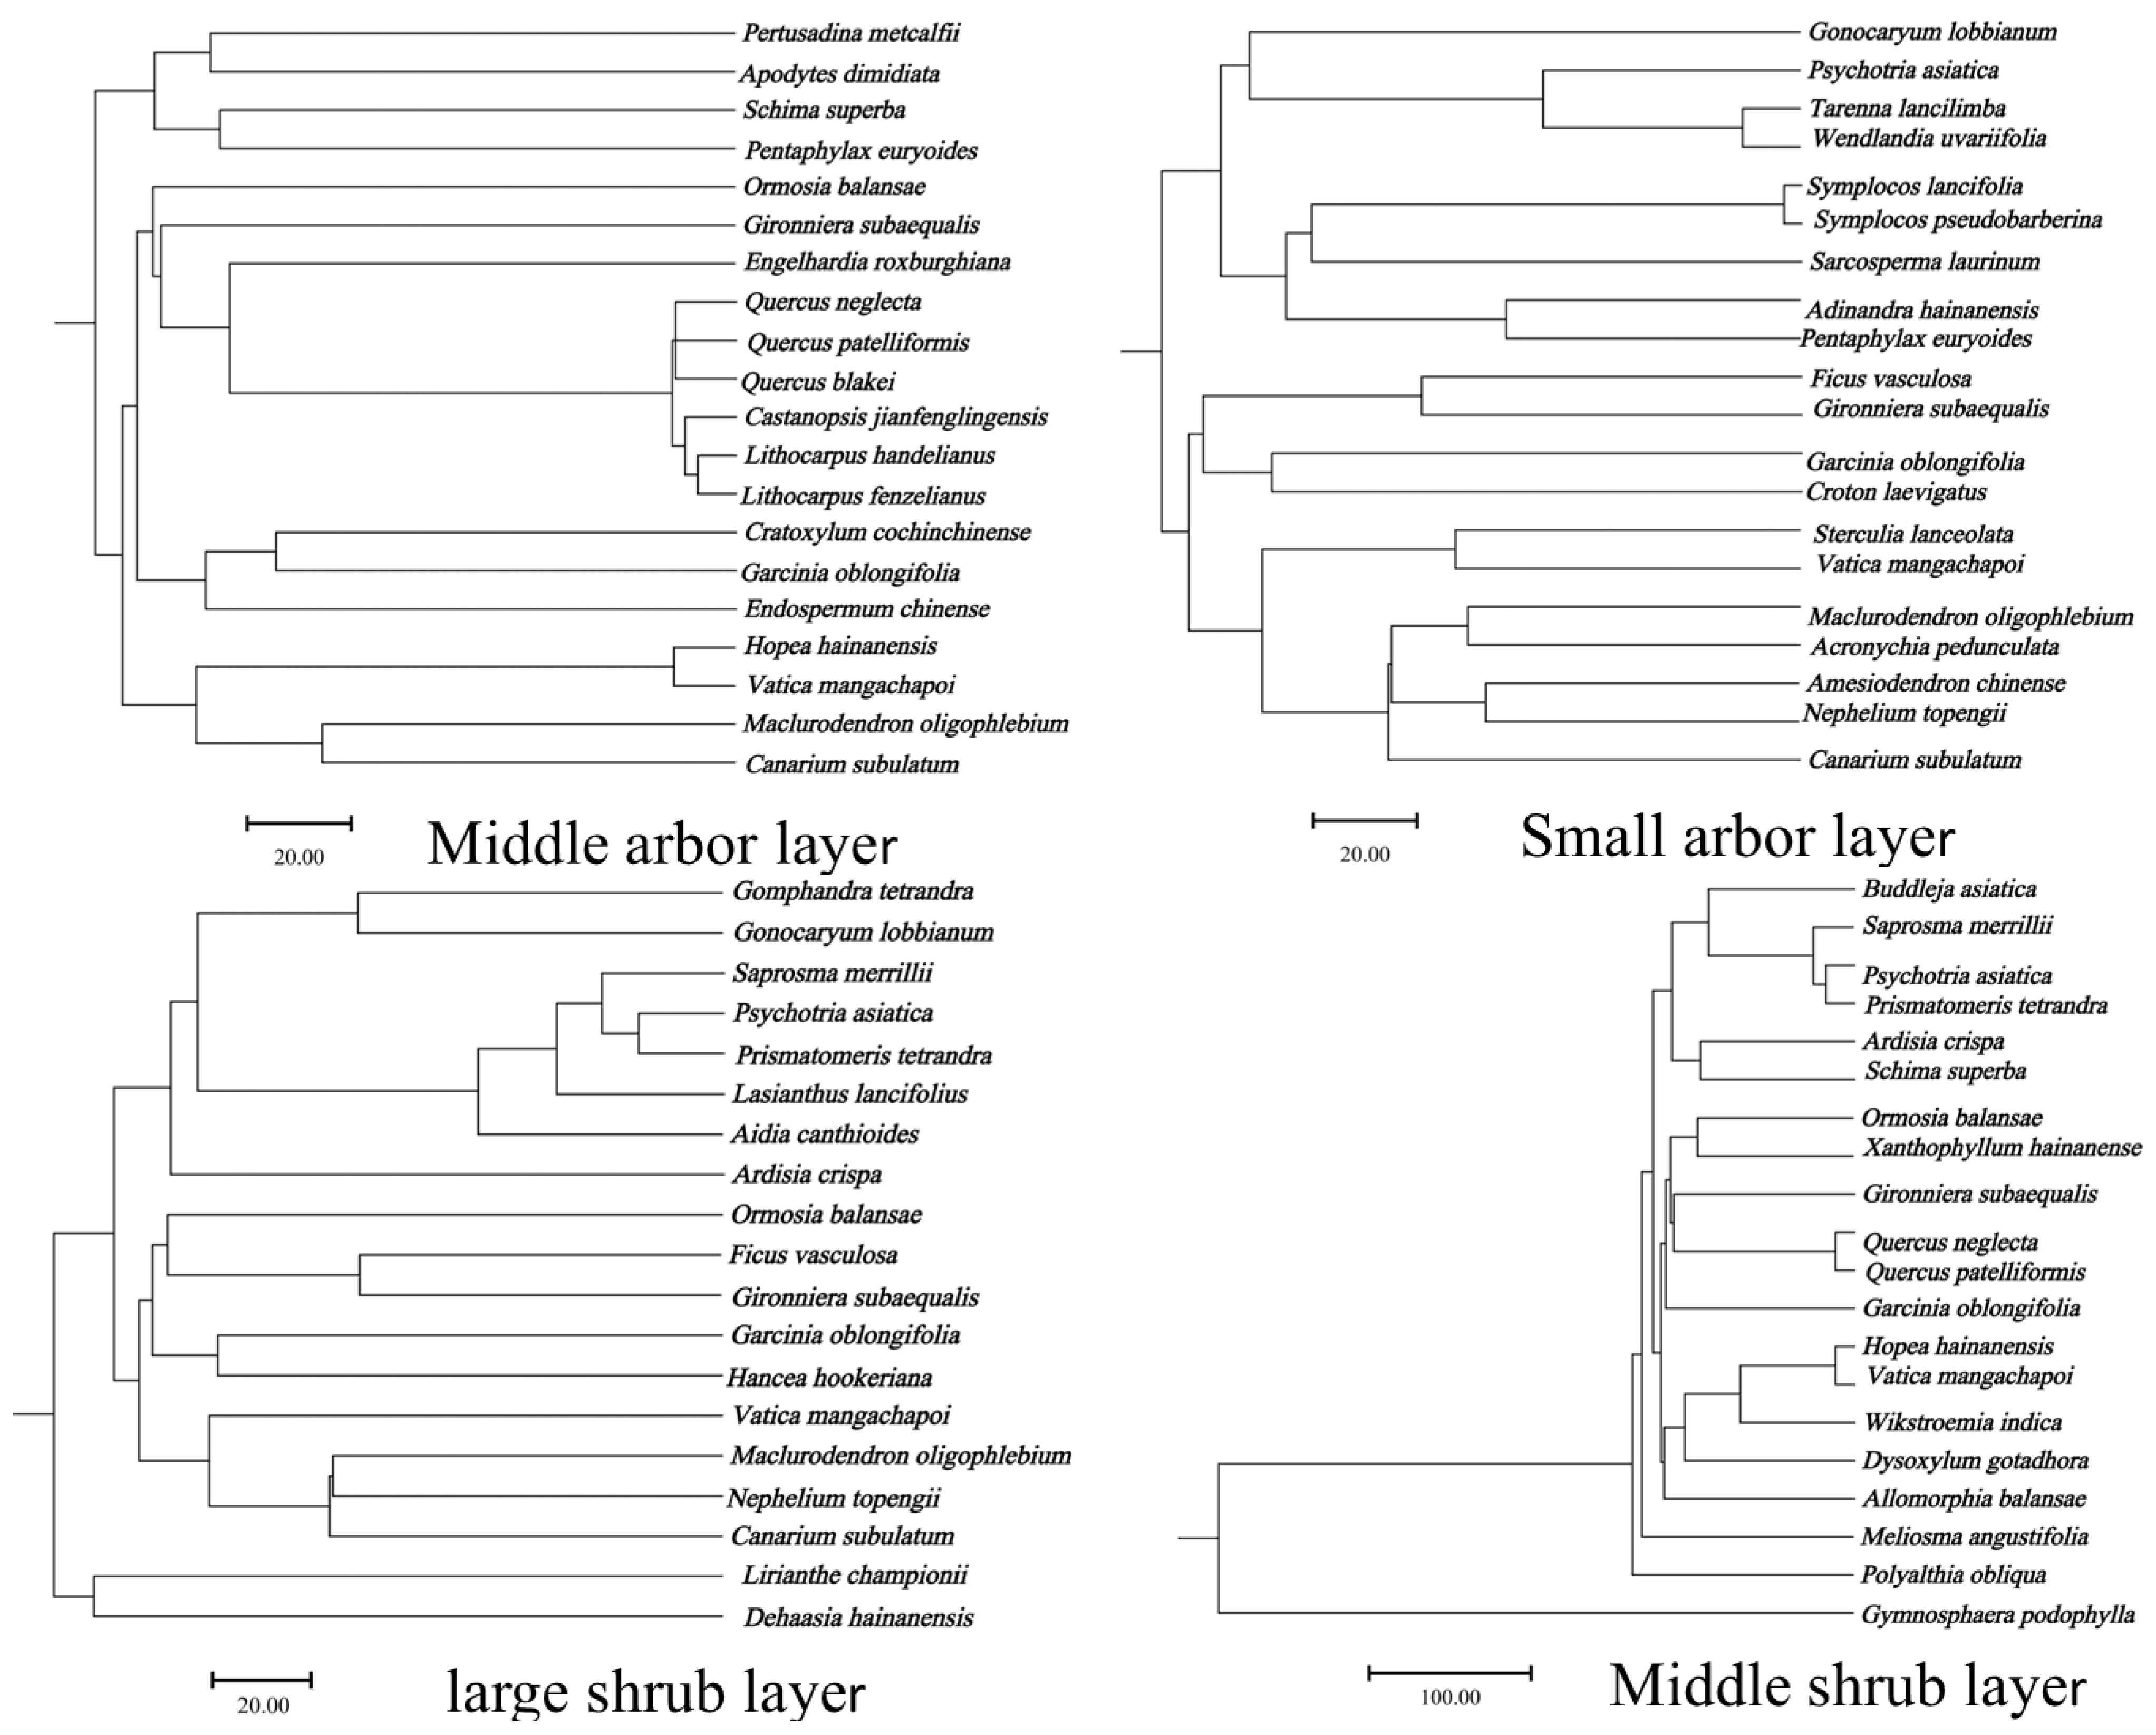
We compiled a plant checklist in the format of family/genus/species for the dominant tree species (top 20) across different regions and forest layers. We used the V.PhyloMaker2 package in R to construct phylogenetic trees (see Appendix A) and employed the picante package to calculate the phylogenetic diversity index (PD), net relatedness index (NRI), and nearest taxon index (NTI). NRI and NTI are used to quantify and describe community phylogenetic structure, where positive NRI and NTI values indicate phylogenetic clustering of species within the plot, while negative values suggest phylogenetic overdispersion [10].
A one-way ANOVA was conducted to analyze the species diversity indices and phylogenetic diversity indices of dominant tree species across different regions within the same forest layer. Pearson’s two-tailed correlation test was used to examine the correlation between the species diversity indices and phylogenetic diversity indices of dominant tree species across different forest layers. In addition, the Mantel test was utilized to explore the relationships between soil factors and species diversity indices, as well as phylogenetic diversity indices, in order to clarify the key regulatory role of environmental heterogeneity in the diversity of the community where H. hainanensis is located.

3. Results

3.1. Characteristics of the Community Where Hopea hainanensis Is Located

3.1.1. Species Composition of Hopea hainanensis Communities in Different Regions

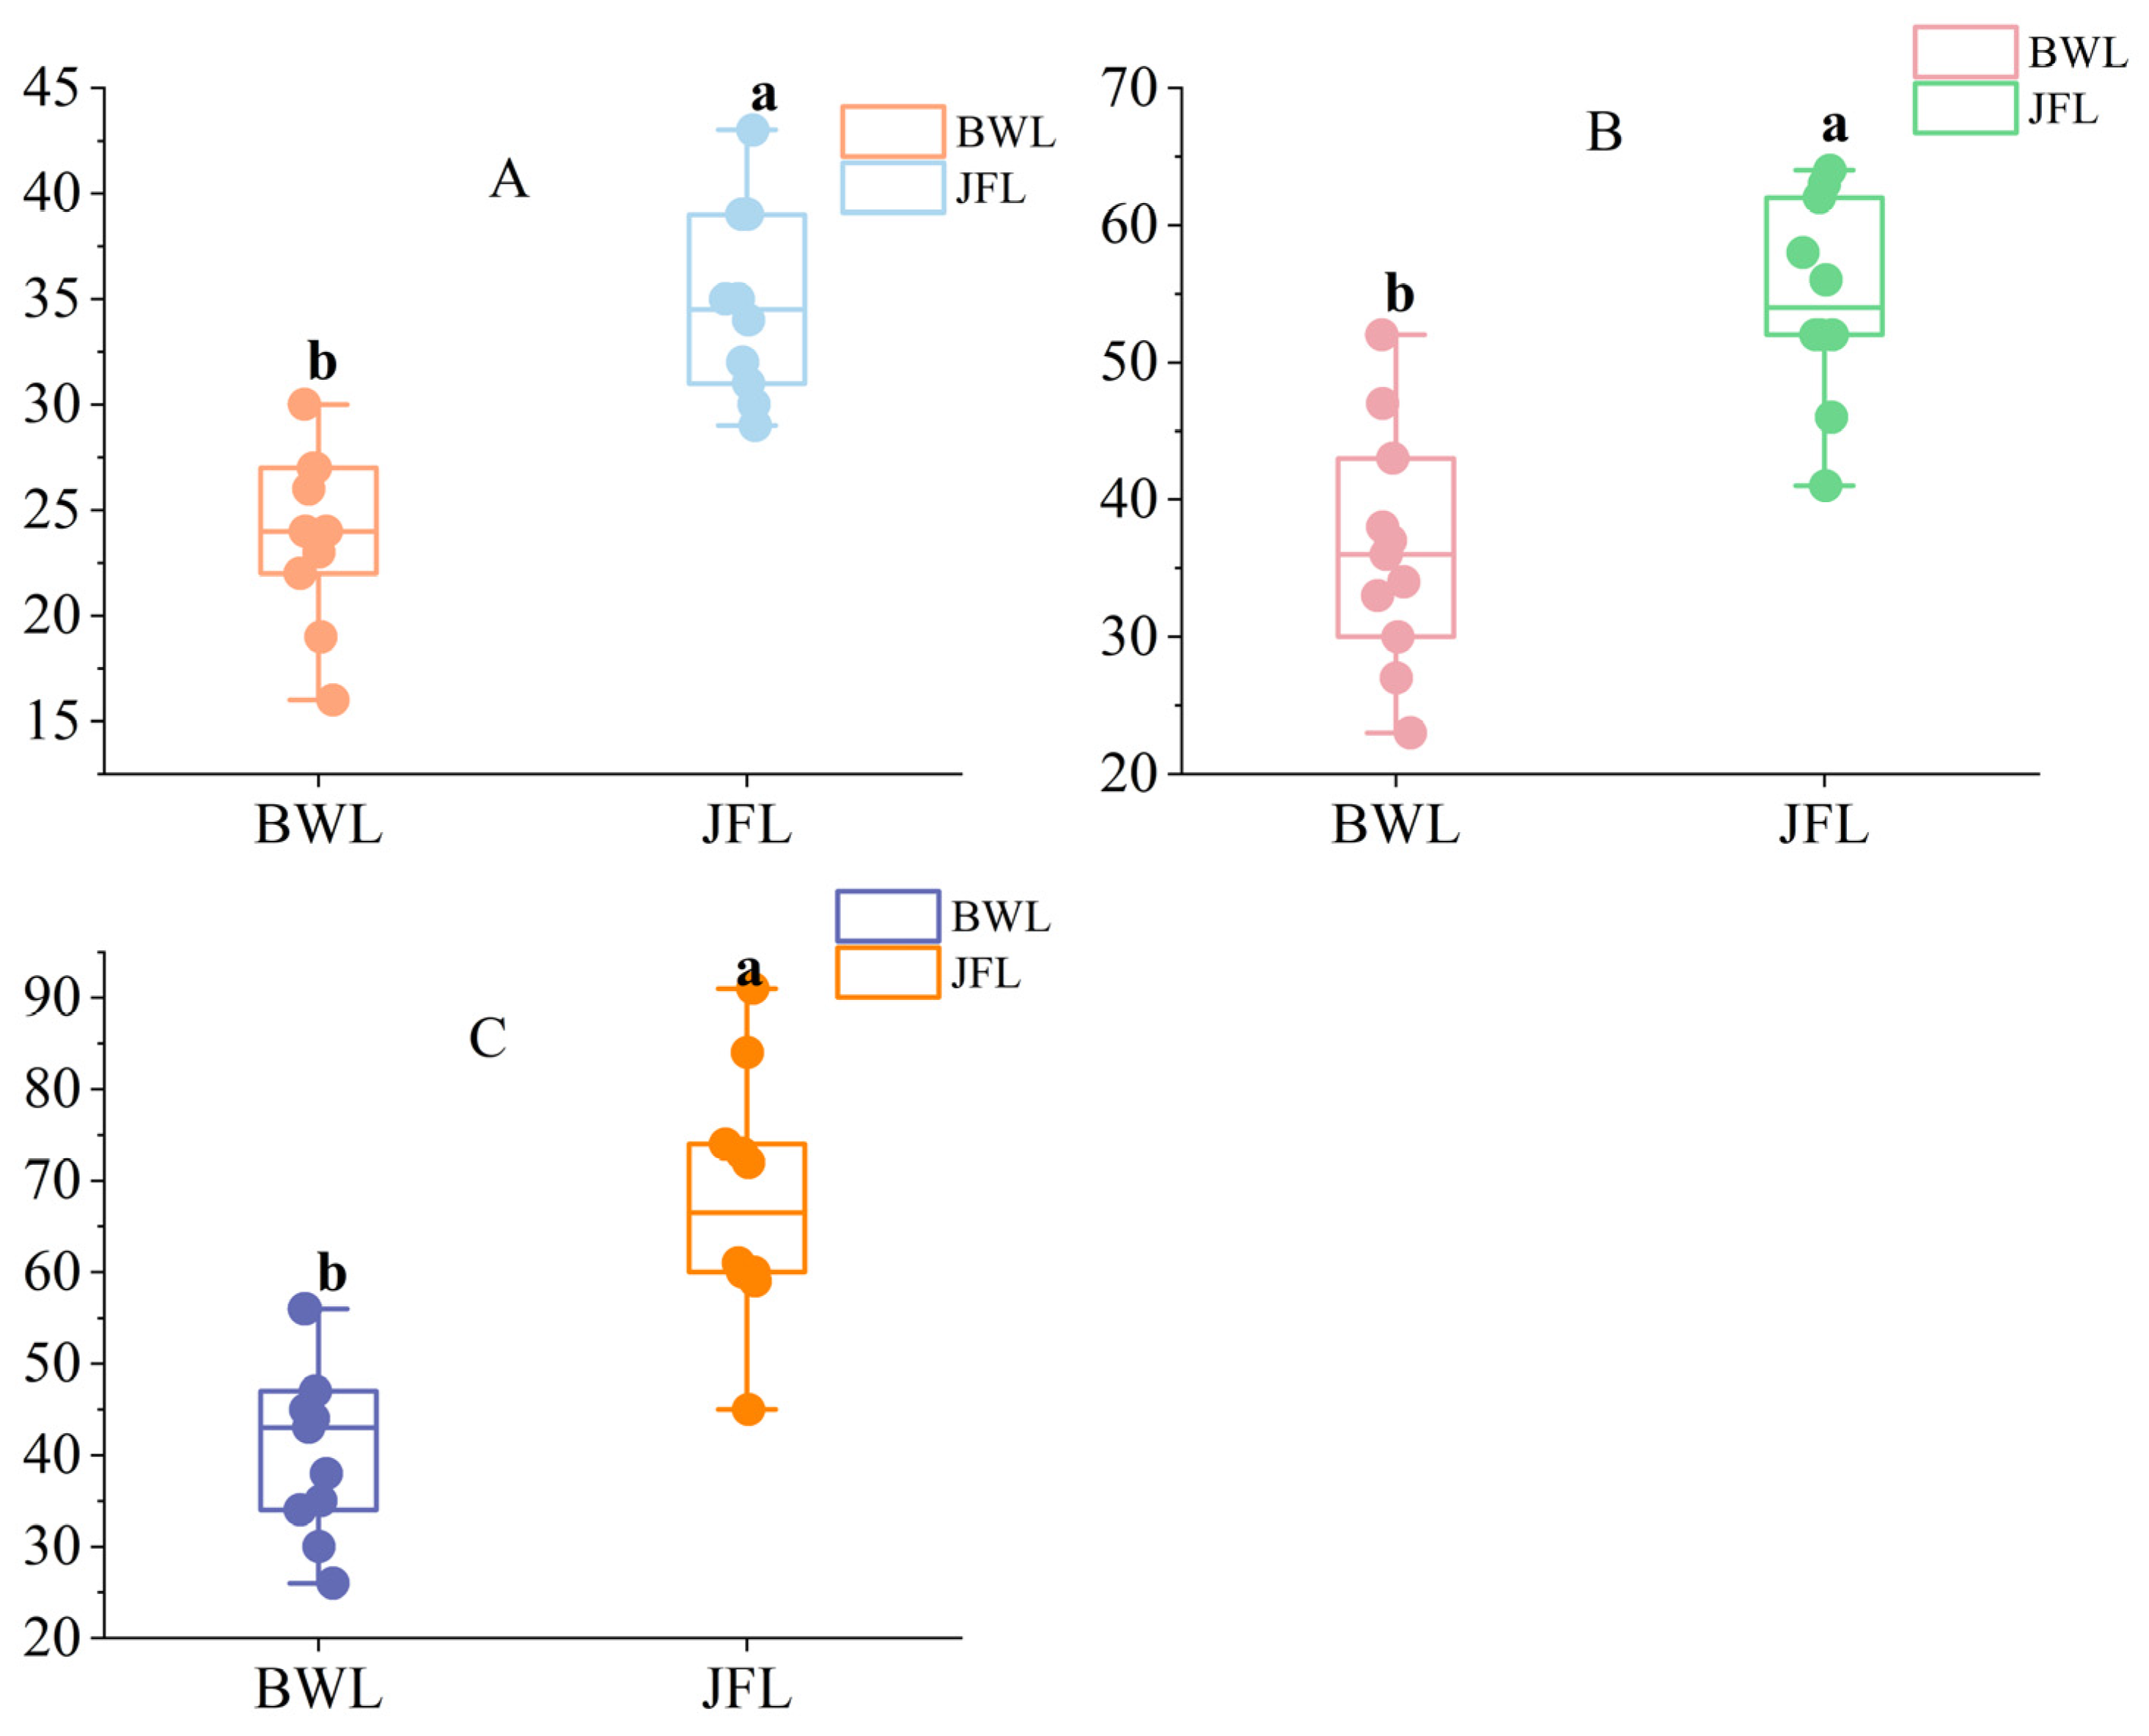
The community where H. hainanensis is found in Bawangling is home to a total of 212 plant species, belonging to 75 families and 162 genera. This includes 6 species of pteridophytes from 5 families and 5 genera; 2 species of gymnosperms from 2 families and 2 genera; and 204 species of angiosperms from 68 families and 155 genera (comprising 188 species of dicotyledons from 61 families and 141 genera and 16 species of monocotyledons from 7 families and 14 genera). In the community where H. hainanensis is located in Jianfengling, a total of 288 plant species have been recorded, belonging to 82 families and 183 genera. This includes 16 species of pteridophytes from 8 families and 12 genera; 1 species of gymnosperms from 1 family and 1 genus; and 271 species of angiosperms from 73 families and 183 genera (comprising 147 species of dicotyledons from 65 families and 155 genera and 24 species of monocotyledons from 8 families and 15 genera). As shown in Figure 2, there are significant differences in the species composition of the communities where Hopea hainanensis is located in Bawangling and Jianfengling at the family, genus, and species levels. The species composition in Jianfengling is significantly more diverse than that in Bawangling at the family, genus, and species levels.

3.1.2. The Importance Values of Species in Different Forest Layers of the Hopea hainanensis Community

As determined through the calculations (see Appendix A for results), the dominant species in the middle arbor layer of the community where H. hainanensis is found in Bawangling is H. hainanensis itself, with an importance value of 12.441. In the small arbor layer, Diospyros eriantha dominates (6.175), while Psychotria rubra is the dominant species in the large shrub layer (10.457), and Carpinus turczaninowii takes the lead in the middle shrub layer (12.43). Similarly, in the community where H. hainanensis is located in Jianfengling, H. hainanensis is the dominant species in the middle arbor layer, with importance values of 5.75 and 9.53, respectively. The dominant species in the other layers include Croton laevigatus in the small arbor layer (33.21), Lasianthus lancifolius in the large shrub layer (23.98), and Alsophila podophylla in the middle shrub layer (25.47). These results demonstrate that H. hainanensis holds a dominant position in the middle arbor layer in both locations, while it appears as an accompanying species in the other layers.

3.1.3. The Similarity of Different Forest Layers in the Community Where Hopea hainanensis Is Located

As shown in Table 1, the similarity between different forest layers in the communities where the Bawangling and Jianfengling slope fortresses are located is extremely low. Among them, the similarity index is highest in the large shrub layer and lowest in the middle shrub layer.

3.2. Diversity Indices of Communities Containing Hopea hainanensis in Different Regions

3.2.1. The Species Diversity Index

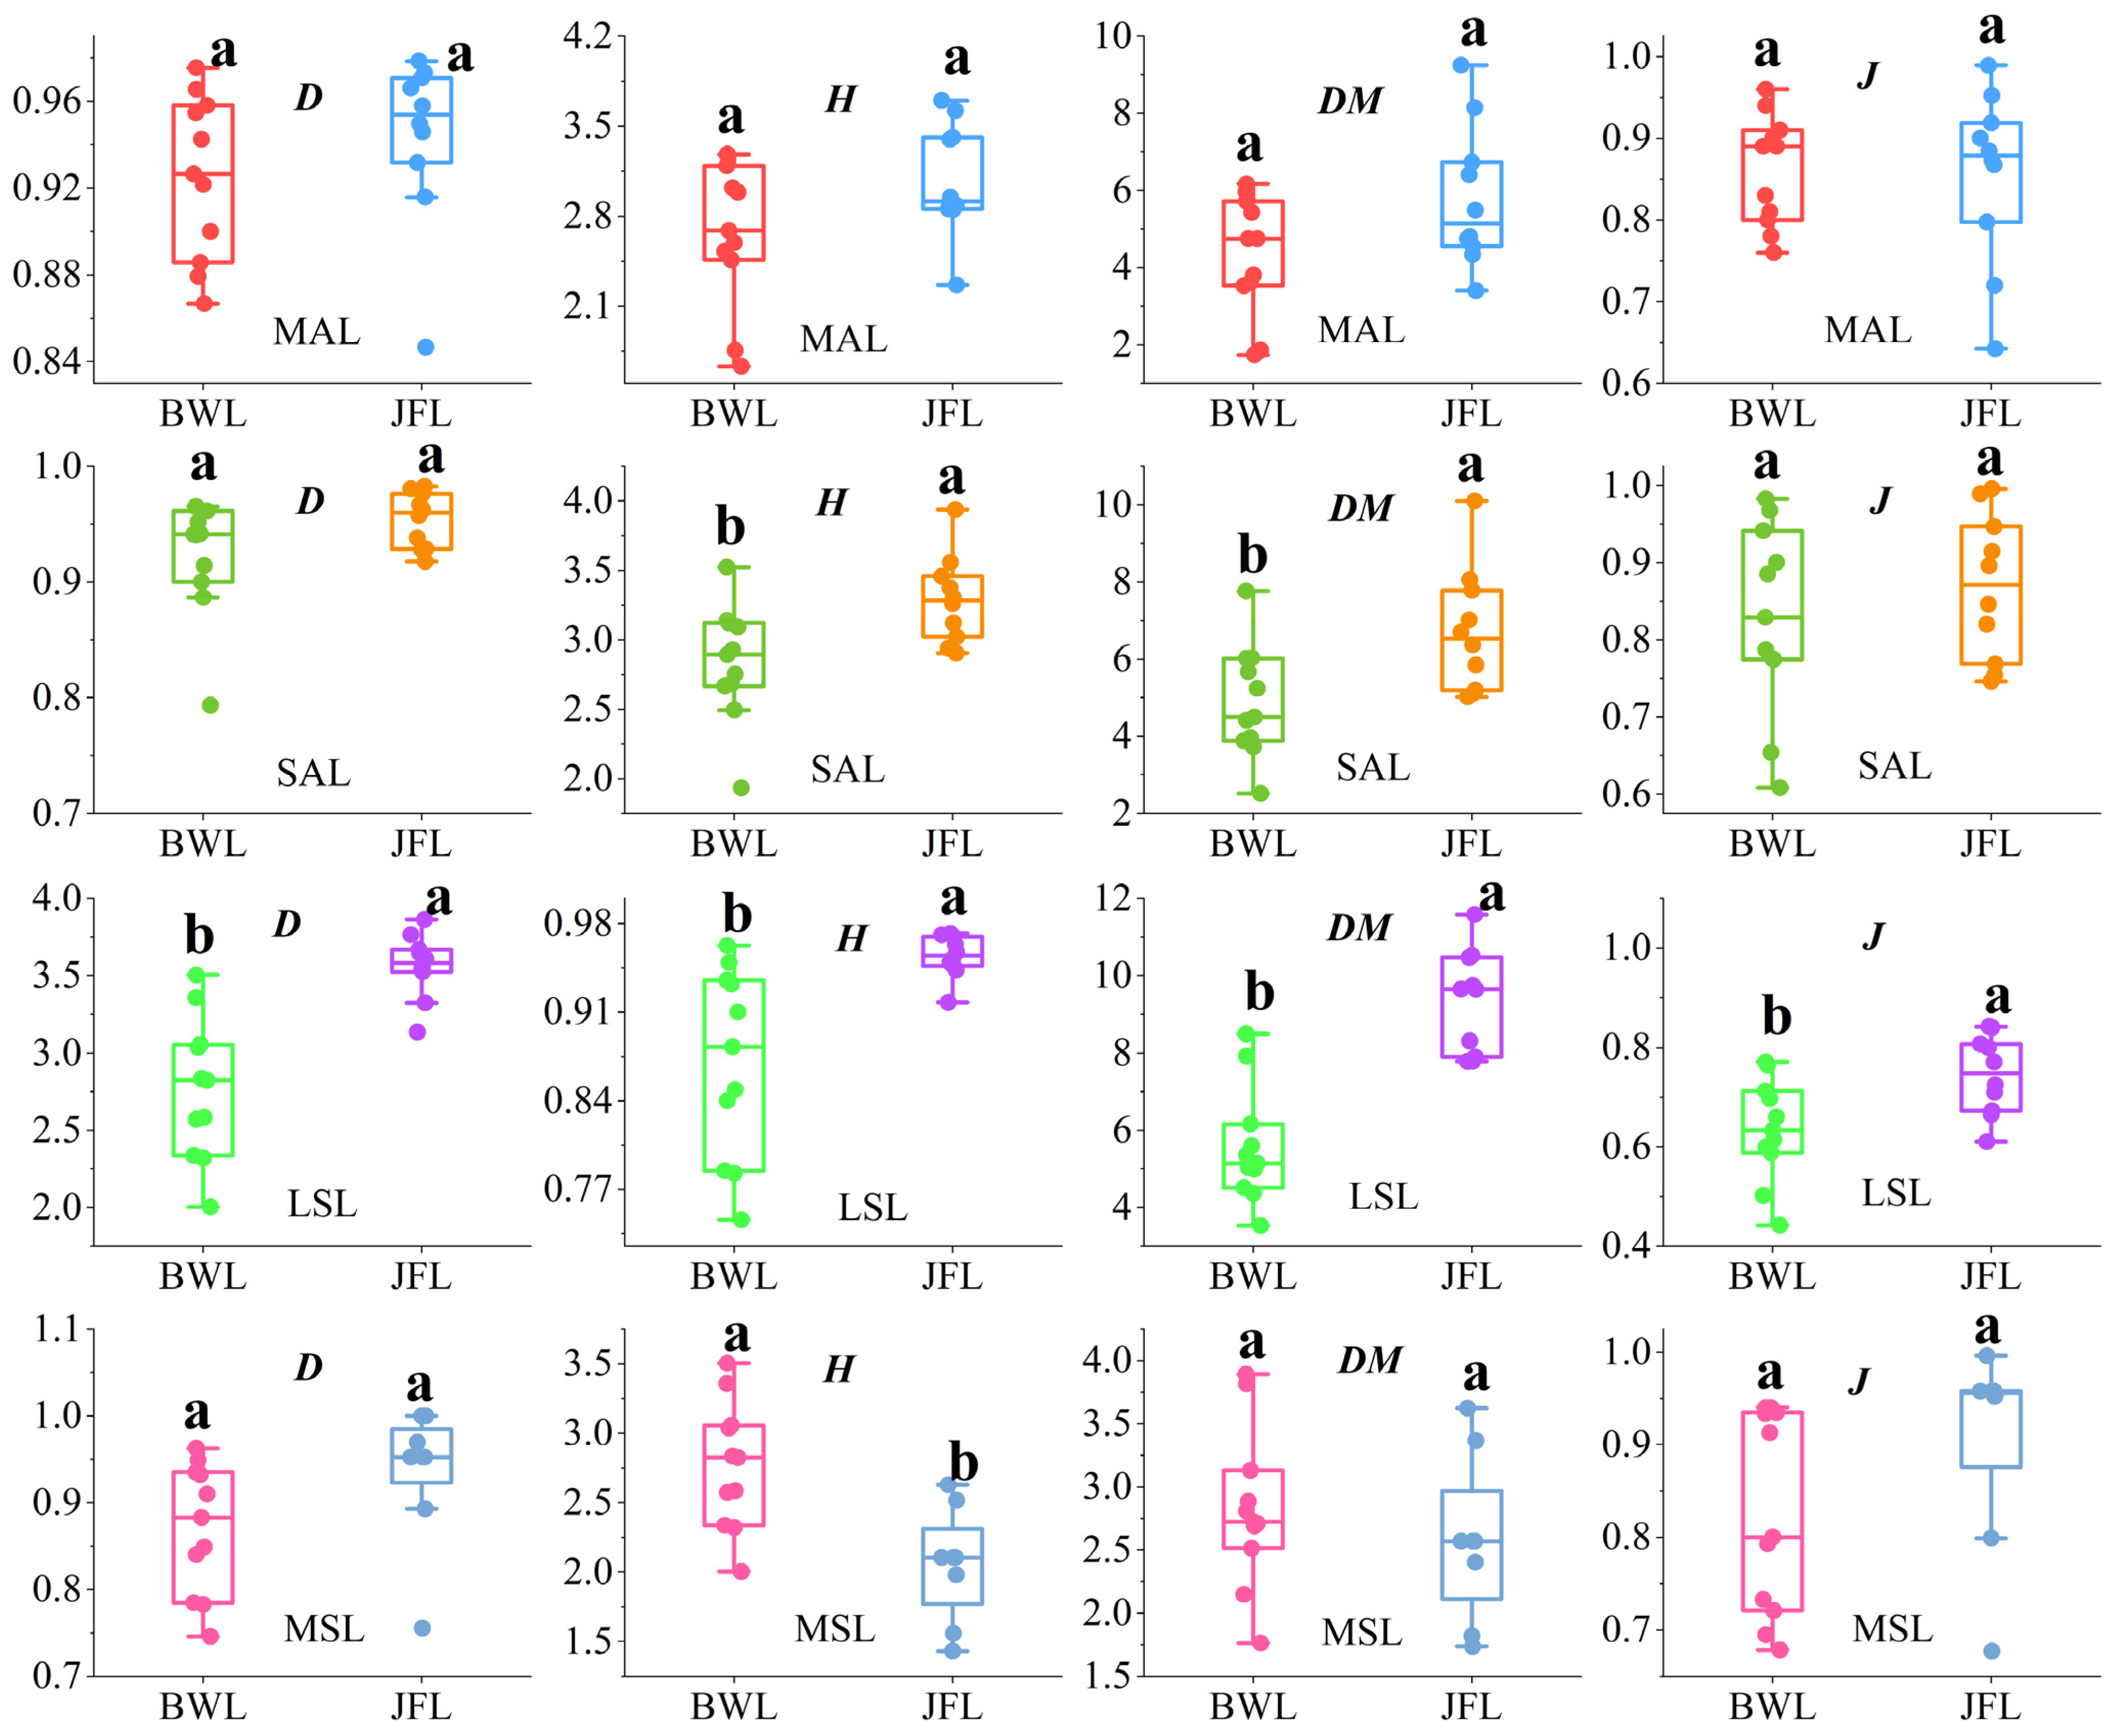
Figure 3 illustrates the differences in the species diversity indices across various regions within the same forest layers. The Simpson index revealed no significant differences in the middle arbor layer, the small arbor layer, or the middle shrub layer. However, in the large shrub layer, Bawangling had a significantly lower value compared to that in Jianfengling. For the Shannon–Wiener index, the small arbor and large shrub layers of Bawangling had significantly lower values than those for Jianfengling, while the middle shrub layer showed significantly higher values. No significant differences were observed in the middle arbor layer. The Margalef index indicated that the small arbor and large shrub layers of Bawangling had significantly lower values than those in Jianfengling, while no significant differences were found in the middle arbor and middle shrub layers. Lastly, no significant differences in the Pielou index were demonstrated in the middle arbor, small arbor, or middle shrub layers, but the large shrub layer showed a significantly lower value in Bawangling compared to that in Jianfengling.

3.2.2. The Phylogenetic Diversity Index of Dominant Tree Species

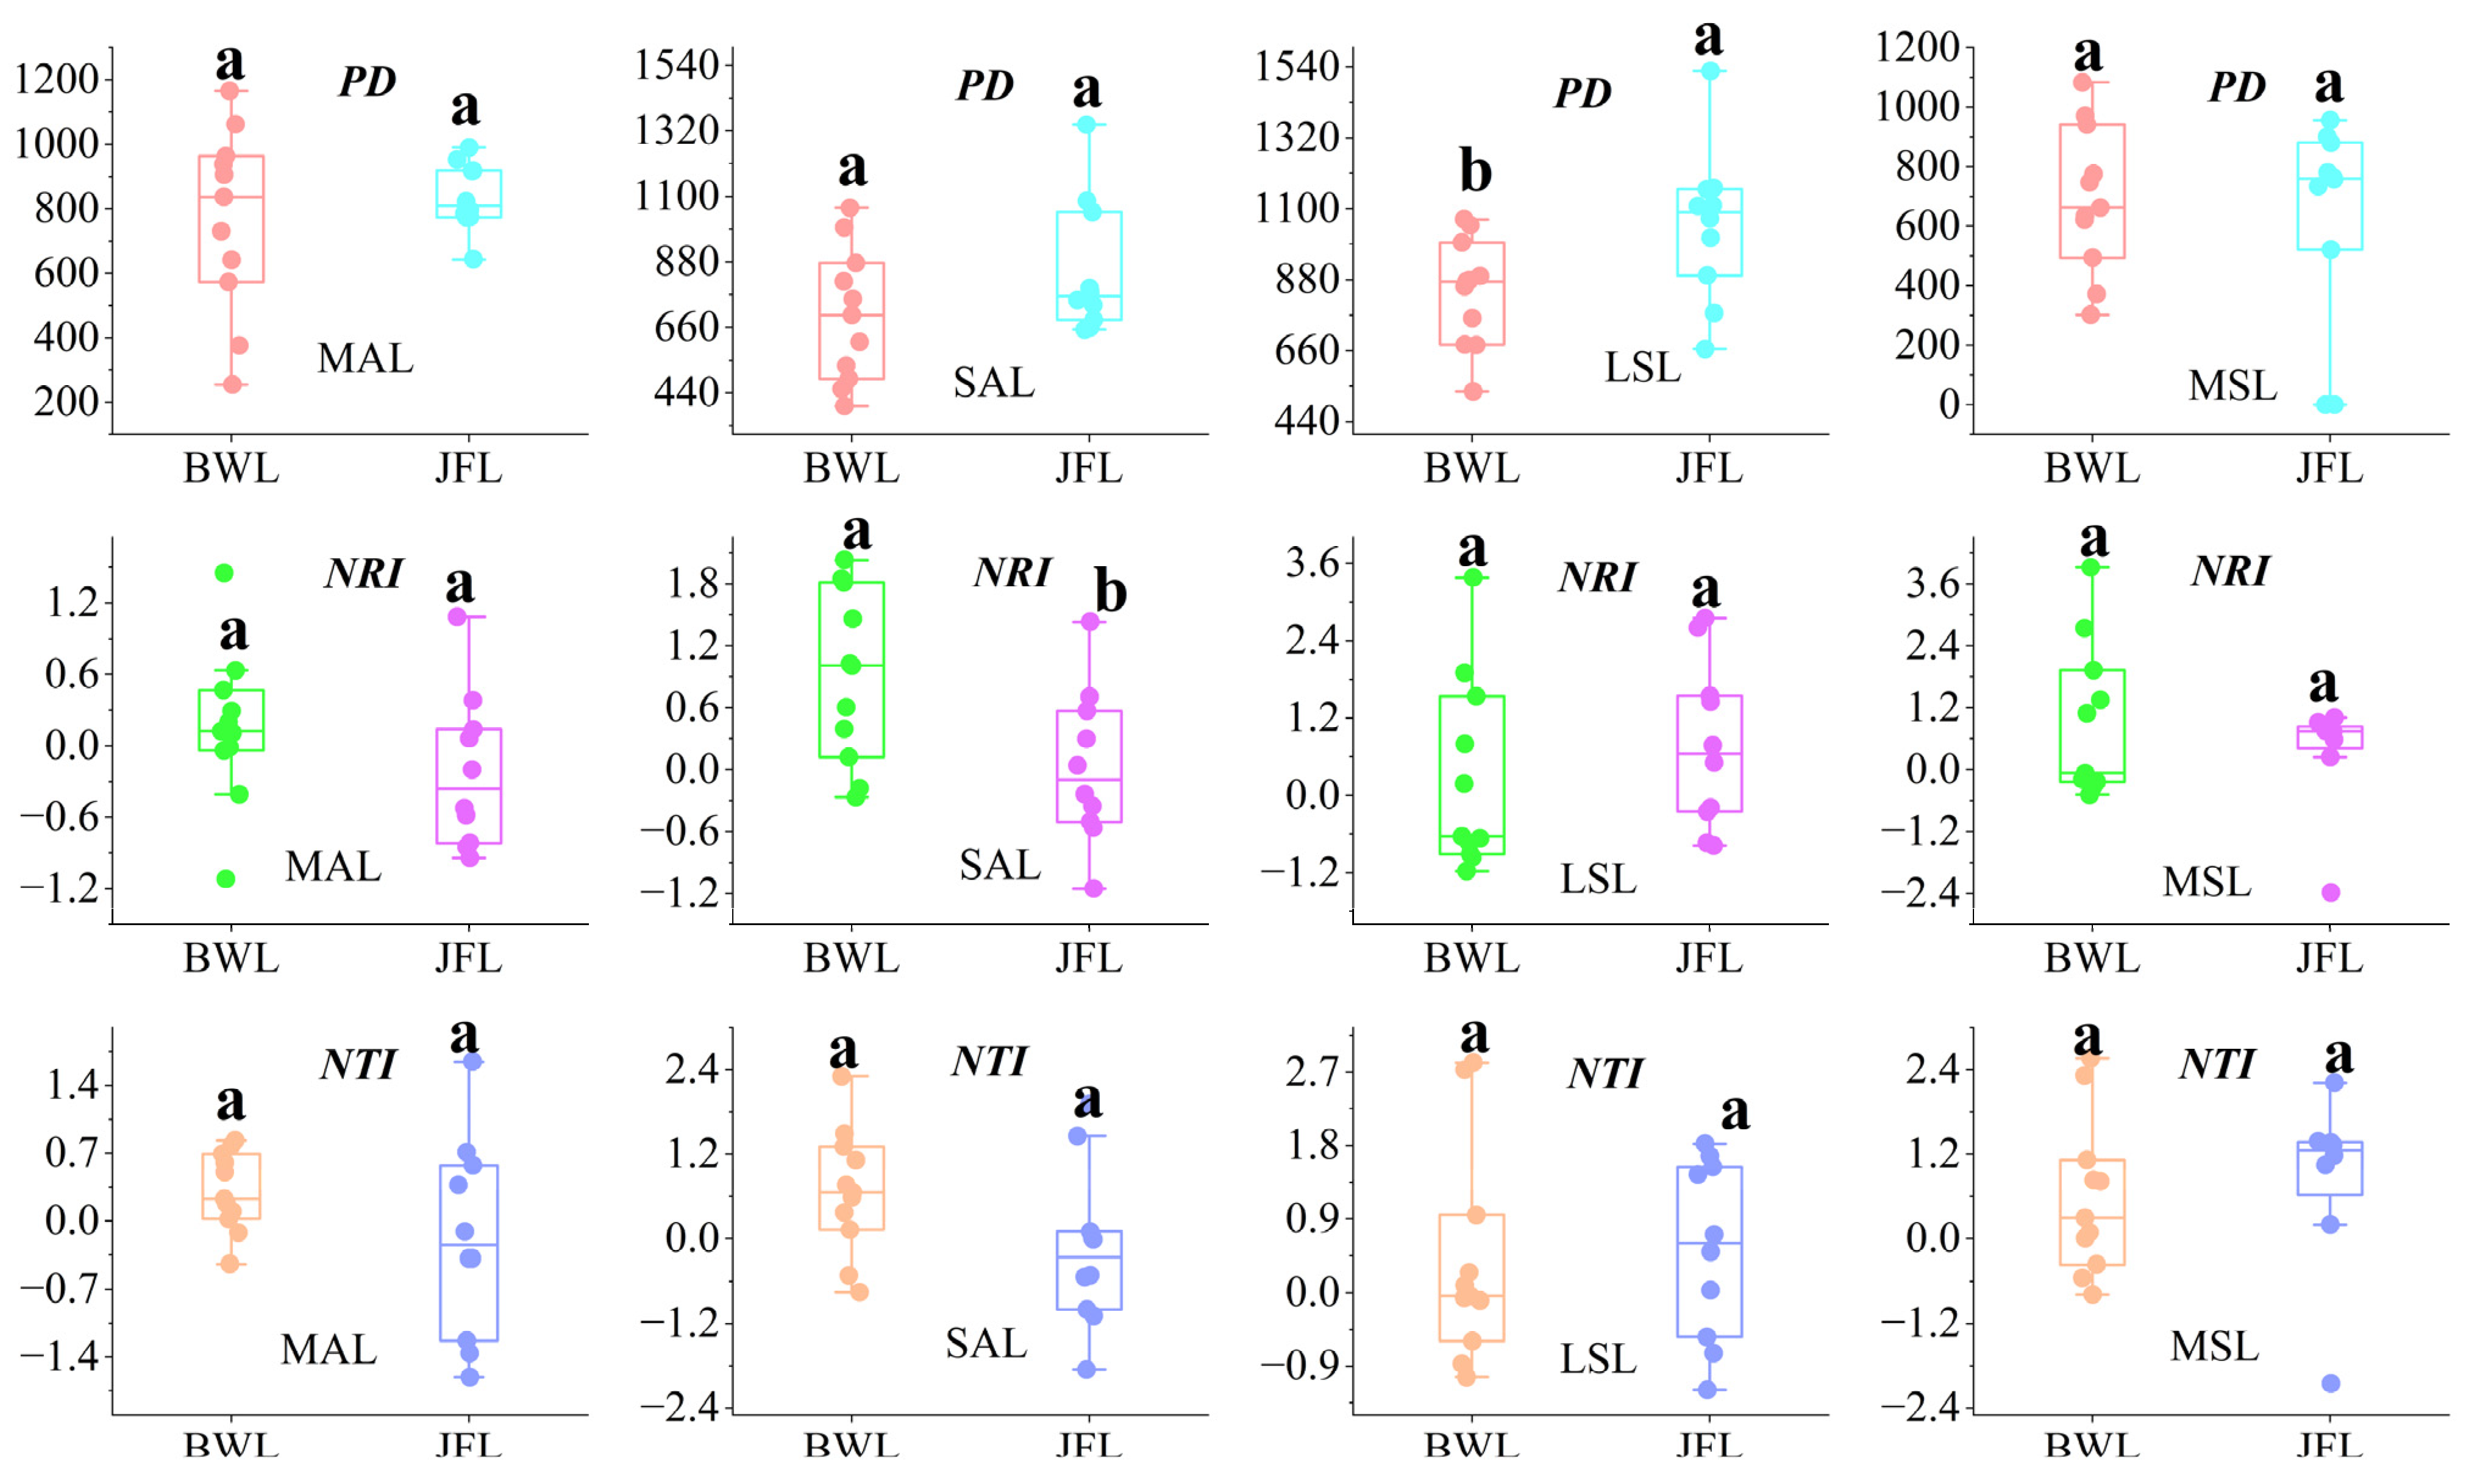
As shown in Figure 4, the phylogenetic diversity (PD) index of the dominant tree species did not exhibit significant differences across the middle arbor layer, small arbor layer, and middle shrub layer. However, in the large shrub layer, the PD of Bawangling was significantly lower than that of Jianfengling. The net relatedness index (NRI) of the dominant tree species did not show significant differences in the middle arbor layer, large shrub layer, or middle shrub layer. However, in the small arbor layer, the NRI of Bawangling was significantly higher than that of Jianfengling. The nearest taxon index (NTI) of the dominant tree species showed no significant differences across all forest layers.

3.3. Correlations Among Diversity Indices in the Hopea hainanensis Community

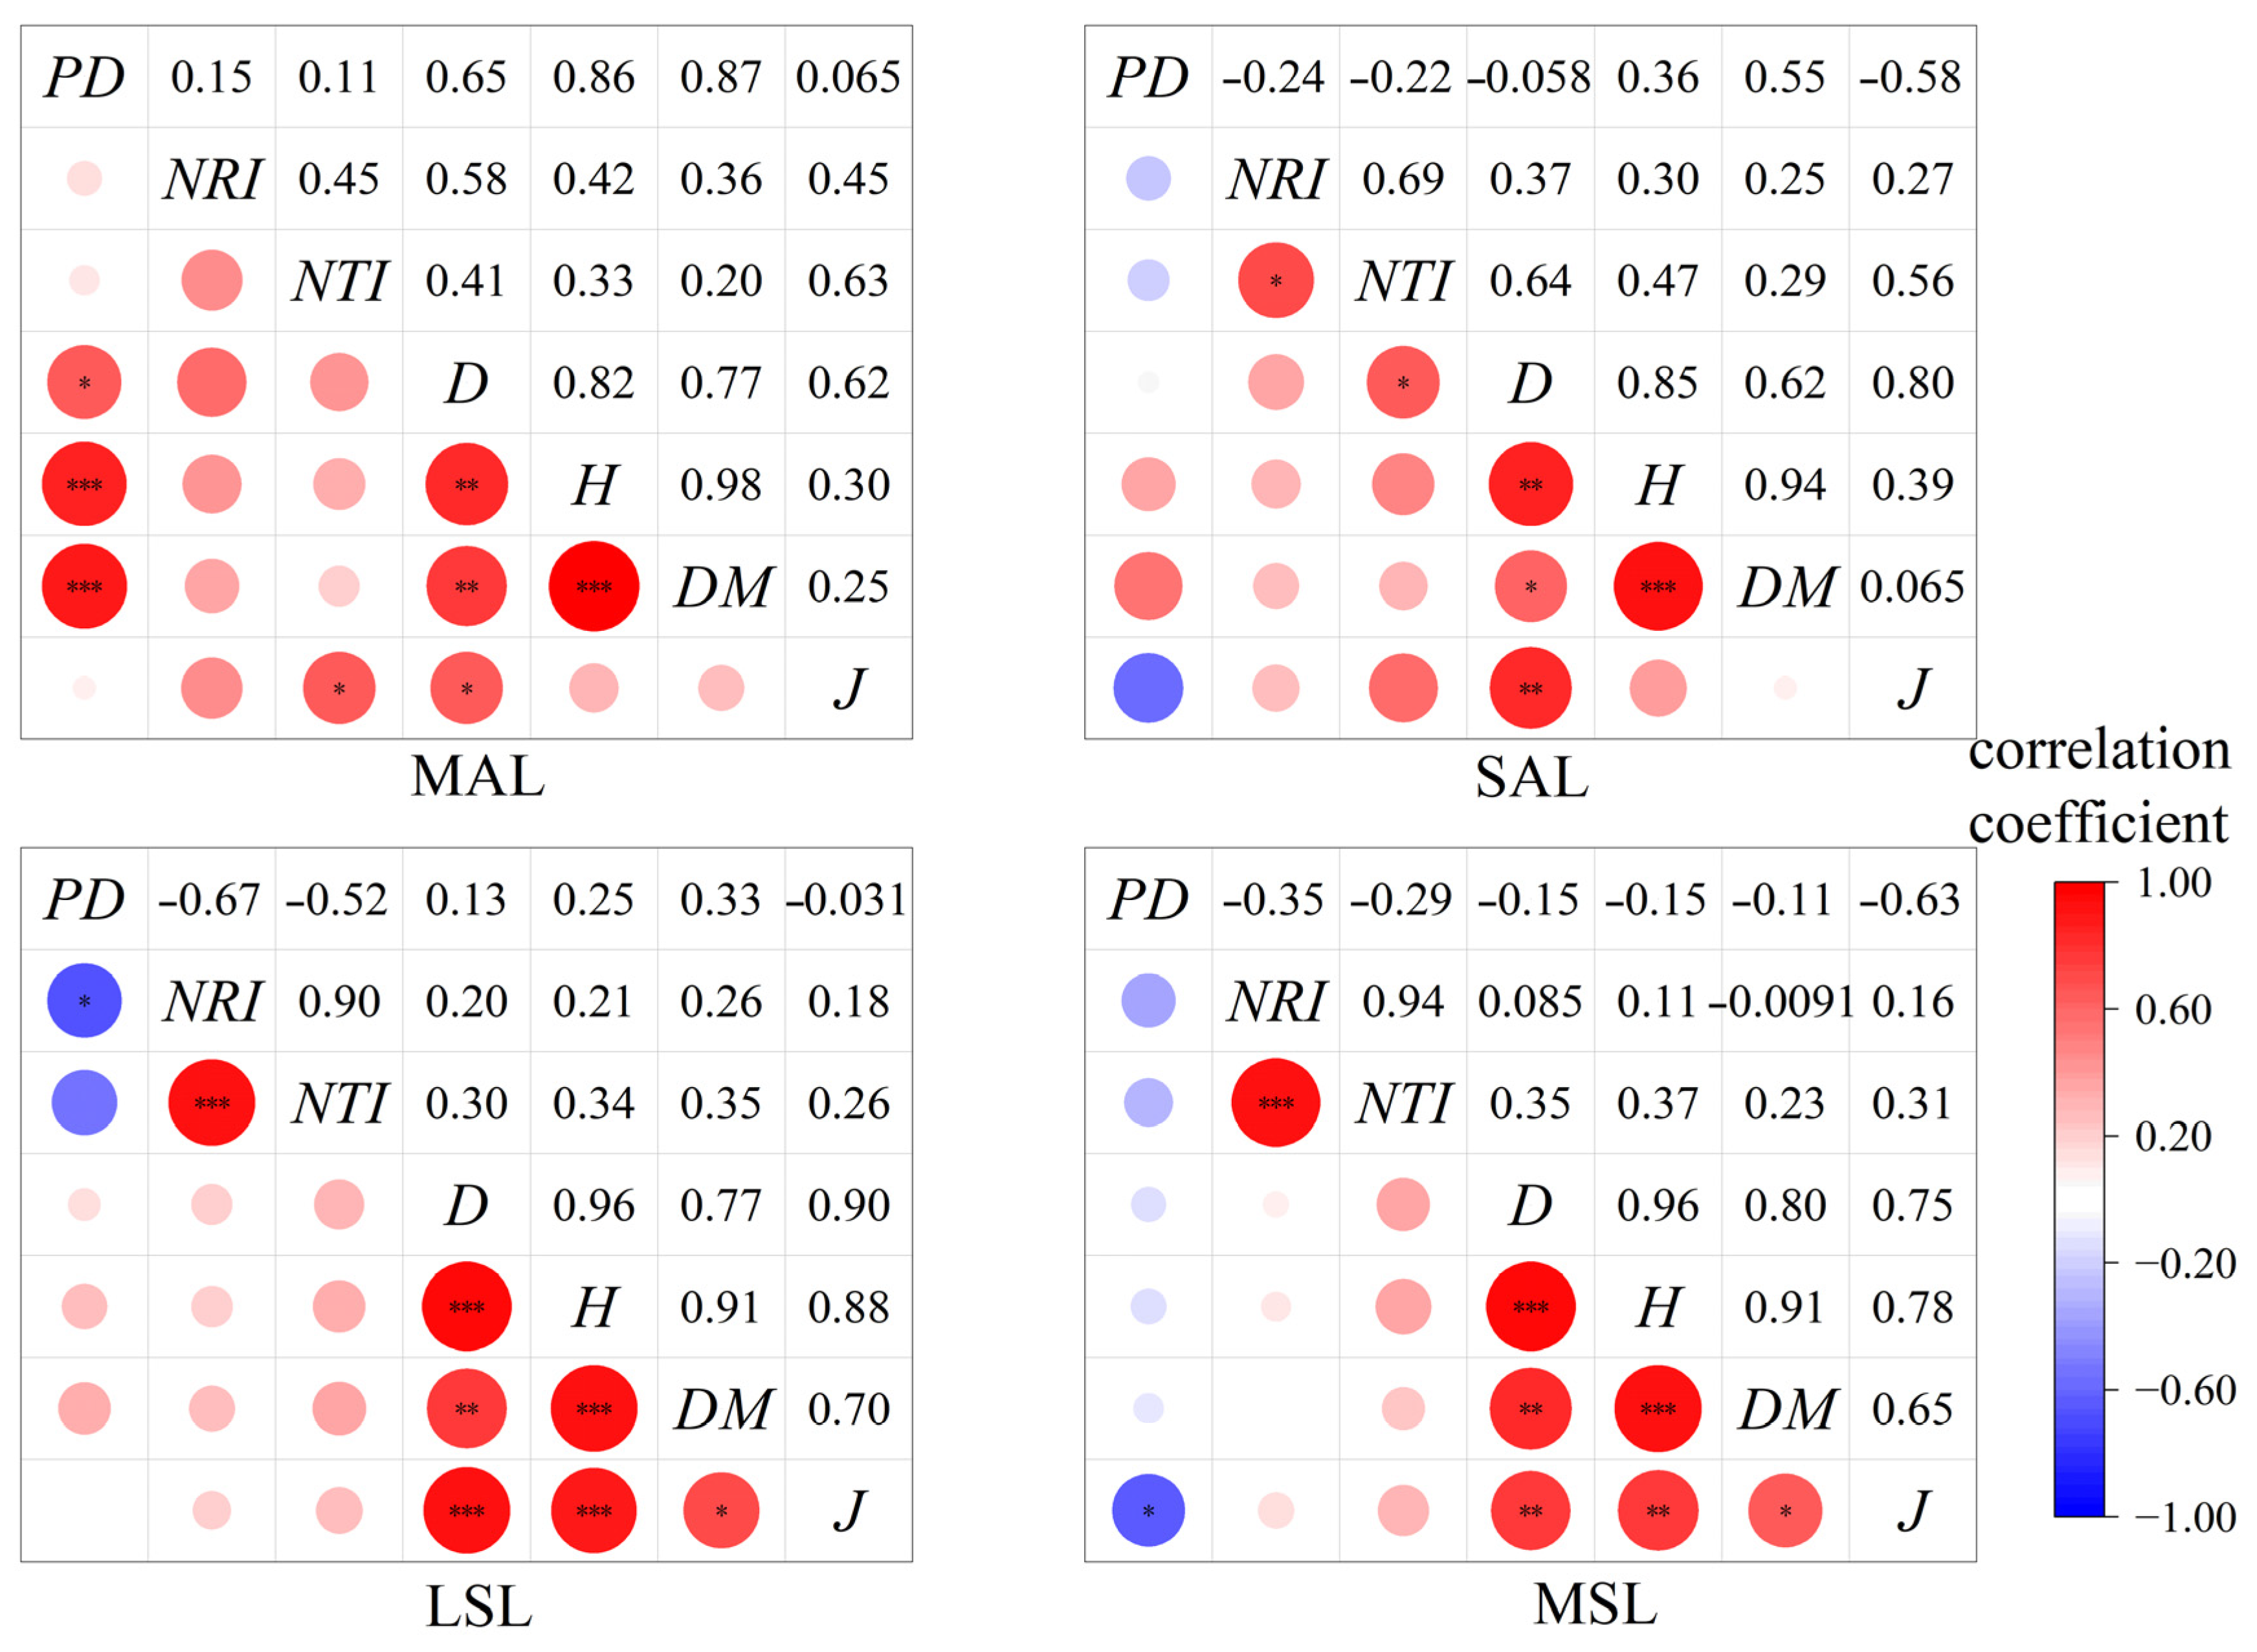
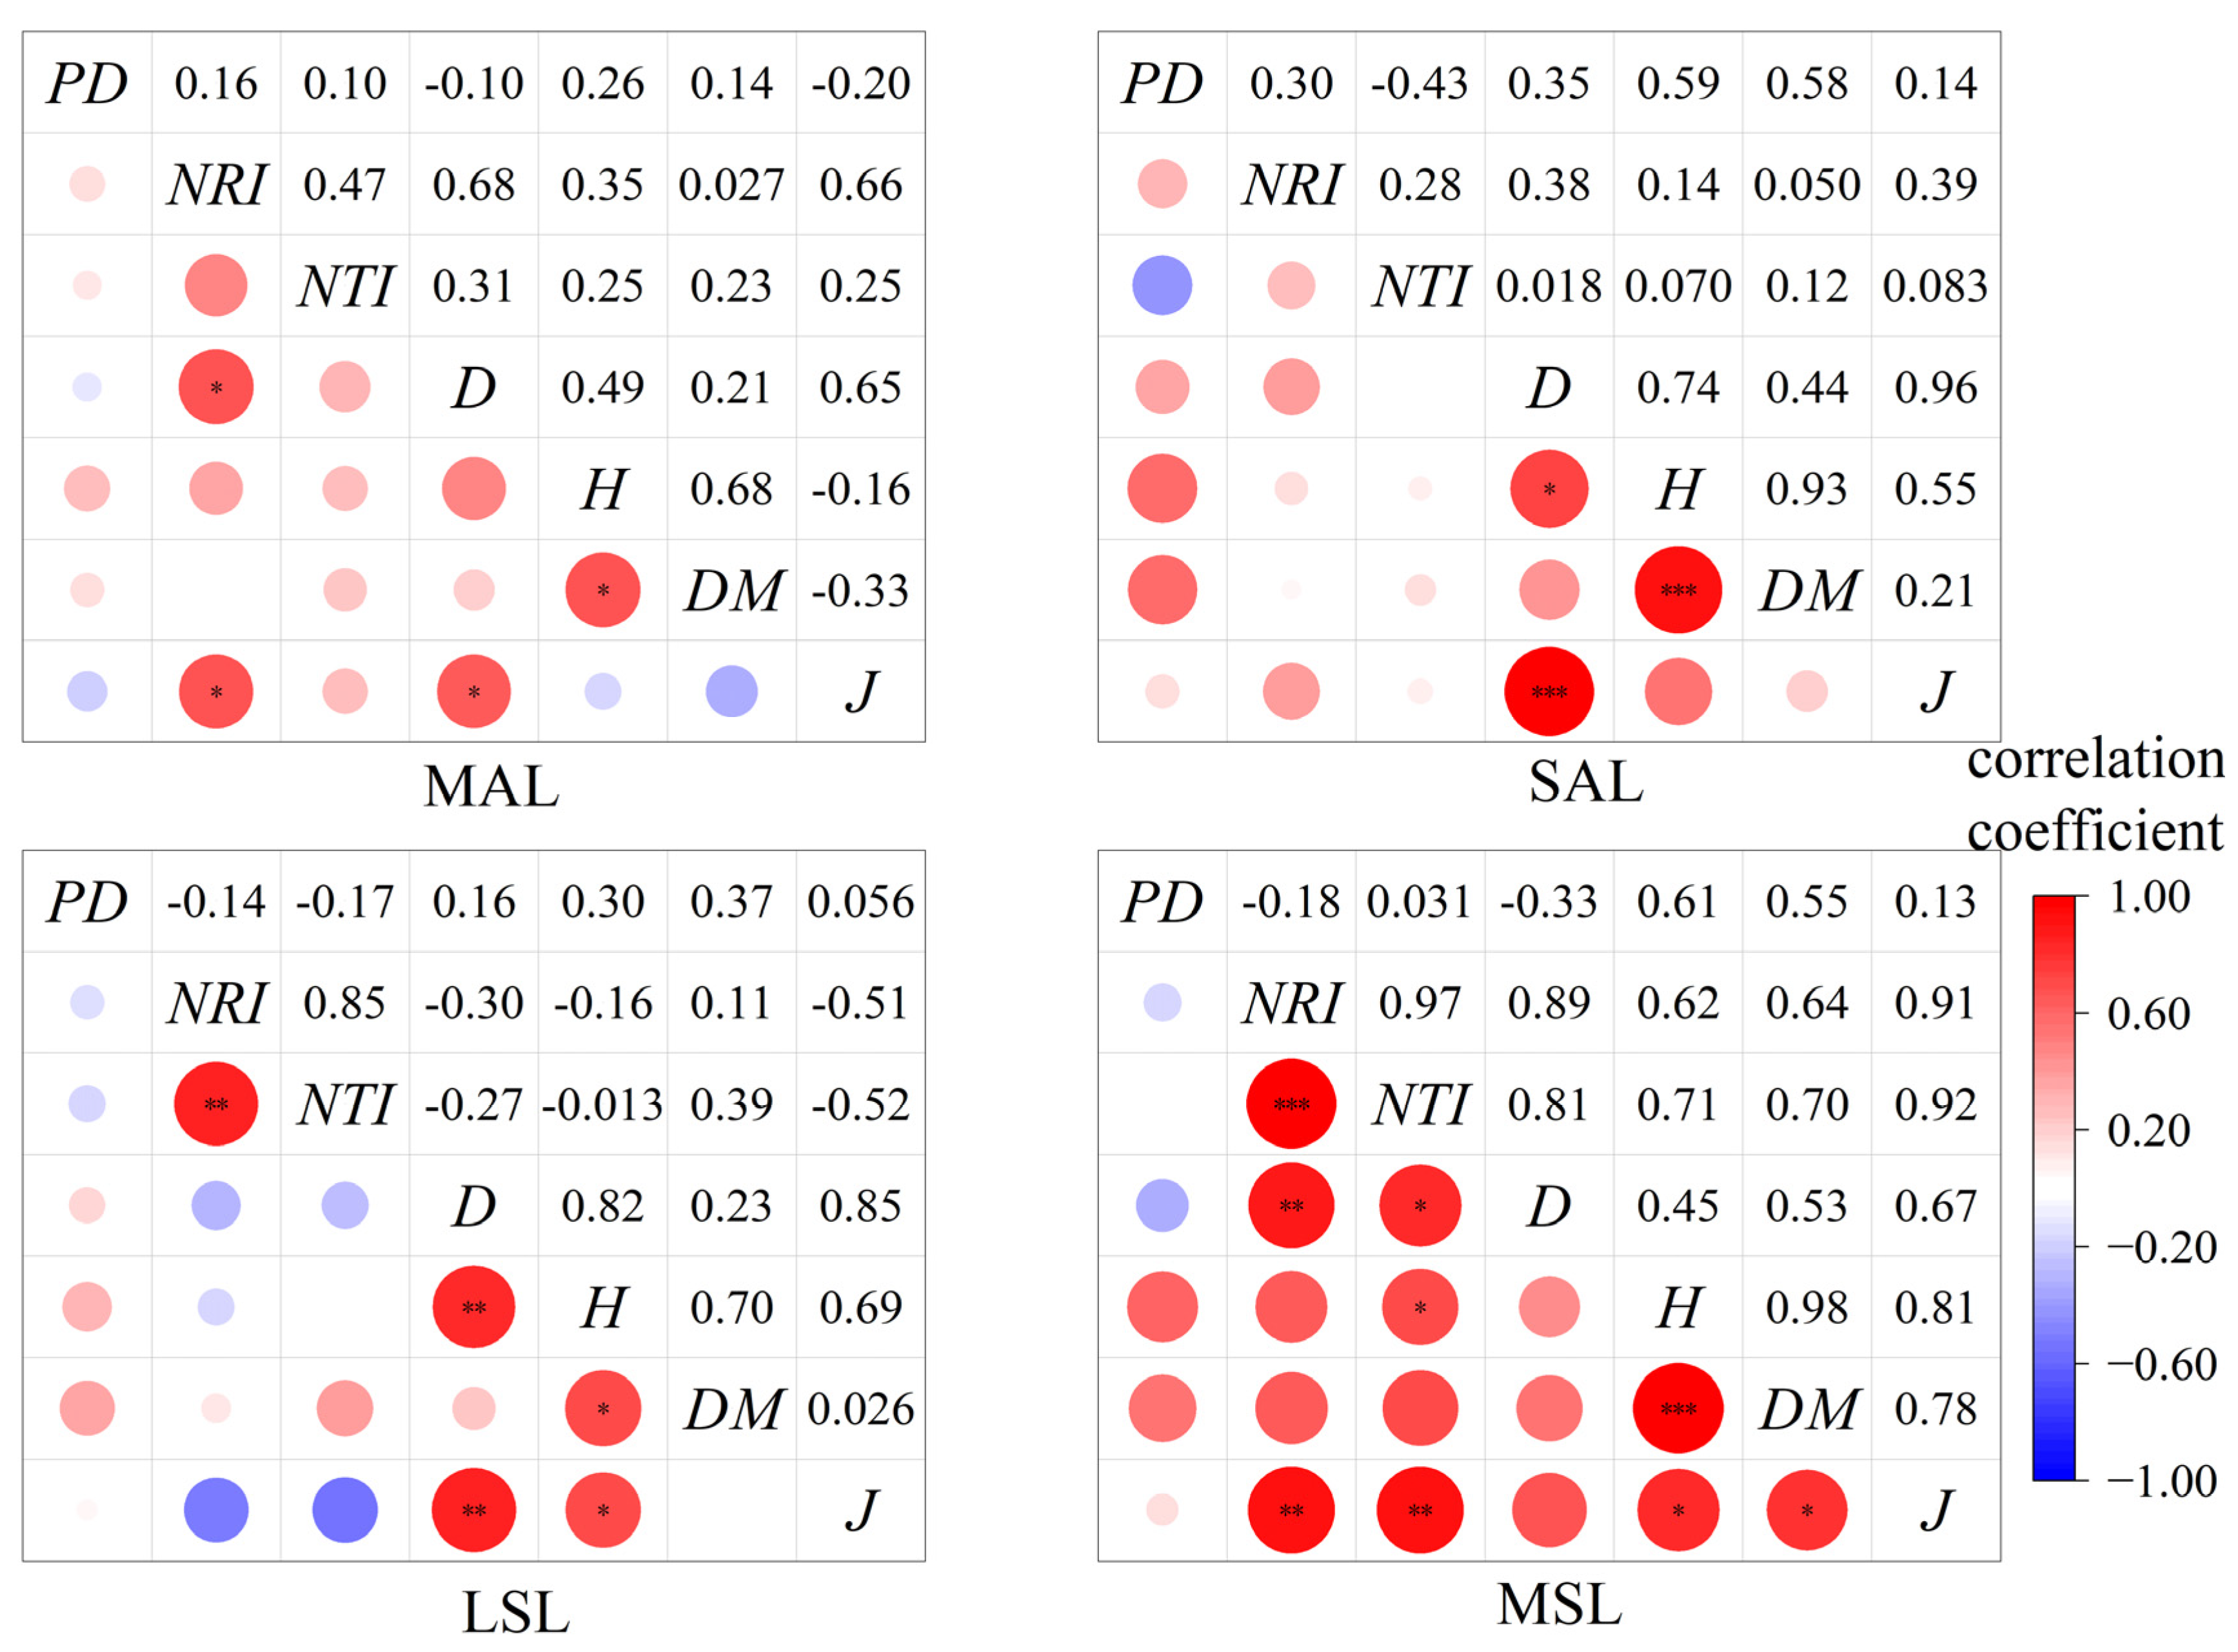
The correlation analysis between the species diversity and phylogenetic diversity of dominant tree species across various forest layers in the Bawangling H. hainanensis community is shown in Figure 5. The phylogenetic diversity (PD) of dominant trees in the middle arbor layer exhibited a significant positive correlation with the Simpson index (p < 0.05) and strong positive correlations with both the Shannon–Wiener index and the Margalef index (p < 0.05). The net relatedness index (NTI) of dominant trees in the middle arbor layer also showed a significant positive correlation with the Pielou index. In the small arbor layer, the NTI of dominant species displayed a significant positive correlation with the Simpson index. In the middle shrub layer, the PD of dominant tree species demonstrated a significant negative correlation with the Pielou index. The correlation analysis between the species diversity and phylogenetic diversity of dominant tree species across different forest layers in the H. hainanensis community at Jianfengling is presented in Figure 6. In the middle arbor layer, the standardized relatedness index (NRI) of dominant species showed significant positive correlations with both the Simpson index and the Pielou index (p < 0.05). In the middle shrub layer, the NRI of dominant species exhibited highly significant positive correlations with both the Simpson index and the Pielou index (p < 0.05). Additionally, the NTI in the middle shrub layer showed significant positive correlations with the Simpson index and the Shannon–Wiener index, along with a highly significant positive correlation with the Pielou index (p < 0.05).

3.4. Factors Influencing the Diversity Index of Hopea chinensis Communities

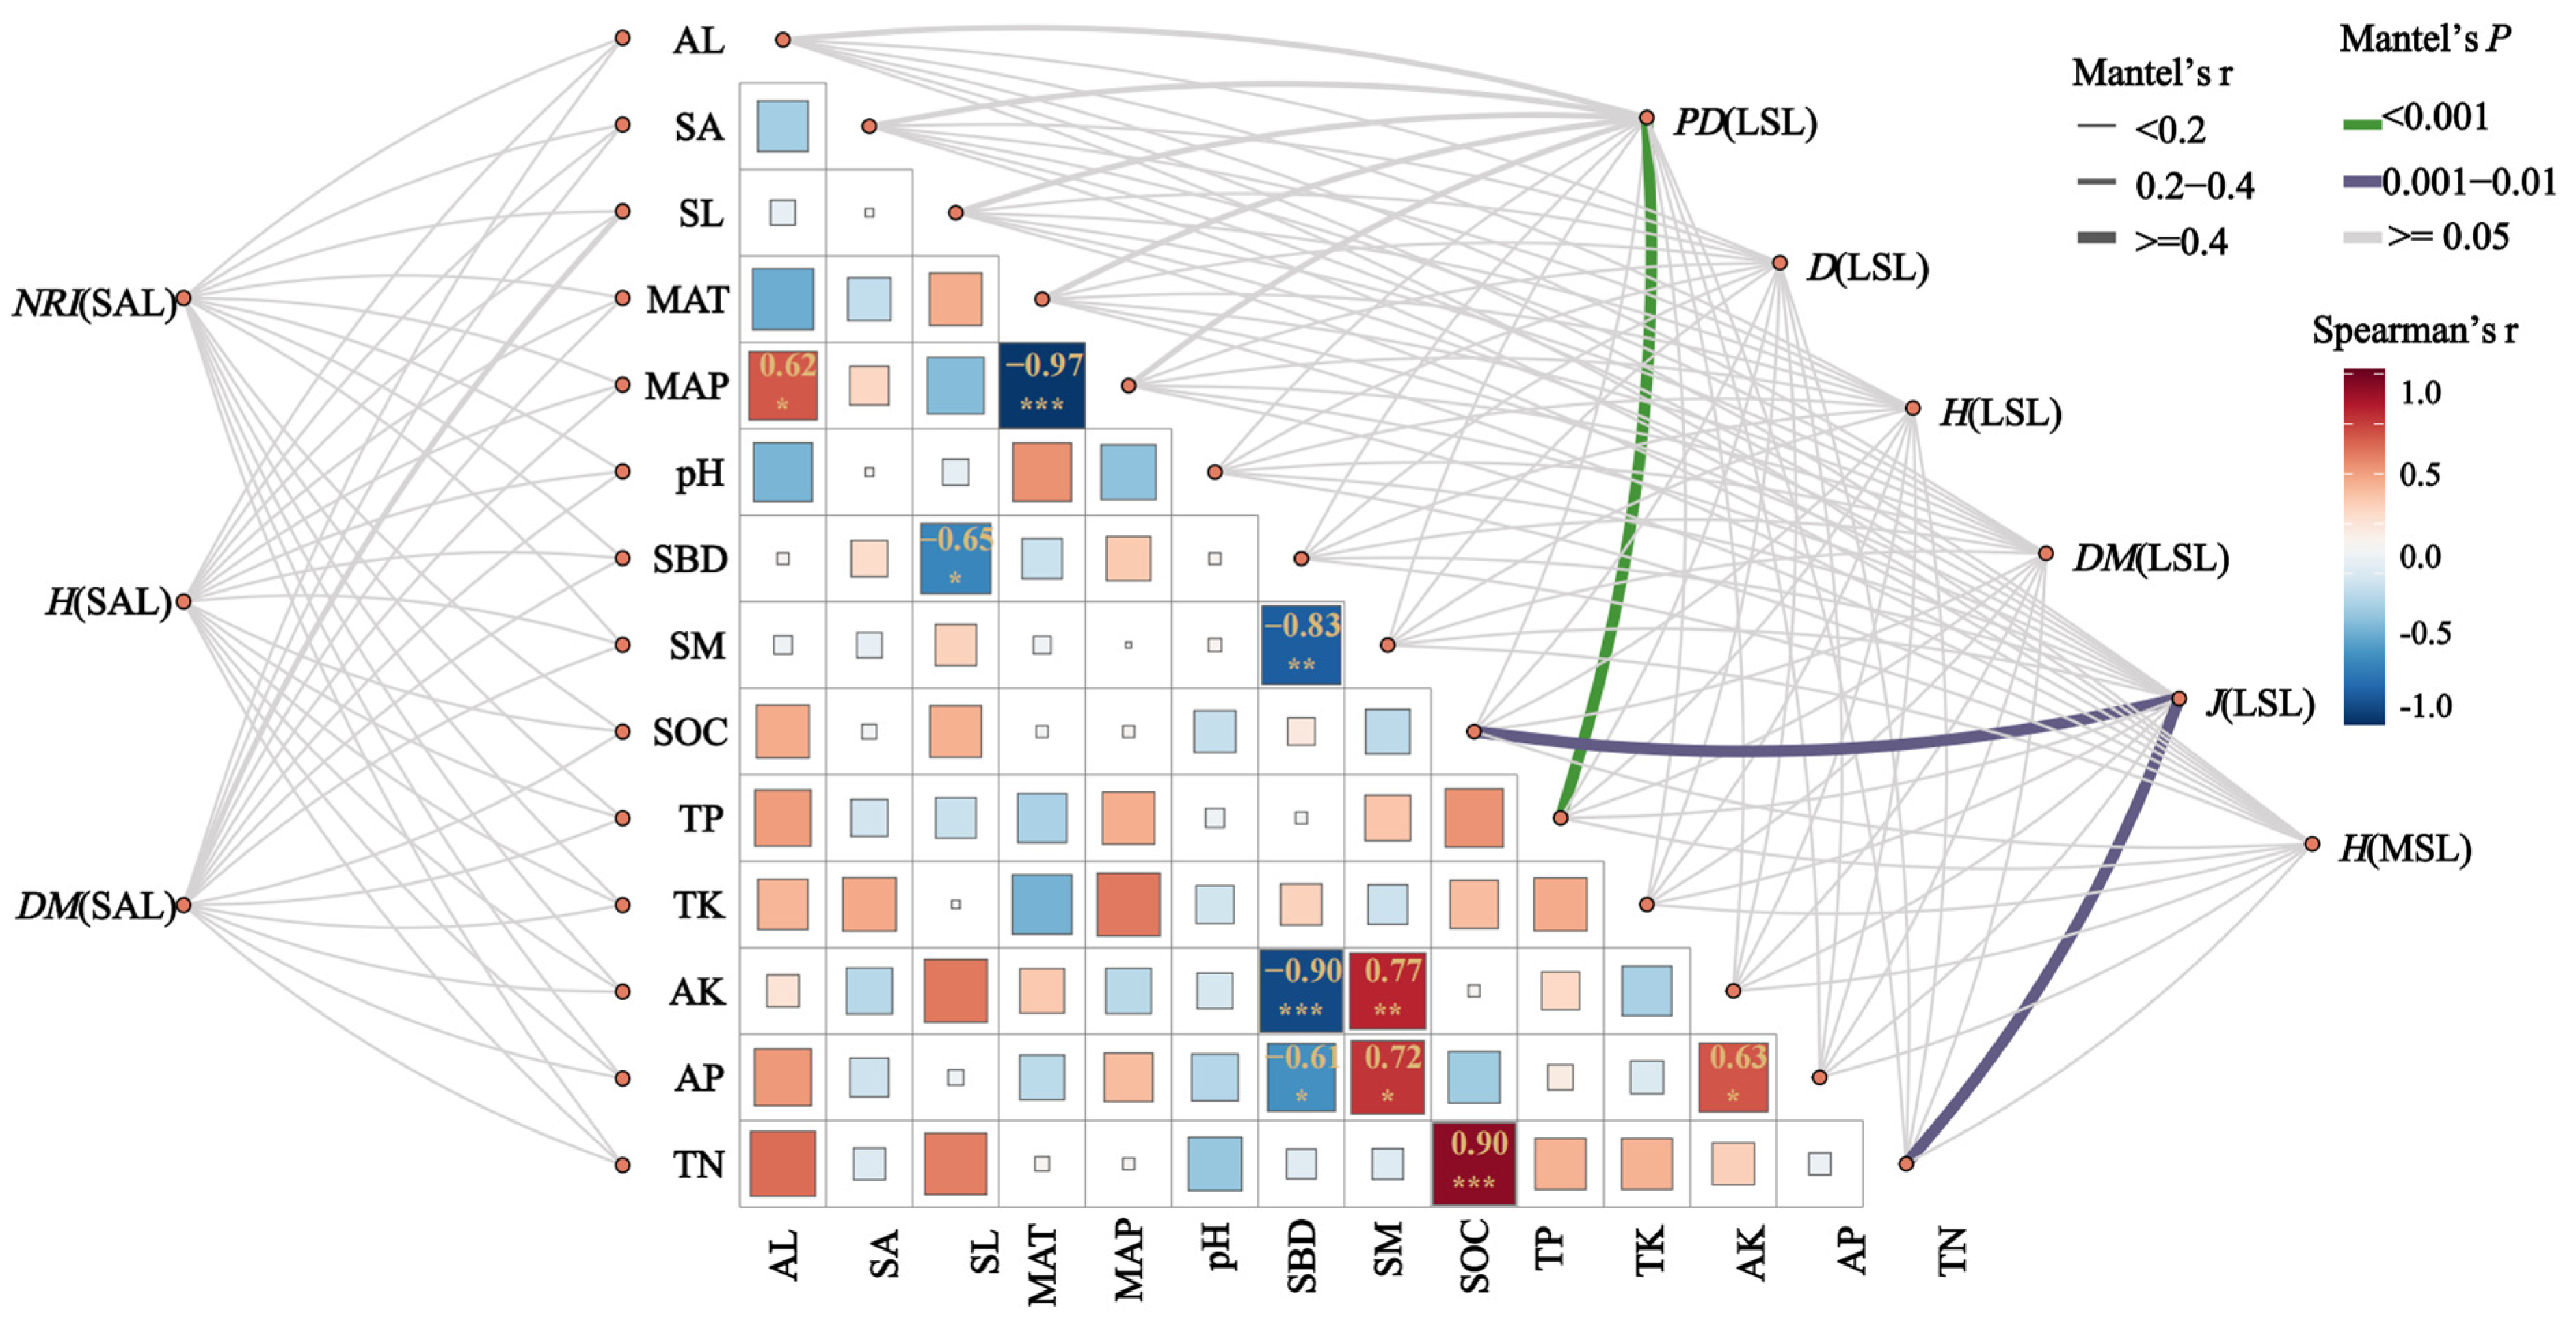
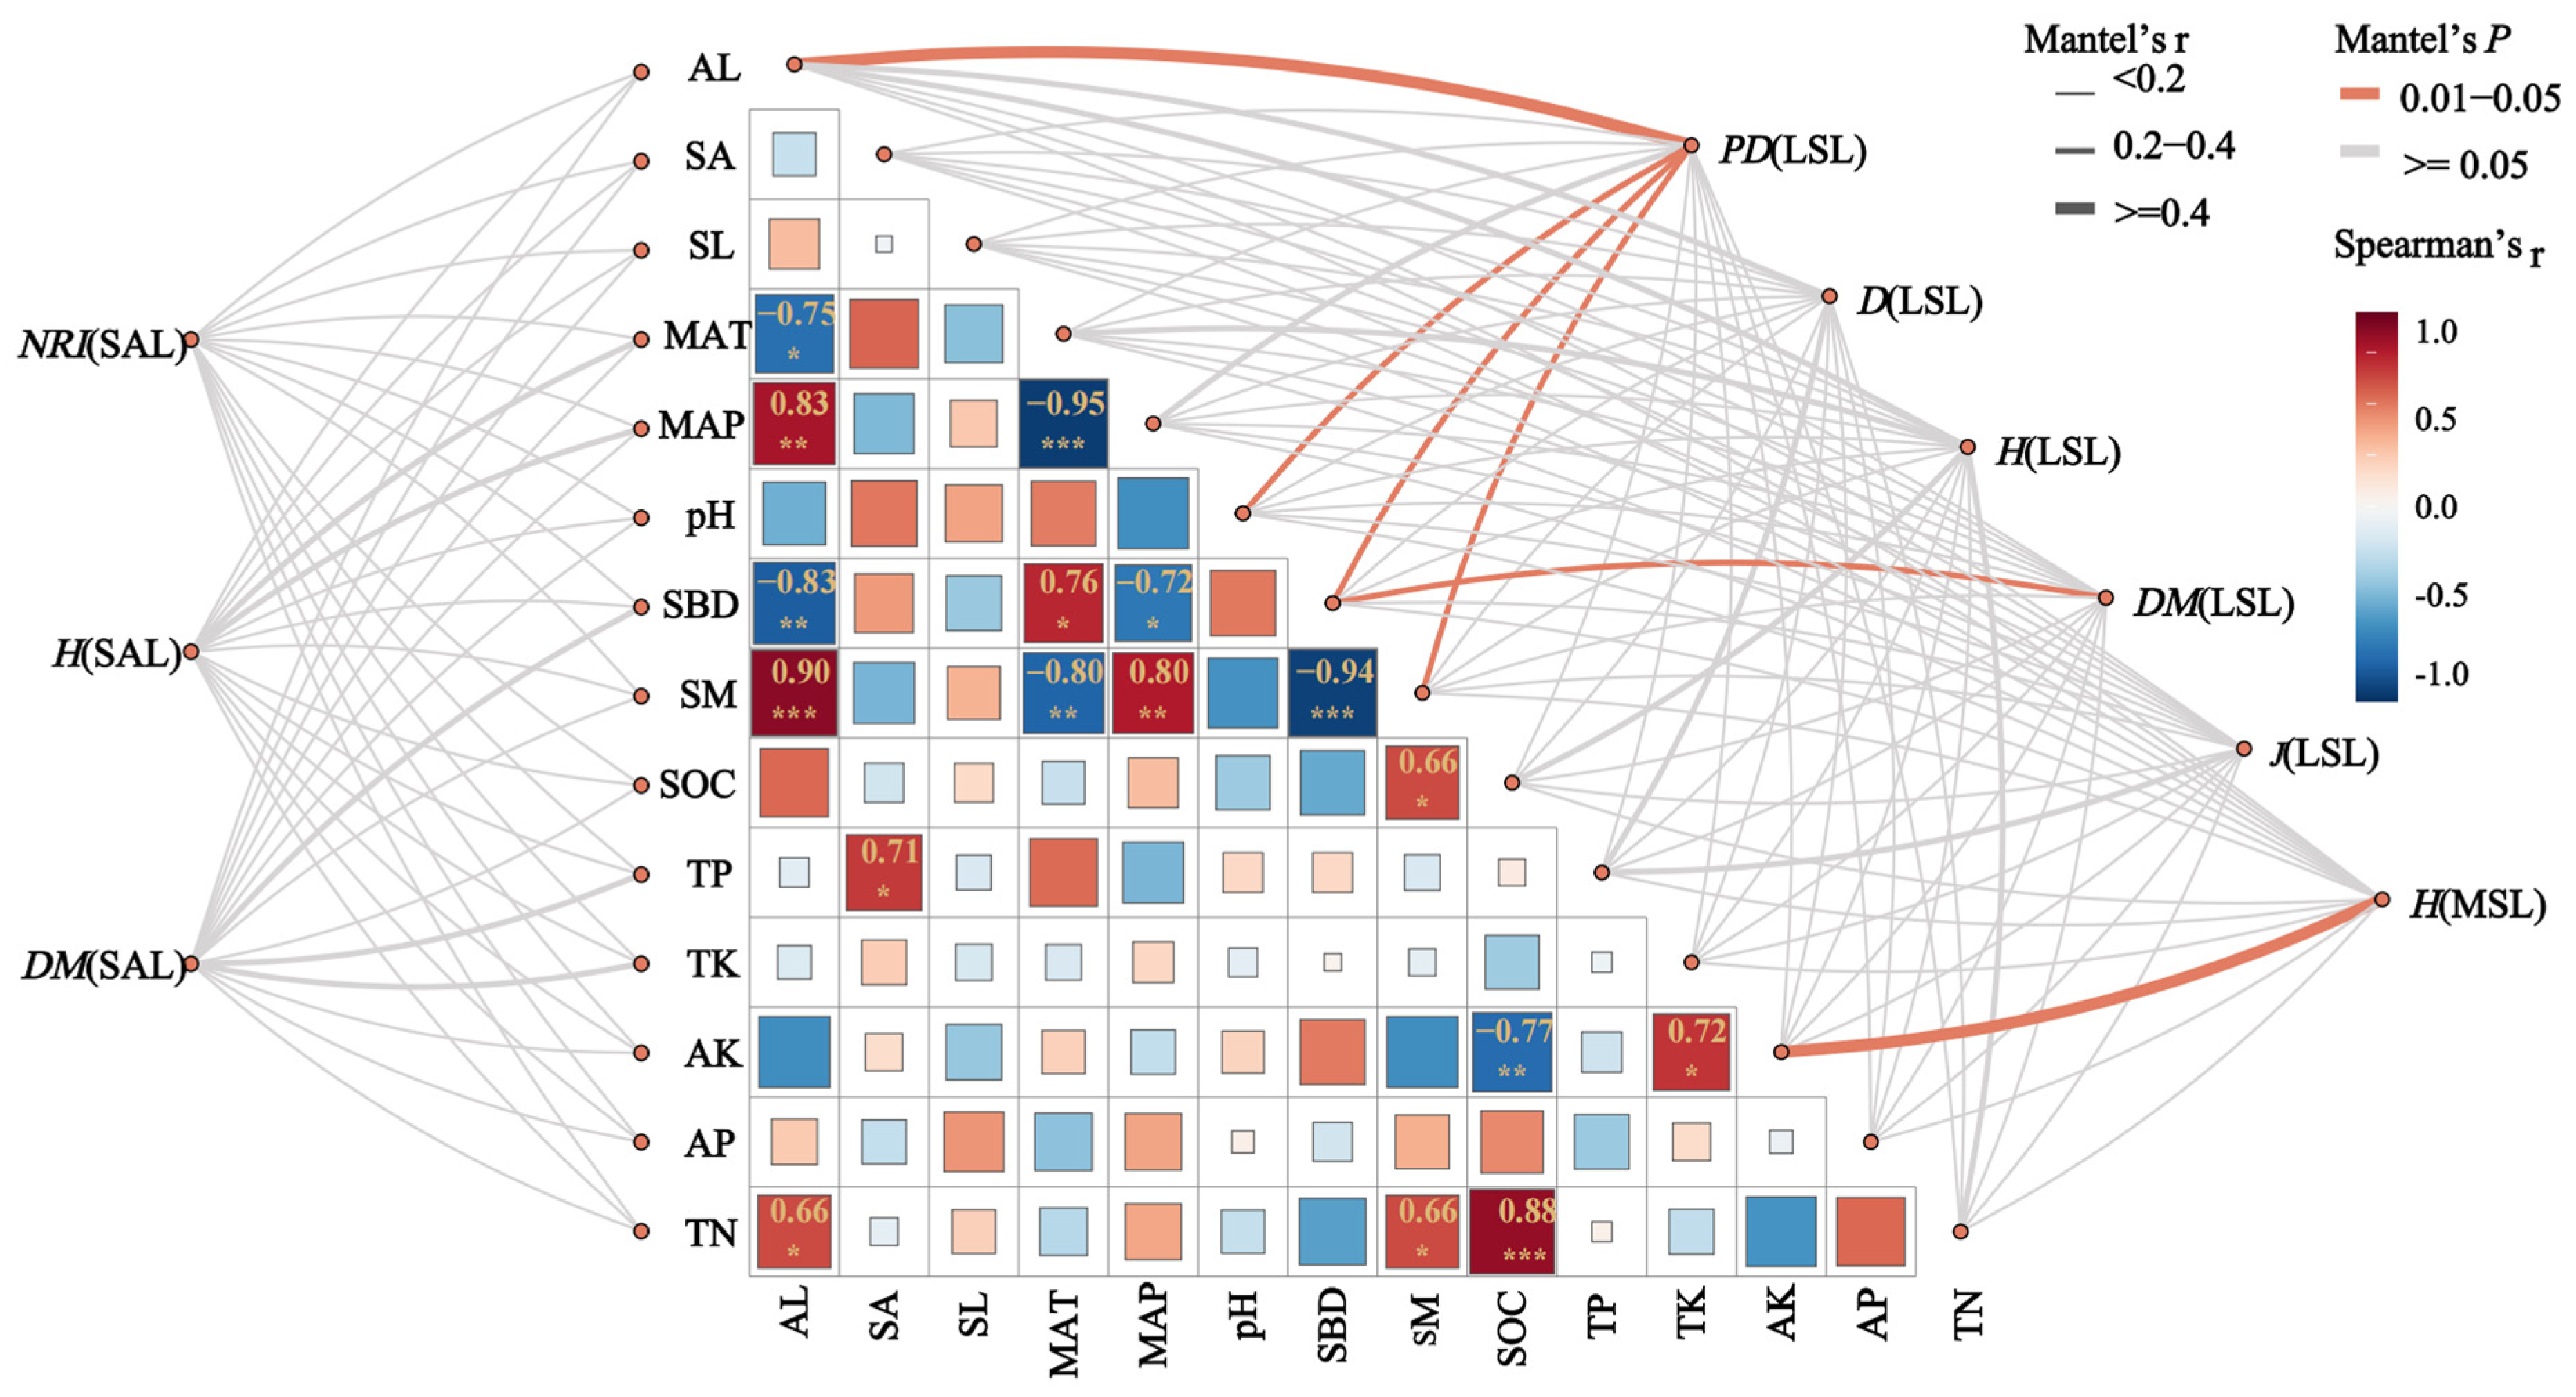
A Mantel test was conducted to examine the relationships between diversity indices and environmental factors that exhibited significant differences across various forest layers in the H. hainanensis communities of the two regions. As shown in Figure 7, in Bawangling, the phylogenetic diversity index (PD) of the large shrub layer displayed a highly significant positive correlation with total phosphorus in the soil (p < 0.01), while the Pielou index was highly positively correlated with soil organic carbon and total nitrogen (p < 0.01). In Jianfengling (Figure 8), the Margalef index of the large shrub layer showed a significant positive correlation with soil bulk density (p < 0.05), and the phylogenetic diversity index (PD) demonstrated significant positive correlations with altitude, soil pH, soil water content, and soil bulk density (p < 0.05). Furthermore, the Shannon–Wiener diversity index of the middle shrub layer exhibited a significant positive correlation with available potassium in the soil (p < 0.05).

4. Discussion

4.1. Community Diversity Indices of Different Forest Layers

In terms of the species diversity indices, the Simpson index, the Shannon–Wiener index, the Margalef index, and the Pielou index exhibited a varying performance across different forest layers. These findings are consistent with previous studies on species diversity in tropical forest strata [36,37]. Within the H. hainanensis community, no significant differences were observed in the Simpson index between the middle arbor layer, the small arbor layer, and the middle shrub layer. However, in the large shrub layer, the value in Bawangling was significantly lower than that in Jianfengling. This suggests that Jianfengling’s large shrub layer has a higher species diversity, potentially due to more favorable environmental conditions for the growth of large shrub layer plants in this region. The species diversity in the shrub layer is typically influenced by a combination of factors such as soil fertility, light conditions, and water availability [38]. The Shannon–Wiener index was significantly lower in Bawangling’s small arbor layer and large shrub layer compared to that in Jianfengling, while it was notably higher in the middle shrub layer of Bawangling. This indicates that Bawangling’s middle shrub layer has a relatively higher species richness and evenness, whereas Jianfengling exhibits greater species richness and evenness in its small tree and large shrub layers. These differences may be attributed to the distinct environmental conditions and ecological processes in each region. The middle shrub layer in Bawangling likely benefits from more optimal light and moisture conditions, promoting a more even species distribution and increased richness [39]. Conversely, the small tree and large shrub layers in Jianfengling may experience less anthropogenic disturbances and more stable environmental conditions, fostering long-term growth stability and species diversity accumulation [40]. The Margalef and Pielou indices further support the observed differences in the species diversity across forest layers between the two regions. The Margalef index revealed that the small arbor and large shrub layers in Bawangling were significantly less diverse than those in Jianfengling, while no significant differences were found in the medium tree and middle shrub layers. The Pielou index showed no significant differences in the medium tree, small arbor, or middle shrub layers, but the large shrub layer in Bawangling was significantly less diverse than that in Jianfengling. These results indicate that Jianfengling has a distinct advantage in both its species richness and evenness within the large shrub layer, while Bawangling excels in its species richness in the middle shrub layer [41,42].
Regarding the phylogenetic diversity of dominant tree species, the PD index revealed no significant differences in the middle arbor layer, small arbor layer, or middle shrub layer. However, in the large shrub layer, Bawangling exhibited significantly lower values than those in Jianfengling. This finding aligns with the differences observed in the species diversity index for the large shrub layer, suggesting that Jianfengling may possess richer phylogenetic diversity in this layer. Its dominant species may encompass a broader range of distinct evolutionary lineages [43]. These differences in phylogenetic diversity could be linked to environmental heterogeneity and historical evolutionary processes between the two regions. For instance, Jianfengling may have experienced more complex environmental changes during its geological history, fostering species divergence and enhancing phylogenetic diversity. The NRI showed no significant differences in the medium tree layer, the large shrub layer, or the middle shrub layer. However, in the small arbor layer, Bawangling exhibited significantly higher values than Jianfengling. This suggests that the dominant species in the small arbor layer of Bawangling may tend to cluster together with relatively close phylogenetic relationships. Such phylogenetic clustering may be influenced by local environmental factors or ecological processes, such as specific soil conditions or animal dispersal mechanisms, which could facilitate the aggregation of closely related tree species in this layer. Previous studies have also indicated that closely related tree species often coexist more readily under specific environmental conditions in certain tropical forests [44,45], potentially due to their similar adaptive traits. The NTI showed no significant differences across forest strata, suggesting that the degree of nearest taxon phylogenetic relatedness among dominant tree species in the two regions remained relatively consistent across different layers. This indicates that the dominant tree species in both regions share similar evolutionary relationships across various forest strata, likely shaped by comparable evolutionary pressures and ecological selection.
The regional differences observed in the phylogenetic–species diversity relationship between the two areas reflect the combined influences of environmental history and contemporary ecological processes. These findings emphasize the importance of accounting for both vertical stratification effects and regional environmental heterogeneity in order to fully understand the mechanisms that sustain biodiversity in tropical forests.

4.2. The Correlation Between the Species Diversity Index and the Phylogenetic Diversity Index of Dominant Tree Species

In the H. hainanensis community of Bawangling, the phylogenetic diversity (PD) of dominant tree species in the middle canopy layer shows a significant positive correlation with the Simpson index, as well as a highly significant positive correlation with both the Shannon–Wiener and Margalef indices. This suggests that in the middle canopy layer, species diversity is strongly associated with the phylogenetic diversity of dominant tree species. Increased phylogenetic diversity may foster higher species diversity, as communities with greater phylogenetic diversity are likely to harbor more evolutionarily distinct species, which in turn reduces interspecific competition and enhances niche differentiation. These findings align with prior studies that have demonstrated a similar relationship between the phylogenetic diversity and species diversity in the middle canopy layer of tropical forests [46]. Specifically, in these forests, the canopy layer with greater species diversity is also characterized by higher phylogenetic diversity in its dominant tree species, showing a significant correlation with various species diversity indices. This indicates that in this forest stratum, phylogenetic diversity serves as a useful indicator of species diversity trends. The greater the phylogenetic diversity of dominant tree species, the more likely it is that complex evolutionary differentiation exists among the species, thereby creating ecological niches that facilitate species coexistence and promote increased species diversity. Additionally, a significant positive correlation was observed between the net relatedness index (NTI) of the dominant species in the middle canopy layer and the Pielou index, as well as between the NTI of dominant species in the understory and the Simpson index. These results suggest that the relationships between phylogenetic diversity measures and species diversity indices vary across different forest strata. This variation may be influenced by factors such as the niche differentiation, species competition, and environmental heterogeneity within each layer. For example, the middle canopy layer, with its higher canopy position and relatively larger growing space, is likely to experience more intense light competition and face more complex environmental pressures (e.g., wind), leading to a closer relationship between phylogenetic diversity and the evenness index (Pielou index). In contrast, the understory, which may be shaded by the midstory canopy, shows a stronger correlation between the phylogenetic diversity of dominant species and species dominance (the Simpson index).
In the H. hainanensis community of Jianfengling, the net relatedness index (NRI) of the dominant tree species in the middle arbor layer showed significant positive correlations with both the Simpson index and the Pielou index. Meanwhile, the NRI of dominant species in the mid-shrub layer exhibited a highly significant positive correlation with these two diversity indices. The nearest taxon index (NTI) displayed significant positive correlations with the Simpson index and the Shannon–Wiener index, along with a highly significant positive correlation with the Pielou index. These findings show some differences compared to the results of the correlation analysis for the H. hainanensis community in Bawangling, although there are notable similarities—specifically consistent significant positive relationships between the phylogenetic diversity metrics (of the dominant species in both the mid-tree and mid-shrub layers) and species diversity indices. This suggests that despite potential differences in the ecological environments and species composition between the two regions, an inherent connection between phylogenetic diversity and species diversity remains. However, variations in the strength of the correlation and the specific correlation indicators may reflect differences in environmental factors such as climatic conditions, soil properties, and disturbance history between the two regions. These factors likely influence species interactions and niche differentiation patterns within the communities.
The differences in the correlation patterns between the two regions may reflect various ecological processes, such as spatial variations in the intensity of environmental filtering, stratum-specific effects of competitive exclusion, and regional differences in historical disturbance events. These findings highlight the importance of considering both phylogenetic relationships and ecological processes together when seeking to understand the mechanisms that sustain biodiversity in tropical forests.

4.3. The Correlation Between the Diversity Index and Environmental Factors

In the shrub layer of Bawangling, the phylogenetic diversity index (PD) exhibited a significant positive correlation with total phosphorus in the soil, which is consistent with previous studies highlighting the important role of soil phosphorus in shaping plant diversity [47,48]. The availability of phosphorus in the soil can influence plant growth and reproduction, which, in turn, affects the phylogenetic diversity of plant communities. Higher concentrations of total phosphorus provide plants with more ample nutrients, promoting their growth and reproduction. This results in more complex phylogenetic relationships among species within the community, thereby increasing the PD index. Furthermore, the Pielou index displayed a significant positive correlation with soil organic carbon and total nitrogen, suggesting that in the shrub layer of this region, these two factors significantly influence community evenness. Soil organic carbon and total nitrogen are key indicators of soil fertility, and higher levels generally signal better soil quality, offering abundant nutrients for plant growth. This leads to a reduction in the resource competition among species, promoting a more even distribution of individuals within the community and increasing the Pielou index. These findings align with other studies [49,50] that show a positive correlation between soil fertility and plant community evenness, suggesting that soil fertility can regulate species composition and distribution, ultimately affecting community evenness.
For the shrub layer in Jianfengling, the Margalef index showed a significant positive correlation with soil bulk density, suggesting that the soil’s physical properties influence the species richness within the community. Lower soil bulk density increases soil porosity, enhancing aeration and water permeability, which in turn promotes root growth and development [51]. This creates favorable conditions for a greater number of species, thereby increasing community species richness and elevating the Margalef index. Meanwhile, the phylogenetic diversity index (PD) exhibited significant positive correlations with altitude, soil pH, soil water content, and soil bulk density. This indicates that multiple environmental factors collectively shape the phylogenetic diversity of the shrub layer community in this region. Altitudinal changes often bring about shifts in climatic conditions and soil types, which, in turn, affect plant distribution and community structure. Soil pH and moisture content are crucial factors in plant growth and community succession. The optimal pH and moisture conditions promote plant growth and reproduction, thereby influencing the phylogenetic diversity of the community. These findings align with previous studies suggesting that altitude, soil pH, and moisture content significantly impact plant community diversity. They highlight the integrated role of various environmental factors in the formation and maintenance of plant community diversity. The Shannon–Wiener diversity index of the middle shrub layer showed a significant positive correlation with available potassium in the soil, indicating that the soil’s potassium content plays a crucial role in species diversity within this forest stratum. As one of the essential nutrients for plant growth, higher available potassium in the soil can stimulate plant growth and reproduction, resulting in an increase in the number of individuals and species in the community, thereby enhancing the Shannon–Wiener diversity index. This finding is consistent with studies suggesting that soil nutrients have a notable impact on plant community diversity [52,53]. It implies that the influence of soil nutrients on community diversity may differ across various forest layers, highlighting the need for a context-specific analysis based on the forest strata and environmental conditions. To conserve H. hainanensis communities in different regions, differentiated management strategies should be developed: prioritizing soil nutrient management in Bawangling while strengthening the protection of the topography and the soil’s physical properties in Jianfengling. Future research could involve long-term monitoring combined with a functional trait analysis to explore the ecological processes underlying community assembly further, providing a more comprehensive scientific foundation for the conservation of endangered tree species.
The differences in environmental drivers between the two regions may be attributed to several factors: spatial variability in the soil’s properties due to the geological background, regional climatic variations, and distinct historical disturbance patterns. These findings highlight the importance of considering region-specific environment–diversity relationships when developing conservation strategies. Specifically, they emphasize the need for differentiated management approaches tailored to various forest layers.

4.4. The Protection Strategy

This study on the diversity of the communities where H. hainanensis is found in Bawangling and Jianfengling offers both a theoretical foundation and practical insights for the conservation and management of endangered plant communities in tropical regions globally. This research highlights the variations in diversity across different forest layers and the environmental factors that drive these differences. It not only sheds light on the role of the soil in shaping community structure but also uncovers potential links between human activity and soil degradation. These findings have broad implications for ecological conservation efforts worldwide. From a practical conservation standpoint, this study provides a basis for developing targeted strategies aiming to enhance the soil’s fertility, tailored to the nutrient characteristics of each region. For example, in areas with nutrient-poor soils, managing the litter scientifically can enhance nutrient cycling; in regions more prone to soil degradation, preserving the physical properties of the soil is crucial to maintaining its natural heterogeneity. At the theoretical level, this research further underscores the importance of the complex feedback mechanisms between the soil and plants in community formation, enriching our understanding of niche differentiation and species coexistence theories. It provides fresh perspectives on how endangered plant communities persist globally. Furthermore, the differentiated conservation strategies proposed by this study break through the limitations of traditional models, advocating for tailored approaches based on the unique ecological characteristics of each region. This approach has significant implications for refining global biodiversity conservation strategies, contributing to the theoretical development of community assembly, and offering valuable insights for addressing global climate change and biodiversity crises.

4.5. Limitations and Prospects

This study analyzed the species and phylogenetic diversity of H. hainanensis communities in Bawangling and Jianfengling, uncovering significant relationships between diversity indices across different forest layers and environmental factors. While valuable insights were gained, this study has certain limitations, such as a small sample size, an insufficient analysis of environmental factors, and the absence of long-term monitoring data. Future research should broaden its scope, incorporate a more comprehensive range of environmental factors, establish long-term monitoring stations, and delve deeper into species interactions and anthropogenic disturbances to enhance our understanding and conservation of these vital ecosystems.

5. Conclusions

This study systematically reveals the multi-level regulatory mechanisms that govern the diversity patterns of the H. hainanensis communities in tropical rainforest, highlighting significant forest layer specificity in the community construction process. The large shrub layer in Jianfengling exhibits a higher species diversity and phylogenetic diversity (PD), while the middle shrub layer in Bawangling demonstrates a higher Shannon–Wiener index. Notably, this study is the first to identify a region-specific coupling relationship between phylogenetic and species diversity. In Bawangling, the PD of the middle arbor layer shows significant positive correlations with the Simpson and Shannon indices, suggesting that phylogenetic evolutionary history plays a role in promoting species coexistence. The environmental driver analysis reveals that the PD of the large shrub layer in Bawangling is significantly correlated with total phosphorus in the soil, while the diversity in Jianfengling is primarily influenced by altitude, soil pH, and bulk density. These findings not only enhance our understanding of the mechanisms maintaining the vertical structural diversity of tropical rainforests but also provide a crucial scientific basis for formulating differentiated conservation strategies for the endangered H. hainanensis. This emphasizes the necessity of implementing targeted management measures that address the specific environmental needs of different forest layers in conservation practices.

Author Contributions

S.H.: Field investigation survey; writing—original draft preparation. D.L., X.Y. and D.Q.: Conceptualization; methodology; writing—review and editing. N.S., C.L., R.L. and C.D.: Field investigation. All authors have read and agreed to the published version of the manuscript.

Funding

The authors acknowledge the financial support for this work from the National Natural Science Foundation of China (No. 32260267), the project funded by Hainan Provincial Forestry Bureau (HD-KYH-2022165), and the Hainan Province Postgraduate Innovative Research Project (Qhys2023-311).

Data Availability Statement

The data will be made available on request.

Acknowledgments

The authors thank the editor and reviewers for their valuable comments and constructive suggestions.

Conflicts of Interest

The authors declare that they have no known competing financial interests or personal relationships that could have appeared to influence the work reported in this paper.

Appendix A

Figure A1. A phylogenetic tree of dominant tree species in different forest layers of Bawangling.
Diversity 17 00556 g0a1
Figure A2. A phylogenetic tree of dominant tree species in different forest layers of Jianfengling.
Diversity 17 00556 g0a2

References

  1. Tan, R.P.; Hou, K.; Wu, H.Q. The cost of biodiversity protection: National Key Ecological Functional Zone and labor demand in China. J. Asian. Econ. 2025, 97, 101895. [Google Scholar] [CrossRef]
  2. Pascual, U.; Adams, W.M.; Díaz, S.; Lele, S.; Mace, G.M.; Turnhout, E. Biodiversity and the challenge of pluralism. Nat. Sustain. 2021, 4, 567–572. [Google Scholar] [CrossRef]
  3. Srivathsa, A.; Vasudev, D.; Nair, T.; Chakrabarti, S.; Chanchani, P.; DeFries, R.; Deomurari, A.; Dutta, S.; Ghose, D.; Goswami, V.R.; et al. Prioritizing India’s landscapes for biodiversity, ecosystem services and human well-being. Nat. Sustain. 2023, 6, 568–577. [Google Scholar] [CrossRef]
  4. Wang, L.H.; Wei, F.L.; Tagesson, T.; Fang, Z.X.; Svenning, J.C. Transforming forest management through rewilding: Enhancing biodiversity, resilience, and biosphere sustainability under global change. One Earth 2025, 8, 101195. [Google Scholar] [CrossRef]
  5. Qu, Y.; Zeng, X.Y.; Luo, C.Y.; Zhang, H.Q.; Liu, Y.N.; Wang, J.F. Constructing wetland ecological corridor system based on hydrological connectivity with the goal of improving regional biodiversity. J. Environ. Manag. 2024, 368, 122074. [Google Scholar] [CrossRef]
  6. Swenson, N.G.; Erickson, D.L.; Mi, X.C.; Bourg, N.A.; Jimena, F.M.; Ge, X.J.; Robert, H.; Lake, J.K.; Liu, X.J.; Ma, K.P.; et al. Phylogenetic and functional alpha and beta diversity in temperate and tropical tree communities. Ecology 2012, 93, S112–S125. [Google Scholar] [CrossRef]
  7. McGill, B.J.; Etienne, R.S.; Gray, J.S.; Alonso, D.; Anderson, M.J.; Benecha, H.K.; Dornelas, M.; Enquist, B.J.; Green, J.L.; He, F.L.; et al. Species abundance distributions: Moving beyond single prediction theories to integration within an ecological framework. Ecol. Lett. 2007, 10, 995–1015. [Google Scholar] [CrossRef] [PubMed]
  8. Schweiger, O.; Klotz, S.; Durka, W.; Kühn, I. A comparative test of phylogenetic diversity indices. Oecologia 2008, 157, 485–495. [Google Scholar] [CrossRef]
  9. Che, Y.; Jin, G.Z. effects of species diversity and phylogenetic diversity on the productivity of broadleaved Korean pine forests. Chin. J. Appl. Ecol. 2019, 30, 2241–2248. [Google Scholar] [CrossRef]
  10. Merwin, L.; He, T.H.; Lamont, B.B. Phylogenetic and phenotypic structure among Banksia communities in south-western Australia. J. Biogeogr. 2012, 39, 397–407. [Google Scholar] [CrossRef]
  11. Lu, Y.X.; Ye, M.; Qian, J.R.; Chen, W.L.; Che, J.; Li, M.M.; Zeng, G.Y. Study on biodiversity and phylogenetic diversity of grasslands in the Habahe forest area of Xinjiang and analysis of influencing factors. ActaPratac.Sin. 2025, 34, 1–12. [Google Scholar]
  12. Yan, Y.; Yang, X.; Tang, Z. Patterns of species diversity and phylogenetic structure of vascular plants on the Q inghai-T ibetan P lateau. Ecol. Evol. 2010, 3, 4584–4595. [Google Scholar] [CrossRef]
  13. Gong, H.; Yu, T.; Zhang, X.; Zhang, P.; Han, J.; Gao, J. Effects of boundary constraints and climatic factors on plant diversity along an altitudinal gradient. Glob. Ecol. Conserv. 2019, 19, e00671. [Google Scholar] [CrossRef]
  14. Macheroum, A.; Kadik, L.; Neffar, S.; Chenchouni, H. Environmental drivers of taxonomic and phylogenetic diversity patterns of plant communities in semi-arid steppe rangelands of North Africa. Ecol. Indic. 2021, 132, 108279. [Google Scholar] [CrossRef]
  15. Wani, S.A.; Zargar, S.A.; Dar, F.A.; Khoja, A.A.; Malik, A.H.; Rashid, I.; Khuroo, A.A. Elevational patterns and drivers of taxonomic and phylogenetic diversity of pteridophytes: A case study from the Himalaya. Flora 2025, 323, 152654. [Google Scholar] [CrossRef]
  16. Zheng, J.; Arif, M.; He, X.; Ding, D.; Zhang, S.; Ni, X.; Li, C. Plant community assembly is jointly shaped by environmental and dispersal filtering along elevation gradients in a semiarid area, China. Front. Plant Sci. 2022, 13, 1041742. [Google Scholar] [CrossRef]
  17. Ndiribe, C.; Salamin, N.; Guisan, A. Understanding the concepts of community phylogenetics. Evol. Ecol. Res. 2013, 15, 853–868. [Google Scholar] [CrossRef]
  18. Editorial Committee of Flora of China; Chinese Academy of Sciences. Flora of China; Beijing Science Press: Beijing, China, 1990. [Google Scholar]
  19. Fu, L.G. China Red Data Book of Rare and Endangered Plants; Beijing Science Press: Beijing, China, 1991; Volume 1. [Google Scholar]
  20. Luo, W.; Xu, H.; Li, Y.P.; Xie, C.H.; Lu, C.Y.; Liang, C.S.; Su, H.H.; Li, Z.L. Population Structure and Quantitative Dynamics of a Wild Plantwith Extremely Small Populations Hopea hainanensis. For. Res. 2023, 36, 169–177. [Google Scholar] [CrossRef]
  21. Wu, E.H.; Nong, S.Q.; Yang, X.B.; Lu, G.; Li, D.H. Hopea hainanensis, a representative tree species of the Hainan tropical rainforest. For. Hum. 2021, 10, 42–45. [Google Scholar]
  22. Zhang, L.; Zhang, H.L.; Chen, Y.K.; Nizamani, M.M.; Zhou, Q.; Su, X. Analyses of community stability and inter-specific associations between a plant species with extremely small populations (Hopea hainanensis) and its associated species. Front. Ecol. Evol. 2022, 10, 922829. [Google Scholar] [CrossRef]
  23. Wang, C.; Ma, X.; Ren, M.; Tang, L. Genetic diversity and population structure in the endangered tree Hopea hainanensis (Dipterocarpaceae) on Hainan Island, China. PLoS ONE 2020, 15, e0241452. [Google Scholar] [CrossRef]
  24. Xiao, Y.X.; Yin, L.H.; Yu, W.B.; Tang, J.W. Study on population structure and seedling regeneration of Hopea hainanensis Merr. Chun underex situ conservation in XishuangbannaTropical Botanical Garden. Plant. Sci. J. 2023, 41, 604–612. [Google Scholar] [CrossRef]
  25. Zhang, D.; Qi, X.; Liu, S.; Lu, K.; Chen, Y.; Long, W. Seasonal home range utilization of Hainan gibbons (Nomascus hainanus) in a secondary tropical forest of Hainan Island, South China. Glob. Ecol. Conserv. 2024, 54, e03063. [Google Scholar] [CrossRef]
  26. Xie, C.; Chen, L.; Luo, W.; Jim, C.Y. Species diversity and distribution pattern of venerable trees in tropical Jianfengling National Forest Park (Hainan, China). J. Nat. Conserv. 2014, 77, 126542. [Google Scholar] [CrossRef]
  27. Wang, G.H.; Fang, J.Y.; Guo, K.; Xie, Z.Q.; Tang, Z.Y.; Shen, Z.H.; Wang, R.Q.; Wang, X.P.; Wang, D.L.; Qiang, S.; et al. Contents and protocols for the classification and description of Vegetation Formations, Alliances and Associations of vegetation of China. Chin. J. Plant. Ecol. 2020, 44, 128–178. [Google Scholar] [CrossRef]
  28. Zhao, Y.; Qi, R.; Li, B.; Liu, T.; Cao, J.H.; Li, Y. Niche of woody plant populations in Picea purpurea community in the upper Taohe River. Ecol. Indic. 2024, 166, 112557. [Google Scholar] [CrossRef]
  29. Li, L.; Wei, S.G.; Lian, J.Y.; Cao, H. Distributional regularity of species diversity in plant community at different latitudes in subtropics. Acta Ecol. Sin. 2020, 40, 1249–1257. [Google Scholar] [CrossRef]
  30. Jiang, Z.; Zhang, Y.; Su, Q.; Gan, Q.; Zhou, Q.; Guo, Y.; Hassan, M.U. MaxEnt Modeling for Predicting the Potential Geographical Distribution of Camellia oleifera Abel Under Climate Change. Foresty 2025, 16, 1026. [Google Scholar] [CrossRef]
  31. Luo, X.; Yang, M.; Khan, M.S.; Huang, W.; Liu, S.; Liao, F.; Li, Y. Climate and topographic drivers of species and functional diversity in subtropical shrublands of Guangdong, China. Ecol. Indic. 2025, 176, 113641. [Google Scholar] [CrossRef]
  32. Yi, M. Soil Agro-Chemical Analysis; Agricultural Press: North Richmond, Australia, 1980. [Google Scholar]
  33. Su, Y.Q.; Zhang, Y.; Jia, X.R.; Xue, Y.G. Application of several diversity indexes in forest community analysis. Ecol. Sci. 2017, 36, 132–138. [Google Scholar] [CrossRef]
  34. Pommerening, A. Approaches to quantifying forest structures. Foresty 2002, 75, 305–324. [Google Scholar] [CrossRef]
  35. Gamito, S. Caution is needed when applying Margalef diversity index. Ecol. Indic. 2010, 10, 550–551. [Google Scholar] [CrossRef]
  36. Wu, H.P.; Liu, J.; Liu, L. Analysis of Plant Community Structure and Similarity at Different Altitudes in Yinggeling Tropical Montane Rainforest, Hainan. Bot. Res. 2024, 13, 1. [Google Scholar] [CrossRef]
  37. Zhong, Y.M.; Guo, X.S.; Yao, Z.Y. Community Composition and Species Diversity of Deciduous Oak Forest in South Subtropical Region of West Guangxi. Acta Bot. Bor-Occid. Sin. 2022, 42, 1945–1953. [Google Scholar] [CrossRef]
  38. Huang, R.X.; Xu, M.F.; Liu, T.; Wu, Z.L.; Su, Z.Y. Environmental Interpretation and Species Diversity of Understory Vegetation in 5 Subtropical Forest Types. J. Southwest For. Univ. (Nat. Sci. Ed.) 2020, 40, 53–62. [Google Scholar] [CrossRef]
  39. Wang, Q.; Li, J.B.; Yang, X.B.; Zeng, R.J.; Xia, D.; Wang, H.; Zhu, Z.C.; Jiang, Y.X.; Wang, C.Y.; Zhang, S.W.; et al. Community structure and species diversity of Pinuslatteri forests in Bawangling Ridge, Hainan. J. Trop. Biol. 2023, 14, 585–592. [Google Scholar] [CrossRef]
  40. Xu, H.; Li, Y.D.; Lin, M.X.; Wu, J.H.; Luo, T.S.; Zhou, Z.; Chen, D.X.; Yang, H.; Li, G.J.; Liu, S.R. Community characteristics of a 60 ha dynamics plot in the tropical montane rain forest in Jianfengling, Hainan Island. Biodivers. Sci. 2015, 23, 192–201. [Google Scholar] [CrossRef]
  41. Liu, H.D.; Chen, Q.; Xu, Z.Y.; Liu, Y.; Jiang, Y.; Chen, Y.F. Effects of topographical factors on species diversity across Dacrydium pectinatum natural community in Hainan Island. Chin. J. Ecol. 2020, 39, 394–403. [Google Scholar] [CrossRef]
  42. Wu, Y.P.; Xu, H.; Li, Y.D. Elevation Patterns of Tree and Shrub Species Diversity of Tropical Forests in Jianfengling, Hainan Island. Sci. Silv. Sin. 2013, 49, 16–23. [Google Scholar] [CrossRef]
  43. Xu, G.X.; Shi, Z.M.; Tang, J.C.; Xu, H.; Yang, H.; Liu, L.R.; Li, Y.D.; Li, M.X. Effects of species abundance and size classes on assessing community phylogenetic structure: A case study in Jianfengling tropical montane rainforest. Biodivers. Sci. 2016, 24, 617–628. [Google Scholar] [CrossRef]
  44. Sedio, B.E.; Parker, J.D.; McMahon, S.M.; Wright, S.J. Comparative metabolomics of forest communities: Species differences in foliar chemistry are greater in the tropics. bioRxiv 2018. [Google Scholar] [CrossRef]
  45. Asefa, M.; Cao, M.; Zhang, G.; Ci, X.; Li, J.; Yang, J. Environmental filtering structures tree functional traits combination and lineages across space in tropical tree assemblages. Sci. Rep. 2017, 7, 132. [Google Scholar] [CrossRef]
  46. Li, M.J.; He, Z.S.; Jiang, L.; Gu, X.G.; Ji, M.R.; Chen, B.; Liu, J.F. Distribution pattern and driving factors of species diversity and phylogenetic diversity along altitudinal gradient on the south slope of Daiyun Mountain. Acta. Ecol. Sin. 2021, 41, 1148–1157. [Google Scholar] [CrossRef]
  47. Khan, F.; Siddique, A.B.; Shabala, S. Phosphorus plays key roles in regulating plants’ physiological responses to abiotic stresses. Plants 2023, 12, 2861. [Google Scholar] [CrossRef] [PubMed]
  48. Li, Y.; Lu, X.; Su, J.; Bai, Y. Phosphorus availability and planting patterns regulate soil microbial effects on plant performance in a semiarid steppe. Ann. Bot. 2023, 131, 1081–1095. [Google Scholar] [CrossRef] [PubMed]
  49. Lin, L.; Dai, L.; Lin, Z.B.; Wu, J.T.; Yan, W.; Wang, Z.J. Plant Diversity and Its Relationship with Soil Physicochemical Properties of Urban Forest Communities in Central Guizhou. J. Ecol. Environ. 2021, 30, 2130–2141. [Google Scholar] [CrossRef]
  50. Xiao, D.R.; Tian, K.; Zhang, L.Q. Relationship between plant diversity and soil fertility in Napahai wetland of Northwestern Yunnan Plateau. Acta Ecol. Sin. 2008, 28, 3116–3124. Available online: https://www.ecologica.cn/stxb/article/abstract/20080720?st=article_issue (accessed on 20 June 2025).
  51. Liang, J.; Zhang, J.; Wong, M.H. Effects of air-filled soil porosity and aeration on the initiation and growth of secondary roots of maize (Zea mays). Plant Soil 1996, 186, 245–254. [Google Scholar] [CrossRef]
  52. Qian, G.; Lu, G. Effects of soil factors on functional trait space of different vegetations in the Tianshan Mountains. Catena 2025, 252, 108852. [Google Scholar] [CrossRef]
  53. Xue, W.; Rillig, M.C.; Yu, M.F.; Hu, J.N.; Huang, L.; Yu, F.H. Soil nutrient heterogeneity alters productivity and diversity of experimental plant communities under multiple global change factors. Oikos 2023, 2023, e10189. [Google Scholar] [CrossRef]
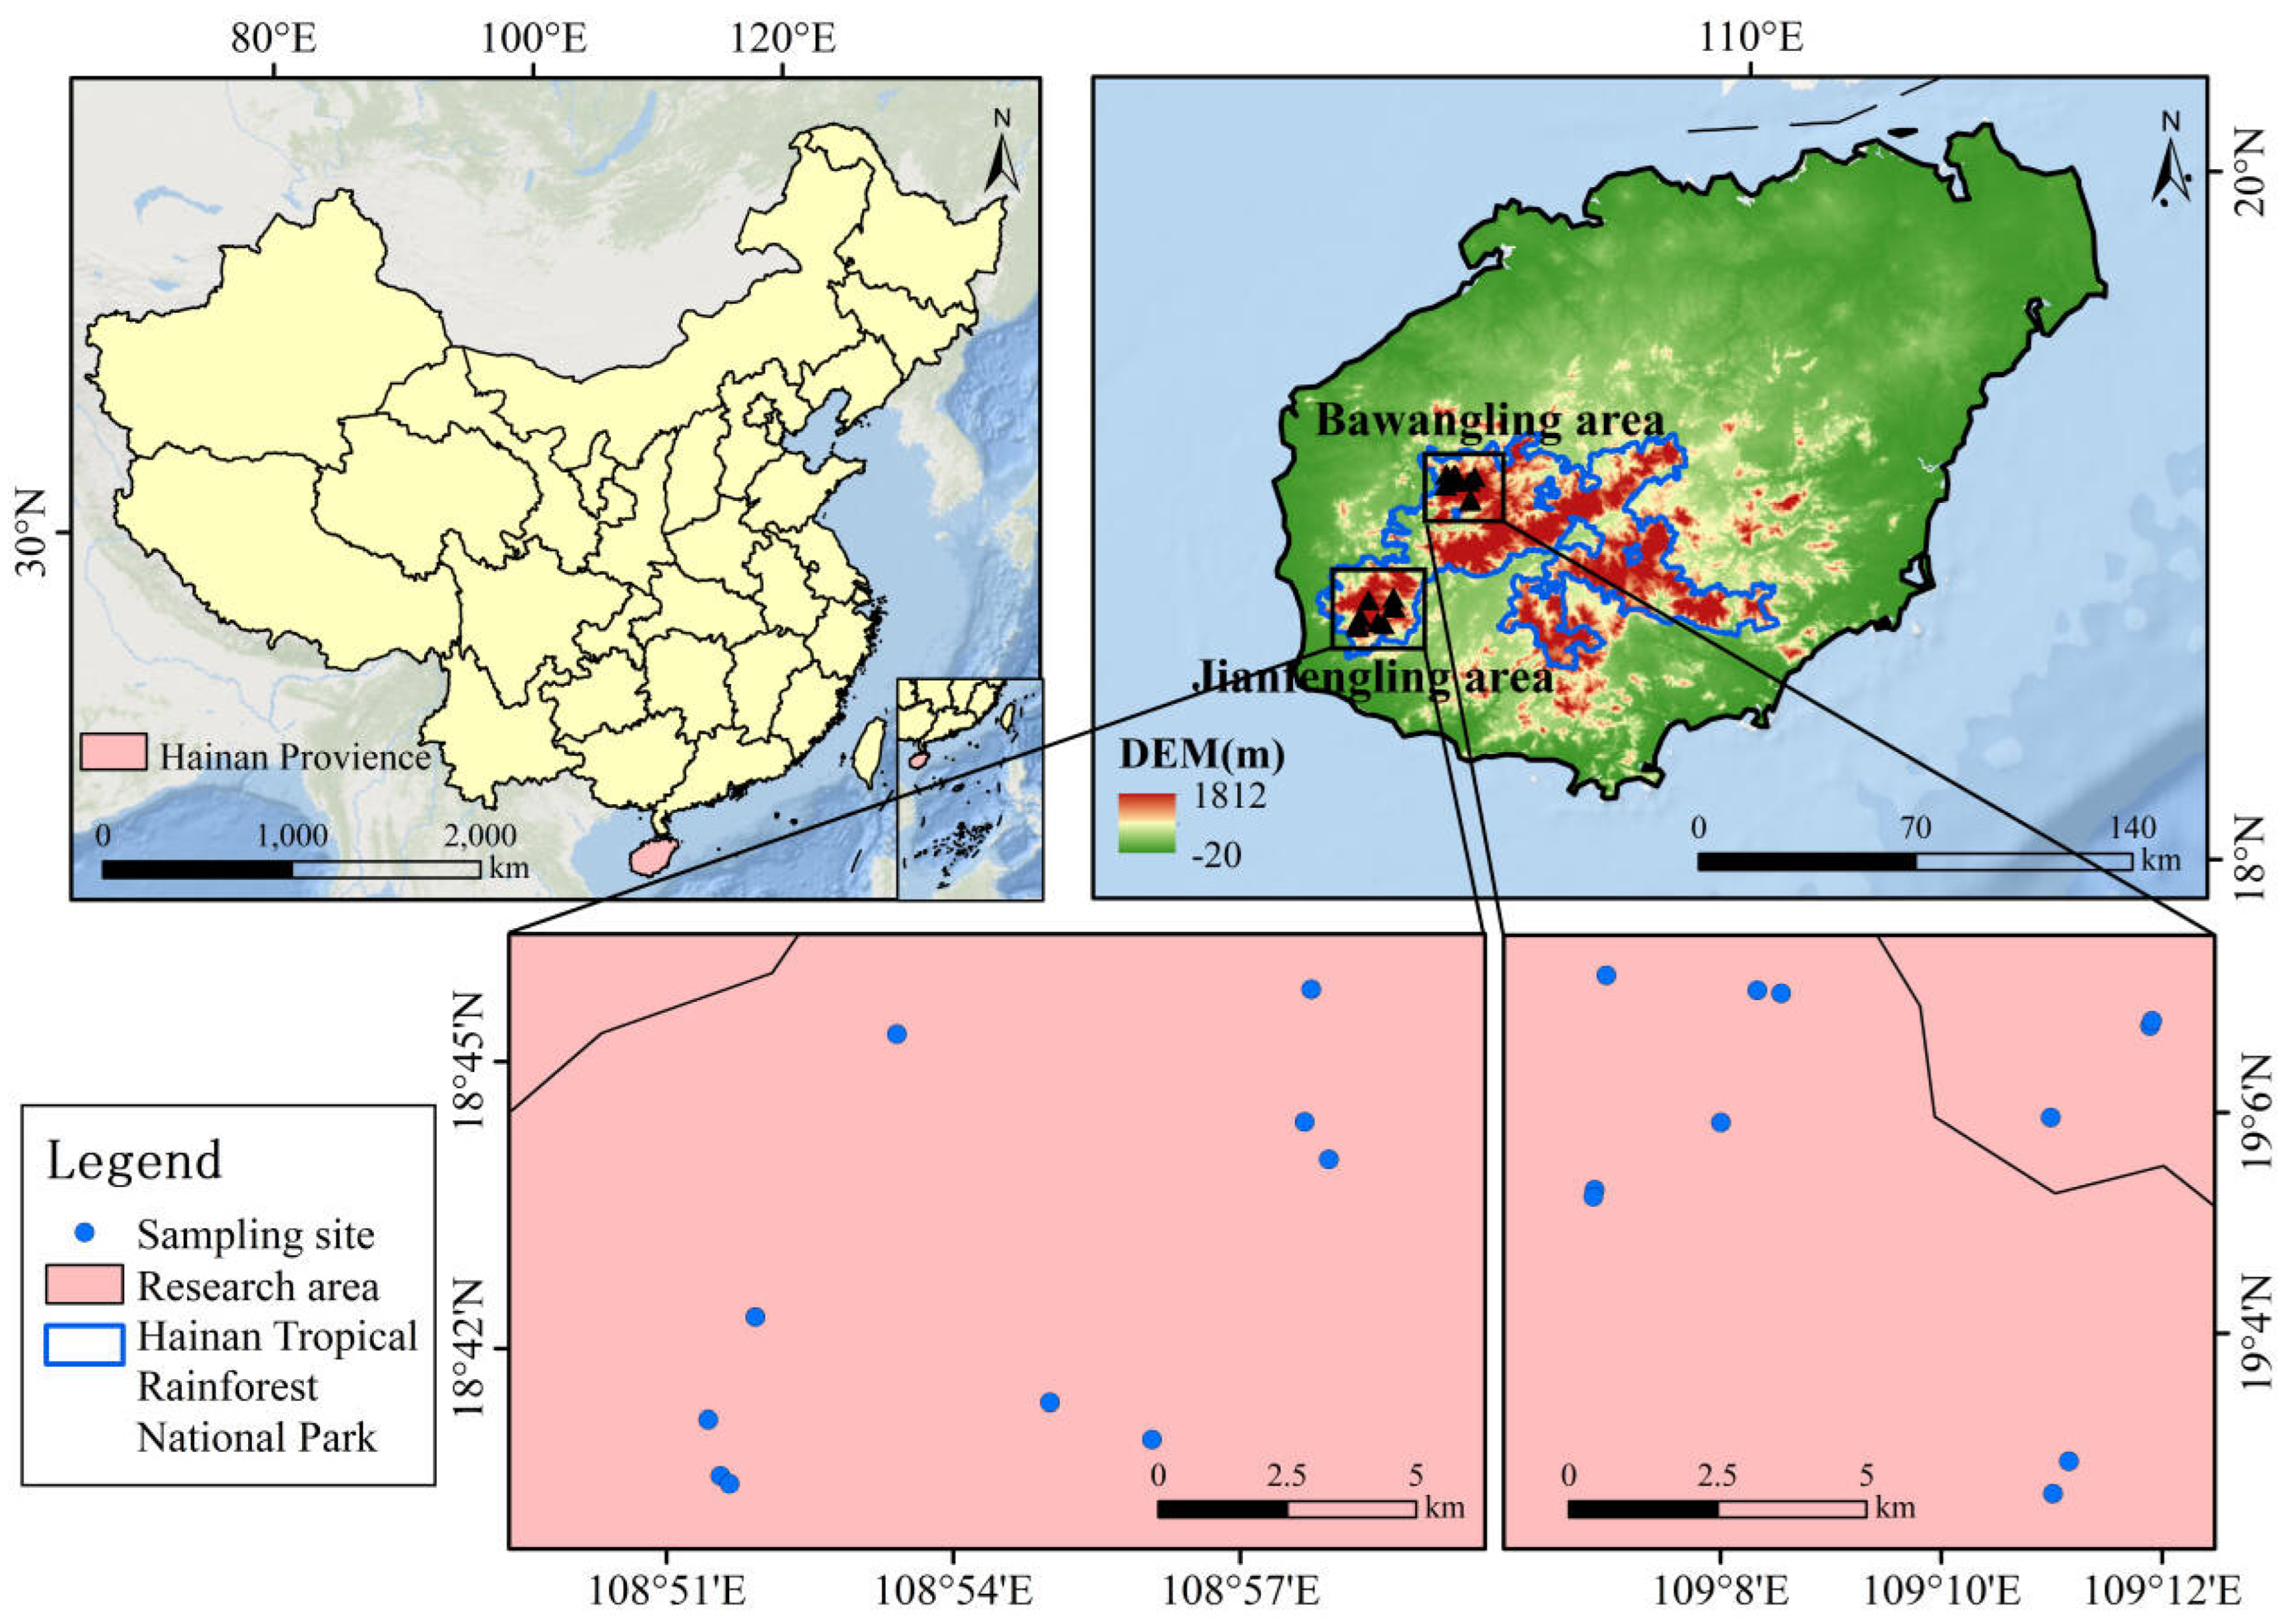
Figure 1. Locations of the sample plots distributed in both Bawangling and Jianfengling.
Diversity 17 00556 g001
Figure 2. Differences in species composition at the family, genus, and species levels. Note: BWL—Bawangling; JFL—Jianfengling; A (differences in species composition at the family level); B (differences in species composition at the genus level); C (differences in species composition at the species level).
Diversity 17 00556 g002
Figure 3. Differences in species diversity indices among different regions within the same forest layer. Note: BWL stands for Bawangling; JFL stands for Jianfengling; MAL represents the middle arbor layer; SAL represents the small arbor layer; LSL represents the large shrub layer; MSL represents the middle shrub layer; D denotes the Simpson diversity index; H denotes the Shannon–Wiener diversity index; DM denotes the Margalef richness index; J denotes the Pielou evenness index.
Diversity 17 00556 g003
Figure 4. Differences in phylogenetic diversity indices among different regions within the same forest layer. Note: BWL stands for Bawangling; JFL stands for Jianfengling; MAL denotes the middle arbor layer; SAL denotes the small arbor layer; LSL denotes the large shrub layer; MSL denotes the middle shrub layer; PD denotes the phylogenetic diversity index; NRI denotes the net relatedness index; NTI denotes the nearest taxon index.
Diversity 17 00556 g004
Figure 5. Correlation analysis of species diversity in different forest layers and phylogenetic diversity of dominant tree species in Bawangling. Note: MAL denotes the middle arbor layer; SAL denotes the small arbor layer; LSL denotes the large shrub layer; MSL denotes the middle shrub layer; PD represents the phylogenetic diversity index; NRI represents the net relatedness index; NTI represents the nearest taxon index; D represents the Simpson diversity index; H represents the Shannon–Wiener diversity index; DM represents the Margalef richness index; J represents the Pielou evenness index; *: p < 0.05, **: p < 0.01, ***: p < 0.001.
Diversity 17 00556 g005
Figure 6. Correlation analysis of species diversity in different forest layers and phylogenetic diversity of dominant tree species in Jianfengling. Note: MAL denotes the middle arbor layer; SAL denotes the small arbor layer; LSL denotes the large shrub layer; MSL denotes the middle shrub layer. Note: *: p < 0.05, **: p < 0.01, ***: p < 0.001.
Diversity 17 00556 g006
Figure 7. The Mantel test of the diversity index of the community in Bawangling where Hopea hainanensis is located and environmental factors. Note: AL stands for altitude; SL stands for slope; SA stands for aspect; MAT stands for mean annual temperature; MAP stands for mean annual precipitation; SM stands for soil moisture; pH stands for acidity/alkalinity; SBD stands for soil bulk density; SOC stands for soil organic carbon; TP stands for total phosphorus; TN stands for total nitrogen; TK stands for total potassium; AP stands for available phosphorus; AK stands for available potassium; NRI(SAL) represents the net relatedness index of the small arbor layer; H(SAL) represents the Shannon–Wiener diversity index of the small arbor layer; DM(SAL) represents the Margalef richness index of the small arbor layer; PD(LSL) represents the phylogenetic diversity index of the large shrub layer; D(LSL) represents the Simpson diversity index of the large shrub layer; DM(LSL) represents the Margalef richness index of the large shrub layer; J(LSL) represents the Pielou evenness index of the large shrub layer; H(MSL) represents the Shannon–Wiener diversity index of the medium arbor layer; *: p < 0.05, **: p < 0.01, ***: p < 0.001.
Diversity 17 00556 g007
Figure 8. The Mantel test of the diversity index of the community in Jianfengling where Hopea hainanensis is located and environmental factors. Note: *: p < 0.05, **: p < 0.01, ***: p < 0.001.
Diversity 17 00556 g008
Table 1. Similarity indices of different forest layers.
Similarity IndexSIJaSISo
Forest Layer
Middle arbor layer0.100.18
Small arbor layer0.120.21
Large shrub layer0.130.23
Middle shrub layer0.090.17
Disclaimer/Publisher’s Note: The statements, opinions and data contained in all publications are solely those of the individual author(s) and contributor(s) and not of MDPI and/or the editor(s). MDPI and/or the editor(s) disclaim responsibility for any injury to people or property resulting from any ideas, methods, instructions or products referred to in the content.