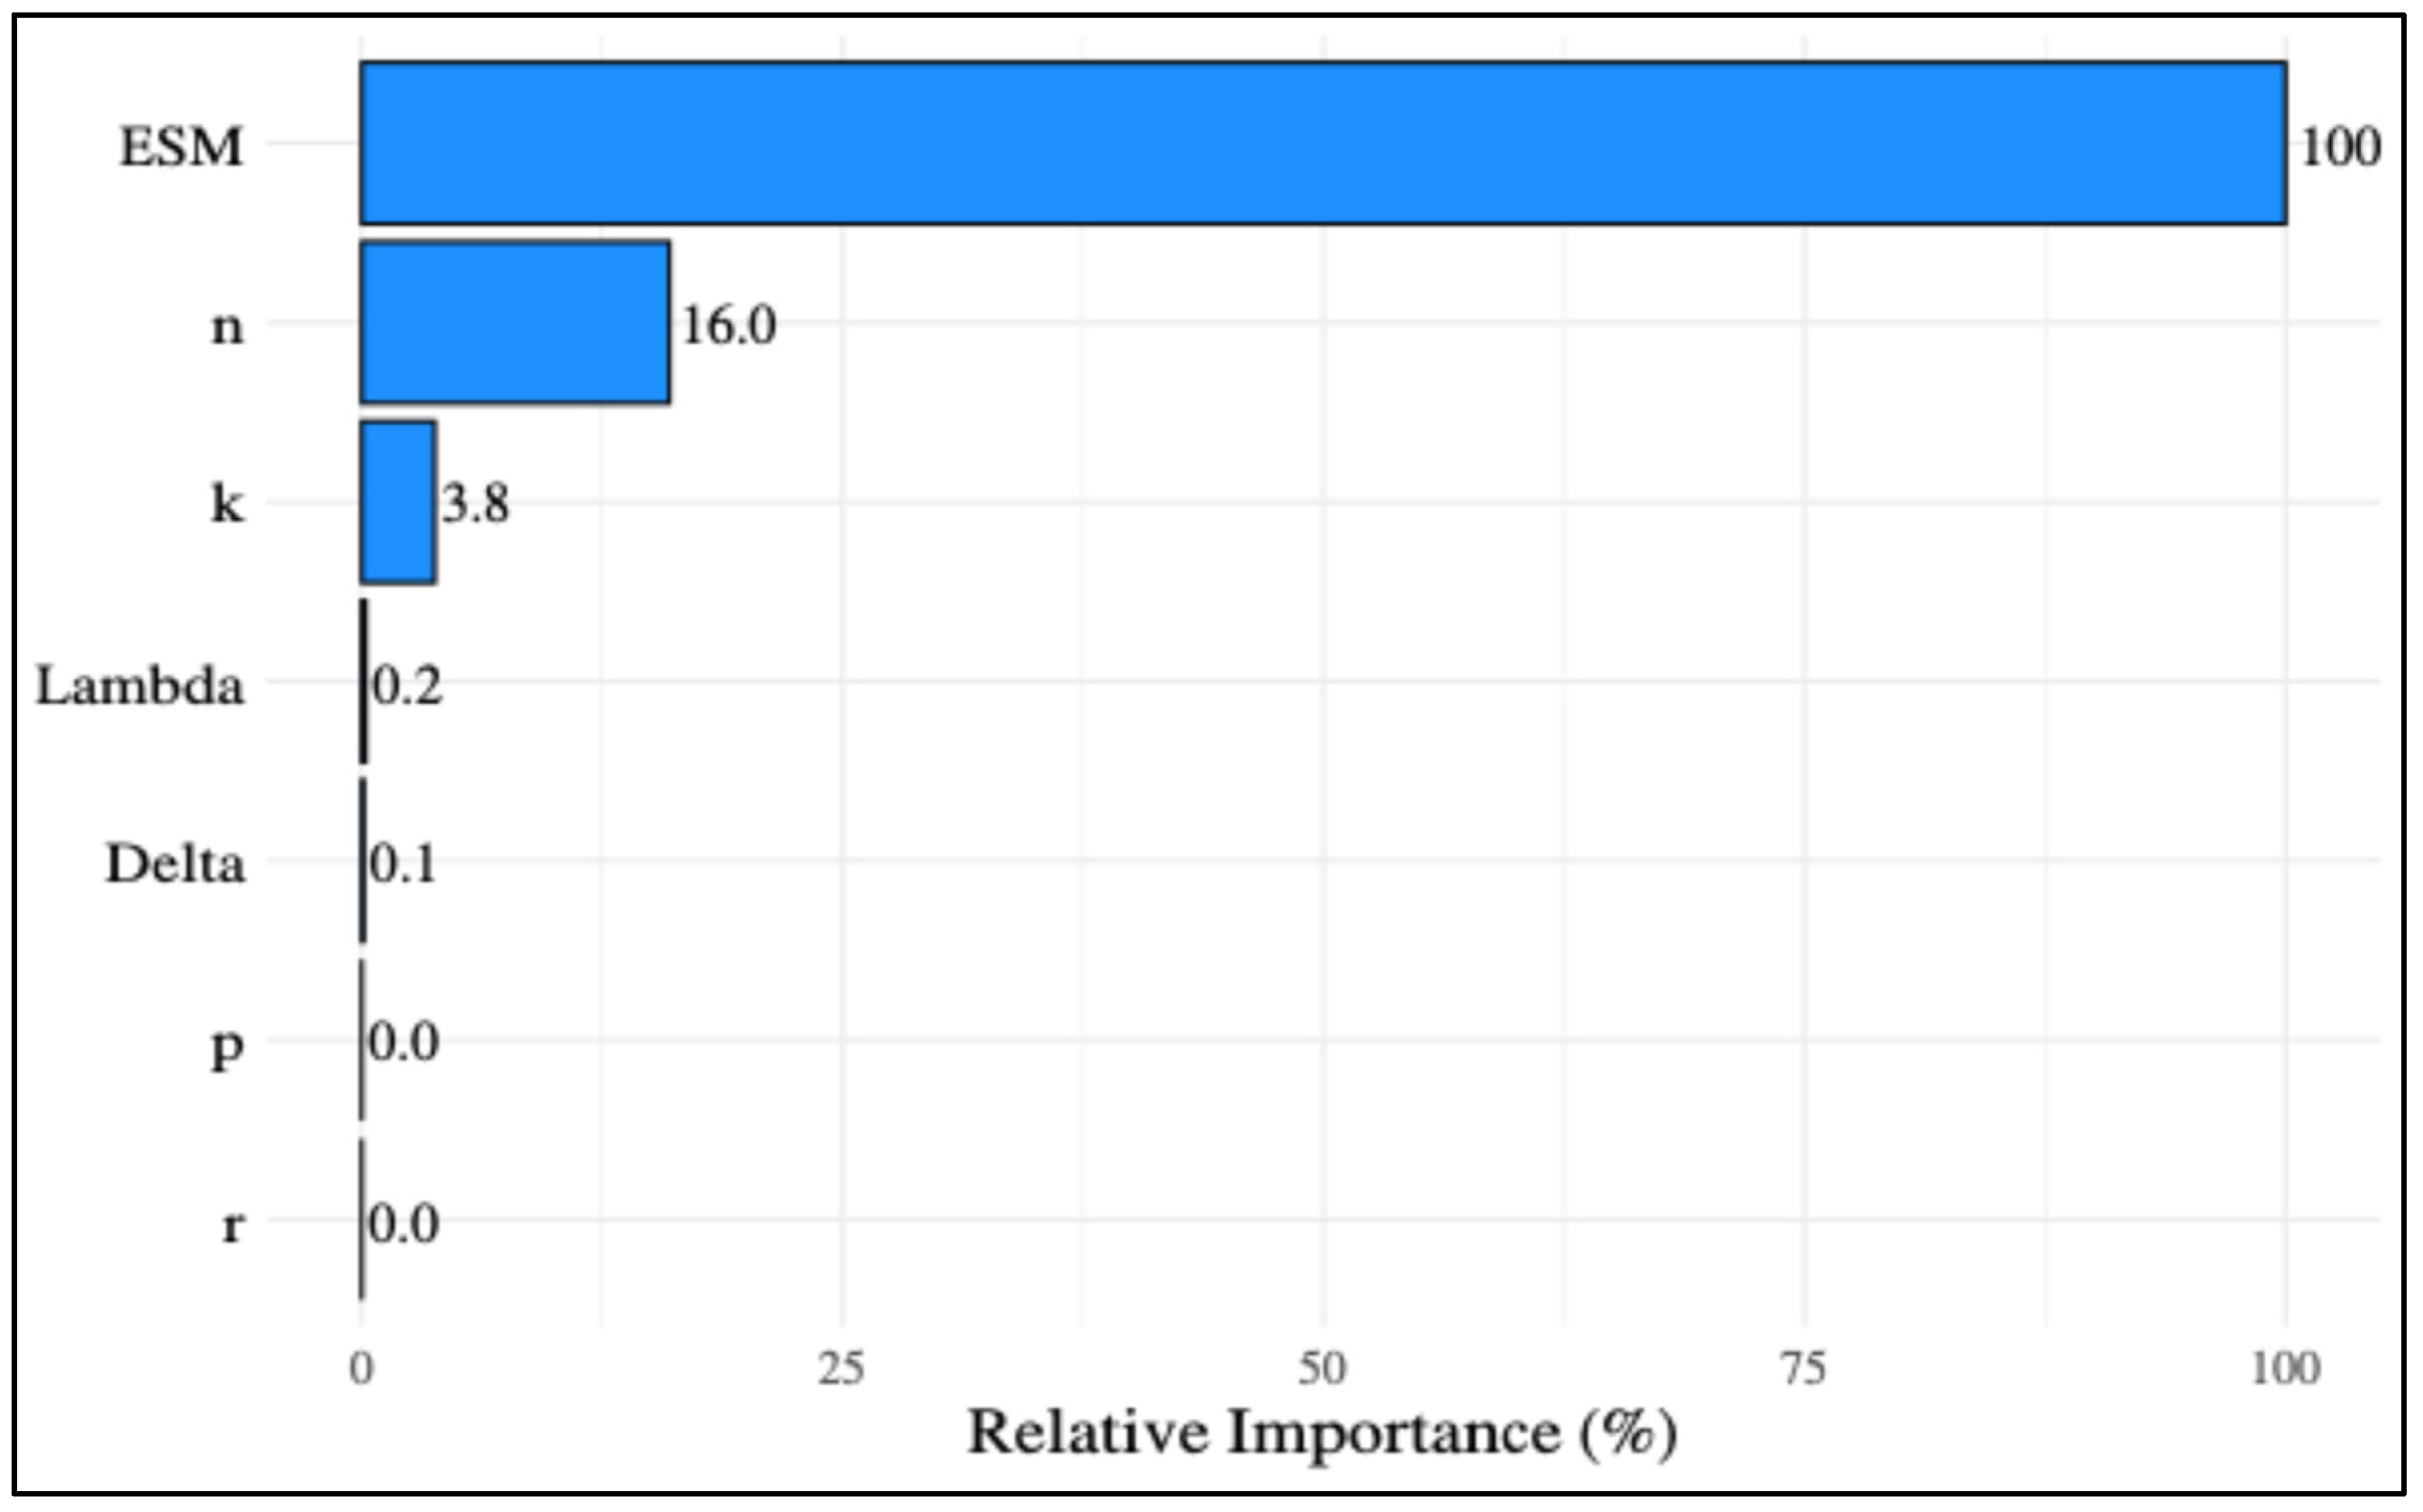
In general, the focus of this research is to investigate the sources of variation. With the widespread use of inferential statistics, the focus in evaluating study results has begun to shift. Results of scientific research have generally been evaluated on the basis of the
p-value. As a result, the belief has emerged that as the
p-value decreases, the results are considered more significant [
23]. However, the
p-value indicates the statistical significance of the difference observed between groups. In general, as the number of replications increases, even very small differences begin to become statistically significant, due to the principle that the sample will more accurately represent the population. The reverse is also true. Significant differences observed between groups may not be statistically significant, due to the small number of replications [
7,
8,
9]. To explain this situation more concretely, two different hypothetical examples are given in
Appendix A. In the first of these examples, three groups were compared with respect to three variables using PERMANOVA, with four replications for each group. As a result of the analysis, it was seen that the differences between the groups were statistically significant (
p = 0.012). However, differences between groups can explain 37.82% (
) of the total variation. As can be noted, although the differences between the groups are statistically significant, they can only explain one third of the total variation. In the other hypothetical example, three groups were compared with two replications in terms of four variables. As a result of PERMANOVA, it was seen that there was no statistically significant difference between the groups (
p = 0.067). On the other hand, it was determined that the statistically insignificant difference explained 73.54% of the total variation. This shows that there is a remarkable difference between the groups, but it is not statistically significant, due to the small number of replications. Therefore, evaluating results solely based on the
p-value may be misleading. It is essential to report effect size measures alongside the
p-value. Thus, reporting how much the differences between groups affect the total variation will eliminate contradictions and misunderstandings in the interpretation of the results [
8,
9,
10,
19,
24]. However, the effect size measure you report should not be affected by sample size or any other factor. Therefore, the most appropriate effect size measures that can be used need to be determined. In this study, the three most commonly used effect size measures in practice were compared with a detailed simulation study based on ecological data sets. However, the estimates obtained empirically as a result of simulation trials were evaluated not subjectively, but with an objective method such as a regression tree. As in almost all studies conducted for classical ANOVA, it was observed that
gave quite biased results [
8,
18,
19]. The bias of
gradually increased with the decrease in the number of replications. The shape of the distribution, effect size, number of variables, and correlation between variables generally did not affect the performance of effect size measures in any way. This situation is consistent with the results of other studies comparing effect sizes [
8,
18]. Regardless of the experimental conditions considered,
and
produced results that are quite unbiassed compared to
. Furthermore, the results of this study confirmed Glass and Hakstian [
25] who claimed that the difference between the predictions of
and
is negligible. On the other hand, this study draws attention to the fact that when evaluating ecological data sets, one should not only focus on the
p-value but also evaluate the share of the groups in the total variation. Therefore, it will contribute to making the results of ecological studies more understandable.


