Article

Mitogenomic Insights into Adaptive Evolution of African Ground Squirrels in Arid Environments

College of Life Sciences, Qufu Normal University, Qufu 273165, China
*
Author to whom correspondence should be addressed.
These authors contributed equally to this work.
Diversity 2025, 17(8), 538; https://doi.org/10.3390/d17080538 (registering DOI)
Submission received: 19 June 2025 / Revised: 27 July 2025 / Accepted: 28 July 2025 / Published: 31 July 2025
(This article belongs to the Section Animal Diversity)

Abstract

African ground squirrels (Xerus spp.), the inhabitants of African arid zones, face extreme heat and water scarcity driving selection for metabolic optimization. We assembled and annotated the first mitogenomes of Xerus inauris and Xerus rutilus (16,525–16,517 bp), revealing conserved vertebrate architecture with genus-specific traits. Key features include Xerus rutilus’s elongated ATP6 (680 vs. 605 bp), truncated ATP8ATP6 spacers (4 vs. 43 bp), and tRNA-Pro control regions with 78.1–78.3% AT content. Their nucleotide composition diverged from that of related sciurids, marked by reduced T (25.78–26.9%) and extreme GC skew (−0.361 to −0.376). Codon usage showed strong Arg-CGA bias (RSCU = 3.78–3.88) and species-specific elevations in Xerus rutilus’s UGC-Cys (RSCU = 1.83 vs. 1.17). Phylogenetics positioned Xerus as sister to Ratufa bicolor (Bayesian PP = 0.928; ML = 1.0), aligning with African biogeographic isolation. Critically, we identified significant signatures of positive selection in key mitochondrial genes linked to arid adaptation. Positive selection signals in ND4 (ω = 1.8 × background), ND1, and ATP6 (p < 0.0033) correspond to enhanced proton gradient efficiency and ATP synthesis–molecular adaptations likely crucial for optimizing energy metabolism under chronic water scarcity and thermoregulatory stress in desert environments. Distinct evolutionary rates were observed across mitochondrial genes and complexes: Genes encoding Complex I subunits (ND2, ND6) and Complex III (Cytb) exhibited accelerated evolution in arid-adapted lineages, while genes encoding Complex IV subunits (COXI) and Complex V (ATP8) remained highly conserved. These findings resolve the Xerus mitogenomic diversity, demonstrating adaptive plasticity balancing arid-energy optimization and historical diversification while filling critical genomic gaps for this xeric-adapted lineage.

1. Introduction

The family Sciuridae, recognized as one of the most morphologically and ecologically diverse groups within Rodentia, has long been a critical focus in mammalian systematics due to its taxonomic classification and evolutionary dynamics. Comprising approximately 300 extant species distributed globally across terrestrial ecosystems (excluding Antarctica and certain oceanic islands), this family is categorized into the major subfamilies—Callosciurinae (tree squirrels), Xerinae (ground squirrels), and Pteromyinae (flying squirrels)—based on cranial morphology, dentition characteristics, and ecological adaptations [1,2]. Squirrels play indispensable roles in ecological processes: Sciurus carolinensis (North American gray squirrel) significantly influences deciduous forest succession through acorn caching [3], while the burrow systems of African Xerus spp., evolved as critical behavioral adaptations to extreme aridity, provide essential microclimatic refuges that reduce evaporative water loss and thermoregulatory costs during diurnal heat extremes, thereby conserving metabolic energy resources under chronic water scarcity [4,5]. Notably, certain species exhibit extraordinary adaptations to extreme aridity; for instance, Xerus inauris (South African striped ground squirrel) completes its life cycle in the Namib Desert with annual precipitation below 200 mm, establishing it as an ideal model for studying mammalian arid adaptation mechanisms [6,7].
While traditional molecular studies have advanced our understanding of sciurid phylogeny, critical gaps persist in resolving evolutionary relationships among arid-adapted lineages such as Xerus [8]. This is exemplified by mitochondrial cytochrome b-based phylogenies revealing complex parallel evolution within the arid-adapted subfamily Xerinae [9]. Despite insights from diversification models [10,11], a key methodological limitation remains, i.e., the absence of family-wide phylogenomic reconstructions using complete mitogenomes—particularly for xeric-adapted clades—impedes precise inference of macroevolutionary patterns and the origin of arid-adaptive traits [12,13].
In arid adaptation research, physiological ecologists have documented phenotypic evidence: sciurids achieve water efficiency via urine concentration and reduced basal metabolic rates, coupled with seasonal torpor strategies, to survive arid phases in grasslands [14]. Research across diverse arid-adapted mammals underscores the multifaceted nature of this challenge. Studies on desert rodents have identified adaptations ranging from behavioral strategies to molecular modifications in both nuclear and mitochondrial genes [15,16,17]. For example, molecular adaptations in mitochondrial Complex I genes enhancing oxidative phosphorylation efficiency [6,18,19] reflect conserved mechanisms for metabolic optimization under water scarcity, though their functional integration requires nuclear–mitochondrial coevolution [20,21]. Similarly, investigations in other taxa, such as camelids (Camelus dromedarius), have revealed coordinated changes in nuclear-encoded enzymes involved in metabolic pathways crucial for water and energy conservation [22]. Our approach leverages the mitogenome’s properties to detect lineage-specific adaptive evolution, particularly targeting genes under positive selection that optimize mitochondrial function—such as proton translocation efficiency and ATP synthesis—under the extreme energetic constraints imposed by aridity and heat stress. These findings highlight the potential advantages of mitogenomes for studying aspects of arid adaptation—mitochondrial genes directly encode core components of the electron transport chain, making them potentially sensitive to selective pressures related to energy metabolism under water scarcity. However, it is crucial to emphasize that mitochondrial function itself is profoundly shaped by the nuclear genome, which encodes most mitochondrial proteins and regulates their biogenesis, dynamics, and metabolic integration [20]. Complex physiological adaptations, such as those enabling survival in arid environments, inherently involve co-adapted interactions between nuclear and mitochondrial genomes over evolutionary time [23]. Therefore, while acknowledging the essential role of nuclear–mitochondrial coevolution, our analysis specifically targets the mitochondrial genome as a sensitive indicator of selective pressures acting on the core machinery of cellular energy production—a system under intense optimization pressure in arid-adapted mammals like Xerus. Additionally, the maternal inheritance and lack of recombination of mitogenomes simplify the detection of lineage-specific adaptive signatures [24], while their high mutation rate allows for the identification of recent selective sweeps associated with rapid environmental changes [25]. Therefore, while mitochondrial genome evolution, as a central regulator of cellular energetics, may reflect important facets of adaptation to energetic constraints in arid habitats, it represents only one component within a broader co-evolutionary framework governed primarily by the nuclear genome. Although mitochondrial markers have been used to resolve partial sciurid phylogenies [12], no study has systematically explored the nexus between mitogenomic adaptive evolution and arid ecological specialization within this integrated context.
Mitogenomes, characterized by maternal inheritance, conserved gene content, and elevated evolutionary rates, serve as powerful tools for deciphering species’ evolutionary histories and adaptive mechanisms [26]. Nevertheless, current research predominantly targets single species or specific genes, lacking systematic comparisons of selection pressures between arid-adapted and non-adapted clades within robust phylogenetic contexts. Few studies integrate multidimensional evidence—such as structural variations and codon usage bias—to dissect the molecular basis of adaptive evolution.
This study establishes the first integrative framework to resolve mitogenomic adaptations underlying extreme arid specialization in sciurids. By contrasting arid-adapted Xerus with non-adapted clades, we aim to decode evolutionary innovations for heat/water scarcity challenges through three primary objectives: (1) reconstructing a robust mitogenome-based phylogeny of Sciuridae, (2) identifying molecular signatures of positive selection associated with arid adaptation, (3) characterizing structural and functional implications of these adaptations.

2. Materials and Methods

2.1. Mitogenome Assembly and Structural Characterization

Based on the raw data of Xerus genome sequencing (X. inauris, SRX4562114 and X. rutilus, SRX12373276) that we obtained from the NCBI database, we assembled the two new complete mitochondrial genomes using NovoPlasty v4.3.1 [27,28] with a k-mer length of 39 and three iterative rounds to ensure circular genome integrity. Annotation was conducted via the MITOS2 web server [29], employing the Vertebrate Mitochondrial Code for automated identification of open reading frames and tRNAs, followed by manual calibration of gene boundaries through alignment with annotations from closely related species. Genome circular maps were generated using OGDRAW v1.3.1 [30], with visualization optimized by adjusting gene color codes, GC content gradients, and noncoding region highlights. Structural features—including gene order, overlapping regions, and intergenic spacers—were statistically analyzed using custom R v4.2.1 scripts incorporating the ape, ggplot2, and tidyverse packages to quantify gene length, GC skew, and noncoding region variation across all 28 mitogenomes. The two mitogenomes (X. inauris and X. rutilus) were deposited in Supplementary Materials File S1.
All 28 mitogenomes analyzed in this study (Table 1) represent 28 sciurid species, including 12 arid-adapted and 16 non-arid species based on habitat classification. This classification into Arid and Non-Arid groups was explicitly designed to enable comparative analyses of mitogenomic evolution associated with adaptation to water scarcity. The Arid group (annual precipitation < 500 mm) primarily inhabits deserts and grasslands, while the Non-Arid group (>1000 mm) occupies forests and wetlands, based on WorldClim [31], IUCN Red List [32], and GBIF distribution data [33].
The mitochondrial genome accession numbers of Xerus are presented in Table 1. The composition skew values were calculated according to the following formulas: AT skew [(A − T)/(A + T)] and GC skew [(G − C)/(G + C)].

2.2. Relative Synonymous Codon Usage (RSCU)

For the codon usage bias analysis, all protein-coding genes (PCGs) from the 28 mitogenomes were extracted. The frequency of synonymous codons for each species’ 13 PCGs was calculated using the seqinr package in R v4.2.1 [34]. RSCU values were computed using the standard formula:
R S C U i j = X i j 1 n j Σ X y ¨
where Xij represents the occurrence count of the j-th codon for the i-th amino acid, and nj denotes the total number of synonymous codons for that amino acid [35]. The codon usage patterns were visualized via the ggplot2 to highlight group-specific features. Patterns potentially linked to functional adaptations, such as those relevant to energy metabolism or oxidative stress response in arid environments, were specifically examined.

2.3. Phylogenetic Reconstruction

The phylogenetic reconstruction was based on concatenated sequences of 13 mitochondrial PCGs from all 28 mitogenomes. Each gene was aligned using MAFFT v7.526 [36], followed by quality filtration with Gblocks v0.91b [37] under default parameters to remove poorly aligned regions; gaps were treated as missing data. Maximum likelihood (ML) analysis was performed in IQ-TREE v2.2.0 [38] under the optimal nucleotide substitution model (GTR+F+I+G4) selected by ModelFinder. Node support was assessed using 1000 ultrafast bootstrap replicates. Bayesian inference (BI) was implemented in MrBayes v3.2 with two independent Markov chain Monte Carlo (MCMC) chains, each run for 1 × 10⁷ generations, sampled every 1000 generations [39]. This robust phylogeny served as the essential framework for subsequent analyses of lineage-specific adaptive evolution, particularly positive selection associated with arid adaptation.

2.4. Positive Selection Analysis

The positive selection analysis was conducted using the codeml module in PAML v4.9 [40]. Branch models were employed to detect evolutionary patterns specifically associated with arid adaptation, with the phylogenetic tree as the framework. Species inhabiting arid environments were defined as foreground branches (Table 1, Arid group), while others served as background branches. A null model (Model 0, global single ω ratio) and an alternative model (allowing independent ω ratios for foreground branches) were compared via likelihood ratio tests (LRTs) to identify positive selection signals (significance threshold: p < 0.05). This approach specifically tests for accelerated evolution (dN/dS > 1) indicative of positive selection on the arid-adapted branches. To further resolve branch-specific selection pressures, a free-ratio model was implemented, permitting independent dN/dS (ω) values for each branch. Significantly positively selected sites were identified using Bayesian empirical Bayes (BEB) methods (posterior probability > 95%). All analyses employed the F3×4 codon frequency model, with initial parameters guided by neighbor-joining trees. MCMC chains were run three times to ensure stability, and computational reliability was verified using CodeML’s default convergence criteria (log-likelihood difference < 0.01). The primary goal of this analysis was to identify mitochondrial genes under positive selection that contribute to the adaptation of Xerus and other arid-adapted sciurids to their challenging environments.

3. Results

3.1. Mitochondrial Genome Annotation

The mitochondrial genomes of two ground squirrels (X. inauris and X. rutilus) exhibited typical vertebrate structures, with lengths of 16,525 bp and 16,517 bp, respectively (Figure 1). Both genomes contained 37 genes, including 13 protein-coding genes (PCGs), 22 tRNA genes, and 2 rRNA genes. The mitochondrial genomes of two ground squirrels exhibited typical vertebrate structures (Figure 1), with conserved gene content but some length variations in protein-coding genes. ATP6 showed a 75 bp extension in X. rutilus compared to X. inauris (680 vs. 605 bp), potentially influencing proton transport efficiency under arid stress. Start and stop codon usage showed conserved patterns with some exceptions (Table 2). While most genes used ATG as the start codon, ND3 and ND6 employed alternative initiation codons (ATT and AGA, respectively). Stop codon usage was more variable, with COXI exhibiting species-specific termination signals and ND6 consistently using incomplete stop codons. Intergenic regions also displayed notable length variations between species, particularly in the ATP8ATP6 spacer and ND4LND4 overlap regions. Nucleotide composition exhibited distinct AT-rich patterns, with the tRNA-Pro control region showing exceptionally high AT content (78.1% in X. inauris; 78.3% in X. rutilus), significantly exceeding the genomic average (~65%) (Table 2), potentially stabilizing replication under the high-temperature regimes of their arid habitats.
Both species exhibited distinct nucleotide composition patterns relative to other sciurids. While their adenine content was consistent with related species, thymine content was notably reduced, resulting in elevated AT skew values that surpassed most relatives. The guanine–cytosine composition showed particularly pronounced guanine depletion, with cytosine content exceeding typical sciurid ranges and producing strongly negative GC skew. These patterns contrasted with the more moderate skew values observed in Callosciurus and Cynomys, underscoring the unique nucleotide bias characteristic of the Xerus species (Table 1). This distinct genomic signature may reflect selective pressures related to DNA stability or replication efficiency in their extreme environment.

3.2. Relative Synonymous Codon Usage (RSCU)

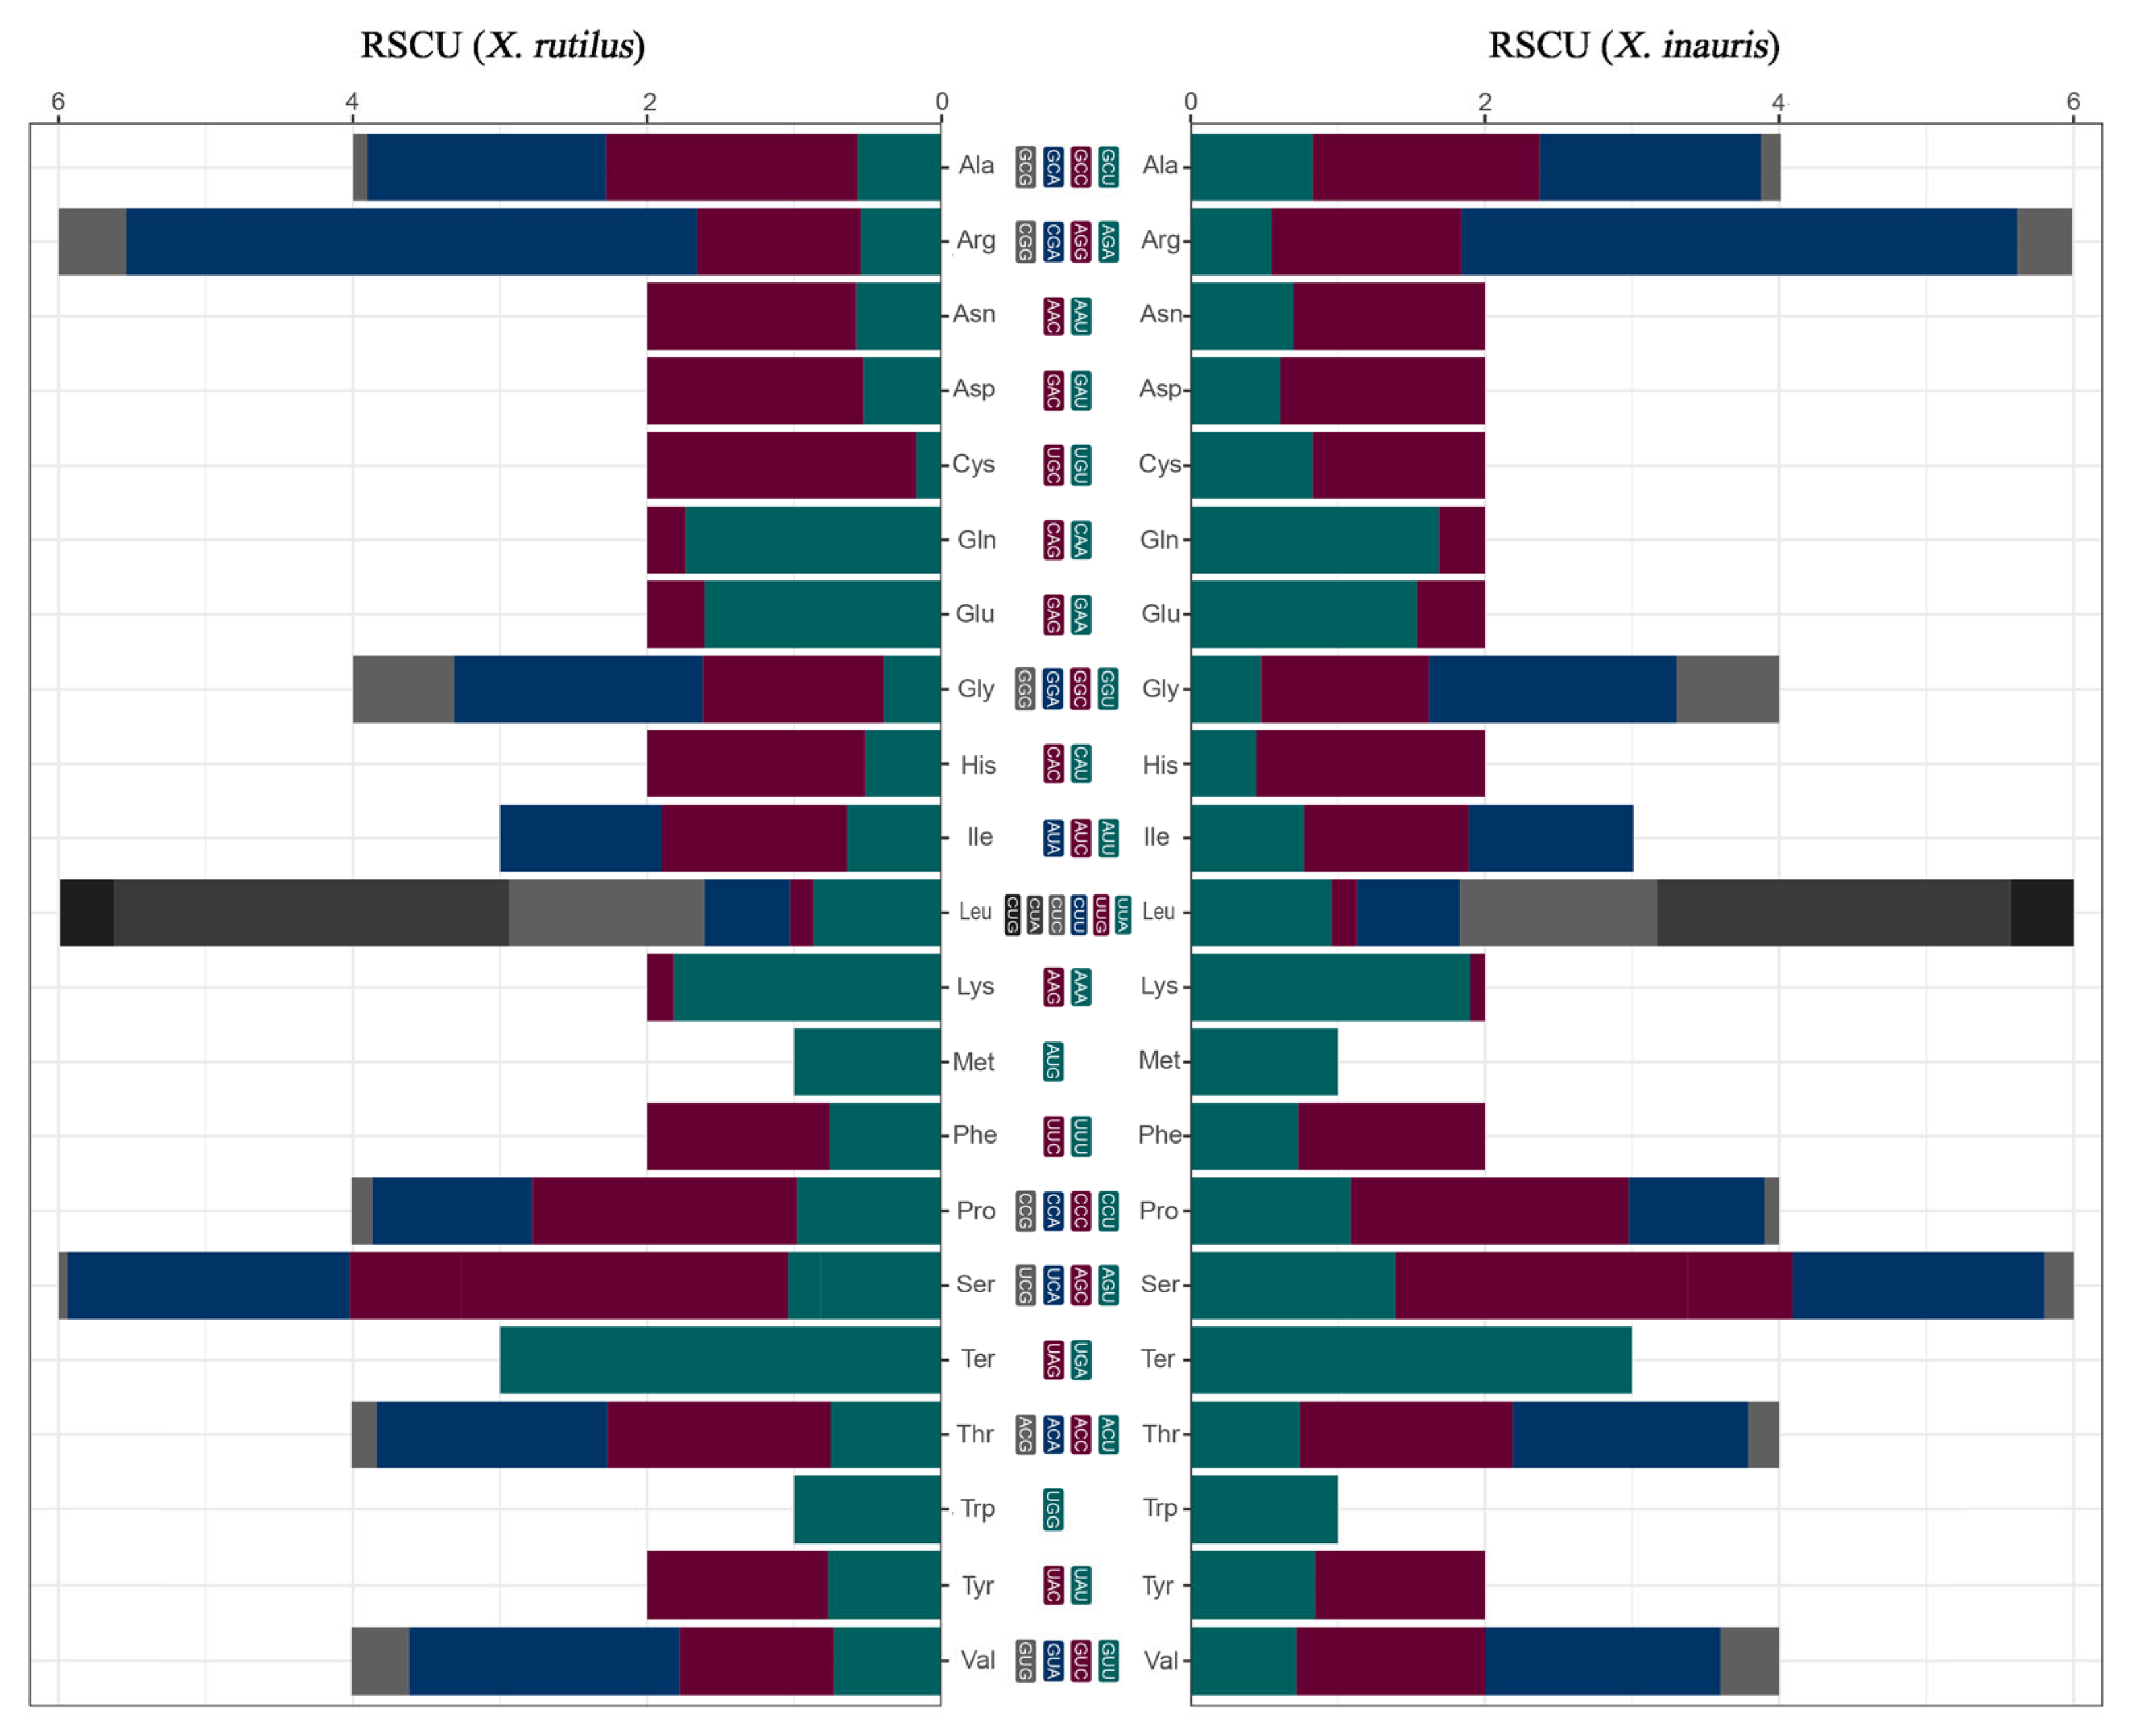
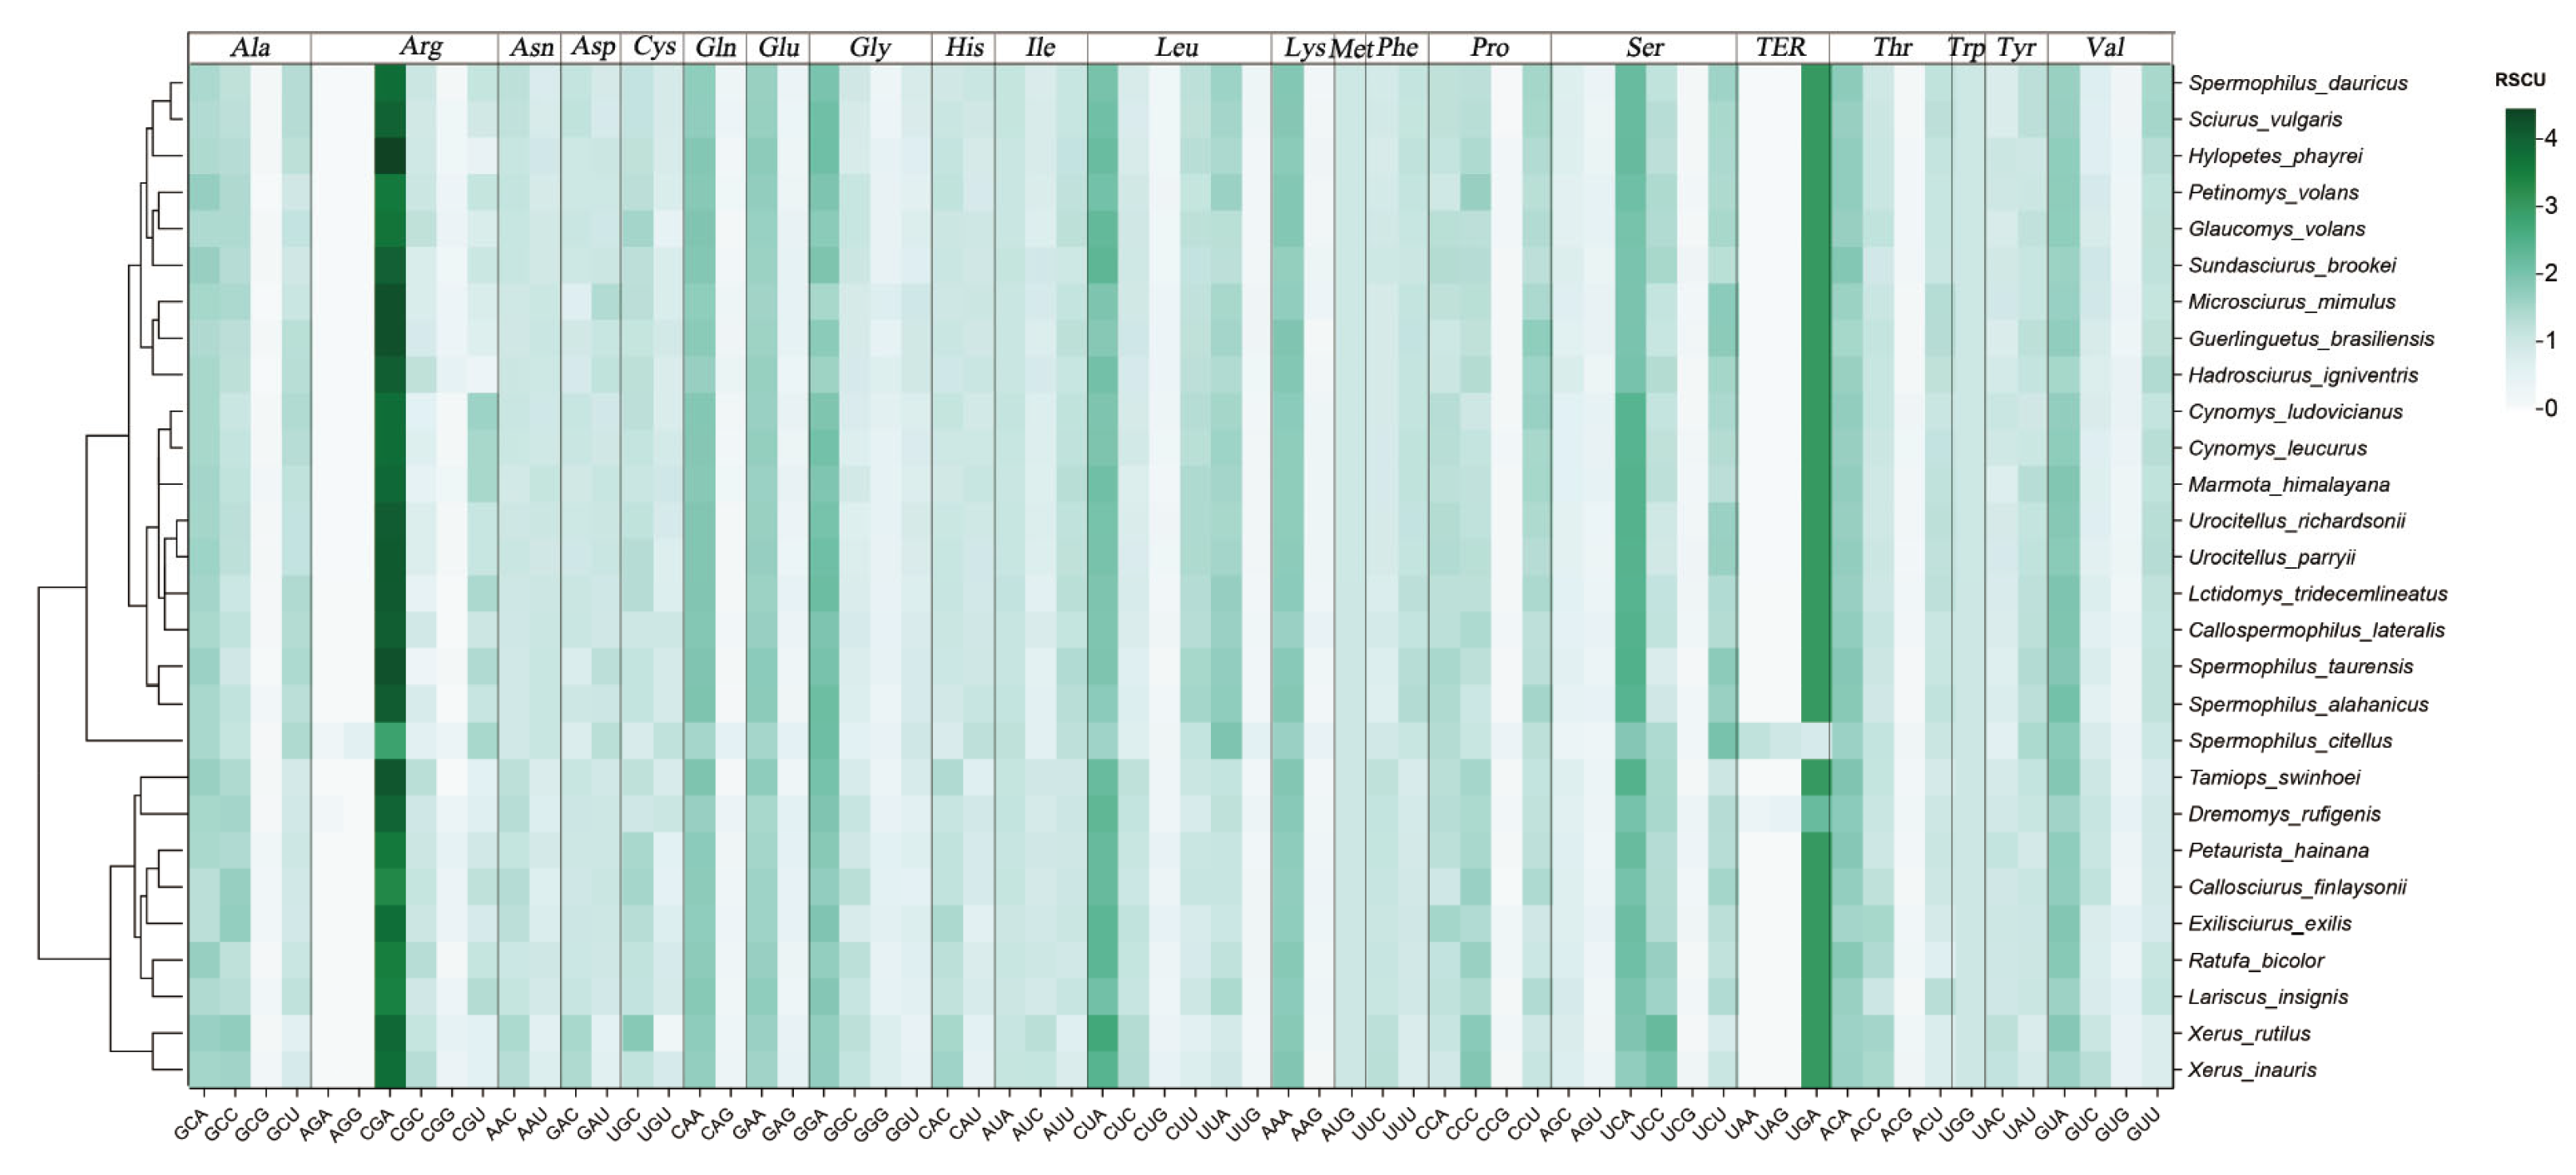
The RSCU analysis demonstrated both conserved and species-specific codon usage patterns. Both species exhibited strong preferences for certain codons (Arg-CGA, Leu-CUA) while completely avoiding others (Arg-AGA/AGG), with UGA exclusively serving as the stop codon (Figure 2). The comparative analysis of arid-adapted squirrel species and non-arid-adapted squirrel species revealed that the AGA/AGG avoidance phenomenon (p = 0.008) and the UGA termination advantage (p < 0.01) are common adaptive characteristics in species groups adapted to arid environments, while the unique UGC (cysteine) usage rate in X. rutilus (relative significance coefficient RSCU = 1.83) is significantly higher than that of other arid-adapted species (1.14–1.31; p = 0.003) (Figure 3). Interspecific variations were observed in cysteine and serine codon usage, while glutamine and lysine displayed bimodal distributions. Notably, proline and threonine codon preferences showed species-specific differences, which may represent fine-tuned adaptations in osmoregulation (proline) and protein-mediated energy homeostasis (threonine) under distinct ecological pressures associated with their arid niches (Figure 2).

3.3. Phylogenetic Reconstruction

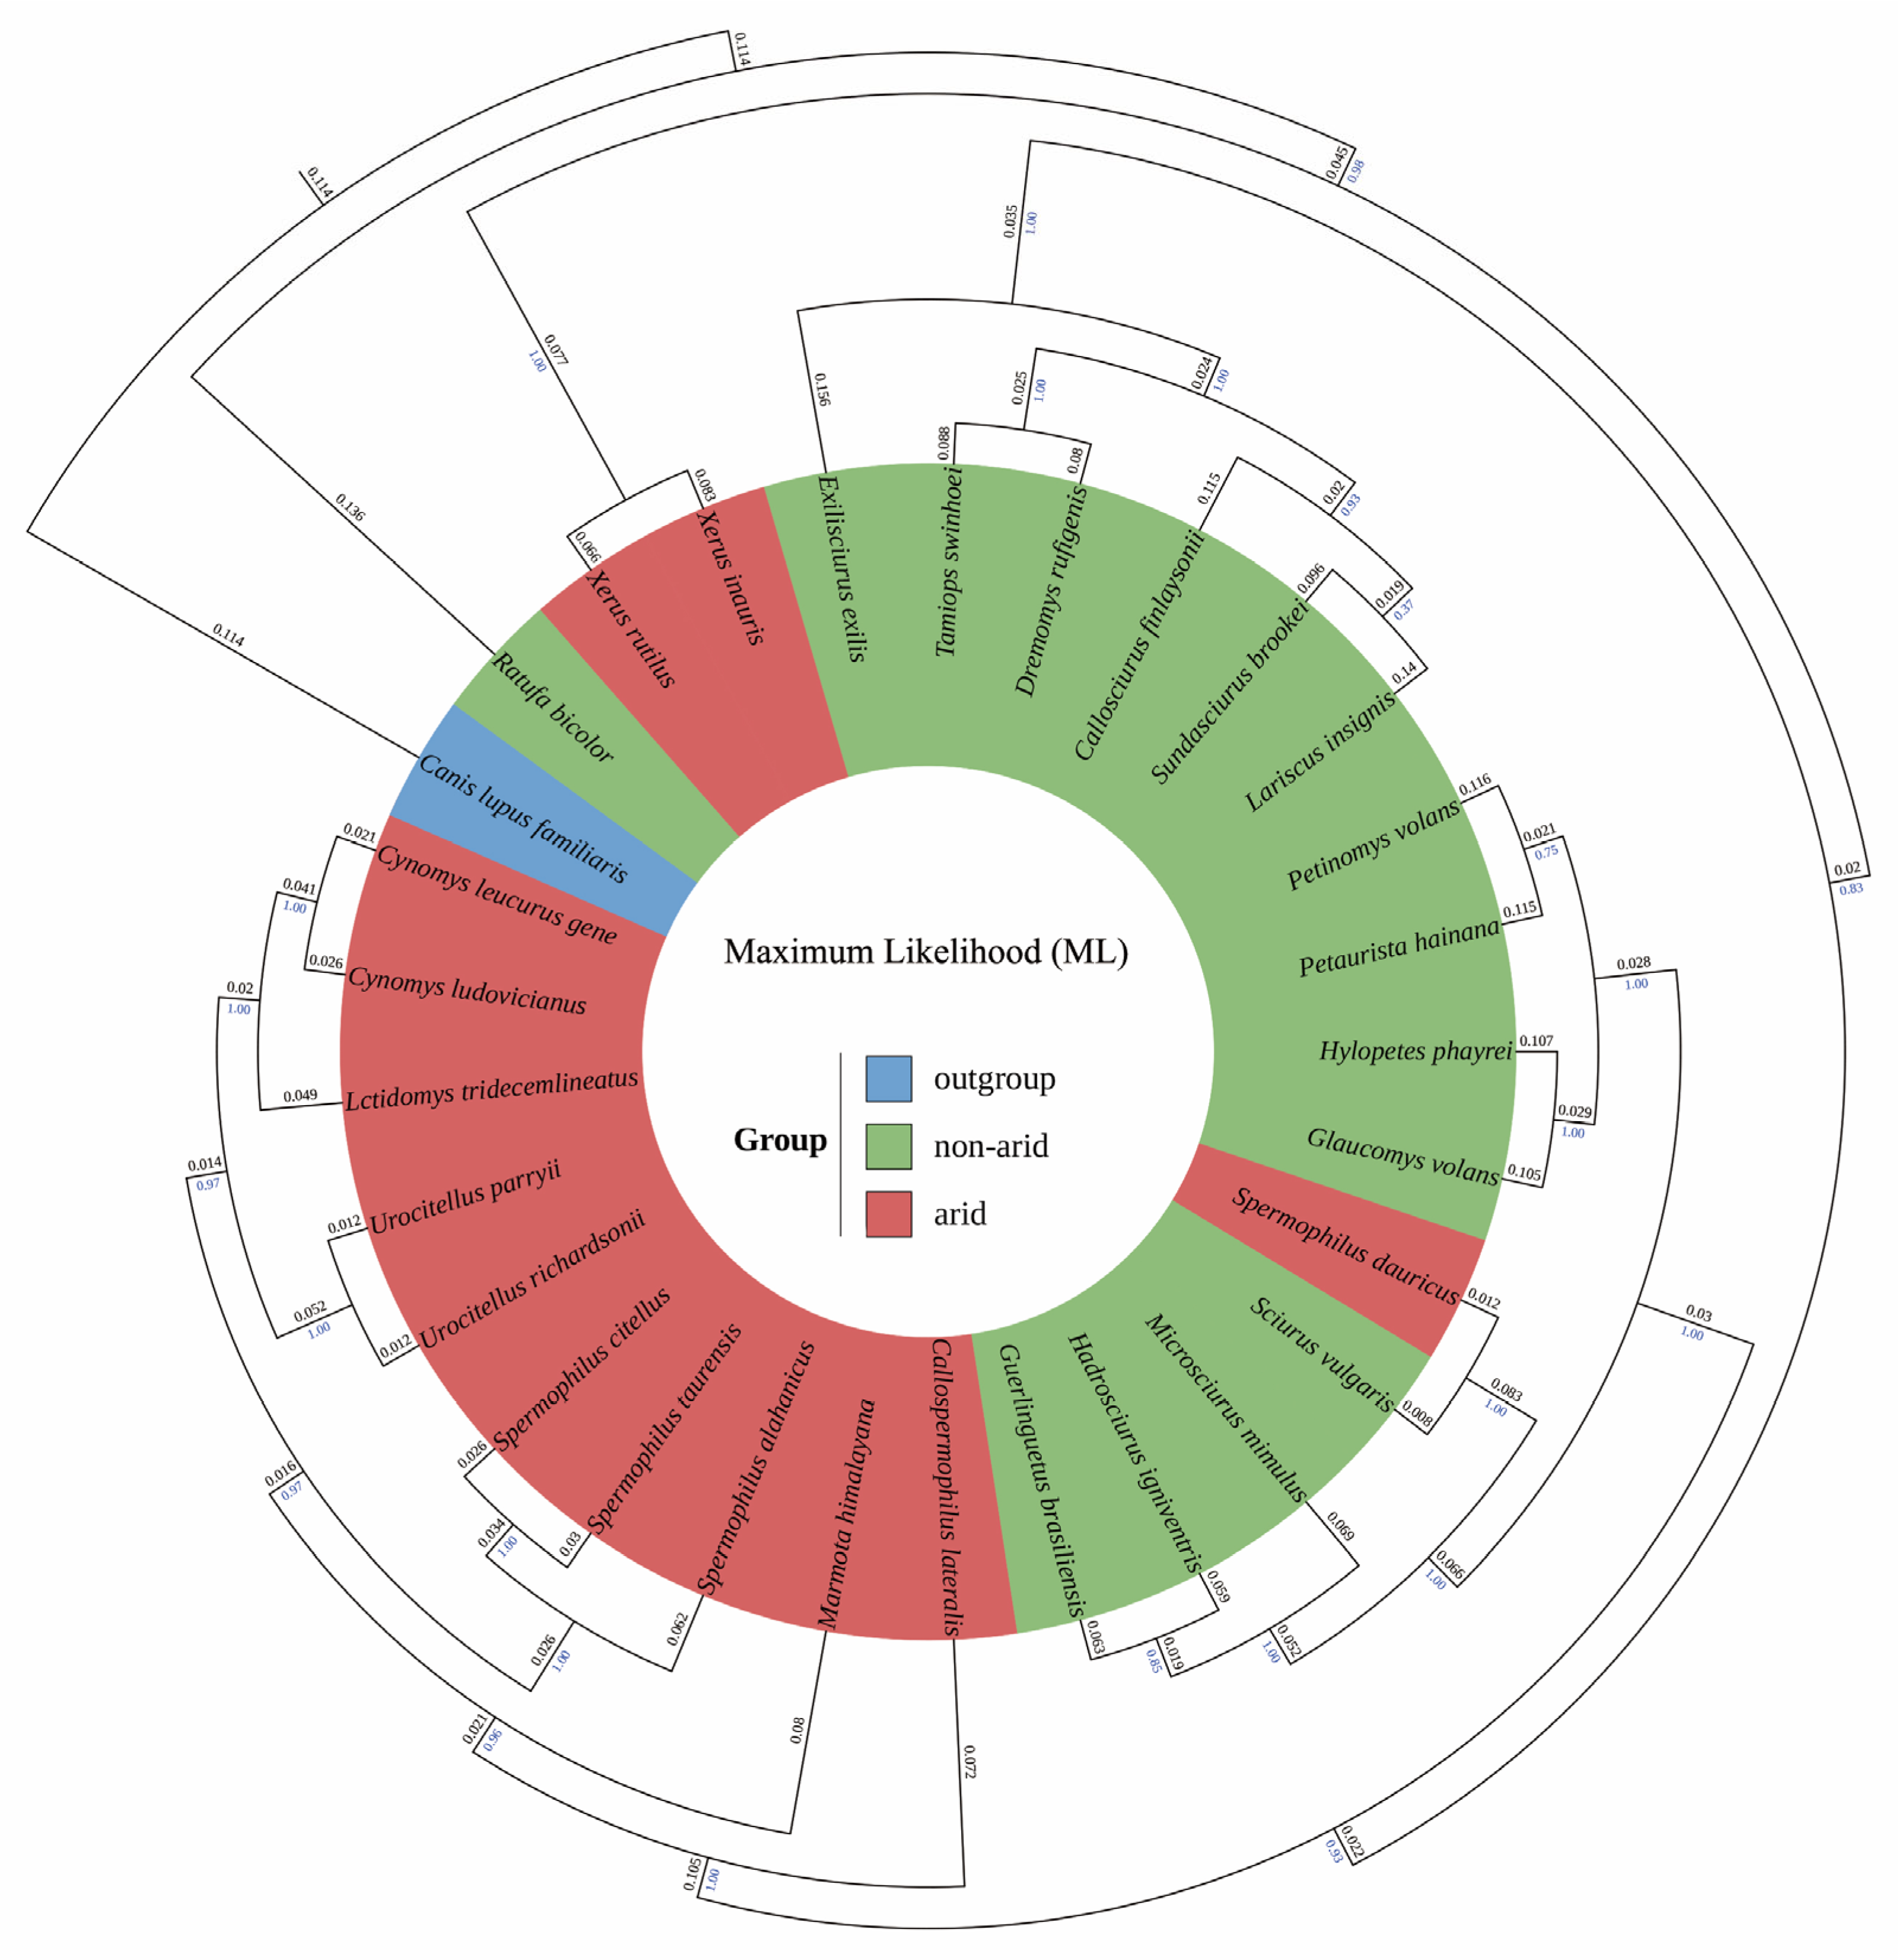
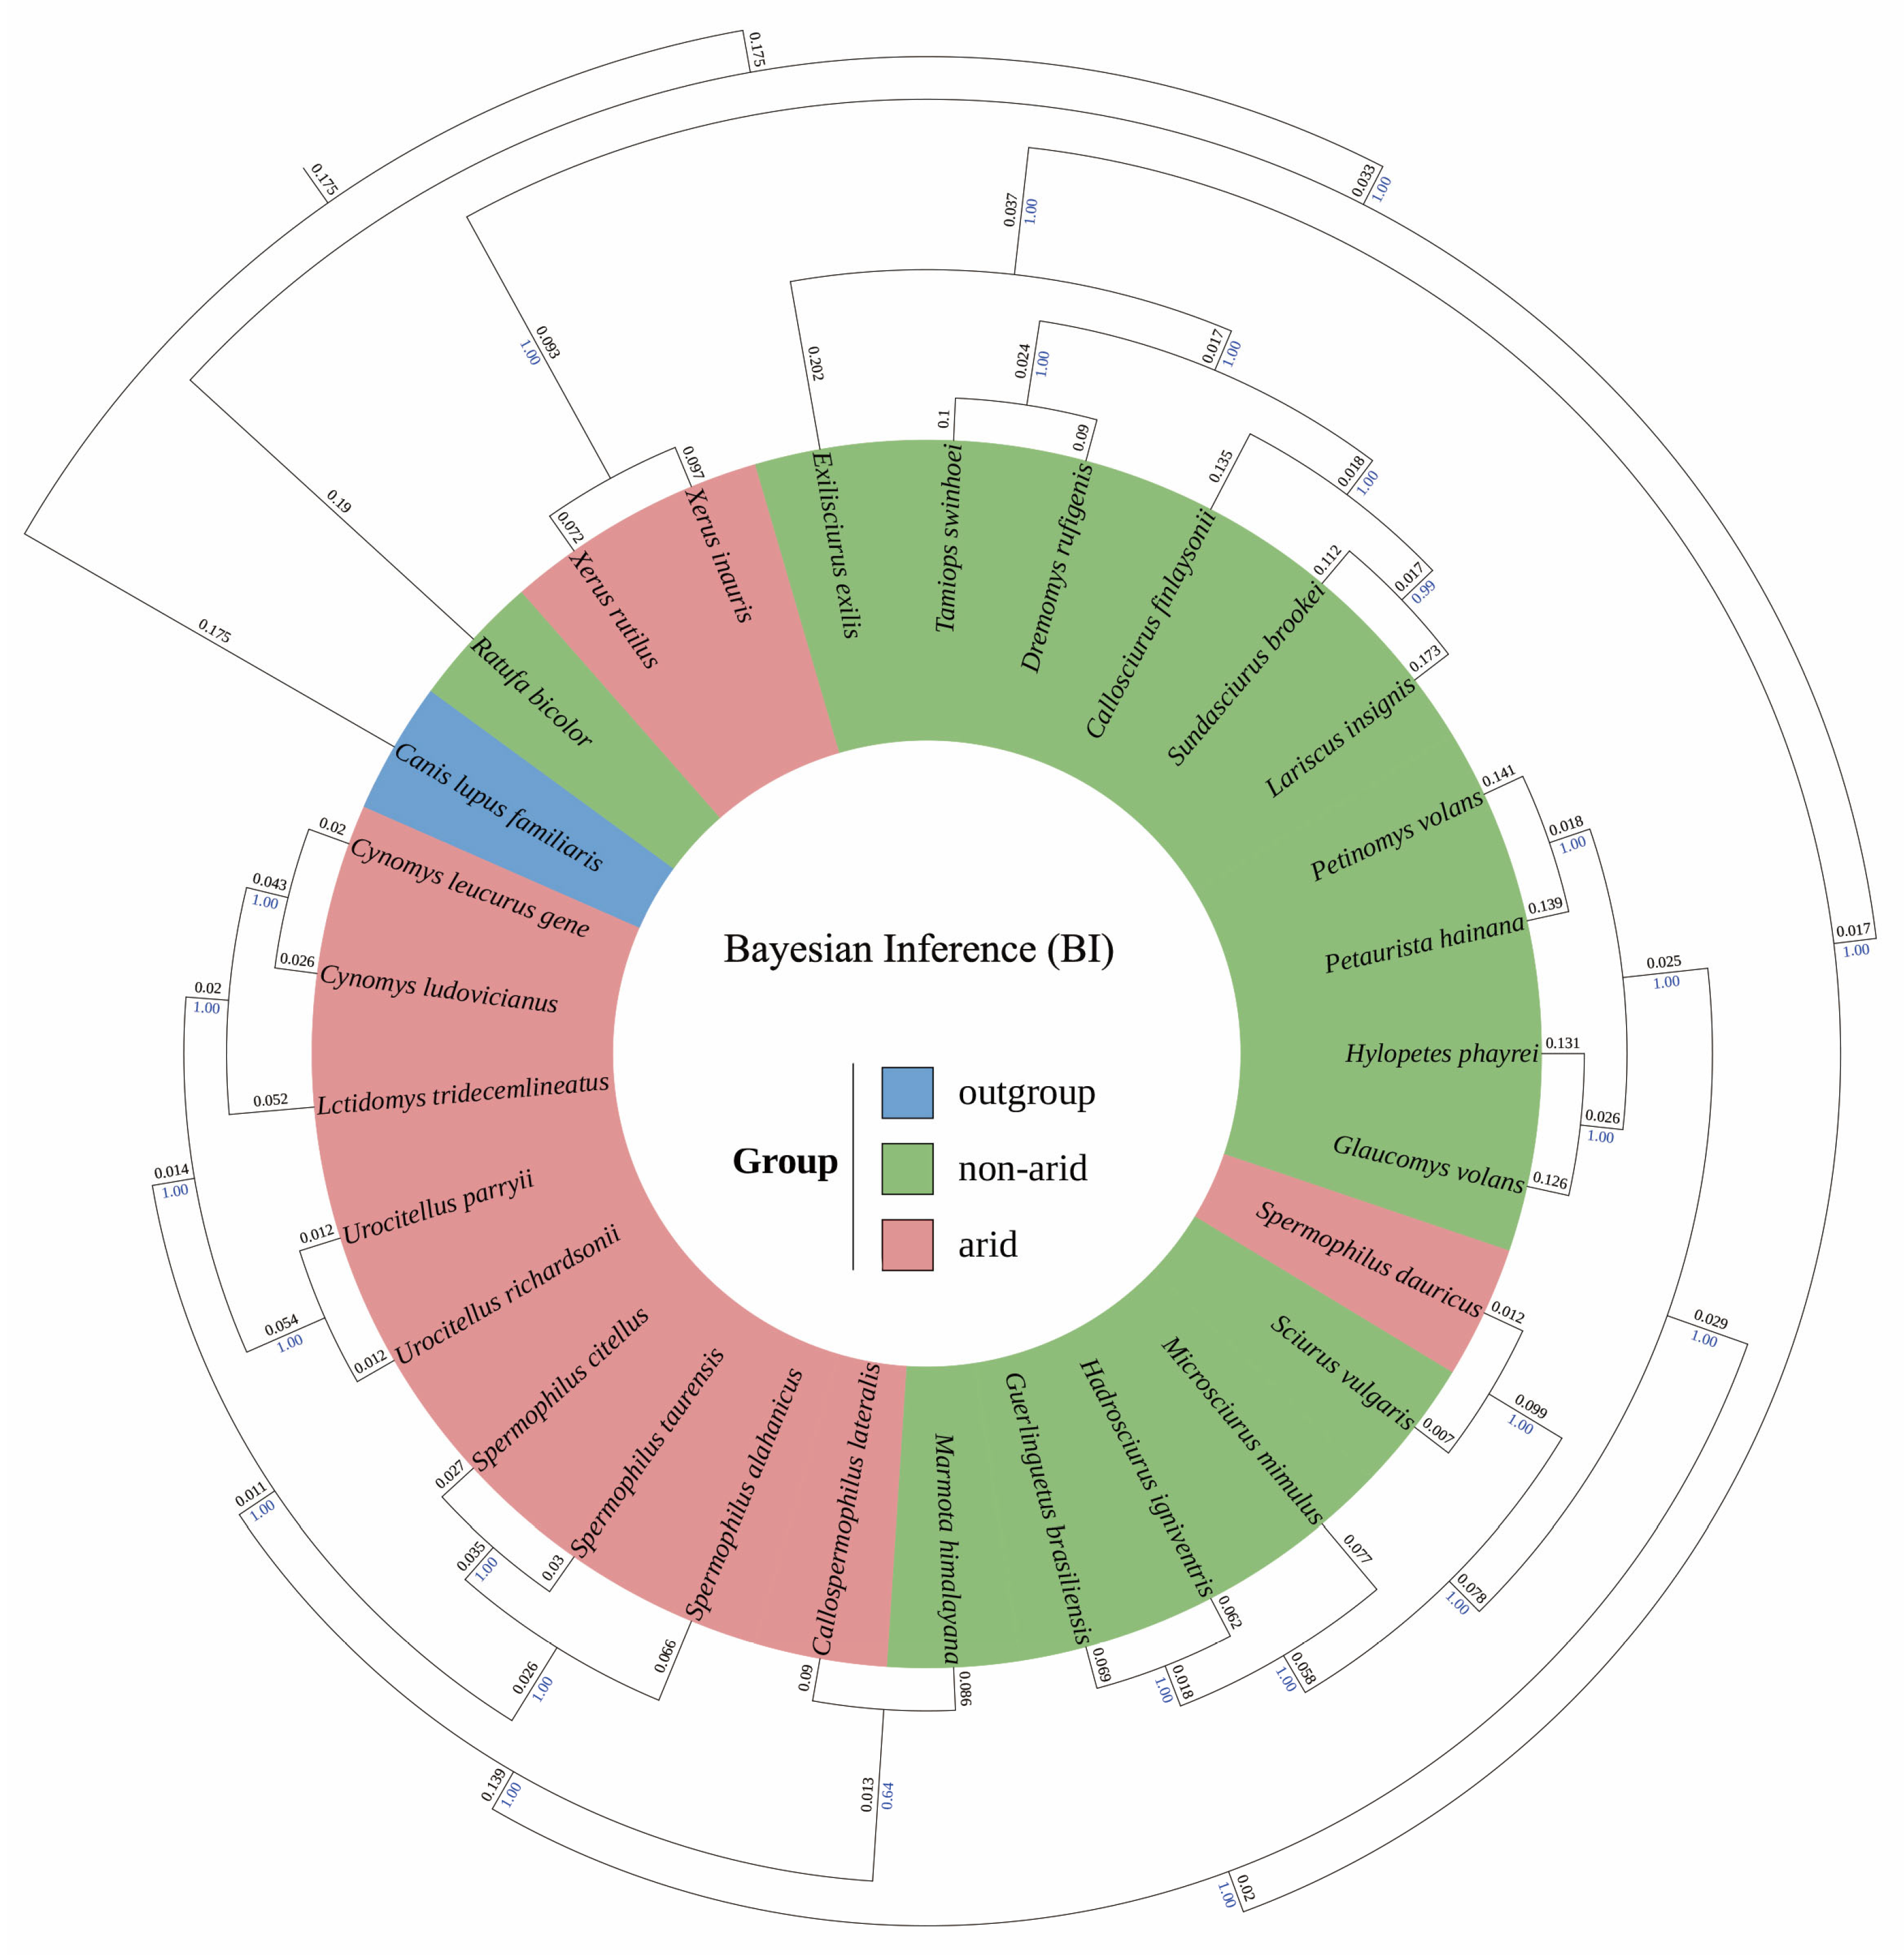
The maximum likelihood (ML, Figure 4) and Bayesian inference (BI, Figure 5) analyses revealed highly concordant topologies with strong nodal support across most clades. Both methods robustly supported the monophylicity of Xerus (Bayesian posterior probability, PP = 1.0; maximum likelihood bootstrap support, BS = 1.0), with branch lengths (substitutions per site) to X. inauris and X. rutilus of 0.097 and 0.072 (BI) and 0.083 and 0.066 (ML), respectively. The analyses placed Xerus as sister to a clade containing Canis lupus familiaris and Ratufa bicolor with moderate support (Bayesian posterior probability, PP = 0.829; maximum likelihood bootstrap support, BS = 0.829). Within sciurids, North American ground squirrels formed a cohesive radiation: Cynomys species diverged at branch lengths of 0.020–0.026 (BI) and 0.021–0.026 (ML) substitutions per site, while Urocitellus species showed recent divergence (BI: 0.0117–0.0118 substitutions per site; ML: 0.0119–0.0120 substitutions per site). Notably, both methods consistently resolved Sciurus vulgaris and Spermophilus dauricus as sister taxa with maximum support (Bayesian posterior probability, PP = 1.0; maximum likelihood bootstrap support, BS = 1.0). Divergence events associated with Beringian migrations were evident in Callospermophilus lateralis (BI: 0.090 substitutions per site; ML: 0.072 substitutions per site) and Marmota himalayana (BI: 0.086 substitutions per site; ML: 0.080 substitutions per site), while Sunda Shelf dynamics influenced Southeast Asian radiations (Exilisciurus exilis: BI 0.202 substitutions per site; ML 0.157 substitutions per site). This congruent phylogenetic framework provides robust evolutionary context for identifying lineage-specific adaptations (Exilisciurus exilis: BI 0.202; ML 0.157).

3.4. Selection Pressure Analysis

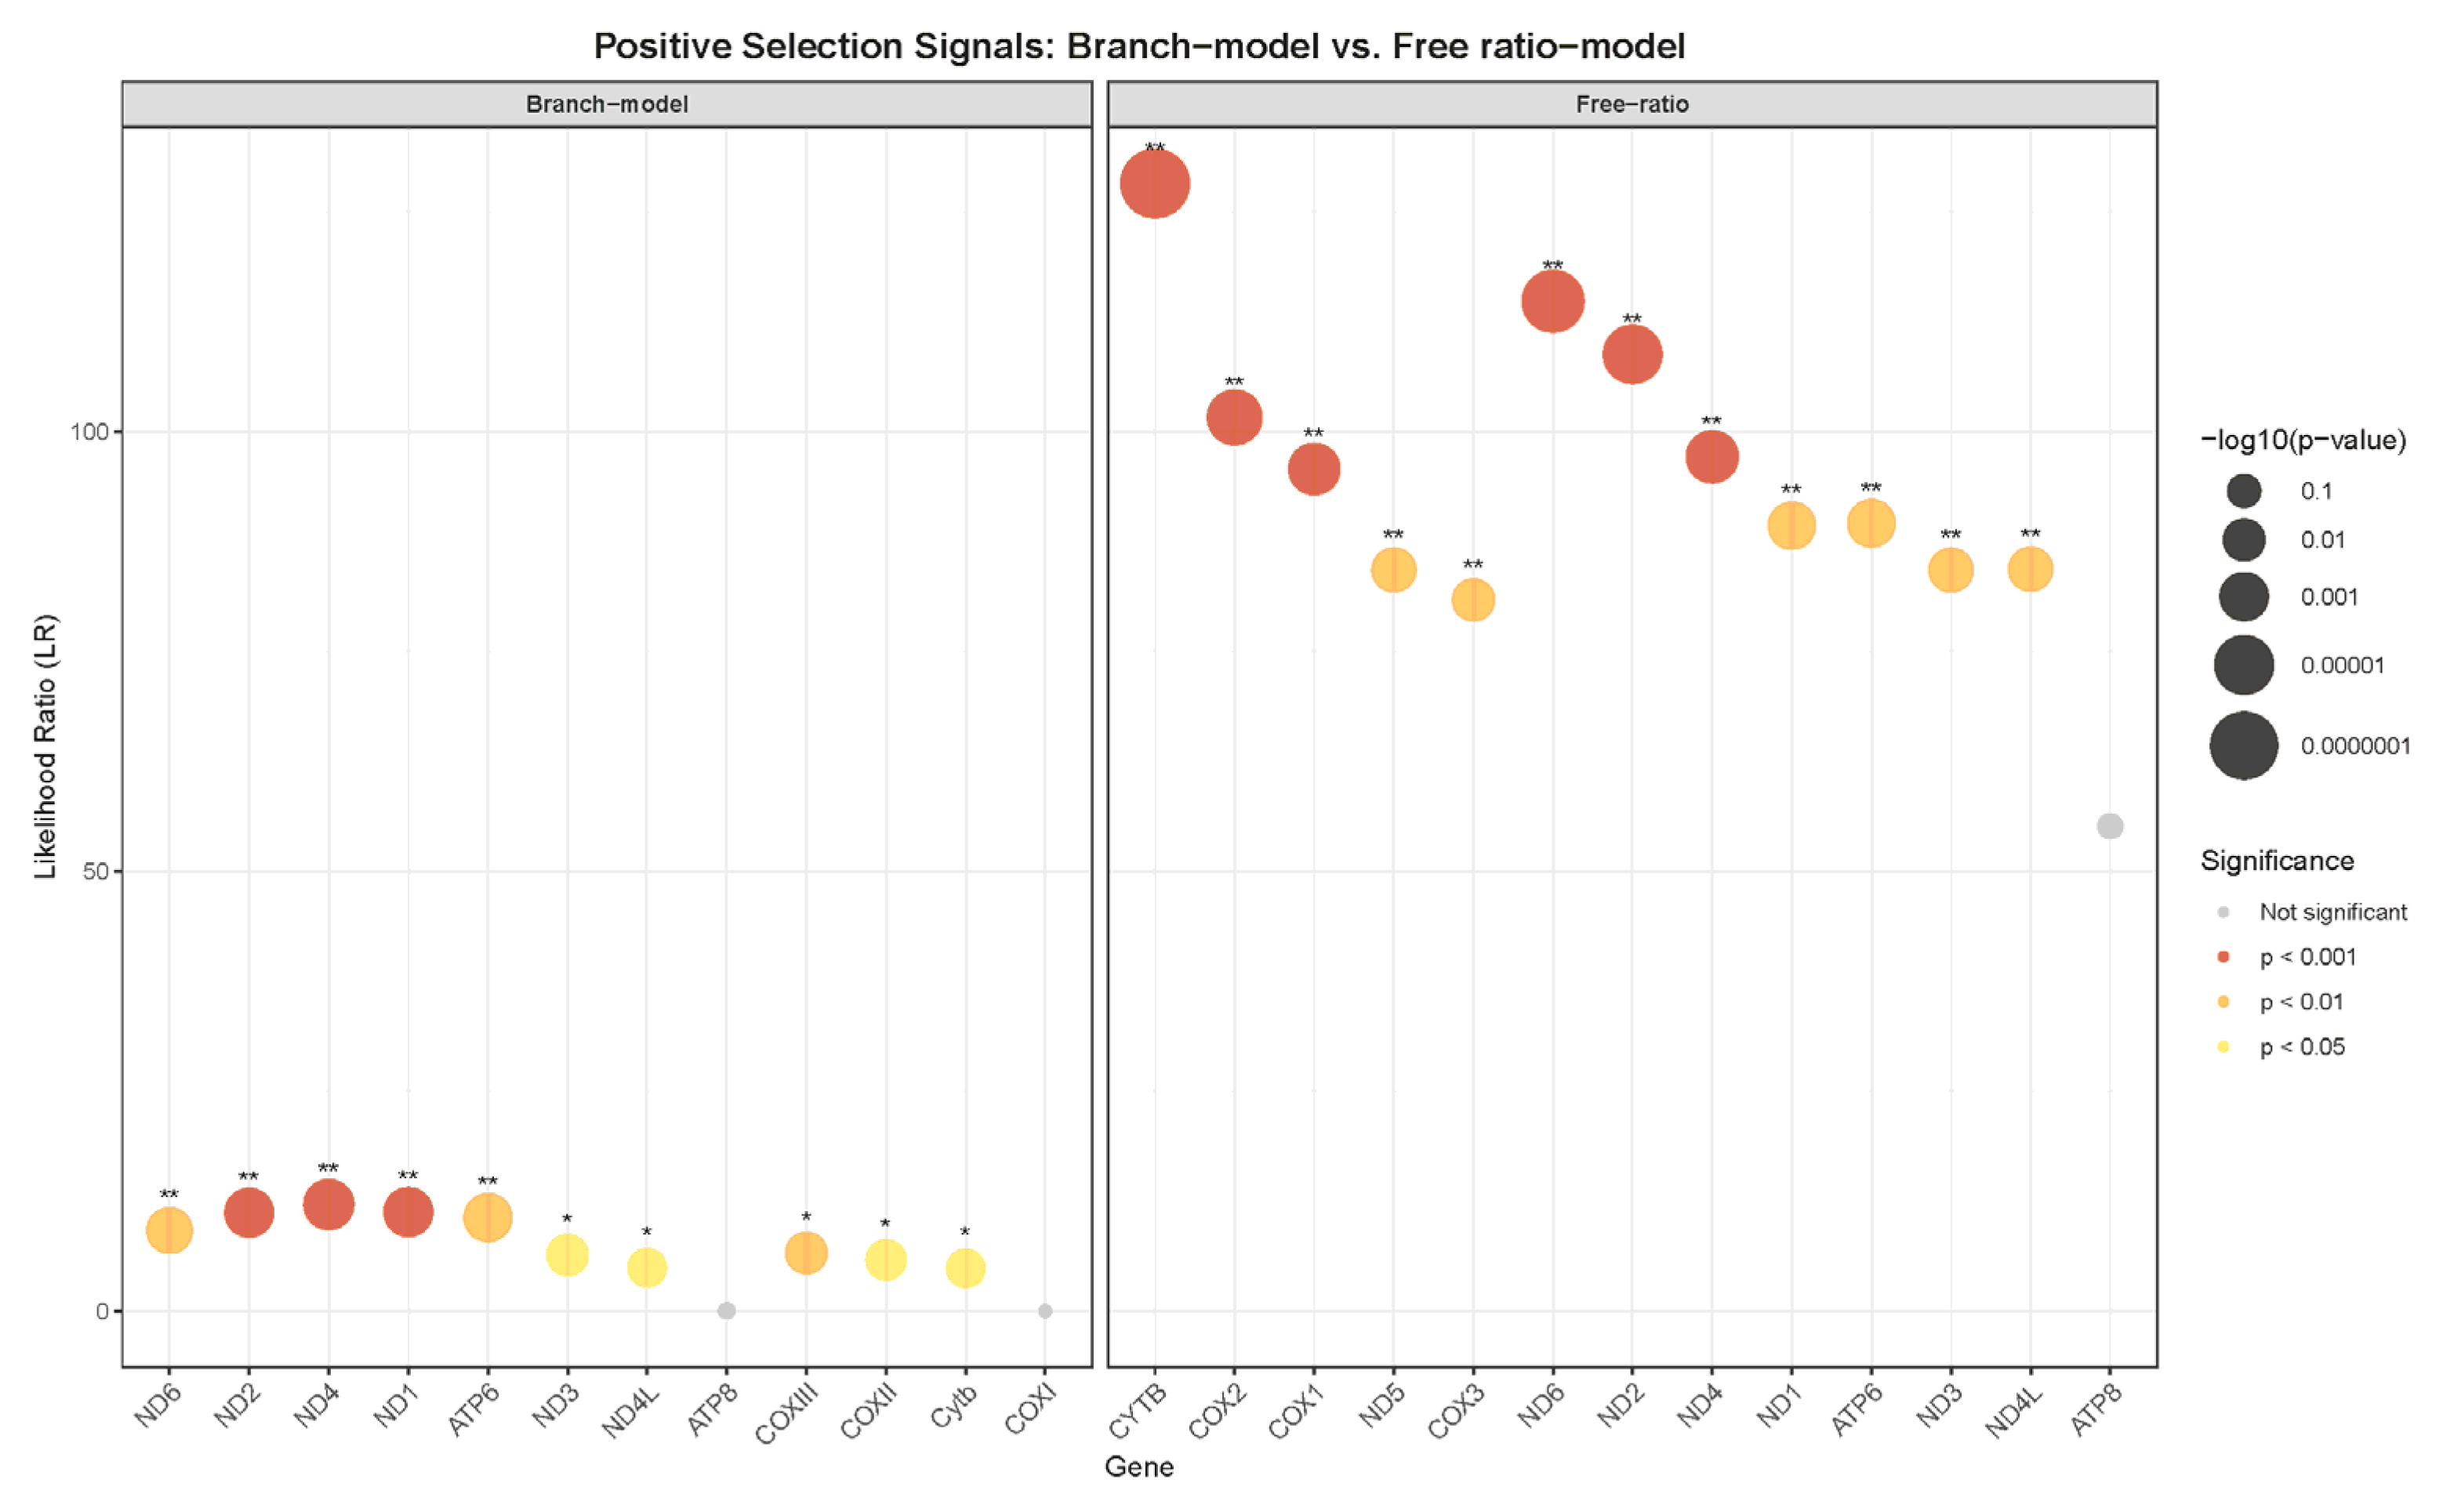
Branch-model tests specifically contrasting arid-adapted lineages against background branches detected strong positive selection signals in key mitochondrial genes functionally linked to energy metabolism: ND4 (LR = 12.14, p < 0.001), ND1 (LR = 11.02, p < 0.001), ND2 (LR = 10.66, p < 0.001), and ATP6 (LR = 12.14, p < 0.001) (Figure 5, Table S1). Notably, ND4 in Xerus exhibited a 1.8-fold ω increase, which likely reflects adaptations in proton transport efficiency to meet heightened energy demands under the chronic water scarcity and thermoregulatory stress of arid conditions. ATP6 evolved rapidly in arid groups, potentially optimizing oxidative phosphorylation efficiency under water scarcity, while ATP8 remained conserved, indicating complementary functional constraints. Free-ratio models revealed modular rate shifts: Cytb and ND2/ND6 showed branch-specific heterogeneity (Figure 6), with elevated ω in cold-adapted (Urocitellus), gliding (Petaurista), and arid-adapted lineages (Xerus), likely due to divergent thermal or metabolic needs, whereas ATP8 remained strictly conserved (p = 0.39), underscoring its essential structural role (Figure 6, Table S1). These results provide strong evidence for positive selection acting on core mitochondrial energy production genes specifically in lineages adapted to arid environments.

4. Discussions

4.1. Mitochondrial Genome Annotation and Structural Specificity

The mitogenomes of X. inauris and X. rutilus exhibit the typical vertebrate structural framework but display genus-specific variations. Core gene lengths (COXI: 1542 bp; ND4: 1378 bp; Cytb: 1140 bp) remain conserved within Sciuridae. The 75 bp extension in the X. rutilus ATP6 gene elongates its C-terminal domain, representing a convergent trait with arid-adapted taxa like Spermophilus. This modification may optimize proton translocation during dehydration by expanding the channel geometry to reduce steric hindrance for hydrated proton flux, while repositioned residues could stabilize the proton-conducting water network. These adaptations appear to sustain ATP synthase activity under aridity, potentially maintaining energy production for elevated metabolic demands [41,42,43]. Intergenic regions show genus-specific dynamics: the ATP8ATP6 spacer in X. rutilus is markedly shorter (4 bp vs. 43 bp in X. inauris), while the ND4LND4 overlap expands from 6 bp to 8 bp, suggesting selection-driven genome compaction [44]. The tRNA-Pro control region exhibits extreme AT enrichment (78.1–78.3%), significantly exceeding the genomic average (~65%), likely stabilizing replication origins under high-temperature stress [45]. Nucleotide composition further distinguishes Xerus: AT skew (0.075–0.105) exceeds that of closely related sciurids (<0.06), driven by reduced T content (25.78–26.9% vs. family average 28.6–31.8%); GC skew (−0.361 to −0.376) reflects extreme guanine depletion (G: 13.23–13.36%) and cytosine enrichment (C: 28.46–29.19%). This pattern is absent in Callosciurus (AT skew: 0.036) and Cynomys (GC skew: −0.30), highlighting Xerus’s adaptive fine-tuning within the conserved mitochondrial framework, potentially linked to environmental constraints of their arid habitats.

4.2. Codon Usage Bias and Metabolic Adaptation

The RSCU in Xerus reveals conserved preferences with species-level divergence. Both species exhibit extreme bias for Arg-CGA (RSCU = 3.78–3.88) and Leu-CUA (RSCU = 2.4–2.68) while completely avoiding AGA/AGG (Arg) codons, potentially optimizing translational efficiency under oxidative stress [30]. The exclusive use of UGA as the termination codon (RSCU = 3) further supports streamlined translation. Interspecific differences include elevated UGC (Cys) usage in X. rutilus (RSCU = 1.83 vs. 1.17 in X. inauris), which may enhance synthesis of cysteine-rich antioxidant proteins [31], and near elimination of UCG (Ser) in X. rutilus (RSCU = 0.06 vs. 0.2 in X. inauris), suggesting selective avoidance of rare tRNAs. Critically, comparative analysis with arid group (Spermophilus, Cynomys) reveals convergent adaptations: the elevated Cys-UGC bias (1.83 in X. rutilus vs. 1.14–1.31 in other desert taxa), systematic avoidance of AGA/AGG codons (RSCU = 0), and UGA termination codon dominance (RSCU ≈ 3) are significantly amplified in arid-adapted lineages compared to mesic species, providing direct evidence for molecular adaptation to oxidative stress. Bimodal distributions in Gln (CAA: 1.69–1.74; CAG: 0.26–0.31) and Lys (AAA: 1.82–1.9; AAG: 0.1–0.18) indicate environment-dependent codon optimization, while balanced variations in Pro (CCA: 0.92–1.09) and Thr (ACA: 1.57; ACC: 1.52) likely reflect species-specific metabolic demands (thermogenesis or lipid metabolism). Notably, overall codon preferences align with the extreme AT-biased nucleotide composition, facilitating efficient replication and transcription under arid conditions. In X. rutilus, the Cys-UGC characteristic of specific species has been enhanced, while it almost completely avoids the appearance of UCG. This indicates that this species has adapted to the intense ultraviolet radiation and water scarcity environment in arid habitats, possessing a sophisticated adaptation mechanism. In summary, these patterns represent a specific molecular adaptation to the energy and oxidative challenges in arid life, surpassing the potential mechanisms inferred from single-species studies.

4.3. Phylogenetic Concordance and Biogeographic Processes

The fully concordant BI and ML topologies confirm the monophy of Xerus. Xerus forms a moderately supported clade with Canis lupus familiaris and Ratufa bicolor. North American ground squirrels exhibit Pleistocene radiation patterns: Cynomys divergence aligns with habitat fragmentation [46], while recent Urocitellus divergence corresponds to glacial cycles [47]. The consistent sister relationship between Sciurus vulgaris and Spermophilus dauricus resolves previous topological uncertainties. Bering Land Bridge migrations [48] are reflected in Callospermophilus lateralis and Marmota himalayana divergences, while Sunda Shelf fluctuations shaped Exilisciurus exilis evolution [49]. These results underscore the significant role of biogeographic processes in sciurid diversification.

4.4. Positive Selection and Arid Adaptation

The central finding of this study is the detection of strong positive selection signals in key mitochondrial genes (ND4, ND1, ND2, ATP6) specifically within arid-adapted sciurid lineages, including Xerus. Branch model analyses detected strong positive selection signals in arid-adapted lineages for ND4 (LRT = 12.14), ND1 (LRT = 11.02), ND2 (LRT = 10.66), and ATP6 (LRT = 12.14). The ω of ND4 in Xerus exhibited a 1.8-fold increase, potentially enhancing proton gradient efficiency to meet heightened ATP synthesis demands under the combined stresses of water scarcity and high temperatures [41]. Cytb showed global heterogeneity (LRT = 128.29) but weak selection signals in arid lineages (LRT = 4.89), suggesting convergent selection across ecotypes [50]. Accelerated evolution of ATP6 in arid taxa—including the observed elongation in X. rutilus—contrasted with conserved ATP8, reflecting subunit-specific functional optimization of the ATP synthase complex for energy production under aridity [51]. Free-ratio models confirmed modular evolutionary patterns: Cytb and ND2/ND6 displayed branch-specific rate heterogeneity (LRT = 128.29–114.89), with elevated ω values in cold-adapted (Urocitellus), gliding (Petaurista), and arid-adapted lineages (Xerus), while ATP8 and COXI remained strictly conserved (p > 0.8), highlighting the stability of core respiratory complexes. These patterns align with mitochondrial adaptation strategies documented in other arid-adapted mammals like camels [52] and jerboas [53], supporting conserved mechanisms for optimizing mitochondrial energy metabolism under water scarcity across phylogenetically diverse taxa. While branch models identified strong positive selection signals in ATP6 and ND genes, two critical constraints merit emphasis: (1) The functional consequences of positively selected sites (e.g., ATP6 elongation) require experimental validation (e.g., CRISPR-based mutagenesis assays) to confirm their roles in thermotolerance. (2) Our exclusive reliance on mtDNA precludes analysis of mito-nuclear coadaptation—nuclear genomic data (e.g., OXPHOS genes) are essential to resolve compensatory mechanisms. Nevertheless, the identification of significantly elevated positive selection signals in core mitochondrial energy production genes specifically in arid-adapted lineages relative to background branches suggests that mitogenomic adaptation is a key component of the evolutionary response to extreme aridity in sciurids.

4.5. Limitations and Methodological Considerations

While this study provides compelling evidence for mitogenomic adaptation to aridity in sciurids, several methodological limitations warrant consideration. First, our definition of “arid-adapted” species relies on macroclimate proxies derived from distribution-wide climate data, which serve as standardized proxies for comparative analyses at a macroecological scale. However, these proxies do not fully capture species’ microhabitat preferences, behavioral adaptations (diel activity patters or active foraging strategies in riparian zones within arid landscapes), or physiological tolerance thresholds (e.g., species reliant on hibernation or estivation to bypass extreme dehydration periods). Species such as Cynomys spp. inhabiting dry grasslands but exploiting subterranean microclimates or water-rich foraging areas may thus exhibit adaptations not fully aligned with macro-scale aridity metrics. Second, our analysis focused exclusively on mitochondrial genomes. Mito-nuclear coadaptation, particularly in OXPHOS complexes involving nuclear-encoded subunits, is critical for functional optimization under environmental stress; future studies incorporating nuclear genomic data are required to resolve compensatory mechanisms across gene compartments. Third, the functional significance of candidate sites under selection (e.g., the extended ATP6 domain in X. rutilus) remains statistically inferred. Experimental validation through molecular assays (e. g., CRISPR-based mutagenesis testing proton translocation efficiency under dehydrating conditions) is necessary to confirm the phenotypic consequences of these molecular adaptations. Despite these constraints, the convergent patterns of selection in key mitochondrial genes across arid-adapted lineages remain robust indicators of evolutionary pressures associated with water scarcity and oxidative stress.

Supplementary Materials

The following supporting information can be downloaded at: https://www.mdpi.com/article/10.3390/d17080538/s1. Supplementary Table S1. Characteristics of the mitochondrial genome. Supplementary File S1.

Author Contributions

Y.X., Y.C. and X.W. (Xibao Wang): data curation; formal analysis; project administration; writing—original draft; writing—review and editing. Y.S.: formal analysis; project administration. H.C.: project administration. L.W.: project administration. X.W. (Xiaoyang Wu): funding acquisition; project administration. All authors have read and agreed to the published version of the manuscript.

Funding

This research was funded by the Youth Innovation Team in Colleges and Universities of Shandong Province (2022KJ177).

Institutional Review Board Statement

Ethical review and approval were waived for this study due to the fact that only non-invasive samples were collected and analyzed.

Informed Consent Statement

Not applicable.

Data Availability Statement

All the mitochondrial genome sequences used in this study were added to the Supplementary Materials File S1.

Acknowledgments

We thank the National Center for Biotechnology Information (NCBI) Database for providing the raw data.

Conflicts of Interest

The authors declare that the research was conducted in the absence of any commercial or financial relationships that could be construed as a potential conflict of interest.

References

  1. Heske, E.J. Squirrels of the world. J. Mammal. 2013, 94, 957–958. [Google Scholar] [CrossRef]
  2. Whatton, J.F.; Steele, M.A.; Koprowski, J.L.; Thorington, R.W.J. Squirrels of the World; Johns Hopkins University Press: Baltimore, MD, USA, 2012. [Google Scholar]
  3. Santicchia, F.; Dantzer, B.; van Kesteren, F.; Palme, R.; Martinoli, A.; Ferrari, N.; Wauters, L.A. Stress in biological invasions: Introduced invasive grey squirrels increase physiological stress in native eurasian red squirrels. J. Anim. Ecol. 2018, 87, 1342–1352. [Google Scholar] [CrossRef]
  4. Marinelli, L. North American tree squirrels. J. Mammal. 2004, 85, 168–169. [Google Scholar] [CrossRef]
  5. Zhang, B.; Shi, Z.; Chen, X.; Hou, X.; Wang, J.; Li, J.; Chang, G. Seed dispersal of three sympatric oak species by forest rodents in the south slope of Qinling Mountains, China. Acta Ecol. Sin. 2016, 36, 6750–6757. [Google Scholar] [CrossRef]
  6. Schwimmer, H.; Haim, A. Physiological adaptations of small mammals to desert ecosystems. Integr. Zool. 2009, 4, 357–366. [Google Scholar] [CrossRef] [PubMed]
  7. Neves, C.; Pillay, N. Kidney form and function vary along an aridity gradient in the African striped mouse, genus Rhabdomys. Mamm. Biol. 2025. [Google Scholar] [CrossRef]
  8. Herron, M.D.; Castoe, T.A.; Parkinson, C.L. Sciurid phylogeny and the paraphyly of holarctic ground squirrels (Spermophilus). Mol. Phylogenetics Evol. 2004, 31, 1015–1030. [Google Scholar] [CrossRef] [PubMed]
  9. Mercer, J.M.; Roth, V.L. The effects of cenozoic global change on squirrel phylogeny. Science 2003, 299, 1568–1572. [Google Scholar] [CrossRef]
  10. Meredith, R.W.; Janečka, J.E.; Gatesy, J.; Ryder, O.A.; Fisher, C.A.; Teeling, E.C.; Goodbla, A.; Eizirik, E.; Simão, T.L.L.; Stadler, T.; et al. Impacts of the cretaceous terrestrial revolution and kpg extinction on mammal diversification. Science 2011, 334, 521–524. [Google Scholar] [CrossRef]
  11. Favre, A.; Päckert, M.; Pauls, S.U.; Jähnig, S.C.; Uhl, D.; Michalak, I.; Muellner-Riehl, A.N. The role of the uplift of the Qinghai-Tibetan Plateau for the evolution of Tibetan biotas. Biol. Rev. Camb. Philos. Soc. 2015, 90, 236–253. [Google Scholar] [CrossRef]
  12. Steppan, S.J.; Storz, B.L.; Hoffmann, R.S. Nuclear DNA phylogeny of the squirrels (mammalia: Rodentia) and the evolution of arboreality from c-myc and rag1. Mol. Phylogenet. Evol. 2004, 30, 703–719. [Google Scholar] [CrossRef]
  13. Li, Q.; Cheng, F.; Jackson, S.M.; Helgen, K.M.; Song, W.Y.; Liu, S.Y.; Sanamxay, D.; Li, S.; Li, F.; Xiong, Y.; et al. Phylogenetic and morphological significance of an overlooked flying squirrel (pteromyini, rodentia) from the eastern himalayas with the description of a new genus. Zool. Res. 2021, 42, 389–400. [Google Scholar] [CrossRef] [PubMed]
  14. Regan, M.D.; Chiang, E.; Liu, Y.; Tonelli, M.; Verdoorn, K.M.; Gugel, S.R.; Suen, G.; Carey, H.V.; Assadi-Porter, F.M. Nitrogen recycling via gut symbionts increases in ground squirrels over the hibernation season. Science 2022, 375, 460–463. [Google Scholar] [CrossRef]
  15. Nouri, Z.; Zhang, X.Y.; Khakisahneh, S.; Degen, A.A.; Wang, D.H. The microbiota-gut-kidney axis mediates host osmoregulation in a small desert mammal. npj Biofilms Microbiomes 2022, 8, 16. [Google Scholar] [CrossRef]
  16. Ventura-Rojas, P.D.; González-Romero, A.; Moreno, C.E.; Sosa, V.J. Effect of rainfall, temperature and climate change on the ecology of the rodents of arid zones: A review. Mammal Rev. 2025, 55, e12372. [Google Scholar] [CrossRef]
  17. Olenev, G.V.; Grigorkina, E.B. Evolutionary ecological analysis of adaptation strategies of rodent populations under extreme conditions. Russ. J. Ecol. 2016, 47, 486–492. [Google Scholar] [CrossRef]
  18. Tian, R.; Yin, D.; Liu, Y.; Seim, I.; Xu, S.; Yang, G. Adaptive evolution of energy metabolism-related genes in hypoxia-tolerant mammals. Front. Genet. 2017, 8, 205. [Google Scholar] [CrossRef] [PubMed]
  19. Song, Z.; Wang, D.-H. Influencing factors on basal metabolic rate in mammals. Acta Theriol. Sin. 2002, 22, 53–60. [Google Scholar]
  20. Hill, G.E. Mitonuclear Compensatory Coevolution. Trends Genet. 2020, 36, 403–414. [Google Scholar] [CrossRef]
  21. Gershoni, M.; Levin, L.; Ovadia, O.; Toiw, Y.; Shani, N.; Dadon, S.; Barzilai, N.; Bergman, A.; Atzmon, G.; Wainstein, J.; et al. Disrupting mitochondrial–nuclear coevolution affects oxphos complex i integrity and impacts human health. Genome Biol. Evol. 2014, 6, 2665–2680. [Google Scholar] [CrossRef]
  22. Wu, H.; Guang, X.; Al-Fageeh, M.B.; Cao, J.; Pan, S.; Zhou, H.; Zhang, L.; Abutarboush, M.H.; Xing, Y.; Xie, Z.; et al. Camelid genomes reveal evolution and adaptation to desert environments. Nat. Commun. 2014, 5, 5188. [Google Scholar] [CrossRef]
  23. Wang, S.; Ore, M.J.; Mikkelsen, E.K.; Lee-Yaw, J.; Toews, D.P.L.; Rohwer, S.; Irwin, D. Signatures of mitonuclear coevolution in a warbler species complex. Nat. Commun. 2021, 12, 4279. [Google Scholar] [CrossRef]
  24. Lee, W.; Zamudio-Ochoa, A.; Buchel, G.; Podlesniy, P.; Marti Gutierrez, N.; Puigròs, M.; Calderon, A.; Tang, H.-Y.; Li, L.; Mikhalchenko, A.; et al. Molecular basis for maternal inheritance of human mitochondrial DNA. Nat. Genet. 2023, 55, 1632–1639. [Google Scholar] [CrossRef]
  25. Shen, J.; Lyu, X.; Xu, X.; Wang, Z.; Zhang, Y.; Wang, C.; Munaiz, E.D.; Zhang, M.; Havey, M.J.; Shou, W. A nuclear-encoded endonuclease governs the paternal transmission of mitochondria in Cucumis plants. Nat. Commun. 2025, 16, 4266. [Google Scholar] [CrossRef]
  26. Wang, X.; Shang, Y.; Wu, X.; Wei, Q.; Zhou, S.; Sun, G.; Mei, X.; Dong, Y.; Sha, W.; Zhang, H. Divergent evolution of mitogenomics in Cetartiodactyla niche adaptation. Org. Divers. Evol. 2023, 23, 243–259. [Google Scholar] [CrossRef]
  27. Dierckxsens, N.; Mardulyn, P.; Smits, G. Novoplasty: De novo assembly of organelle genomes from whole genome data. Nucleic Acids Res. 2017, 45, e18. [Google Scholar] [CrossRef]
  28. Wu, X.; Xing, Y.; Wang, X.; Shang, Y.; Chen, Y.; Wang, L.; Han, M.; Sha, W.; Zhang, H. Mitogenomic resolution of phylogenetic conflicts and adaptive signatures in feliform carnivorans. Heredity 2025, 134, 408–416. [Google Scholar] [CrossRef] [PubMed]
  29. Donath, A.; Jühling, F.; Al-Arab, M.; Bernhart, S.H.; Reinhardt, F.; Stadler, P.F.; Middendorf, M.; Bernt, M. Improved annotation of protein-coding genes boundaries in metazoan mitochondrial genomes. Nucleic Acids Res. 2019, 47, 10543–10552. [Google Scholar] [CrossRef] [PubMed]
  30. Greiner, S.; Lehwark, P.; Bock, R. Organellargenomedraw (ogdraw) version 1.3.1: Expanded toolkit for the graphical visualization of organellar genomes. Nucleic Acids Res. 2019, 47, W59–W64. [Google Scholar] [CrossRef]
  31. Fick, S.E.; Hijmans, R.J. Worldclim 2: New 1-km spatial resolution climate surfaces for global land areas. Int. J. Climatol. 2017, 37, 4302–4315. [Google Scholar] [CrossRef]
  32. IUCN. The IUCN Red List of Threatened Species, Version 2022-2; IUCN: Gland, The Switzerland, 2022. [Google Scholar]
  33. GBIF Occurrence Download. Available online: https://doi.org/10.1016/j.gecco.2020.e01406 (accessed on 3 May 2025).
  34. Charif, D.; Lobry, J.R. SeqinR 1.0-2: A contributed package to the r project for statistical computing devoted to biological sequences retrieval and analysis. In Structural Approaches to Sequence Evolution; Bastolla, U., Porto, M., Roman, H.E., Vendruscolo, M., Eds.; Springer: Berlin/Heidelberg, Germany, 2007; pp. 207–232. [Google Scholar] [CrossRef]
  35. Orešič, M.; Shalloway, D. Specific correlations between relative synonymous codon usage and protein secondary Structure11edited by g. Von heijne. J. Mol. Biol. 1998, 281, 31–48. [Google Scholar] [CrossRef]
  36. Katoh, K.; Standley, D.M. MAFFT multiple sequence alignment software version 7: Improvements in performance and usability. Mol. Biol. Evol. 2013, 30, 772–780. [Google Scholar] [CrossRef] [PubMed]
  37. Talavera, G.; Castresana, J. Improvement of phylogenies after removing divergent and ambiguously aligned blocks from protein sequence alignments. Syst. Biol. 2007, 56, 564–577. [Google Scholar] [CrossRef]
  38. Minh, B.Q.; Schmidt, H.A.; Chernomor, O.; Schrempf, D.; Woodhams, M.D.; von Haeseler, A.; Lanfear, R. Iq-tree 2: New models and efficient methods for phylogenetic inference in the genomic era. Mol. Biol. Evol. 2020, 37, 1530–1534. [Google Scholar] [CrossRef] [PubMed]
  39. Ronquist, F.; Teslenko, M.; van der Mark, P.; Ayres, D.L.; Darling, A.; Höhna, S.; Larget, B.; Liu, L.; Suchard, M.A.; Huelsenbeck, J.P. Mrbayes 3.2: Efficient bayesian phylogenetic inference and model choice across a large model space. Syst. Biol. 2012, 61, 539–542. [Google Scholar] [CrossRef] [PubMed]
  40. Yang, Z. Paml 4: Phylogenetic analysis by maximum likelihood. Mol. Biol. Evol. 2007, 24, 1586–1591. [Google Scholar] [CrossRef]
  41. Bonora, M.; Patergnani, S.; Rimessi, A.; De Marchi, E.; Suski, J.M.; Bononi, A.; Giorgi, C.; Marchi, S.; Missiroli, S.; Poletti, F.; et al. Atp synthesis and storage. Purinergic Signal. 2012, 8, 343–357. [Google Scholar] [CrossRef]
  42. Zhang, X.; Wu, J.; Min, Z.; Wang, J.; Hong, X.; Pei, X.; Rao, Z.; Xu, X. Structure of atp synthase from an early photosynthetic bacterium chloroflexus aurantiacus. Proc. Natl. Acad. Sci. USA 2025, 122, e2425824122. [Google Scholar] [CrossRef]
  43. Jonckheere, A.I.; Smeitink, J.A.; Rodenburg, R.J. Mitochondrial atp synthase: Architecture, function and pathology. J. Inherit. Metab. Dis. 2012, 35, 211–225. [Google Scholar] [CrossRef]
  44. Pavesi, A. Asymmetric evolution in viral overlapping genes is a source of selective protein adaptation. Virology 2019, 532, 39–47. [Google Scholar] [CrossRef] [PubMed]
  45. Vinogradov, A.E.; Anatskaya, O.V. DNA helix: The importance of being at-rich. Mamm. Genome 2017, 28, 455–464. [Google Scholar] [CrossRef] [PubMed]
  46. Groucutt, H.S.; White, T.S.; Scerri, E.M.L.; Andrieux, E.; Clark-Wilson, R.; Breeze, P.S.; Armitage, S.J.; Stewart, M.; Drake, N.; Louys, J.; et al. Multiple hominin dispersals into Southwest Asia over the past 400,000 years. Nature 2021, 597, 376–380. [Google Scholar] [CrossRef]
  47. Abe-Ouchi, A.; Saito, F.; Kawamura, K.; Raymo, M.E.; Okuno, J.i.; Takahashi, K.; Blatter, H. Insolation-driven 100,000-year glacial cycles and hysteresis of ice-sheet volume. Nature 2013, 500, 190–193. [Google Scholar] [CrossRef]
  48. Elias, S.A.; Short, S.K.; Nelson, C.H.; Birks, H.H. Life and times of the Bering land bridge. Nature 1996, 382, 60–63. [Google Scholar] [CrossRef]
  49. Steinke, S.; Kienast, M.; Hanebuth, T. On the significance of sea-level variations and shelf paleo-morphology in governing sedimentation in the southern South China Sea during the last deglaciation. Mar. Geol. 2003, 201, 179–206. [Google Scholar] [CrossRef]
  50. Hu, Z.; Yang, L.; Zhang, M.; Tang, H.; Huang, Y.; Su, Y.; Ding, Y.; Li, C.; Wang, M.; Zhou, Y.; et al. A novel protein Cytb-187aa encoded by the mitochondrial gene Cytb modulates mammalian early development. Cell Metab. 2024, 36, 1586–1597.e7. [Google Scholar] [CrossRef] [PubMed]
  51. Mahendrarajah, T.A.; Moody, E.R.R.; Schrempf, D.; Szánthó, L.L.; Dombrowski, N.; Davín, A.A.; Pisani, D.; Donoghue, P.C.J.; Szöllősi, G.J.; Williams, T.A.; et al. Atp synthase evolution on a cross-braced dated tree of life. Nat. Commun. 2023, 14, 7456. [Google Scholar] [CrossRef] [PubMed]
  52. Manee, M.M.; Al-Shomrani, B.M.; Alqahtani, F.H. Mitochondrial DNA of the arabian camel camelus dromedarius. Animals 2024, 14, 2460. [Google Scholar] [CrossRef]
  53. Epps, C.; Carpenter, L.; Wehausen, J. Genetic relatedness of the preble’s meadow jumping mouse (zapus hudsonius preblei) to nearby subspecies of z. Hudsonius as inferred from variation in cranial morphology, mitochondrial DNA and microsatellite DNA: Implications for taxonomy and conservation. Anim. Conserv. 2005, 8, 329–346. [Google Scholar] [CrossRef]
Figure 1. Gene map of mitogenome of X. inauris and X. rutilus. The genes inside the circle are transcribed clockwise, whereas the genes outside the circle are transcribed counterclockwise.
Diversity 17 00538 g001
Figure 2. Relative synonymous codon usage (RSCU) of X. inauris and X. rutilus. Codon families are plotted on the x-axis. Codon type is presented beneath each codon family. On the histogram, the proportion of each codon type (retaining same color code) as a proportion of the respective codon family.
Diversity 17 00538 g002
Figure 3. Cross-species codon usage bias heatmap analysis based on Relative Synonymous Codon Usage (RSCU) frequency. The bottom x-axis displays standard codons grouped by amino acid categories, while the top x-axis indicates corresponding amino acid classifications. The left y-axis presents an RSCU similarity clustering dendrogram (hierarchical clustering based on Euclidean distance), with the right y-axis listing associated species names. The heatmap employs a light to dark green continuous color spectrum representing low-to-high RSCU values.
Diversity 17 00538 g003
Figure 4. Maximum likelihood phylogenetic analysis of 13 mitochondrial protein-coding genes from 28 species. Branch lengths (scaled by substitutions per site) are indicated in black; statistical support values (bootstrap) are labeled in blue. Groups are color-coded: red = arid group, green = non-arid group, blue = outgroup.
Diversity 17 00538 g004
Figure 5. Bayesian inference phylogeny analysis of 13 mitochondrial protein-coding genes from 28 species. Branch lengths (scaled by substitutions per site) are indicated in black; statistical support values (posterior probabilities) are labeled in blue. Groups are color-coded: red = arid group, green = non-arid group, blue = outgroup.
Diversity 17 00538 g005
Figure 6. Positive selection analysis of mitochondrial protein-coding genes. Left panel: results under the branch model. Right panel: results under the free model. The x-axis shows 13 mitochondrial protein-coding genes, and the y-axis represents likelihood ratio (LR) statistics. Circle size scales with −log10(p-value), and color indicates significance level (red: highly significant ** p < 0.01; orange: significant * p < 0.05; gray: not significant).
Diversity 17 00538 g006
Table 1. Mitogenomes analyzed in this study, including genomic features and habitat groups.
SpeciesAccession NumberAT%AT_SkewGC%GC_SkewGroup
Callospermophilus lateralisNC_031210.163.190.02236.81−0.317Arid
Cynomys leucurusNC_026705.162.970.01937.03−0.308
Cynomys ludovicianusNC_026706.162.630.02037.37−0.302
Lctidomys tridecemlineatusNC_027278.163.680.00836.32−0.298
Spermophilus alashanicusNC_071768.164.60.00835.4−0.300
Spermophilus citellusNC_059784.164.590.01535.41−0.302
Spermophilus dauricusNC_027283.163.120.01736.88−0.321
Spermophilus taurensisNC_079844.164.630.01135.37−0.299
Urocitellus parryiiNC_059785.163.310.01436.69−0.302
Urocitellus richardsoniiNC_031209.163.210.01336.79−0.300
X. inaurisSupplementary Materials File S158.180.07541.82−0.361
X. rutilusSupplementary Materials File S157.580.10542.42−0.376
Lariscus insignisNC_030070.161.080.03138.92−0.327Non-Arid
Hadrosciurus igniventrisNC_050027.161.940.01138.06−0.312
Hylopetes phayreiNC_026443.162.630.03237.37−0.322
Glaucomys volansNC_050026.162.390.02837.61−0.332
Guerlinguetus brasiliensisNC_050010.162.580.00437.42−0.307
Exilisciurus exilisNC_030072.159.690.06140.31−0.325
Callosciurus finlaysoniiNC_035817.160.60.03639.4−0.338
Dremomys rufigenisNC_026442.160.890.06539.11−0.358
Marmota himalayanaNC_018367.163.480.01336.52−0.301
Microsciurus mimulusNC_050020.162.20.00637.8−0.303
Petaurista hainanaNC_023089.160.380.05239.62−0.328
Pteromys volansNC_019612.162.570.02937.43−0.328
Ratufa bicolorNC_023780.160.320.05139.68−0.336
Sciurus vulgarisNC_002369.162.970.02037.03−0.322
Sundasciurus brookeiNC_035812.161.980.04538.02−0.336
Tamiops swinhoeiNC_026875.161.30.06538.7−0.361
Total: 28 mitogenomes (28 species: 12 arid-adapted, 16 non-arid). Newly X. inauris and X. rutilus genomes marked as ‘Supplementary Materials File S1’.
Table 2. Characteristics of the mitochondrial genome (X. inauris: Xi, X. rutilus: Xr).
GeneNucleotide PositionsSize (bp)StrandCodon
XiXrXiXr
StartEndStartEndXiXrXi/XrInitiationAmberInitiationAmber
tRNA-Phe1681686868+
12SRNA691041691042973974+
tRNA-Val10421109104311106868+
16SRNA111026841111268815751578+
tRNA-Leu26852759268927637575+
ND12764371927683723956956+ATGTAATGTA
tRNA-Ile37203787372437926869+
tRNA-Gln37853856379038617272-
tRNA-Met38623930386639346969+
ND2393149723935497610421042+ATCTATCT
tRNA-Trp49735042497750457069+
tRNA-Ala50465114504951176969-
tRNA-Asn51325204513652077372-
tRNA-Cys52365302523853046767-
tRNA-Tyr53035368530553706666-
COXI537769185379692015421542+ATGTAGATGTAA
tRNA-Ser69216989692369916969-
tRNA-Asp69937061699570636969+
COXII7062774570647747684684+ATGTAAATGTAA
tRNA-Lys77487814775078176768+
ATP87816802278198025207207+ATGTAGATGTAG
ATP68052865679808659605680+ATGTAATGTA
COXIII8657944086609443784784+ATGTATGT
tRNA-Gly94419510944495147071+
ND39511985795159861347347+ATTTAATTTA
tRNA-Arg98589926986299306969+
ND4L992810224993210,228297297+ATGTAAATGTAA
ND410,21811,59510,22211,59913781378+ATGTATGT
tRNA-His11,5961166411,,60011,6686969+
tRNA-Ser11,66511,72411,66911,7286060+
tRNA-Leu11,72511,79411,72911,7987070+
ND511,79513,61211,79913,61618181818+ATCTAAATCTAA
ND613,59614,12613,60014,130531531-AGATAGAT
tRNA-Glu14,12114,18914,12514,1936969-
Cytb14,19315,33214,19715,33611401140+ATGTAAATGTAG
tRNA-Thr15,33315,40015,33715,4056869+
tRNA-Pro15,40515,47215,41015,4786869-
Disclaimer/Publisher’s Note: The statements, opinions and data contained in all publications are solely those of the individual author(s) and contributor(s) and not of MDPI and/or the editor(s). MDPI and/or the editor(s) disclaim responsibility for any injury to people or property resulting from any ideas, methods, instructions or products referred to in the content.