
Allometric Equations for Aboveground Biomass Estimation in Natural Forest Trees: Generalized or Species-Specific?


Abstract
1. Introduction
2. Materials and Methods
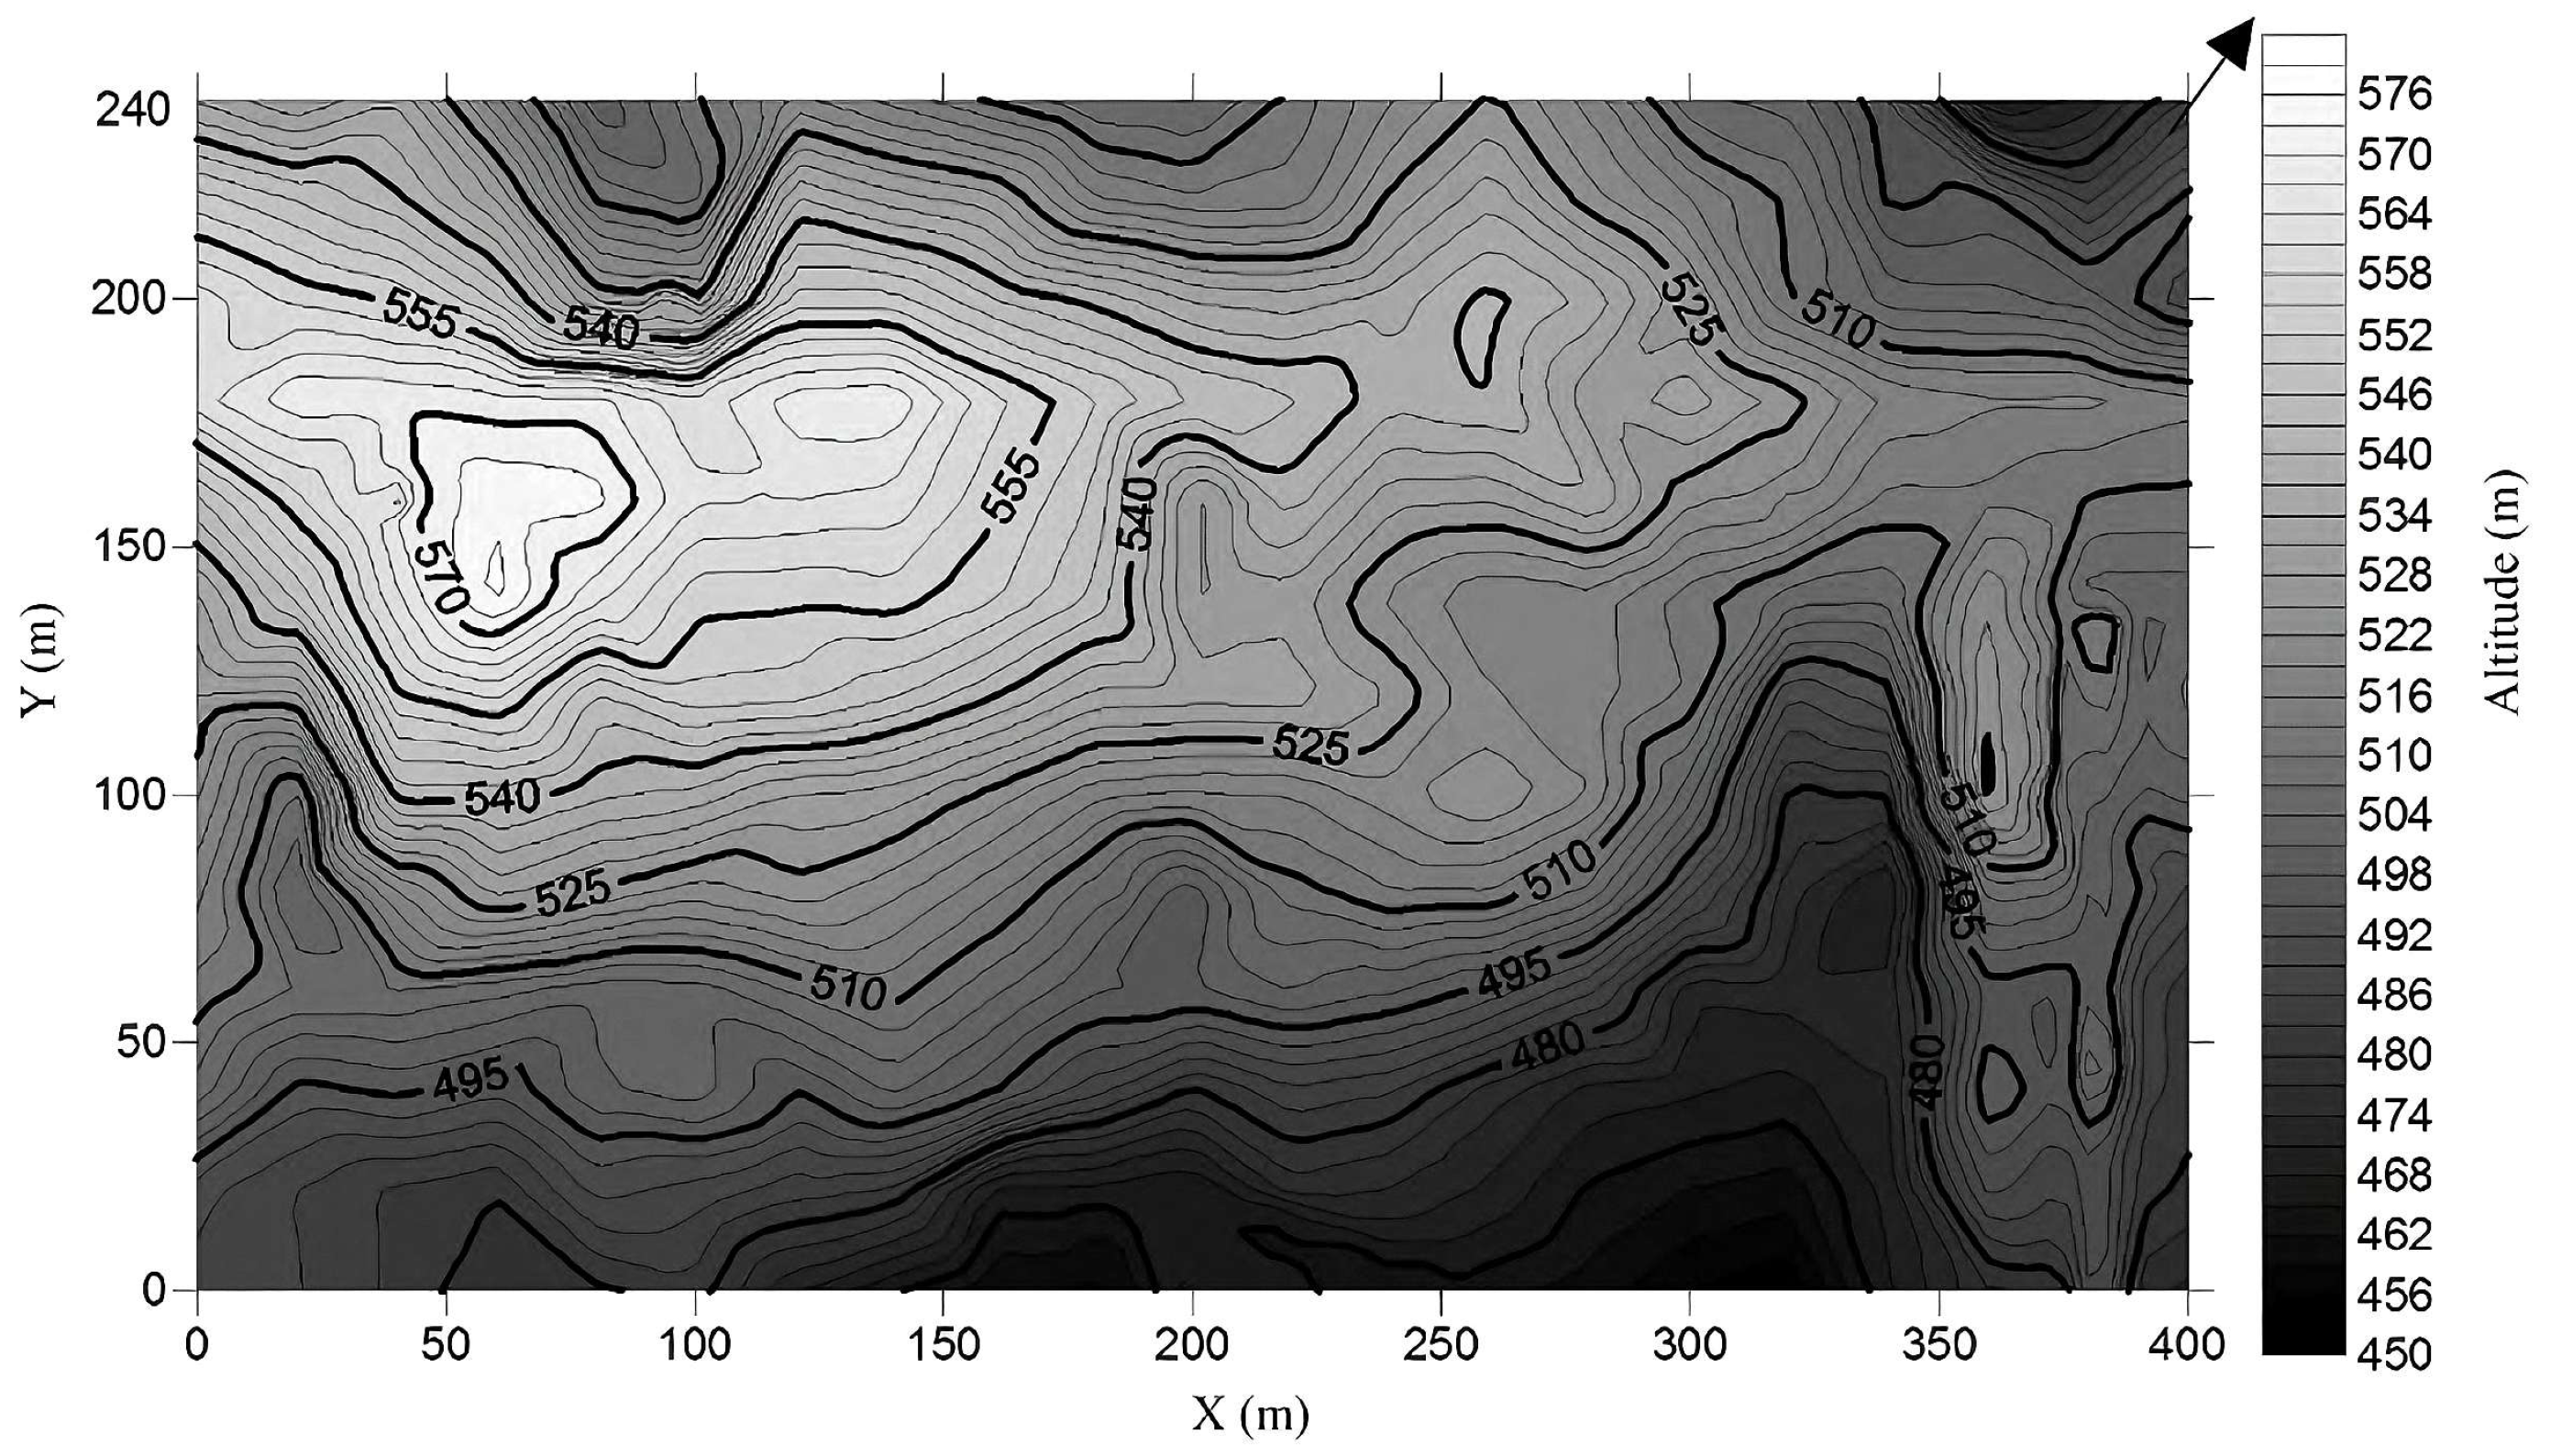
2.1. Site Description
2.2. Data Determination of Biomass
- W represents the aboveground biomass of the tree species;
- DBH represents the diameter at breast height of the tree.
3. Results
3.1. Analysis of Coefficients of Allometric Equations
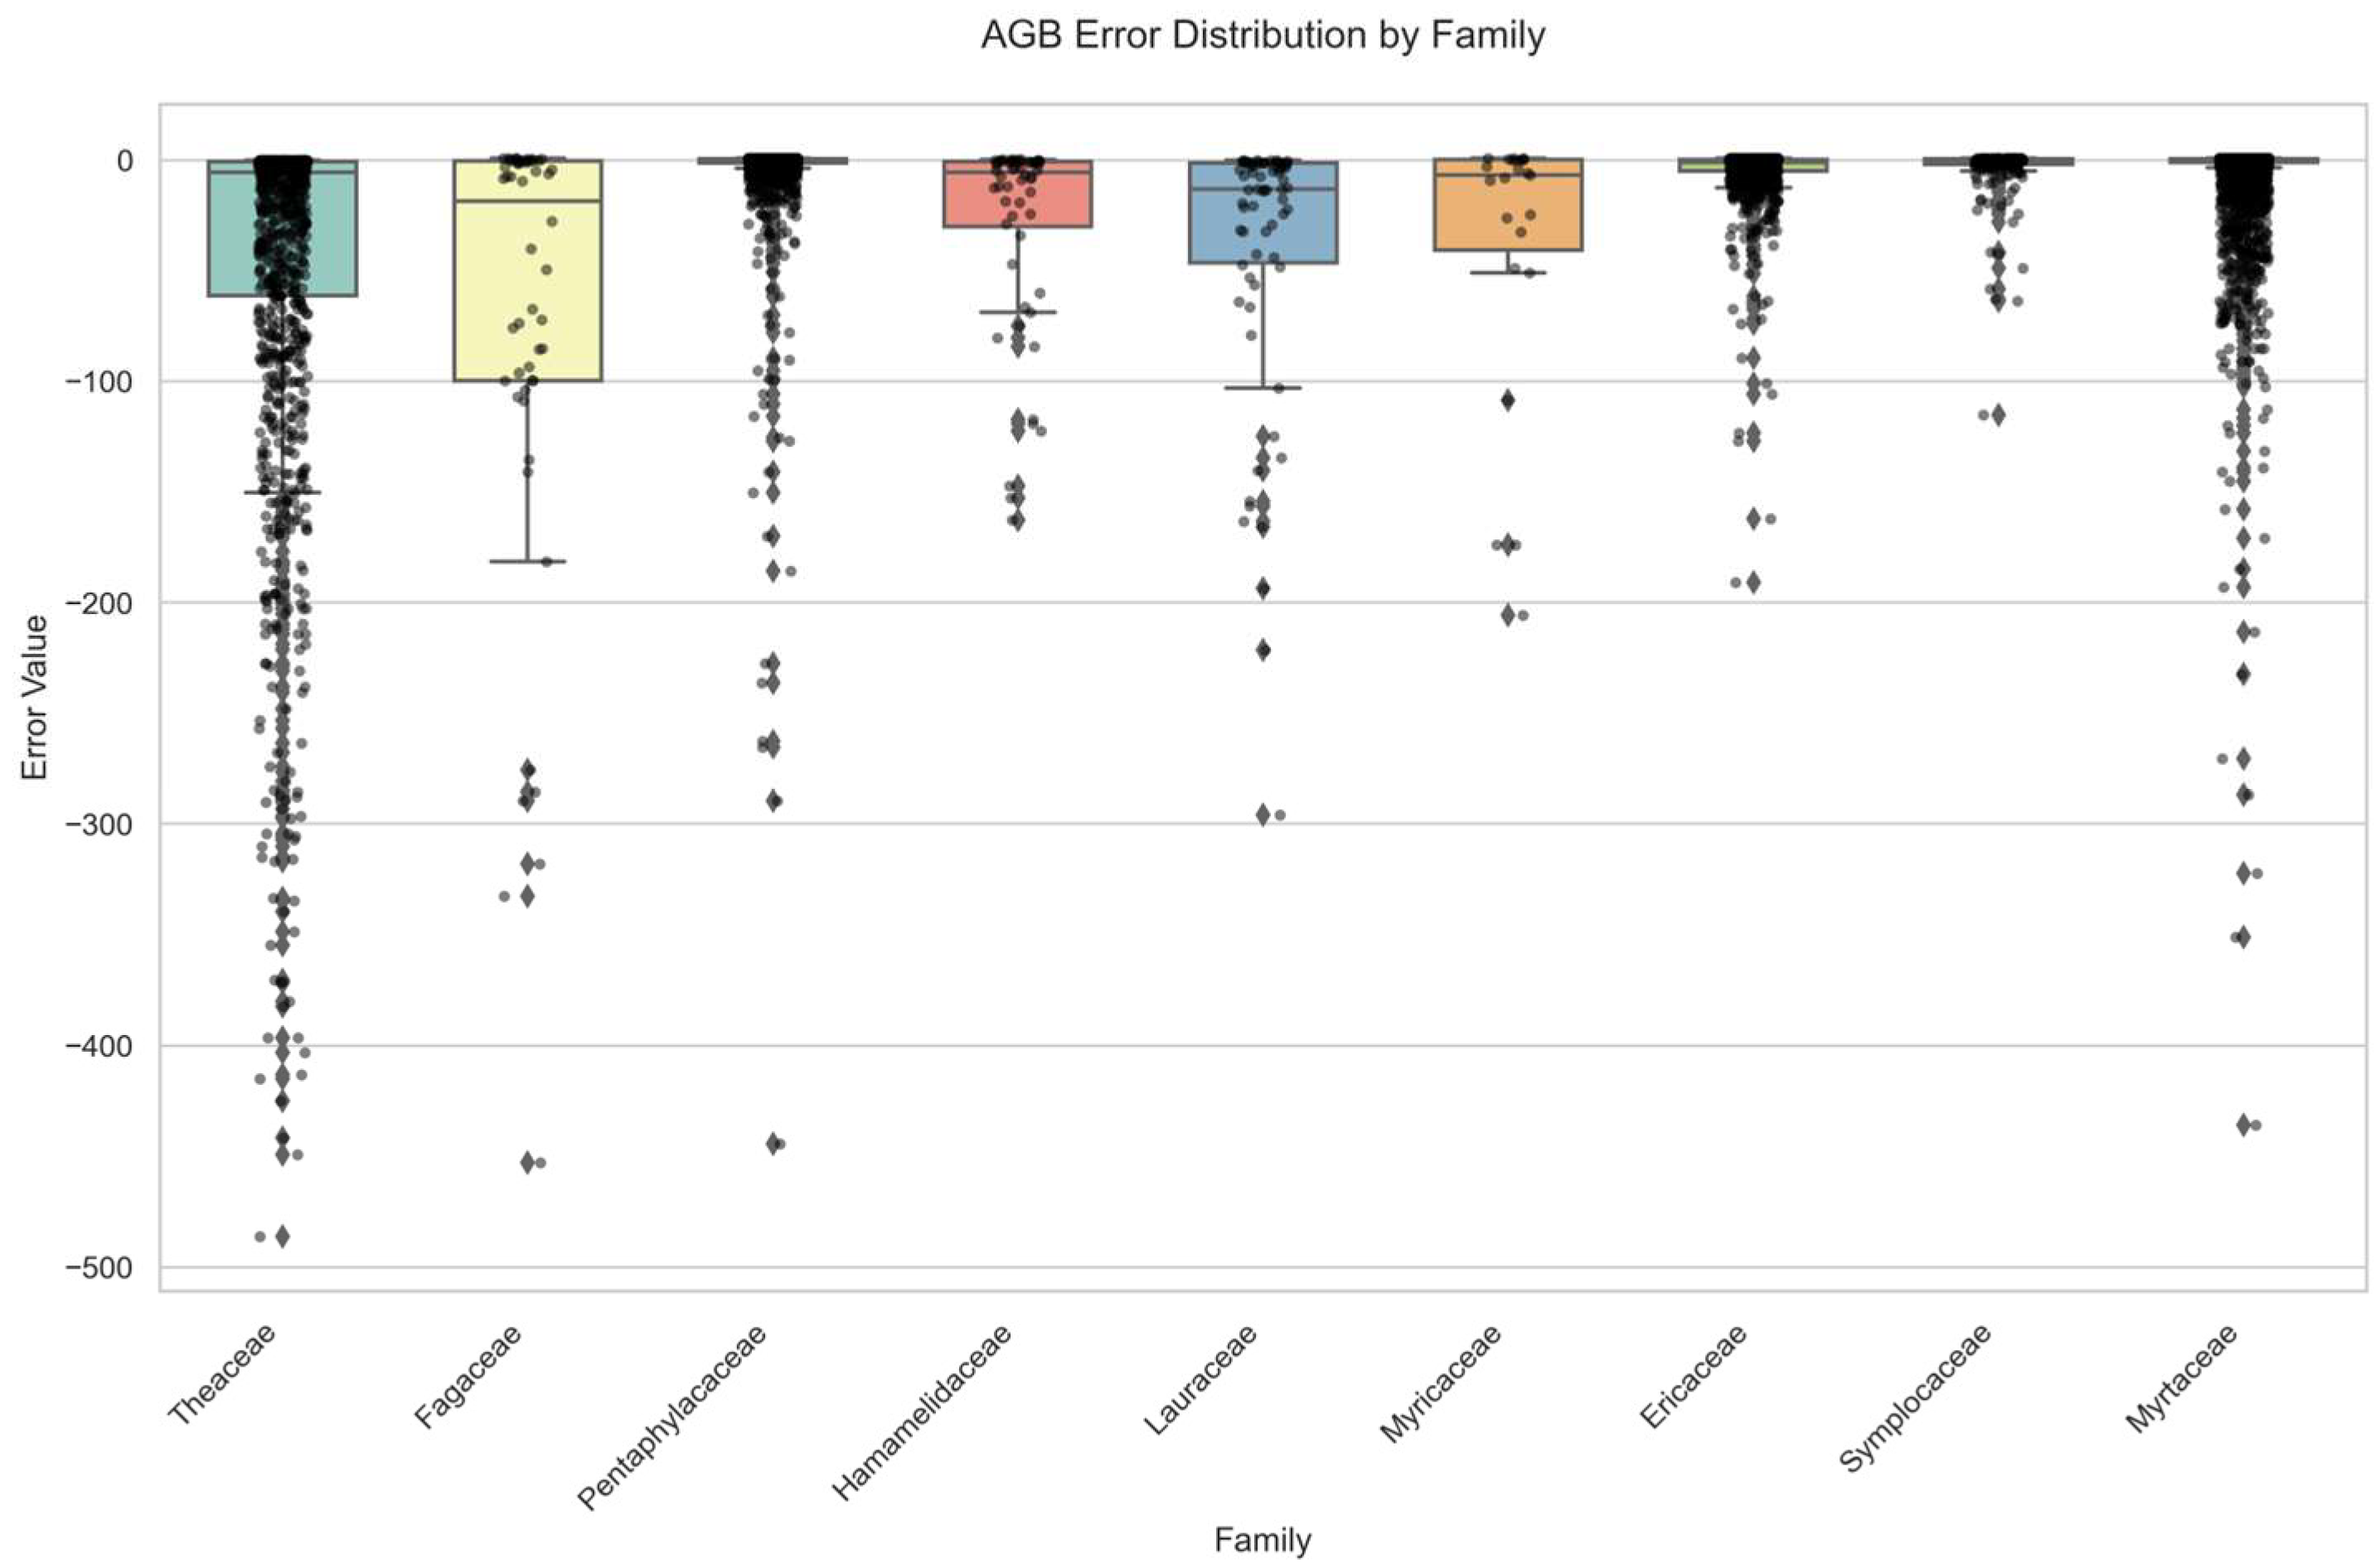
3.2. Analysis of Species Phylogenetic Error
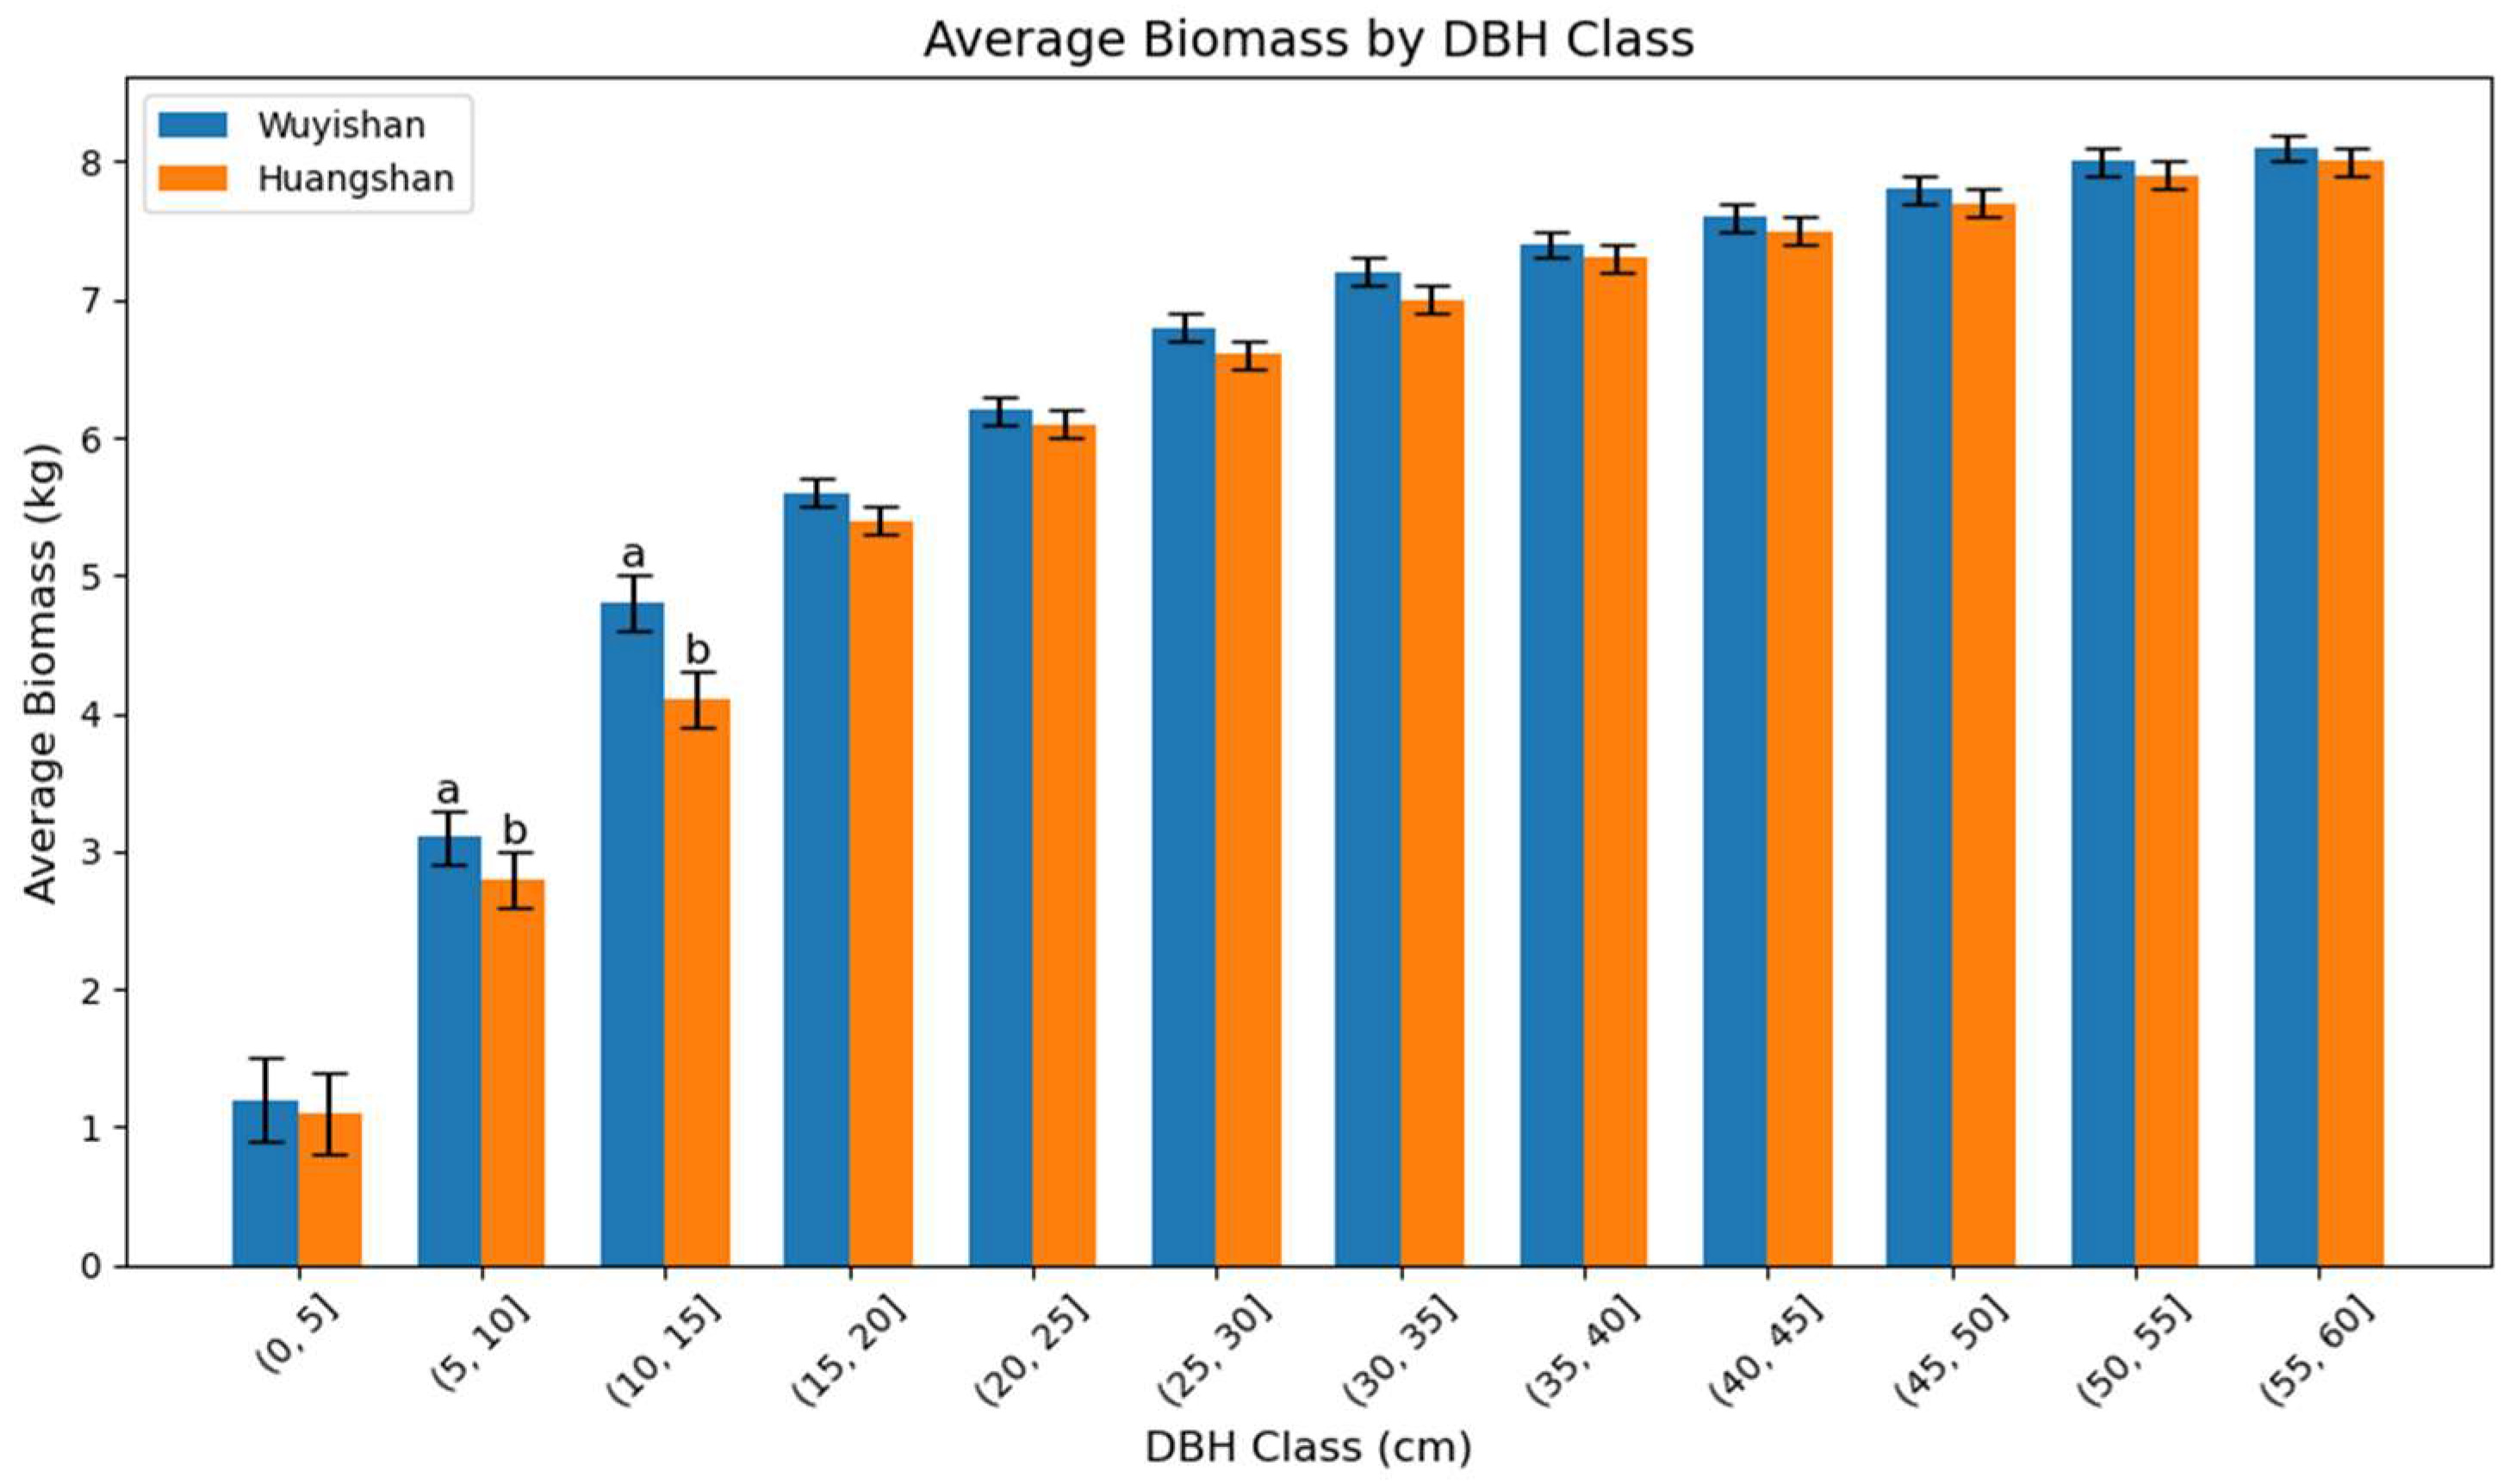
3.3. Analysis of Species Ontogeny Errors
4. Discussion and Conclusion
4.1. Phylogenetic Signal Analysis of Allometric Equations
4.2. Ontogeny and Allometric Equations
4.3. Selection of Allometric Equations
4.4. Conclusions
Supplementary Materials
Author Contributions
Funding
Institutional Review Board Statement
Informed Consent Statement
Data Availability Statement
Conflicts of Interest
Appendix A

| DBH Class (cm) | T-Statistic | p-Value |
|---|---|---|
| (0–5] | 1.960 | 0.050 * |
| (5–10] | −6.059 | <0.001 *** |
| (10–15] | −3.588 | 0.0004 *** |
| (15–20] | −0.549 | 0.584 |
| (20–25] | 0.541 | 0.589 |
| (25–30] | −1.320 | 0.190 |
| (30–35] | 1.017 | 0.312 |
| (35–40] | 1.181 | 0.244 |
| (40–45] | 1.320 | 0.198 |
| (45–50] | 0.033 | 0.974 |
| (50–55] | 1.173 | 0.271 |
| (55–60] | −1.634 | 0.141 |
References
- Georgia, G.; Dimitris, Z.; Ioannis, G.; Kalliopi, R.; Vassilia, K.; Maria, T.S.; Iain, W.; Giorgos, M. Vegetation biomass estimation with remote sensing: Focus on forest and other wooded land over the Mediterranean ecosystem. Int. J. Remote Sens. 2017, 38, 1940–1966. [Google Scholar]
- Zhao, M.; Yang, J.; Zhao, N.; Liu, Y.; Wang, Y.; Wilson, J.P.; Yue, T. Estimation of China’s forest stand biomass carbon sequestration based on the continuous biomass expansion factor model and seven forest inventories from 1977 to 2013. For. Ecol. Manag. 2019, 448, 528–534. [Google Scholar] [CrossRef]
- Cheng, D.; Zhong, Q.; Niklas, K.J.; Ma, Y.; Yang, Y.; Zhang, J. Isometric scaling of above-and below-ground biomass at the individual and community levels in the understorey of a sub-tropical forest. Ann. Bot. 2015, 115, 303–313. [Google Scholar] [CrossRef] [PubMed]
- Cheng, Y.; Zhang, C.; Zhao, X.; Gadow, K. Biomass-dominant species shape the productivity-diversity relationship in two temperate forests. Ann. For. Sci. 2018, 75, 97. [Google Scholar] [CrossRef]
- Pesola, L.; Cheng, X.; Sanesi, G.; Colangelo, G.; Elia, M.; Lafortezza, R. Linking above-ground biomass and biodiversity to stand development in urban forest areas: A case study in Northern Italy. Landsc. Urban Plan. 2017, 157, 90–97. [Google Scholar] [CrossRef]
- Rozendaal, D.M.A.; Chazdon, R.L.; Arreola-Villa, F.; Balvanera, P.; Bentos, T.V.; Dupuy, J.M.; Hernández-Stefanoni, L.J.; Jakovac, C.C.; Lebrija-Trejos, E.E.; Lohbeck, M.; et al. Demographic drivers of aboveground biomass dynamics during secondary succession in neotropical dry and wet forests. Ecosystems 2017, 20, 340–353. [Google Scholar] [CrossRef]
- Adler, P.B.; Seabloom, E.W.; Borer, E.T.; Hillebrand, H.; Hautier, Y.; Hector, A.; Harpole, W.S.; O’Halloran, L.R.; Grace, J.B.; Anderson, T.M.; et al. Productivity is a poor predictor of plant species richness. Science 2011, 333, 1750–1753. [Google Scholar] [CrossRef]
- Lauchlan, H.F.; Jason, P.; Anke, J.; Marcelo, S.; Martin, Z.; Diana, A.; Sandor, B.; Carl, B.; Jonathan, A.B.; Alex, B.; et al. Worldwide evidence of a unimodal relationship between productivity and plant species richness. Science 2015, 349, 302–305. [Google Scholar] [CrossRef]
- Liang, J.; Crowther, T.W.; Picard, N.; Wiser, S.; Zhou, M.; Alberti, G.; Schulze, E.D.; McGuire, A.D.; Bozzato, F.; Pretzsch, H.; et al. Positive biodiversity-productivity relationship predominant in global forests. Science 2016, 354, aaf8957. [Google Scholar] [CrossRef]
- Brockerhoff, E.G.; Barbaro, L.; Castagneyrol, B.; Forrester, D.I.; Gardiner, B.; González-Olabarria, J.R.; Lyver, P.O.; Meurisse, N.; Oxbrough, A.; Taki, H.; et al. Forest biodiversity, ecosystem functioning and the provision of ecosystem services. Biodivers. Conserv. 2017, 26, 3005–3035. [Google Scholar] [CrossRef]
- Ma, T.; Zhang, C.; Ji, L.; Zuo, Z.; Beckline, M.; Hu, Y.; Li, X.; Xiao, X. Development of forest aboveground biomass estimation, its problems and future solutions: A review. Ecol. Indic. 2024, 159, 111653. [Google Scholar] [CrossRef]
- Cai, T.; Chang, C.; Zhao, Y.; Wang, X.; Yang, J.; Dou, P.; Otgonbayar, M.; Zhang, G.; Zeng, Y.; Wang, J. Within-season estimates of 10 m aboveground biomass based on Landsat, Sentinel-2 and PlanetScope data. Sci. Data 2024, 11, 1276. [Google Scholar] [CrossRef]
- Ali, A.; Chen, H.Y.; You, W.H.; Yan, E.R. Multiple abiotic and biotic drivers of aboveground biomass shift with forest stratum. For. Ecol. Manag. 2019, 436, 1–10. [Google Scholar] [CrossRef]
- Yao, Y. Spatial pattern of forest aboveground biomass and its environmental influencing factors in Qinling-Daba Mountains, central China. Sci. Rep. 2024, 14, 21411. [Google Scholar] [CrossRef] [PubMed]
- Gwal, S.; Singh, S.; Gupta, S.; Anand, S. Understanding forest biomass and net primary productivity in Himalayan ecosystem using geospatial approach. Model. Earth Syst. Environ. 2020, 6, 2517–2534. [Google Scholar] [CrossRef]
- Chave, J.; Andalo, C.; Brown, S.; Cairns, M.A.; Chambers, J.Q.; Eamus, D.; Fölster, H.; Fromard, F.; Higuchi, N.; Kira, T.; et al. Tree allometry and improved estimation of carbon stocks and balance in tropical forests. Oecologia 2005, 145, 87–99. [Google Scholar] [CrossRef]
- Meng, Q.; Cieszewski, C.J.; Madden, M.; Borders, B. Linear mixed-effects model of biomass and volume of trees using Landsat ETM+ images. For. Ecol. Manag. 2007, 244, 93–101. [Google Scholar] [CrossRef]
- Tošković, D.; Veličković, M. Comparison of allometric relationships and morphological differences in Tilia cordata Mill. outer leaves exposed to different environmental conditions. Plant Biosyst. 2013, 147, 611–619. [Google Scholar] [CrossRef]
- Hornung-Leoni, C.; Sosa, V. Morphological variation in Puya (Bromeliaceae):an allometric study. Plant Syst. Evol. 2006, 256, 35–53. [Google Scholar] [CrossRef]
- Rudgers, J.A.; Hallmark, A.; Baker, S.R.; Baur, L.; Hall, K.M.; Litvak, M.E.; Muldavin, E.H.; Pockman, W.T.; Whitney, K.D. Sensitivity of dryland plant allometry to climate. Funct. Ecol. 2019, 33, 2290–2303. [Google Scholar] [CrossRef]
- Coletta, V.; Menguzzato, G.; Pellicone, G.; Veltri, A.; Marziliano, P.A. Effect of thinning on above-ground biomass accumulation in a Douglas-fir plantation in southern Italy. J. For. Res. 2016, 27, 1313–1320. [Google Scholar] [CrossRef]
- Gonçalves, A.C.; Sousa, A.M.O.; Mesquita, P.G. Estimation and dynamics of above ground biomass with very high resolution satellite images in Pinus pinaster stands. Biomass Bioenergy 2017, 106, 146–154. [Google Scholar] [CrossRef]
- Aneseyee, A.B.; Soromessa, T.; Elias, E.; Feyisa, G.L. Allometric equations for selected Acacia species (Vachellia and Senegalia genera) of Ethiopia. Carbon Balance Manag. 2021, 16, 34. [Google Scholar] [CrossRef]
- Pothong, T.; Elliott, S.; Chairuangsri, S.; Chanthorn, W.; Shannon, D.P.; Wangpakapattanawong, P. New allometric equations for quantifying tree biomass and carbon sequestration in seasonally dry secondary forest in northern Thailand. New For. 2022, 53, 17–36. [Google Scholar] [CrossRef]
- Gaui, T.D.; Cysneiros, V.C.; Souza, F.C.; Souza, H.J.; Filho, T.B.S.; Carvalho, D.C.; Pace, J.H.C.; Vidaurre, G.B.; Miguel, E.P. Biomass Equations and Carbon Stock Estimates for the Southeastern Brazilian Atlantic Forest. Forests 2024, 15, 1568. [Google Scholar] [CrossRef]
- Wang, C. Biomass allometric equations for 10 co-occurring tree species in Chinese temperate forests. For. Ecol. Manag. 2006, 222, 9–16. [Google Scholar] [CrossRef]
- He, H.; Zhang, C.; Zhao, X.; Fousseni, F.; Wang, J.; Dai, H.; Yang, S.; Zuo, Q. Allometric biomass equations for 12 tree species in coniferous and broadleaved mixed forests, Northeastern China. PLoS ONE 2018, 13, e0186226. [Google Scholar] [CrossRef]
- Xiang, W.; Li, L.; Ouyang, S.; Xiao, W.; Zeng, L.; Chen, L.; Lei, P.; Deng, X.; Zeng, Y.; Fang, J. ForresterDI Effects of stand age on tree biomass partitioning and allometric equations in Chinese fir (Cunninghamia lanceolata) plantations. Eur. J. For. Res. 2021, 140, 317–332. [Google Scholar] [CrossRef]
- Ali, A.; Xu, M.S.; Zhao, Y.T.; Zhang, Q.Q.; Zhou, L.L.; Yang, X.D.; Yan, E.R. Allometric biomass equations for shrub and small tree species in subtropical China. Silva Fenn. 2015, 49, 1275. [Google Scholar] [CrossRef]
- Peng, S.; He, N.; Yu, G.; Wang, Q. Aboveground biomass estimation at different scales for subtropical forests in China. Bot. Stud. 2017, 58, 45. [Google Scholar] [CrossRef]
- Davies, S.J.; Abiem, I.; Salim, K.A.; David, S.A.; Allen, D.; Alonso, A.; Anderson-Teixeira, K.; Andrade, A.; Arellano, G.; Ashton, P.S.; et al. ForestGEO: Understanding forest diversity and dynamics through a global observatory network. Biol. Conserv. 2021, 253, 108907. [Google Scholar] [CrossRef]
- Ji, B.; Yin, J.; Shi, Y.; Xu, L.; Tao, J.; Zhou, Y. Predicting Vegetation Carbon Density Distribution in different Terrains in Subtropical Forests in China. J. Sustain. For. 2021, 40, 473–490. [Google Scholar] [CrossRef]
- Xu, L.; Shi, Y.; Fang, H. Vegetation carbon stocks driven by canopy density and forest age in subtropical forest ecosystems. Sci. Total Environ. 2018, 631, 619–626. [Google Scholar] [CrossRef] [PubMed]
- Huang, X.Z.; Li, F.B.; Wang, Z.X.; Jin, Y.; Qian, H. Are allometric model parameters of aboveground biomass for trees phylogenetically constrained? Plant Divers. 2023, 45, 229–233. [Google Scholar] [CrossRef]
- Yang, M.; Zhou, X.; Peng, C.; Li, T.; Chen, K.; Liu, Z.; Li, P.; Zhang, C.; Tang, J.; Zou, Z. Developing allometric equations to estimate forest biomass for tree species categories based on phylogenetic relationships. For. Ecosyst. 2023, 10, 100130. [Google Scholar] [CrossRef]
- Huang, C.; Feng, C.; Ma, Y.; Liu, H.; Wang, Z.; Yang, S.; Wang, W.; Fu, S.; Chen, H.Y.H. Allometric models for aboveground biomass of six common subtropical shrubs and small trees. J. For. Res. 2021, 33, 1317–1328. [Google Scholar] [CrossRef]
- Felsenstein, J. Phylogenies and the comparative method. Am. Nat. 1985, 125, 1–15. [Google Scholar] [CrossRef]
- Garland, T.; Ives, A.R. Using the past to predict the present: Confidence intervals for regression equations in phylogenetic comparative methods. Am. Nat. 2000, 155, 346–364. [Google Scholar] [CrossRef]
- Voje, K.L.; Hansen, T.F.; Egset, C.K.; Bolstad, G.H.; Pélabon, C. Allometric constraints and the evolution of allometry. Evolution 2014, 68, 866–885. [Google Scholar] [CrossRef]
- Pélabon, C.; Firmat, C.; Bolstad, G.H.; Voje, K.L.; Houle, D.; Cassara, J.; Rouzic, A.L.; Hansen, T.F. Evolution of morphological allometry. Ann. N. Y. Acad. Sci. 2014, 1320, 58–75. [Google Scholar] [CrossRef]
- Gould, S.J. Ontogeny and Phylogeny; Harvard University Press: Cambridge, MA, USA, 1977. [Google Scholar]
- Klingenberg, C.P. Size, shape, and form: Concepts of allometry in geometric morphometrics. Dev. Genes Evol. 2016, 226, 113–137. [Google Scholar] [CrossRef]
- Ding, H.; Fang, Y.; Yang, X.; Yuan, F.; He, L.; Yao, J.; Wu, J.; Chi, B.; Li, Y.; Chen, S.; et al. Community characteristics of a subtropical evergreen broad-leaved forest in Huangshan, Anhui Province, East China. Biodivers. Sci. 2016, 24, 875. [Google Scholar] [CrossRef]
- Chen, S.; Xie, L.; Zhou, W.; Chen, H.; Xu, X.; Jiang, S.; Zang, M.; Peng, Y.; Chen, X.; Duan, Y.; et al. Species diversity has a positive interrelationship with aboveground biomass and a mismatch with productivity in a subtropical broadleaf forest on the Wuyi Mountains, China. Diversity 2022, 14, 952. [Google Scholar] [CrossRef]
- Xie, L.; Chen, H.; Wei, L.; Chen, S.; Wang, L.; Xu, B.; Yi, X.; Wang, X.; Ding, H.; Fang, Y. Scale-dependent effects of species diversity on aboveground biomass and productivity in a subtropical broadleaved forest on Mt. Huangshan. Ecol. Evol. 2023, 13, e9786. [Google Scholar] [CrossRef] [PubMed]
- Pu, Y.; Li, Z.; Wang, R.; Wang, S.; Hu, Y.; Zhang, L.; Kong, F.; Zhang, L.; Chen, J.; Li, H.; et al. Guidelines for Carbon Measurement and Monitoring Technologies in Economic Forests: T/CSF 012-2023; China Forestry Society: Beijing, China, 2023. [Google Scholar]
- Fu, X.; Zhang, Y.; Wang, X. Prediction of Forest Biomass Carbon Pools and Carbon Sequestration Potential in China by 2060. For. Sci. 2022, 58, 32–41. (In Chinese) [Google Scholar]
- Li, X. Relative Growth and Allocation of Common Understory Biomass in the Natural Secondary Forest of Mao’er Mountain. Master’s Thesis, Northeast Forestry University, Harbin, China, 2010. (In Chinese). [Google Scholar]
- Liu, G.; Fu, B.; Fang, J. Carbon Dynamics of Forests in China and Their Contribution to Global Carbon Balance. Acta Ecol. Sin. 2000, 20, 733–740. (In Chinese) [Google Scholar]
- Liu, J.; Ni, J. A Comparative Study on Modeling the General Biomass Relative Growth Equations for Major Tree Species in China. Quat. Res. 2021, 41, 1169–1180. (In Chinese) [Google Scholar]
- Ma, X.; Wang, Z. An Estimate of Forest Carbon Sequestration by Province in China. Sci. Bull. 2011, 56, 433–439. (In Chinese) [Google Scholar] [CrossRef]
- Wu, S.; Zhu, J.; He, Y. Guidelines for Carbon Stock Measurement in Forest Ecosystems: LY/T 2988—2018; National Forestry and Grassland Administration: Beijing, China, 2018. [Google Scholar]
- Yuan, W.; Jiang, B.; Ge, Y.; Zhu, J.; Shen, A. Study on Biomass Models of Key Public Welfare Forests in Zhejiang Province. Zhejiang For. Sci. Technol. 2009, 29, 1–5. (In Chinese) [Google Scholar]
- Abdul-Hamid, H.; Mohamad-Ismail, F.N.; Mohamed, J.; Samdin, Z.; Abiri, R.; Tuan-Ibrahim, T.M.; Mohammad, L.S.; Jalil, A.M.; Naji, H.R. Aboveground biomass estimation of mixed mature mangrove forest. Forests 2022, 13, 325. [Google Scholar] [CrossRef]
- Abich, A.; Mucheye, T.; Tebikew, M.; Gebremariam, Y.; Alemu, A. Species-specific allometric equations for improving aboveground biomass estimates of dry deciduous woodland ecosystems. J. For. Res. 2019, 30, 1619–1632. [Google Scholar] [CrossRef]
- Altanzagas, B.; Luo, Y.; Altansukh, B.; Dorjsuren, C.; Fang, J.; Hu, H. Allometric Equations for Estimating the Above-Ground Biomass of Five Forest Tree Species in Khangai, Mongolia. Forests 2019, 10, 661. [Google Scholar] [CrossRef]
- Ameztegui, A.; Rodrigues, M.; Granda, V. Uncertainty of biomass stocks in Spanish forests: A comprehensive comparison of allometric equations. Eur. J. For. Res. 2022, 141, 395–407. [Google Scholar] [CrossRef]
- Basuki, T.M.; Leksono, B.; Baral, H.; Andini, S.; Wahyuni, N.S.; Artati, Y.; Choi, E.; Shin, S.; Kim, R.; Yang, A.; et al. Allometric equations for the biomass estimation of Calophyllum inophyllum L. in Java, Indonesia. Forests 2022, 13, 1057. [Google Scholar] [CrossRef]
- Bond-Lamberty, B.; Wang, C.; Gower, S.T. Aboveground and belowground biomass and sapwood area allometric equations for six boreal tree species of northern Manitoba. Can. J. For. Res. 2002, 32, 1441–1450. [Google Scholar] [CrossRef]
- Cao, L.; Zhang, Z.; Yun, T.; Wang, G.; Ruan, H.; She, G. Estimating tree volume distributions in subtropical forests using airborne LiDAR data. Remote Sens 2019, 11, 97. [Google Scholar] [CrossRef]
- Chambers, J.Q.; Dos Santos, J.; Ribeiro, R.J.; Higuchi, N. Tree damage, allometric relationships, and aboveground net primary production in central Amazon forest. For. Ecol. Manag. 2001, 152, 73–84. [Google Scholar] [CrossRef]
- Chave, J.; Riéra, B.; Dubois, M.A. Estimation of biomass in a neotropical forest of French Guiana: Spatial and temporal variability. J. Trop. Ecol. 2001, 17, 79–96. [Google Scholar] [CrossRef]
- Chave, J.; Condit, R.; Lao, S.; Caspersen, J.P.; Foster, R.B.; Hubbell, S.P. Spatial and temporal variation of biomass in a tropical forest: Results from a large census plot in Panama. J. Ecol. 2003, 91, 240–252. [Google Scholar] [CrossRef]
- Chave, J.; Coomes, D.; Jansen, S.; Lewis, S.L.; Swenson, N.G.; Zanne, A.E. Towards a worldwide wood economics spectrum. Ecol. Lett. 2009, 12, 351–366. [Google Scholar] [CrossRef]
- Chave, J.; Ejou-Mechain, M.; Burquez, A.; Chidumayo, E.; Colgan, M.S.; Delitti, W.B.; Duque, A.; Eid, T.; Fearnside, P.M.; Goodman, R.C.; et al. Improved allometric models to estimate the aboveground biomass of tropical trees. Glob. Change Biol. 2015, 20, 3177–3190. [Google Scholar] [CrossRef]
- Chen, J.; Fang, X.; Wu, A.; Xiang, W.; Lei, P.; Ouyang, S. Allometric equations for estimating biomass of natural shrubs and young trees of subtropical forests. New Forests 2023, 55, 15–46. [Google Scholar] [CrossRef]
- Cushman, K.C.; Muller-Landau, H.C.; Condit, R.S.; Hubbell, S.P. Improving estimates of biomass change in buttressed trees using tree taper models. Methods Ecol. Evol. 2014, 5, 573–582. [Google Scholar] [CrossRef]
- Daryaei, A.; Sohrabi, H.; Puerta-Piñero, C. How does light availability afect the aboveground biomass allocation and leaf morphology of saplings in temperate mixed deciduous forests? New For. 2019, 50, 409–422. [Google Scholar] [CrossRef]
- Dickinson, Y.; Zenner, E.K. Allometric Equations for the aboveground biomass of selected common eastern hardwood understory species. North. J. Appl. For. 2010, 27, 160–165. [Google Scholar] [CrossRef]
- Djomo, A.N.; Ibrahima, A.; Saborowski, J.; Gravenhorst, G. Allometric equations for biomass estimations in Cameroon and pan moist tropical equations including biomass data from Africa. For. Ecol. Manag. 2010, 260, 1873–1885. [Google Scholar] [CrossRef]
- Fang, J.; Chen, A.; Peng, C.; Zhao, S.; Ci, L. Changes in forest biomass carbon storage in China between 1949 and 1998. Science 2001, 292, 2320–2322. [Google Scholar] [CrossRef]
- Fang, J.; Guo, Z.; Hu, H.; Kato, T.; Muraoka, H.; Son, Y. Forest biomass carbon sinks in east Asia, with special reference to the relative contributions of forest expansion and forest growth. Glob. Change Biol. 2014, 20, 2019–2030. [Google Scholar] [CrossRef]
- Fang, Y.; Leung, L.R.; Koven, C.D.; Bisht, G.; Detto, M.; Cheng, Y.; McDowell, N.; Muller-Landau, H.; Wright, S.J.; Chambers, J.Q. Modeling the topographic influence on aboveground biomass using a coupled model of hillslope hydrology and ecosystem dynamics. Geosci. Model Dev. 2022, 15, 7879–7901. [Google Scholar] [CrossRef]
- Feyisa, K.; Beyene, S.; Megersa, B.; Said, M.Y.; Angassa, A. Allometric equations for predicting above-ground biomass of selected woody species to estimate carbon in East African rangelands. Agroforest Syst. 2018, 92, 599–621. [Google Scholar] [CrossRef]
- Fayolle, A.; Doucet, J.L.; Gillet, J.F.; Bourland, N.; Lejeune, P. Tree allometry in Central Africa: Testing the validity of pantropical multi-species allometric equations for estimating biomass and carbon stocks. For. Ecol. Manag. 2013, 305, 29–37. [Google Scholar] [CrossRef]
- He, A.; McDermid, G.J.; Rahman, M.M.; Strack, M.; Saraswati, S.; Xu, B. Developing allometric equations for estimating shrub biomass in a boreal fen. Forests 2018, 9, 569. [Google Scholar] [CrossRef]
- Henry, M.; Picard, N.; Trotta, C.; Manlay, R.; Valentini, R.; Bernoux, M.; Saint André, L. Estimating tree biomass of sub-saharan african forests: A review of available allometric equations. Silva Fenn. 2011, 45, 477–569. [Google Scholar] [CrossRef]
- Henry, M.; Bombelli, A.; Trotta, C.; Alessandrini, A.; Birigazzi, L.; Sola, G.; Vieilledent, G.; Santenoise, P.; Longuetaud, F.; Valentini, R.; et al. GlobAllomeTree: International platform for tree allometric equations to support volume, biomass and carbon assessment. iForest 2013, 6, 326–330. [Google Scholar] [CrossRef]
- Hughes, R.F.; Kauffman, J.B.; Jaramillo, V.J. Biomass, carbon, and nutrient dynamics of secondary forests in a humid tropical region of México. Ecology 1999, 80, 1897–1907. [Google Scholar]
- Huy, B.; Kralicek, K.; Poudel, K.P.; Phuong, V.T.; Van Khoa, P.; Hung, N.D.; Temesgen, H. Allometric equations for estimating tree aboveground biomass in evergreen broadleaf forests of Viet Nam. For. Ecol. Manag. 2016, 382, 193–205. [Google Scholar] [CrossRef]
- Ishihara, M.I.; Utsugi, H.; Tanouchi, H.; Aiba, M.; Kurokawa, H.; Onoda, Y.; Nagano, M.; Umehara, T.; Ando, M.; Miyata, R.; et al. Efficacy of generic allometric equations for estimating biomass: A test in Japanese natural forests. Ecol. Appl. 2015, 25, 1433–1446. [Google Scholar] [CrossRef]
- Jiang, J.; Lu, Y.C.; Wang, L.; Liu, X.; Cai, D.; Jia, H.; Ming, A.; Chen, B. Facilitation by tree species in variable retention harvesting for the restoration of monoculture plantations in Southern China. Trop. Conserv. Sci. 2019, 12, 1940082918824836. [Google Scholar] [CrossRef]
- Kalita, R.M.; Das, A.K.; Nath, A.J. Allometric equations for estimating above- and belowground biomass in Tea (Camellia sinensis (L.) O. Kuntze) agroforestry system of Barak Valley, Assam, northeast India. Biomass Bioenergy 2015, 83, 42–49. [Google Scholar] [CrossRef]
- Kenzo, T.; Furutani, R.; Hattori, D.; Kendawang, J.J.; Tanaka, S.; Sakurai, K.; Ninomiya, I. Allometric equations for accurate estimation of above-ground biomass in logged-over tropical rainforests in Sarawak, Malaysia. J. For. Res. 2009, 14, 365–372. [Google Scholar] [CrossRef]
- Kim, C.; Baek, G.; Yoo, B.O.; Jung, S.Y.; Lee, K.S.; An, K.W. Comparison of allometric equations and biomass expansion factors for six evergreen broad-leaved trees in subtropical forests in southern Korea. J. Sustain. For. 2019, 38, 199–212. [Google Scholar] [CrossRef]
- Kora, S.H.; Guendehou, G.S.; Assogbadjo, A.E.; Sinsin, B.; Goussanou, C.A. Allometric equations from a non-destructive approach for biomass prediction in natural forest and plantation in West Africa. South. For. A J. For. Sci. 2019, 81, 111–122. [Google Scholar] [CrossRef]
- Lin, K.; Lyu, M.; Jiang, M.; Chen, Y.; Li, Y.; Chen, G.; Xie, J.; Yang, Y. Improved allometric equations for estimating biomass of the three Castanopsis carlesii H. forest types in subtropical China. New For. 2017, 48, 115–135. [Google Scholar] [CrossRef]
- Liu, B.; Bu, W.; Zang, R. Improved allometric models to estimate the aboveground biomass of younger secondary tropical forests. Glob. Ecol. Conserv. 2023, 41, e02359. [Google Scholar] [CrossRef]
- Lu, J.; Feng, Z.; Zhu, Y. Estimation of forest biomass and carbon storage in china based on forest resources inventory data. Forests 2019, 10, 650. [Google Scholar] [CrossRef]
- Mahmood, H.; Siddique, M.R.H.; Akhter, M. A critical review and database of biomass and volume allometric equation for trees and shrubs of Bangladesh. IOP Conf. Ser. Earth Environ. Sci 2016, 39, 012057. [Google Scholar] [CrossRef]
- Martínez-Sánchez, J.L.; Martínez-Garza, C.; Cámara, L.; Castillo, O. Species-specific or generic allometric equations:which optionis better when estimating the biomass of Mexican tropical humid forests? Carbon Manag. 2020, 11, 241–249. [Google Scholar] [CrossRef]
- Mascaro, J.; Asner, G.P.; Muller-Landau, H.C.; van Breugel, M.; Hall, J.; Dahlin, K. Controls over aboveground forest carbon density on Barro Colorado Island, Panama. Biogeosciences 2011, 8, 1615–1629. [Google Scholar] [CrossRef]
- Meng, S.; Liu, Q.; Zhou, G.; Jia, Q.; Zhuang, H.; Zhou, H. Aboveground tree additive biomass equations for two dominant deciduous tree species in Daxing’anling, northernmost China. J. For. Res. 2017, 22, 233–240. [Google Scholar] [CrossRef]
- Mensah, S.; Veldtman, R.; Seifert, T. Allometric models for height and aboveground biomass of dominant tree species in South African Mistbelt forests. South. For. A J. For. Sci. 2017, 79, 19–30. [Google Scholar] [CrossRef]
- Ouyang, S.; Xiang, W.; Wang, X.; Zeng, Y.; Lei, P.; Deng, X.; Peng, C. Significant effects of biodiversity on forest biomass during the succession of subtropical forest in south China. For. Ecol. Manag. 2016, 372, 291–302. [Google Scholar] [CrossRef]
- Ouyang, S.; Xiang, W.; Wang, X.; Xiao, W.; Chen, L.; Li, S.; Sun, H.; Deng, X.; Forrester, D.I.; Zeng, L.; et al. Effects of stand age, richness and density on productivity in subtropical forests in China. J. Ecol. 2019, 107, 2266–2277. [Google Scholar] [CrossRef]
- Carreras Pereira, K.A.; Wolf, A.A.; Kou-Giesbrecht, S.; Akana, P.R.; Funk, J.L.; Meng, D.N.L. Allometric relationships for eight species of 4–5 year old nitrogen-fixing and non-fixing trees. PLoS ONE 2023, 18, e0289679. [Google Scholar] [CrossRef]
- Pan, Y.; Birdsey, R.A.; Fang, J.; Houghton, R.; Kauppi, P.E.; Kurz, W.A.; Phillips, O.L.; Shvidenko, A.; Lewis, S.L.; Canadell, J.G.; et al. A large and persistent carbon sink in the world’s forests. Science 2011, 333, 988–993. [Google Scholar] [CrossRef]
- Réjou-Méchain, M.; Cornu, G.; Pere, A.; Tanguy, A.; Piponiot, C.; Herault, B.; Chave, J.; Feldpausch, T.; Verley, P. Biomass: An R package for estimating above-ground biomass and its uncertainty in tropical forests. Methods Ecol. Evol. 2017, 8, 1163–1167. [Google Scholar] [CrossRef]
- Ren, S.; Yang, Q.; Liu, H.; Shen, H.; Zheng, Z.; Zhou, S.; Liang, M.; Yin, H.; Zhou, Z.; Wang, X. The driving factors of subtropical mature forest productivity: Stand structure matters. Forests 2021, 12, 998. [Google Scholar] [CrossRef]
- Rojas-García, F.; De Jong, B.H.J.; Martínez-Zurimendí, P.; Paz-pellat, F. Database of 478 allometric equations to estimate biomass for Mexican trees and forests. Ann. For. Sci. 2015, 72, 835–864. [Google Scholar] [CrossRef]
- Romero, F.M.B.; Jacovine, L.A.G.; Ribeiro, S.C.; Ribeiro, S.C.; Torres, C.M.M.E.; Silva, L.F.D.; Gaspar, R.D.O.; Silva Soares da Rocha, S.J.; Staydhammer, C.L.; Fearnside, P.M. Allometric equations for volume, biomass, and carbon in commercial stems harvested in a managed forest in the southwestern amazon: A case study. Forests 2021, 11, 874. [Google Scholar] [CrossRef]
- Ruiz-Peinado, R.; del Rio, M.; Montero, G. New models for estimating the carbon sink capacity of Spanish softwood species. For. Syst. 2011, 20, 176–188. [Google Scholar] [CrossRef]
- Ruiz-Peinado, R.; Montero, G.; del Rio, M. Biomass models to estimate carbon stocks for hardwood tree species. Forest Systems 2012, 21, 42–52. [Google Scholar] [CrossRef]
- Satdichanh, M.; Ma, H.; Yan, K.; Dossa, G.G.O.; Winowiecki, L.; Vagen, T.G.; Gassner, A.; Xu, J.; Harrison, R. Phylogenetic diversity correlated with above-ground biomass production during forest succession: Evidence from tropical forests in Southeast Asia. J. Ecol. 2019, 107, 1419–1432. [Google Scholar] [CrossRef]
- Schmidt, A.; Poulain, M.; Klein, D.; Krause, K.; Peña-Rojaset, K.; Schmidt, H.; Schulte, A. Allometric above-belowground biomass equations for Nothofagus pumilio (Poepp. & Endl.) natural regeneration in the Chilean Patagonia. Ann. For. Sci. 2009, 66, 513. [Google Scholar] [CrossRef]
- Singh, V.; Tewari, A.; Kushwaha, S.P.S.; Dadhwal, V.K. Formulating allometric equations for estimating biomass and carbon stock in small diameter trees. For. Ecol. Manag. 2011, 261, 1945–1949. [Google Scholar] [CrossRef]
- Smith, A.R.; Lukac, M.; Hood, R.; Healey, J.R.; Miglietta, F.; Godbold, D.L. Elevated CO2 enrichment induces a differential biomass response in a mixed species temperate forest plantation. New Phytol. 2013, 198, 156–168. [Google Scholar] [CrossRef] [PubMed]
- Sun, H.; Wang, X.; Wu, P.; Han, W.; Xu, K.; Liang, P.; Liu, C.; Yin, W.; Xia, X. What causes greater deviations from predictions of metabolic scaling theory in earlier successional forests? For. Ecol. Manag. 2017, 405, 101–111. [Google Scholar] [CrossRef]
- Tang, X.; Fehrmann, L.; Guan, F.; Forrester, D.I.; Guisasola, R.; Pérez-Cruzado, C.; Vor, T.; Lu, Y.; Álvarez-González, J.G.; Kleinn, C. A generalized algebraic difference approach allows an improved estimation of aboveground biomass dynamics of Cunninghamia lanceolata and Castanopsis sclerophylla forests. Ann. For. Sci. 2017, 74, 12. [Google Scholar] [CrossRef]
- Tang, X.; Zhao, X.; Bai, Y.; Tang, Z.; Wang, W.; Zhao, Y.; Wan, H.; Xie, Z.; Shi, X.; Wu, B.; et al. Carbon pools in China’s terrestrial ecosystems: New estimates based on an intensive field survey. Proc. Natl. Acad. Sci. USA 2018, 115, 4021–4026. [Google Scholar] [CrossRef]
- Tiwari, R.M.; Liu, J.; Xie, Y.; Yao, S.H.; Liu, S.L.; Wu, S.M.; Liu, J.L.; Qian, H.Y.; Lei, Z.P.; Zhang, H.W.; et al. Decoupling the impact of biodiversity and environmental factors on the biomass and biomass growth of trees in subtropical forests. J. Plant Ecol. 2023, 16, rtac040. [Google Scholar] [CrossRef]
- Vargas-Larreta, B.; López-Sánchez, C.A.; Corral-Rivas, J.J.; López-Martínez, J.O.; Aguirre-Calderón, C.G.; Álvarez-González, J.G. Allometric equations for estimating biomass and carbon stocks in the temperate forests of North-Western Mexico. Forests 2017, 8, 269. [Google Scholar] [CrossRef]
- Wang, G.; Xie, B.; Lv, Y.; Yin, J.; Zhou, Y.; Xu, L.; Shi, Y. Interaction effect of stand age and diversity on aboveground wood carbon accumulation in subtropical mixed forests of the Zhejiang Province (China). Forests 2023, 14, 262. [Google Scholar] [CrossRef]
- Wang, X.; Fang, J.; Tang, Z.; Zhu, B. Climatic control of primary forest structure and DBH-height allometry in Northeast China. For. Ecol. Manag. 2006, 234, 264–274. [Google Scholar] [CrossRef]
- Xiang, W.; Zhou, J.; Ouyang, S.; Zhang, S.; Lei, P.; Li, J.; Deng, X.; Fang, X.; Forrester, D.I. Species-specific and general allometric equations for estimating tree biomass components of subtropical forests in southern China. Eur. J. For. Res. 2016, 135, 963–979. [Google Scholar] [CrossRef]
- Xing, D.; Bergeron, J.A.C.; Solarik, K.A.; Tom, M.B.; Macdonald, S.E.; Spence, J.R.; He, F. Challenges in estimating forest biomass: Use of allometric equations for three boreal tree species. Can. J. For. Res 2019, 49, 1613–1622. [Google Scholar] [CrossRef]
- Yang, H.; Wang, Z.; Tan, H.; Gao, Y. Allometric models for estimating shrub biomass in desert grassland in northern China. Rid Land Res. Manag. 2017, 31, 283–300. [Google Scholar] [CrossRef]
- Yang, T.; Song, K.; Da, L.; Li, X.; Wu, J. The biomass and aboveground net primary productivity of Schima superba–Castanopsis carlesii forests in east China. Sci. China Life Sci. 2010, 53, 811–821. [Google Scholar] [CrossRef] [PubMed]
- Roy, A.D.; Das, S.K.; Debnath, B. A non-destructive approach to develop tree-level allometric equations for estimating aboveground biomass in the forests of Tripura, Northeast India. Trop. Ecol. 2023, 64, 532–542. [Google Scholar]
- Zanne, A.E.; Lopez-Gonzalez, G.; Coomes, D.A.; Jugo, I.; Steven, J.; Simon, L.L.; Regis, B.M.; Nathan, G.S.; Michael, C.W.; Jerome, C. Data from: Towards a worldwide wood economics spectrum. Dryad 2009. [Google Scholar] [CrossRef]
- Zeng, H.; Liu, Q.; Feng, Z.; Ma, Q. Biomass equations for four shrub species in subtropical China. J. For. Res. 2010, 15, 83–90. [Google Scholar] [CrossRef]
- Zhao, H.; Li, Z.; Zhou, G.; Qiu, Z.; Wu, Z. Aboveground biomass allometric models for evergreen broad-leaved forest damaged by a serious ice storm in Southern China. Forests 2020, 11, 320. [Google Scholar] [CrossRef]
- Zubair, M.; Yasin, G.; Qazlbash, S.K.; Haq, A.U.; Jamil, A.; Yaseen, M.; Rahman, S.U.; Guo, W. Carbon Sequestration by Native Tree Species around the Industrial Areas of Southern Punjab, Pakistan. Land 2022, 11, 1577. [Google Scholar] [CrossRef]
- Li, F.; Qian, H.; Sardans, J.; Amishev, D.; Wang, Z.; Zhang, C.; Wu, T.; Tao, X.; Huang, X. Evolutionary history shapes variation of wood density of tree species across the world. Plant Divers. 2024, 46, 283–293. [Google Scholar] [CrossRef]
- Zuo, S.Z.; Ren, Y.; Weng, X.; Ding, H.; Luo, Y. Biomass relative growth models of 9 common tree species in subtropical evergreen broad-leaved forests. J. Appl. Ecol. 2015, 26, 356. (In Chinese) [Google Scholar]
- Luo, Y.; Wang, X.; Ouyang, Z.; Lu, F.; Feng, L.; Tao, J. A review of biomass equations for China’s tree species. Earth Syst. Sci. Data 2020, 12, 21–40. [Google Scholar] [CrossRef]
- Hulshof, C.M.; Swenson, N.G.; Weiser, M.D. Tree height–diameter allometry across the United States. Ecol. Evol. 2015, 5, 1193–1204. [Google Scholar] [CrossRef] [PubMed]
- Husáková, I.; Weiner, J.; Münzbergová, Z. Species traits and shoot-root biomass allocation in 20 dry-grassland species. J. Plant Ecol. 2018, 11, 273–285. [Google Scholar] [CrossRef]
- Niklas, K.J.; Enquist, B.J. Invariant scaling relationships for interspecific plant biomass production rates and body size. Proc. Natl. Acad. Sci. 2001, 98, 2922–2927. [Google Scholar] [CrossRef]
- Meng, S. Species-specific and generalized allometric biomass models for eight Fagaceae species in the understory of evergreen broadleaved forests in subtropical China. J. For. Res. 2024, 35, 69. [Google Scholar] [CrossRef]
- Meng, S.; Zhou, G.; Liu, W.; Yu, J.; Zhou, H.; Liu, Q. Species-specific and generalized allometric equations for improving aboveground biomass estimations of 33 understory woody species in northeastern China forest ecosystems. Can. J. For. Res. 2023, 54, 524–542. [Google Scholar] [CrossRef]
- Ran, F.; Chang, R.; Yang, Y.; Zhu, W.; Luo, J.; Wang, G. Allometric equations of select tree species of the Tibetan Plateau, China. J. Mt. Sci. 2017, 14, 1889–1902. [Google Scholar] [CrossRef]
- Sileshi, G.W. A critical review of forest biomass estimation models, common mistakes and corrective measures. For. Ecol. Manag. 2014, 329, 237–254. [Google Scholar] [CrossRef]
- Barthélémy, D.; Caraglio, Y. Plant architecture: A dynamic, multilevel and comprehensive approach to plant form, structure and ontogeny. Ann. Bot. 2007, 99, 375–407. [Google Scholar] [CrossRef] [PubMed]
- Feng, L.; De Reffye, P.; Dreyfus, P.; Auclair, D. Connecting an architectural plant model to a forest stand dynamics model-application to Austrian black pine stand visualization. Ann. For. Sci. 2012, 69, 245–255. [Google Scholar] [CrossRef]
- Petrone-Mendoza, E.; Vergara-Silva, F.; Olson, M.E. Plant morpho evo-devo. Trends Plant Sci. 2023, 28, 1257–1276. [Google Scholar] [CrossRef]
- Tondjo, K.; Brancheriau, L.; Sabatier, S.; Kokutse, A.D.; Kokou, K.; Jaeger, M.; De Reffye, P.; Fourcaud, T. Stochastic modelling of tree architecture and biomass allocation: Application to teak (Tectona grandis L. f.), a tree species with polycyclic growth and leaf neoformation. Ann. Bot. 2018, 121, 1397–1410. [Google Scholar] [CrossRef] [PubMed]
- Iida, Y.; Poorter, L.; Sterck, F.J.; Kassim, A.R.; Kubo, T.; Potts, M.D.; Kohyama, T.S. Wood density explains architectural differentiation across 145 co-occurring tropical tree species. Funct. Ecol. 2012, 26, 274–282. [Google Scholar] [CrossRef]
- Loubota Panzou, G.J.; Ligot, G.; Gourlet-Fleury, S.; Doucet, J.L.; Forni, E.; Loumeto, J.J.; Fayolle, A. Architectural differences associated with functional traits among 45 coexisting tree species in Central Africa. Funct. Ecol. 2018, 32, 2583–2593. [Google Scholar] [CrossRef]
- Noyer, E.; Ningre, F.; Dlouhá, J.; Fournier, M.; Collet, C. Time shifts in height and diameter growth allocation in understory European beech (Fagus sylvatica L.) following canopy release. Trees 2019, 33, 333–344. [Google Scholar] [CrossRef]
- Xu, Z.; Du, W.; Zhou, G.; Qin, L.; Meng, S.; Yu, J.; Sun, Z.; SiQing, B.; Liu, Q. Aboveground biomass allocation and additive allometric models of fifteen tree species in northeast China based on improved investigation methods. For. Ecol. Manag. 2022, 505, 119918. [Google Scholar] [CrossRef]
- Pretzsch, H.; Dauber, E.; Biber, P. Species-specific and ontogeny-related stem allometry of European forest trees: Evidence from extensive stem analyses. For. Sci. 2013, 59, 290–302. [Google Scholar] [CrossRef]
- Niklas, K.J. Size-dependent allometry of tree height, diameter and trunk-taper. Ann. Bot. 1995, 75, 217–227. [Google Scholar] [CrossRef]
- Weiner, J. Allocation, plasticity and allometry in plants. Perspectives in Plant Ecology. Evol. Syst. 2004, 6, 207–215. [Google Scholar]
- Picard, N.; Rutishauser, E.; Ploton, P.; Ngomanda, A.; Henry, M. Should tree biomass allometry be restricted to power models? For. Ecol. Manag. 2015, 353, 156–163. [Google Scholar] [CrossRef]
- Huber, J.A.; May, K.; Hülsbergen, K.J. Allometric tree biomass models of various species grown in short-rotation agroforestry systems. Eur. J. For. Res. 2017, 136, 75–89. [Google Scholar] [CrossRef]
- Chmura, D.J.; Guzicka, M.; Rożkowski, R.; Chałupka, W. Allometry varies among related families of Norway spruce. Ann. For. Sci. 2017, 74, 36. [Google Scholar] [CrossRef]
- Baumert, S.; Khamzina, A. Allometric relations in Jatropha curcas production systems of Burkina Faso. J. Arid Environ. 2015, 120, 95–104. [Google Scholar] [CrossRef]
- Manuri, S.; Brack, C.; Noor’an, F.; Rusolono, T.; Anggraini, S.M.; Dotzauer, H.; Kumara, I. Improved allometric equations for tree aboveground biomass estimation in tropical dipterocarp forests of Kalimantan, Indonesia. For. Ecosyst. 2016, 3, 28. [Google Scholar] [CrossRef]
- Zhao, F.; Guo, Q.; Kelly, M. Allometric equation choice impacts lidar-based forest biomass estimates: A case study from the Sierra National Forest, CA. Agric. For. Meteorol. 2012, 165, 64–72. [Google Scholar] [CrossRef]
- Gonzalez-Akre, E.; Piponiot, C.; Lepore, M.; Herrmann, V.; Lutz, J.A.; Baltzer, J.L.; Dick, C.W.; Gilbert, G.S.; He, F.; Heym, M.; et al. allodb: An R package for biomass estimation at globally distributed extratropical forest plots. Methods Ecol. Evol. 2022, 13, 330–338. [Google Scholar] [CrossRef]
- Adhikari, D.; Singh, P.P.; Tiwary, R.; Barik, S.K. Forest carbon stock-based bioeconomy: Mixed models improve accuracy of tree biomass estimates. Biomass Bioenergy 2024, 183, 107142. [Google Scholar] [CrossRef]
- Davies, T.J.; Regetz, J.; Wolkovich, E.M.; McGill, B.J. Phylogenetically weighted regression: A method for modelling non-stationarity on evolutionary trees. Glob. Ecol. Biogeogr. 2019, 28, 275–285. [Google Scholar] [CrossRef]
- Brown, S.; Gillespie, A.J.R.; Lugo, A.E. Biomass estimation methods for tropical forests with applications to forest inventory data. For. Sci. 1989, 35, 881–902. [Google Scholar] [CrossRef]
- Litton, C.M.; Boone Kauffman, J. Allometric models for predicting aboveground biomass in two widespread woody plants in Hawaii. Biotropica 2008, 40, 313–320. [Google Scholar] [CrossRef]
- Adhikari, B.S.; Rawat, Y.S.; Singh, S.P. Structure and function of high altitude forests of central Himalaya I. Dry matter dynamics. Ann. Bot. 1995, 75, 237–248. [Google Scholar] [CrossRef]
- BK, R.B.; Sharma, R.P.; Bhandari, S.K. A generalized aboveground biomass model for juvenile individuals of Rhododendron arboreum (SM.) in Nepal. Cerne 2019, 25, 119–130. [Google Scholar]
- Elzein, T.M.; Blarquez, O.; Gauthier, O.; Carcaillet, C. Allometric equations for biomass assessment of subalpine dwarf shrubs. Alp. Bot. 2011, 121, 129–134. [Google Scholar] [CrossRef]
- Zhang, Q.; Li, J.; Xu, W.; Xiong, G.; Xie, Z. Estimation of biomass allocation and carbon density of Rhododendron simsii shrubland in the subtropical mountainous areas of China. Chin. J. Plant Ecol. 2017, 41, 43. [Google Scholar]
- Sun, X.; Wang, X.; Wang, C.; Zhang, Q.; Guo, Q. Filling the “vertical gap” between canopy tree species and understory shrub species: Biomass allometric equations for subcanopy tree species. J. For. Res. 2023, 34, 903–913. [Google Scholar] [CrossRef]
- López-Martínez, J.O.; Vargas-Larreta, B.; González, E.J.; Corral-Rivas, J.J.; Aguirre-Calderón, O.A.; Treviño-Garza, E.J.; De los Santos-Posadas, H.M.; Martínez-Salvador, M.; Zamudio-Sánchez, F.J.; Aguirre-Calderón, C.G. Forest Biometric Systems in Mexico: A Systematic Review of Available Models. Forests 2022, 13, 649. [Google Scholar] [CrossRef]
- Dutcă, I.; Mather, R.; Ioraş, F. Tree biomass allometry during the early growth of Norway spruce (Picea abies) varies between pure stands and mixtures with European beech (Fagus sylvatica). Can. J. For. Res. 2018, 48, 77–84. [Google Scholar] [CrossRef]
- Cudjoe, E.; Bravo, F.; Ruiz-Peinado, R. Allometry and biomass dynamics in temperate mixed and monospecific stands: Contrasting response of Scots pine (Pinus sylvestris L.) and sessile oak (Quercus petraea (Matt.) Liebl.). Sci. Total Environ. 2024, 953, 176061. [Google Scholar] [CrossRef]
- Dutcă, I.; Mather, R.; Blujdea, V.N.; Ioraș, F.; Olari, M.; Abrudan, I.V. Site-effects on biomass allometric models for early growth plantations of Norway spruce (Picea abies (L.) Karst.). Biomass Bioenergy 2018, 116, 8–17. [Google Scholar] [CrossRef]
- Fortier, J.; Truax, B.; Gagnon, D.; Lambert, F. Allometric equations for estimating compartment biomass and stem volume in mature hybrid poplars: General or site-specific? Forests 2017, 8, 309. [Google Scholar] [CrossRef]
- Fu, L.; Lei, X.; Hu, Z.; Zeng, W.; Tang, S.; Marshall, P.; Cao, L.; Song, X.; Yu, L.; Liang, J. Integrating regional climate change into allometric equations for estimating tree aboveground biomass of Masson pine in China. Ann. For. Sci. 2017, 74, 42. [Google Scholar] [CrossRef]
- Xu, K.; Jiang, J.; He, F. Climate-based allometric biomass equations for five major Canadian timber species. Can. J. For. Res. 2021, 51, 1633–1642. [Google Scholar] [CrossRef]
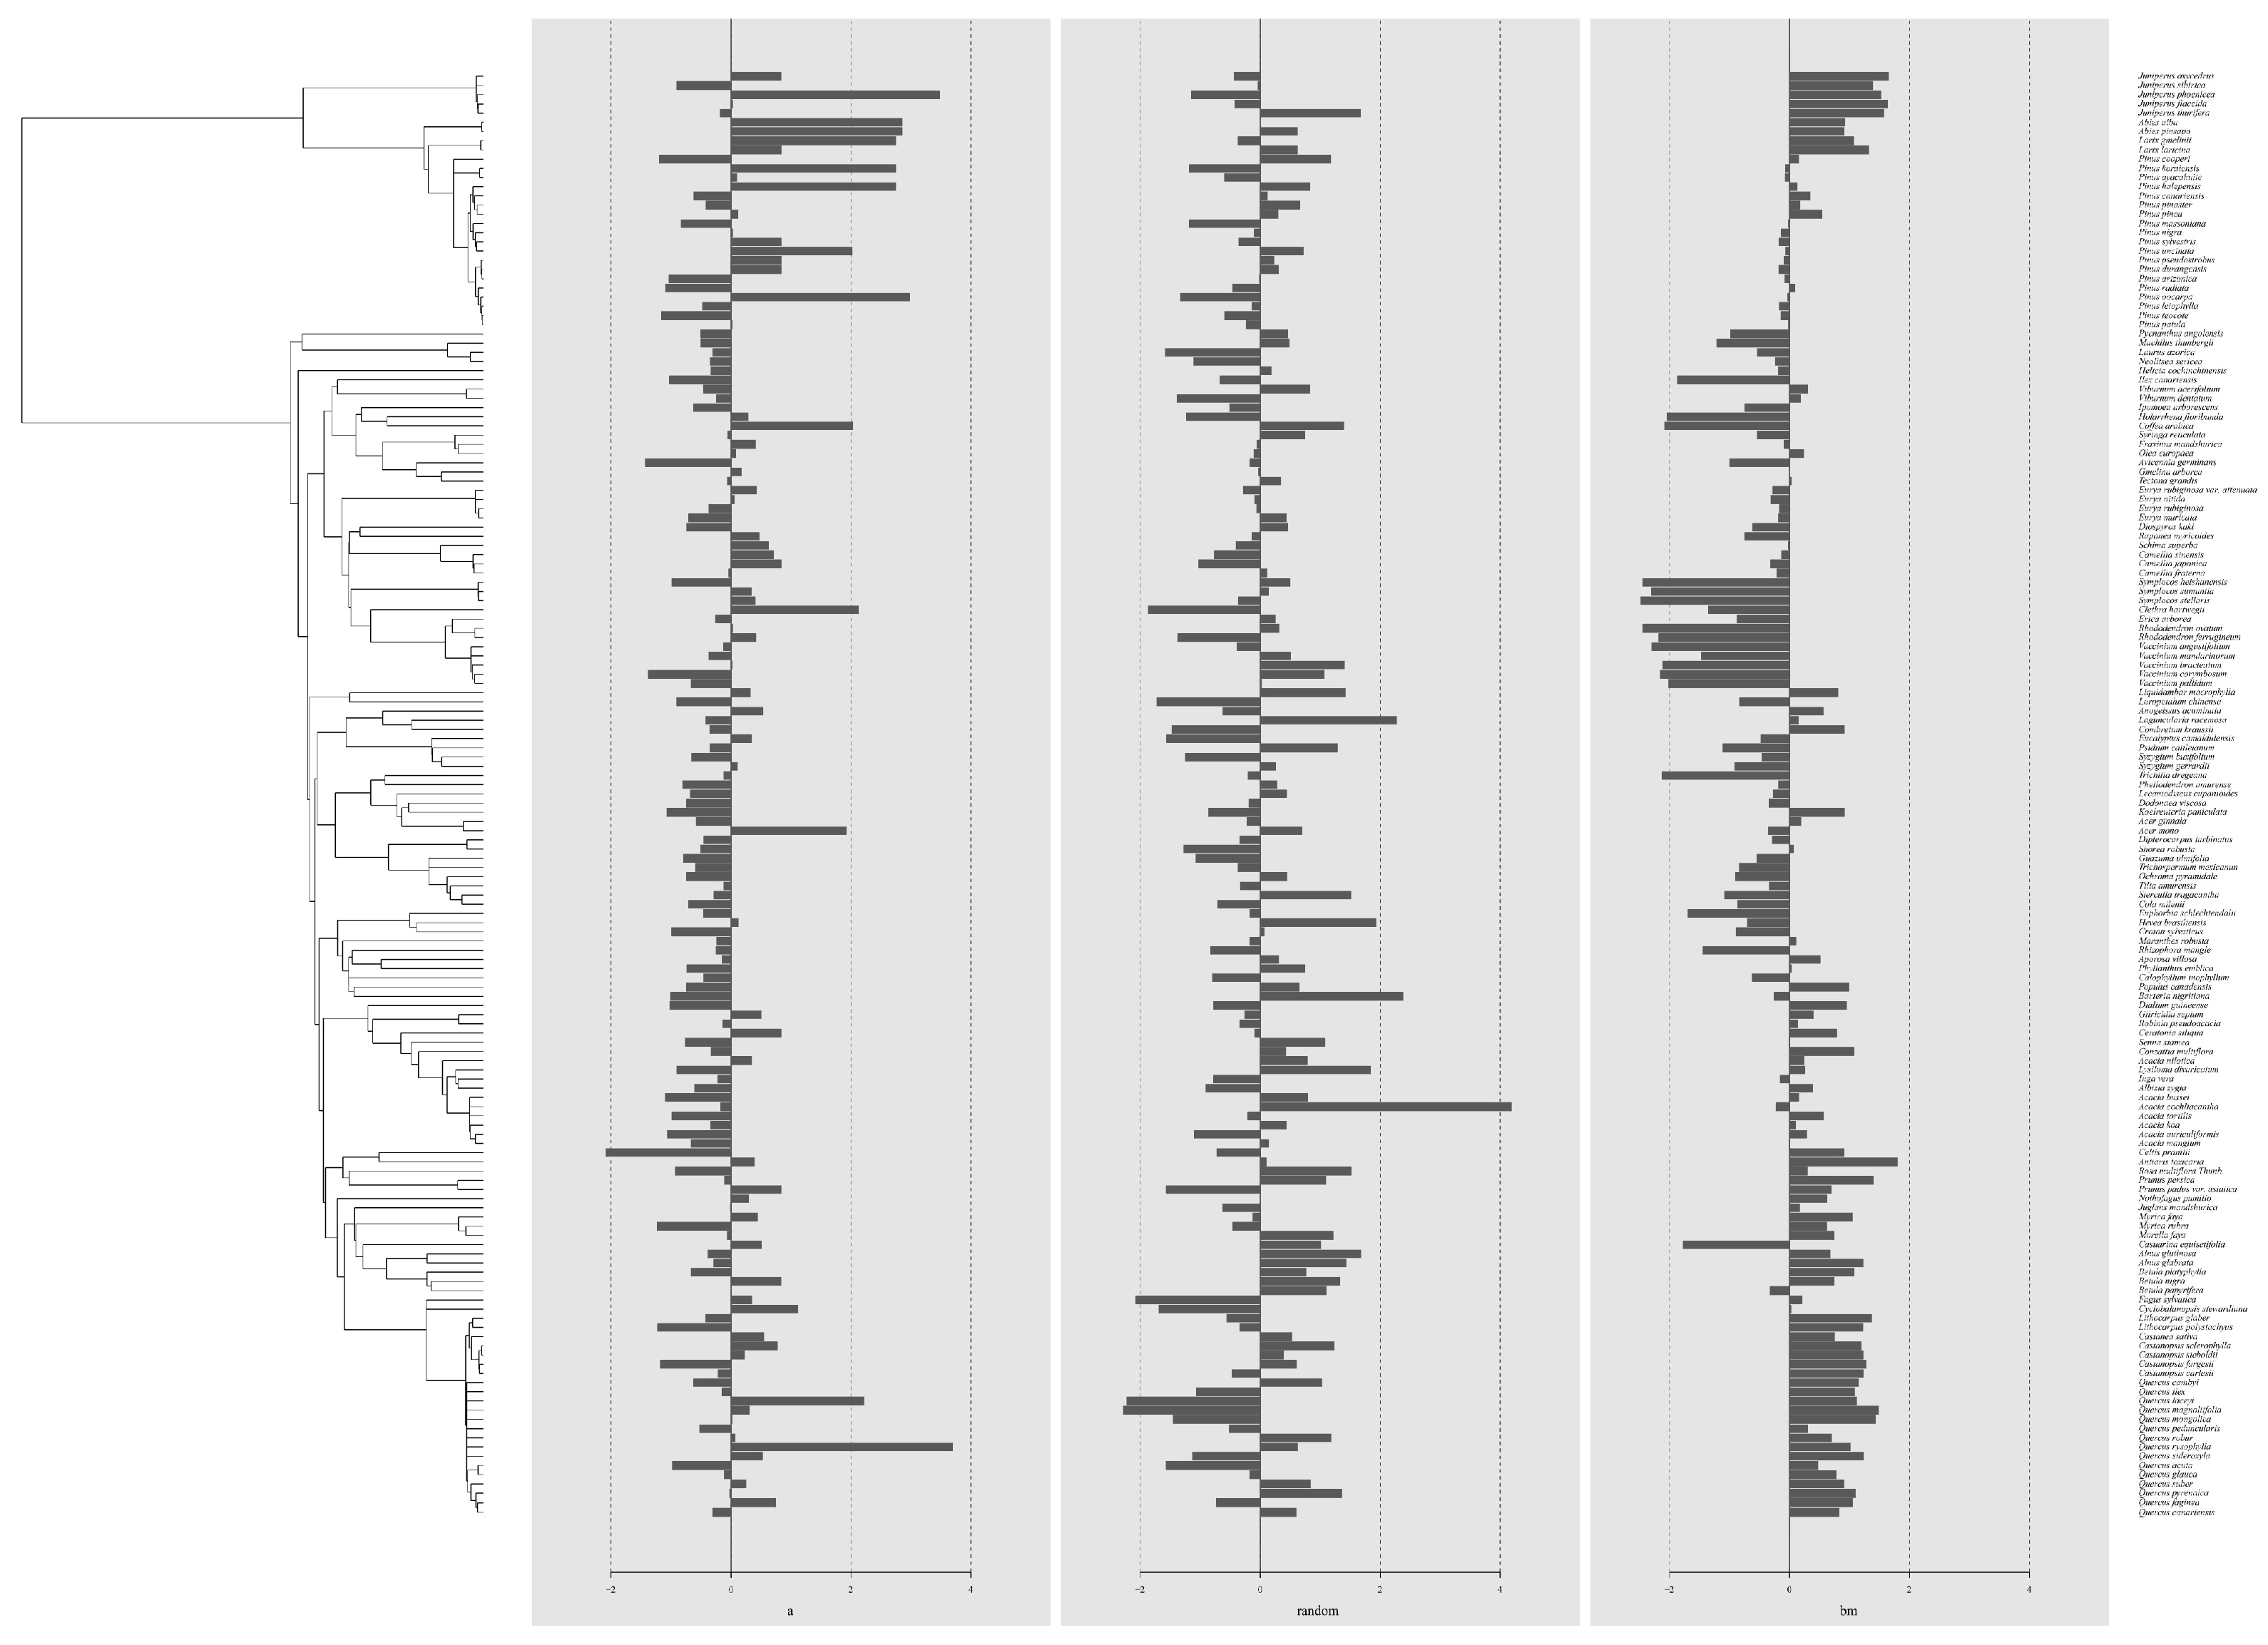
| Group | C mean | I | K | K.star | λ |
|---|---|---|---|---|---|
| a | 0.1106 * | 0.0764 ** | 0.0427 | 0.0471 | 0.1249 ** |
| (p = 0.024) | (p = 0.002) | (p = 0.621) | (p = 0.749) | (p = 0.003) | |
| random | −0.0317 | −0.0064 | 0.0470 | 0.0576 | 0.00007 |
| (p = 0.674) | (p = 0.477) | (p = 0.475) | (p = 0.476) | (p = 1.000) | |
| bm | 0.5201 ** | 0.2709 ** | 0.6239 ** | 0.6012 ** | 1.0010 ** |
| (p = 0.001) | (p = 0.001) | (p = 0.001) | (p = 0.001) | (p = 0.001) |
Disclaimer/Publisher’s Note: The statements, opinions and data contained in all publications are solely those of the individual author(s) and contributor(s) and not of MDPI and/or the editor(s). MDPI and/or the editor(s) disclaim responsibility for any injury to people or property resulting from any ideas, methods, instructions or products referred to in the content. |
© 2025 by the authors. Licensee MDPI, Basel, Switzerland. This article is an open access article distributed under the terms and conditions of the Creative Commons Attribution (CC BY) license (https://creativecommons.org/licenses/by/4.0/).
Share and Cite
Shang, Y.; Xia, Y.; Ran, X.; Zheng, X.; Ding, H.; Fang, Y. Allometric Equations for Aboveground Biomass Estimation in Natural Forest Trees: Generalized or Species-Specific? Diversity 2025, 17, 493. https://doi.org/10.3390/d17070493
Shang Y, Xia Y, Ran X, Zheng X, Ding H, Fang Y. Allometric Equations for Aboveground Biomass Estimation in Natural Forest Trees: Generalized or Species-Specific? Diversity. 2025; 17(7):493. https://doi.org/10.3390/d17070493
Chicago/Turabian StyleShang, Yuxin, Yutong Xia, Xiaodie Ran, Xiao Zheng, Hui Ding, and Yanming Fang. 2025. "Allometric Equations for Aboveground Biomass Estimation in Natural Forest Trees: Generalized or Species-Specific?" Diversity 17, no. 7: 493. https://doi.org/10.3390/d17070493
APA StyleShang, Y., Xia, Y., Ran, X., Zheng, X., Ding, H., & Fang, Y. (2025). Allometric Equations for Aboveground Biomass Estimation in Natural Forest Trees: Generalized or Species-Specific? Diversity, 17(7), 493. https://doi.org/10.3390/d17070493