
Birds, Bees, and Botany: Measuring Urban Biodiversity After Nature-Based Solutions Implementation


Abstract

1. Introduction
2. Materials and Methods
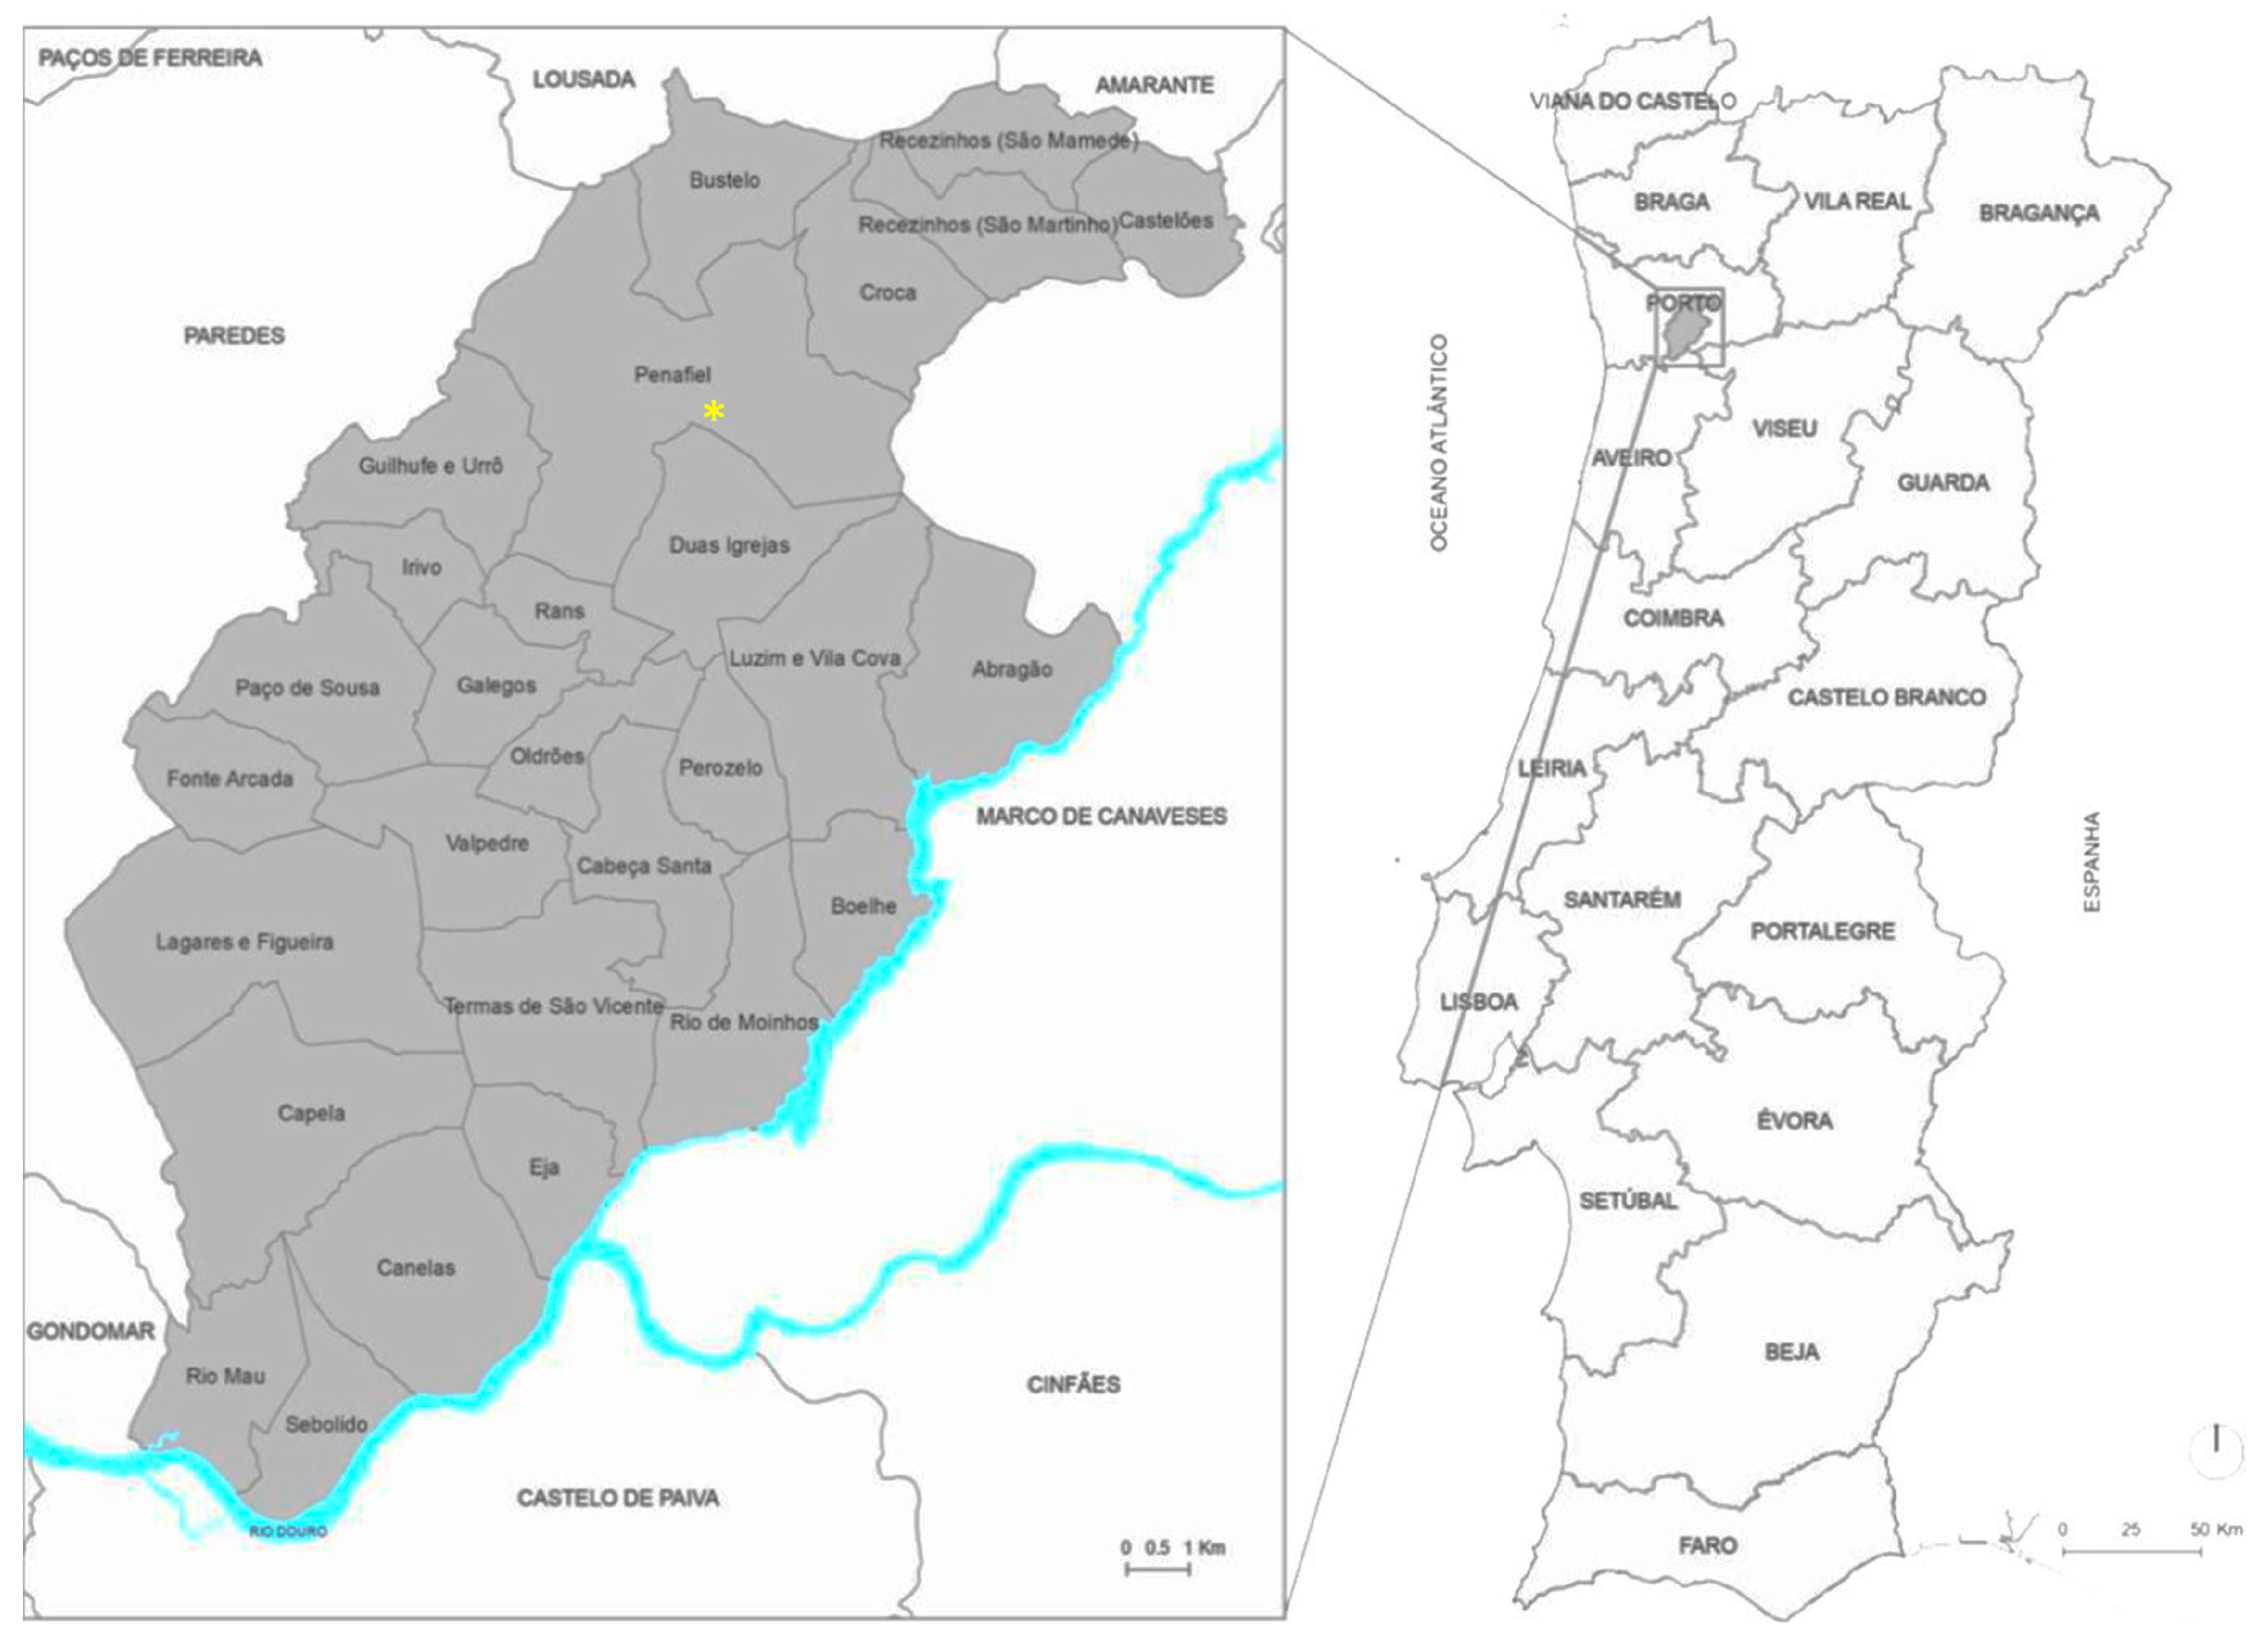
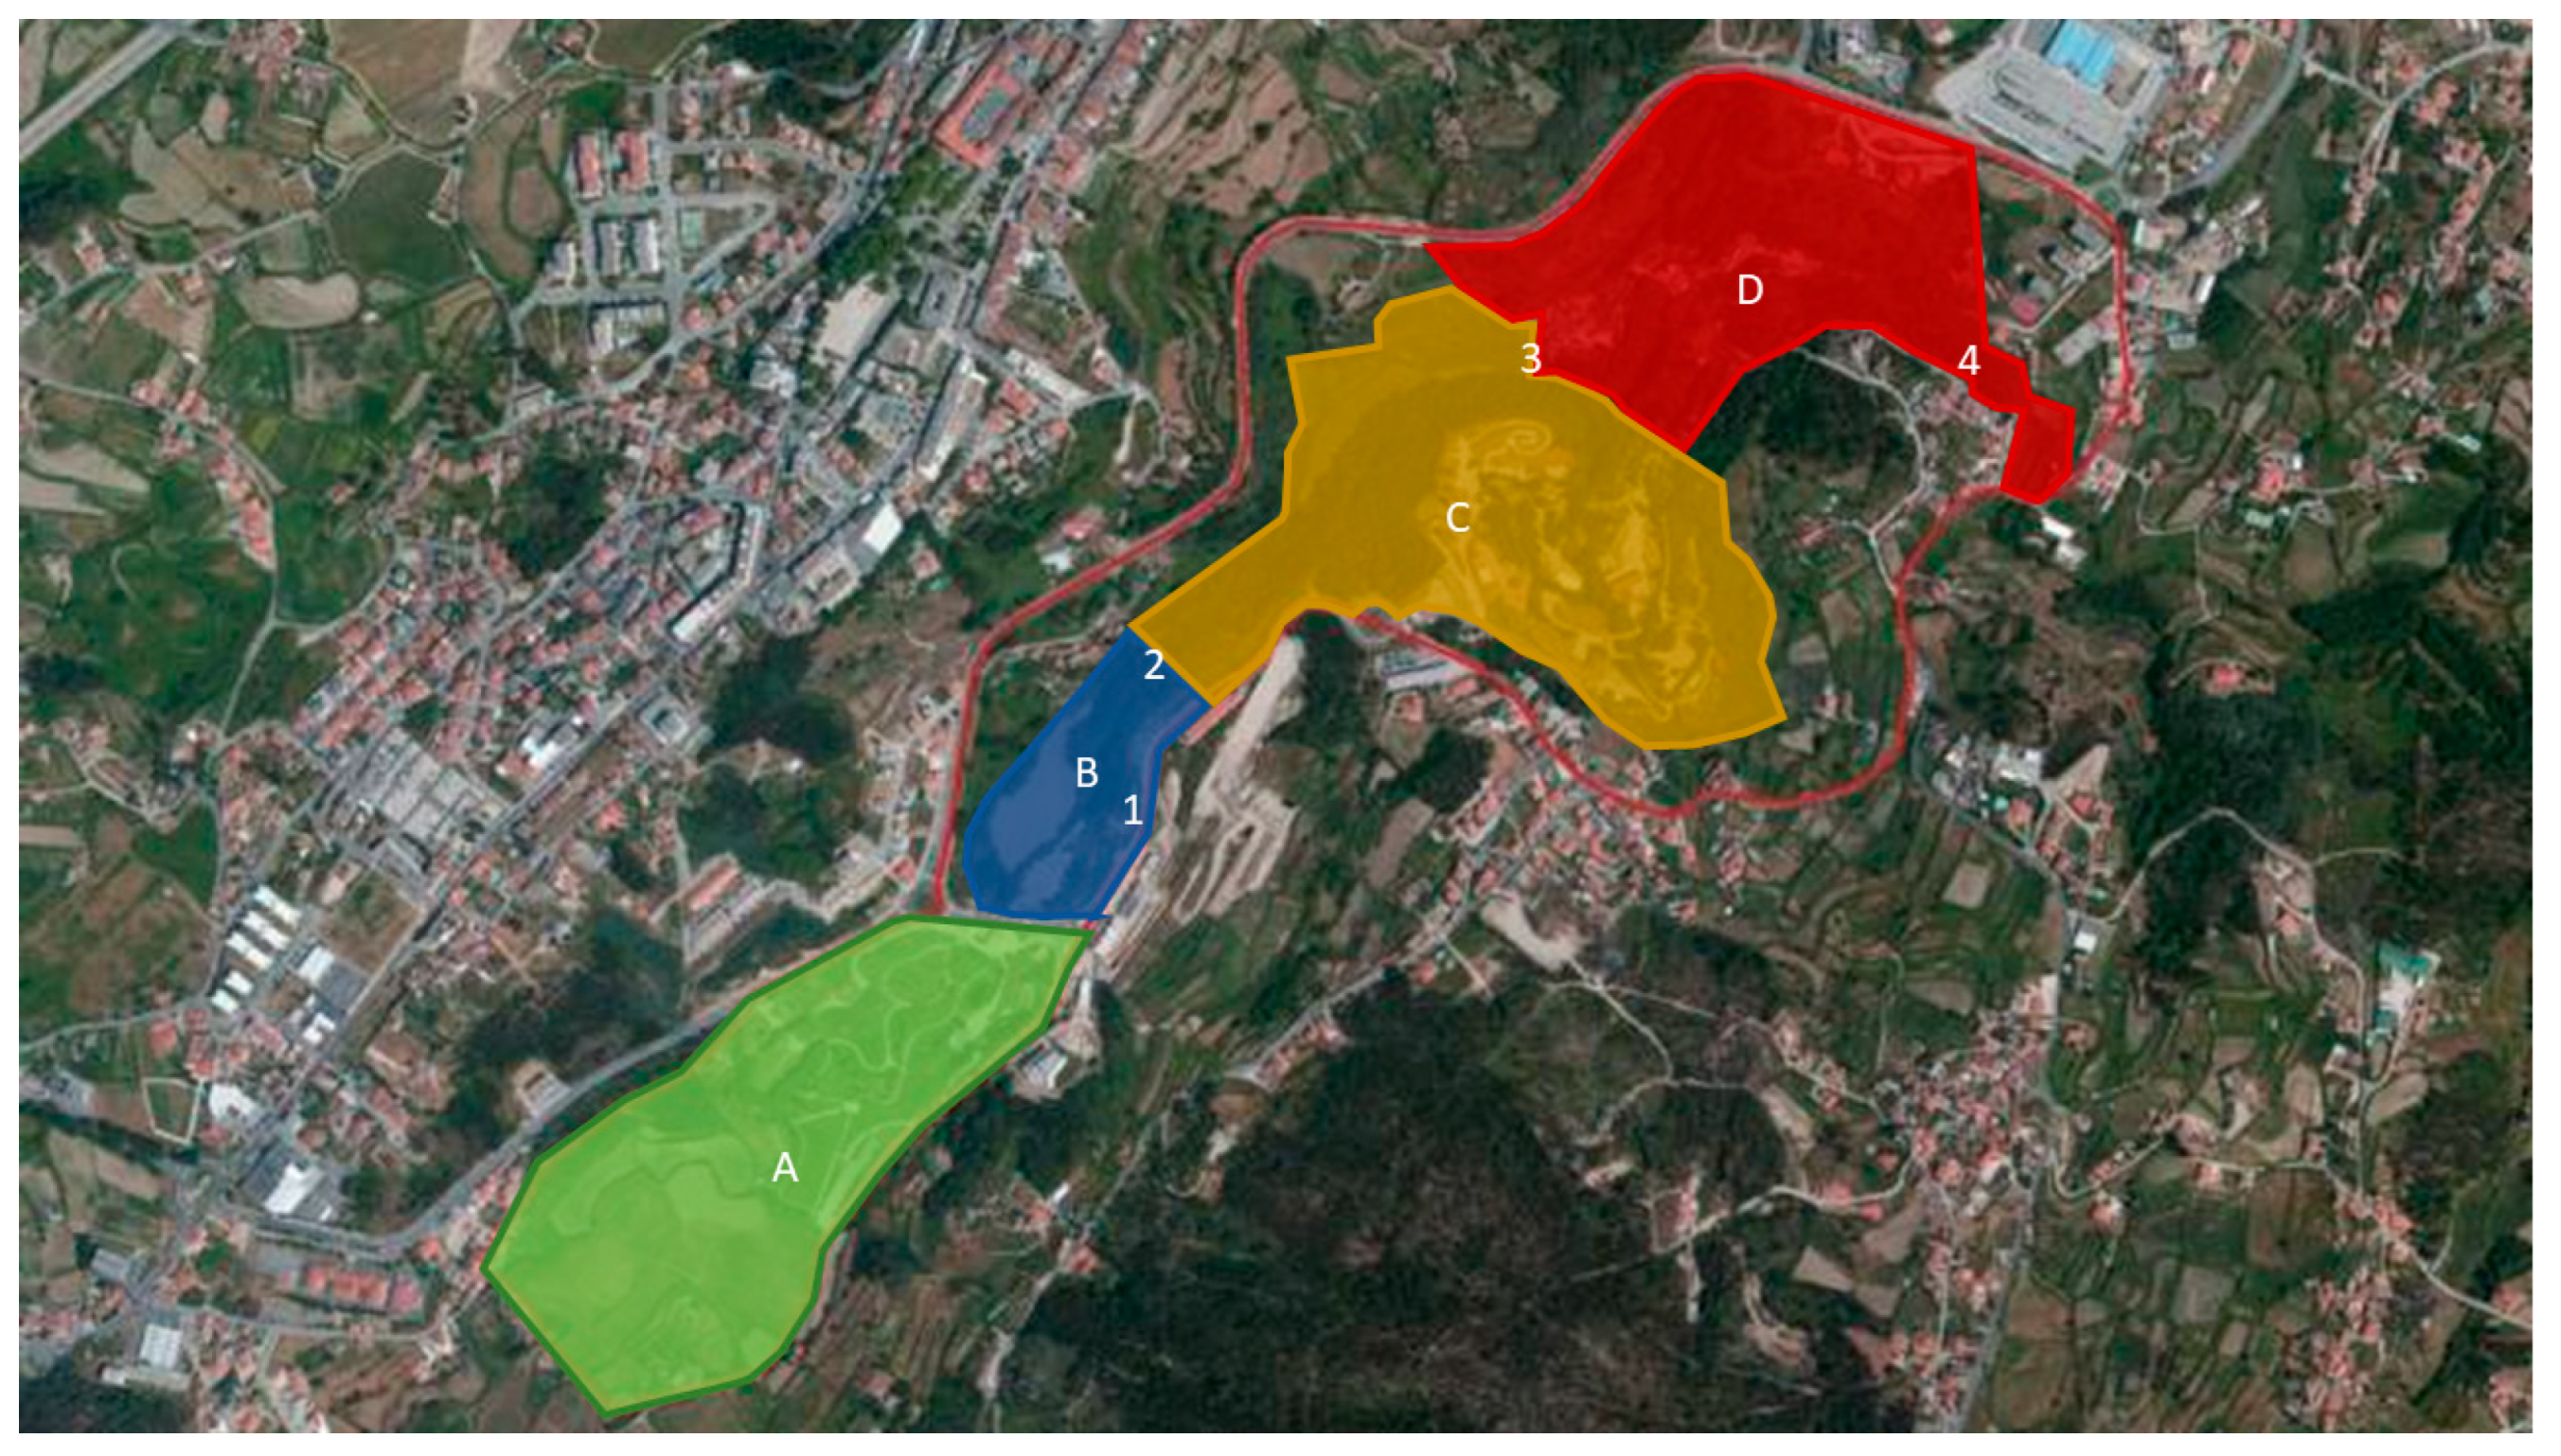
2.1. The Study Area
2.2. Biodiversity Baseline Assessment
2.3. Bird Survey Methodology
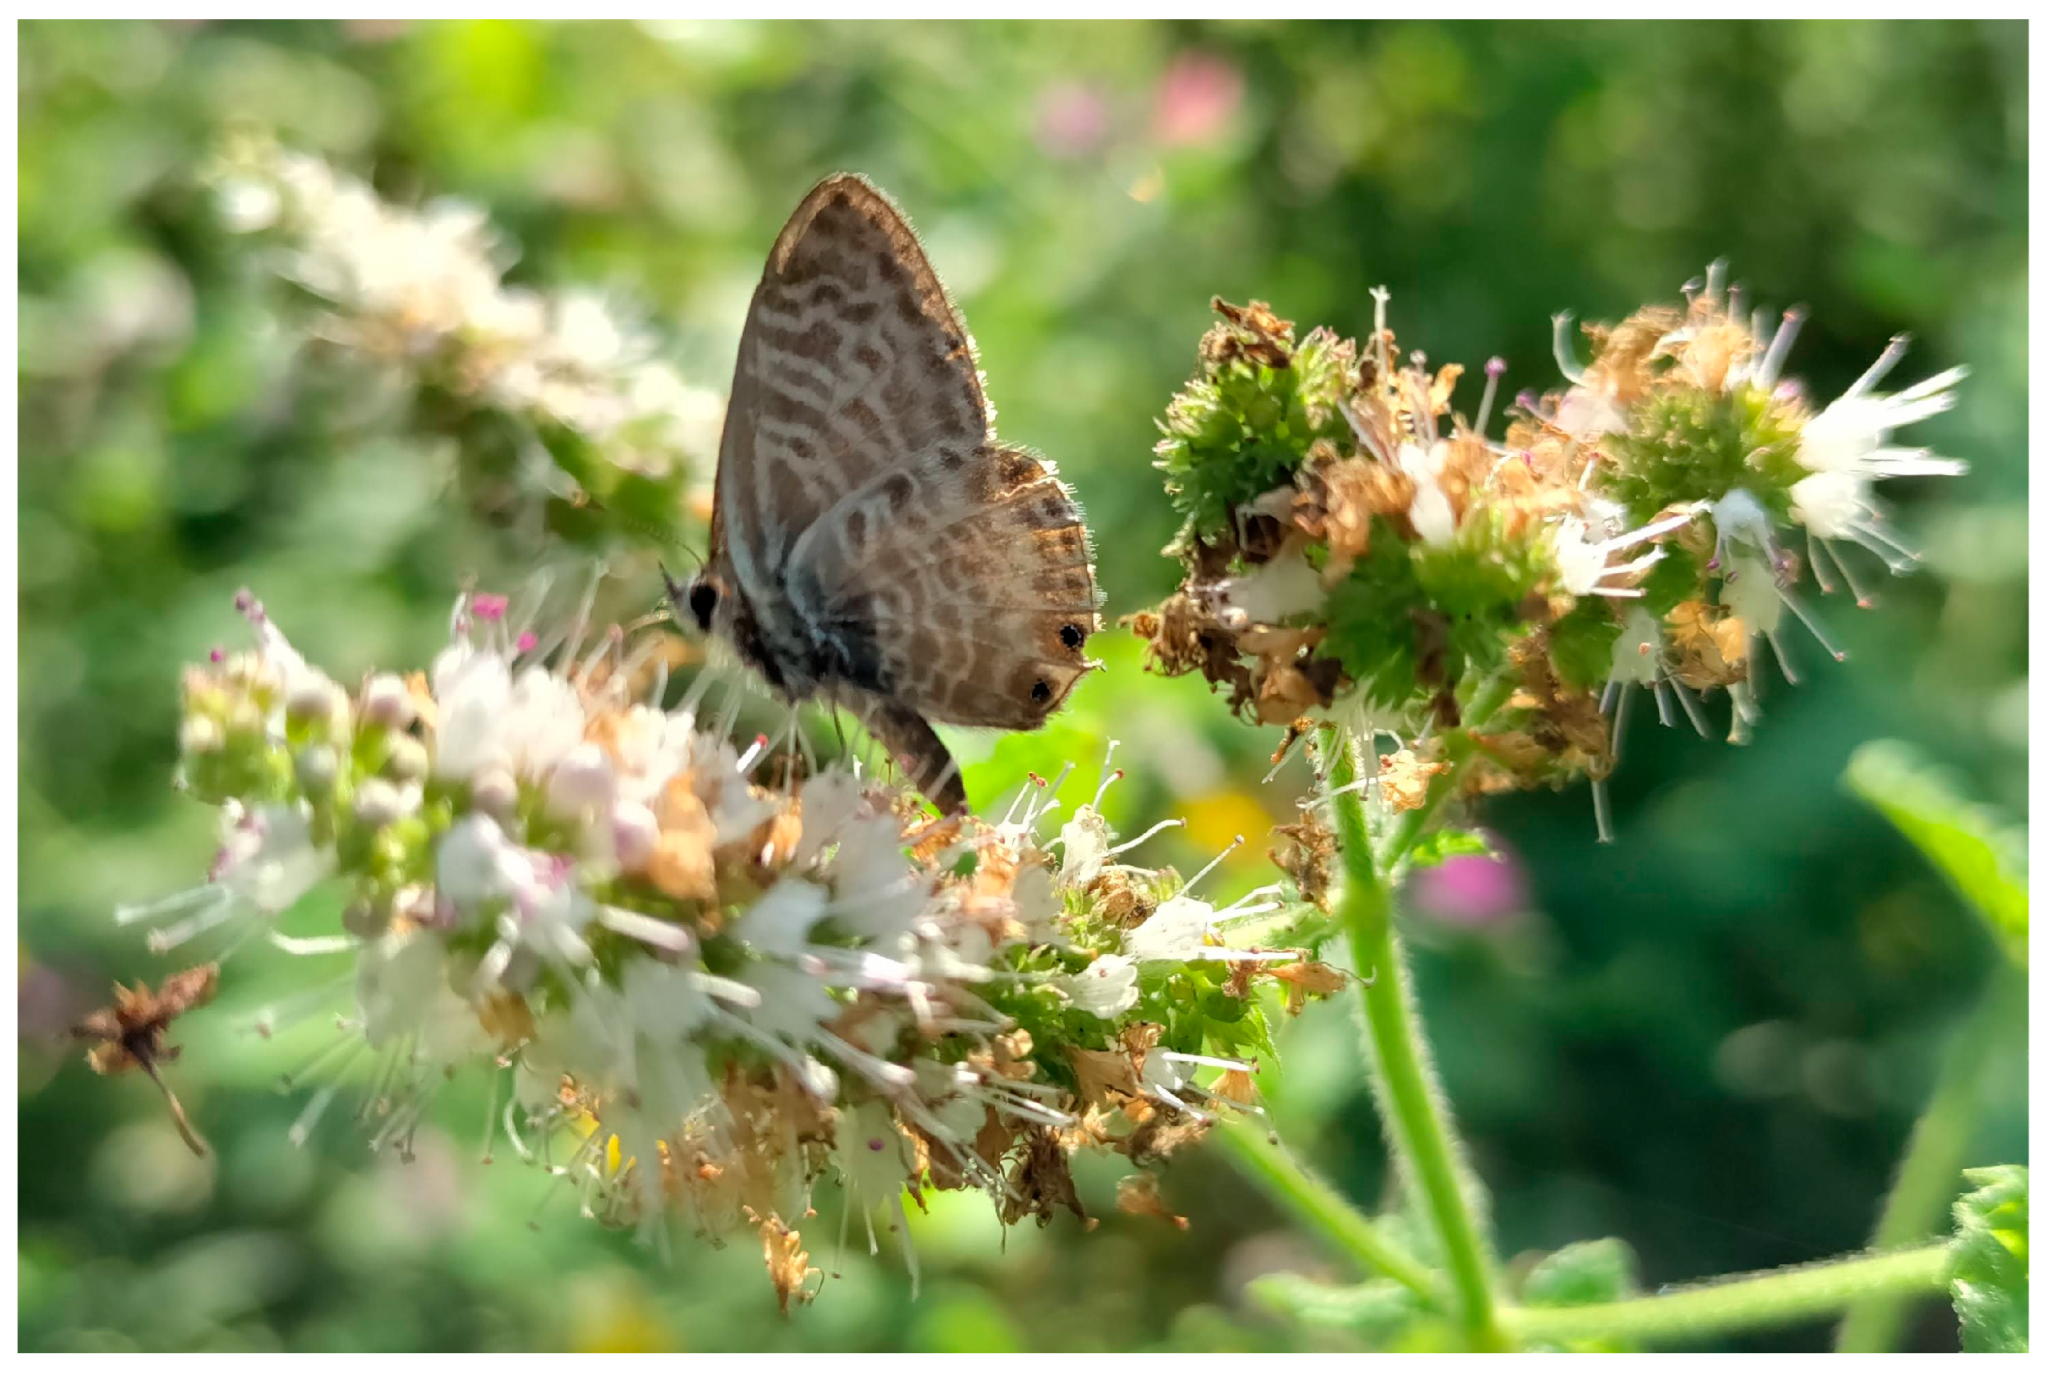
2.4. Insects and Pollinators Survey Methodology
2.5. Vegetation Survey Methodology
2.6. Statistical Analyses
3. Results and Discussion
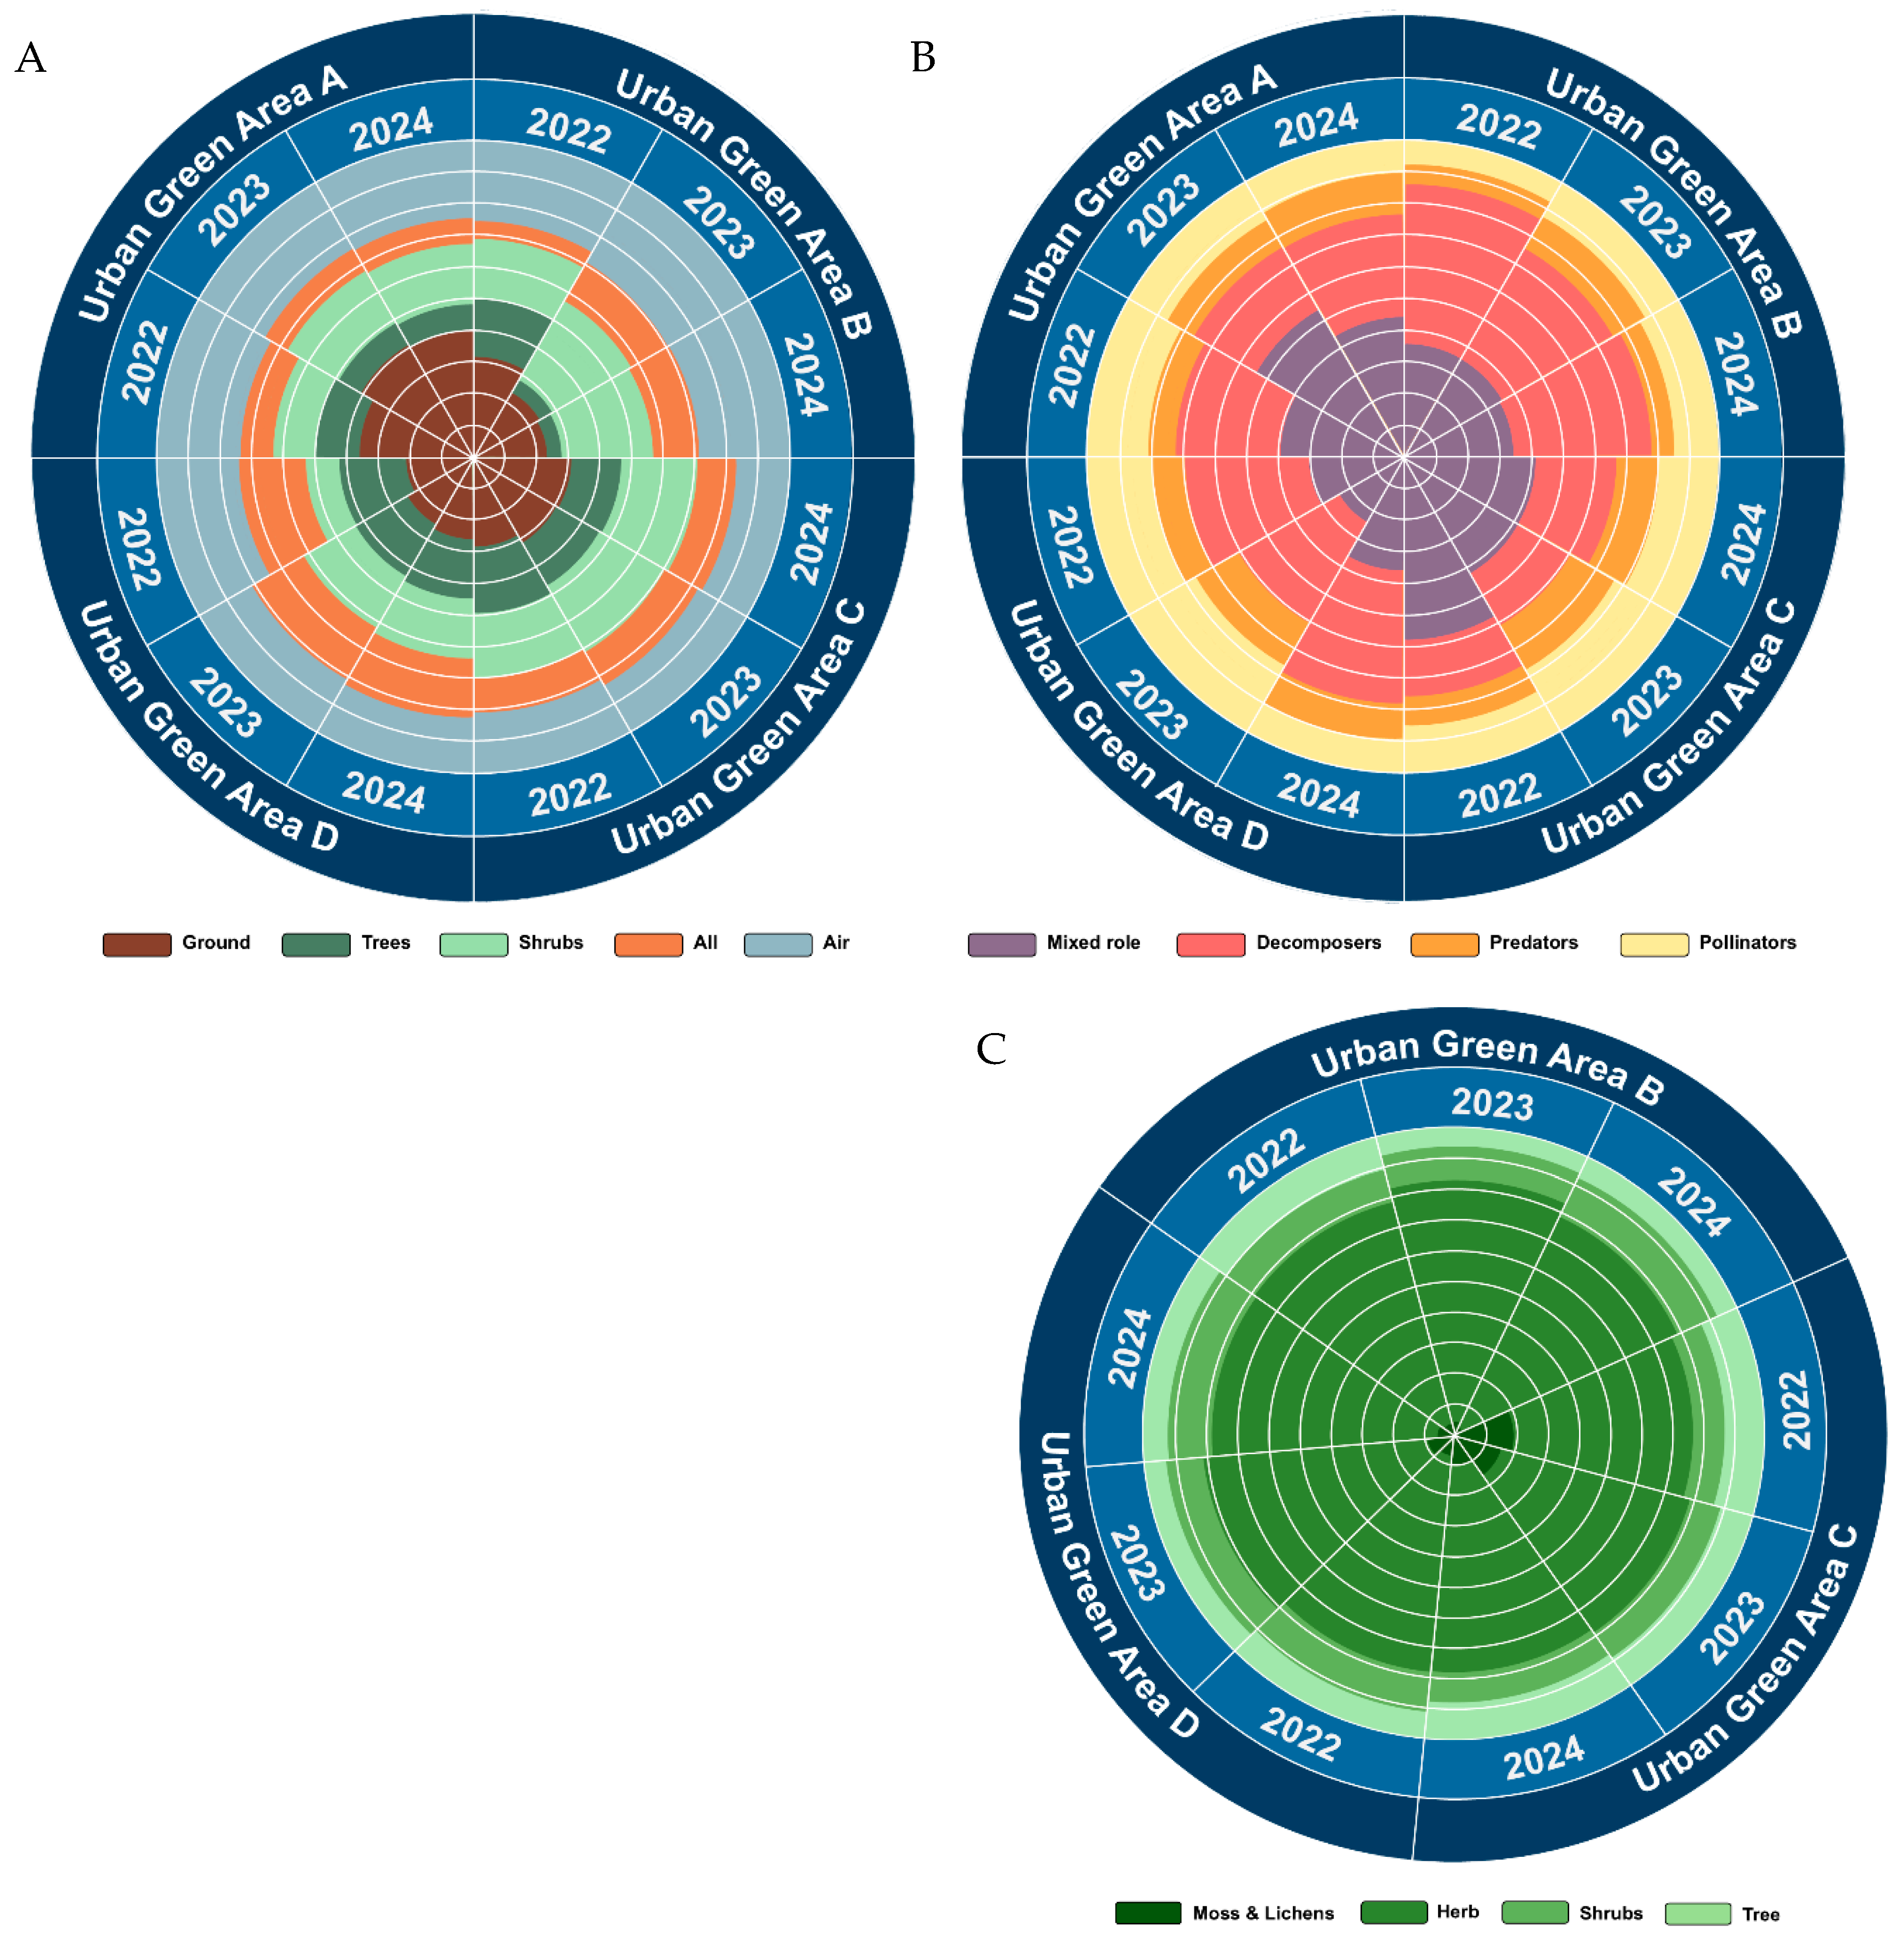
3.1. Temporal Changes in Species Richness and Abundance
3.2. Response off Functional Groups and Indicator Species
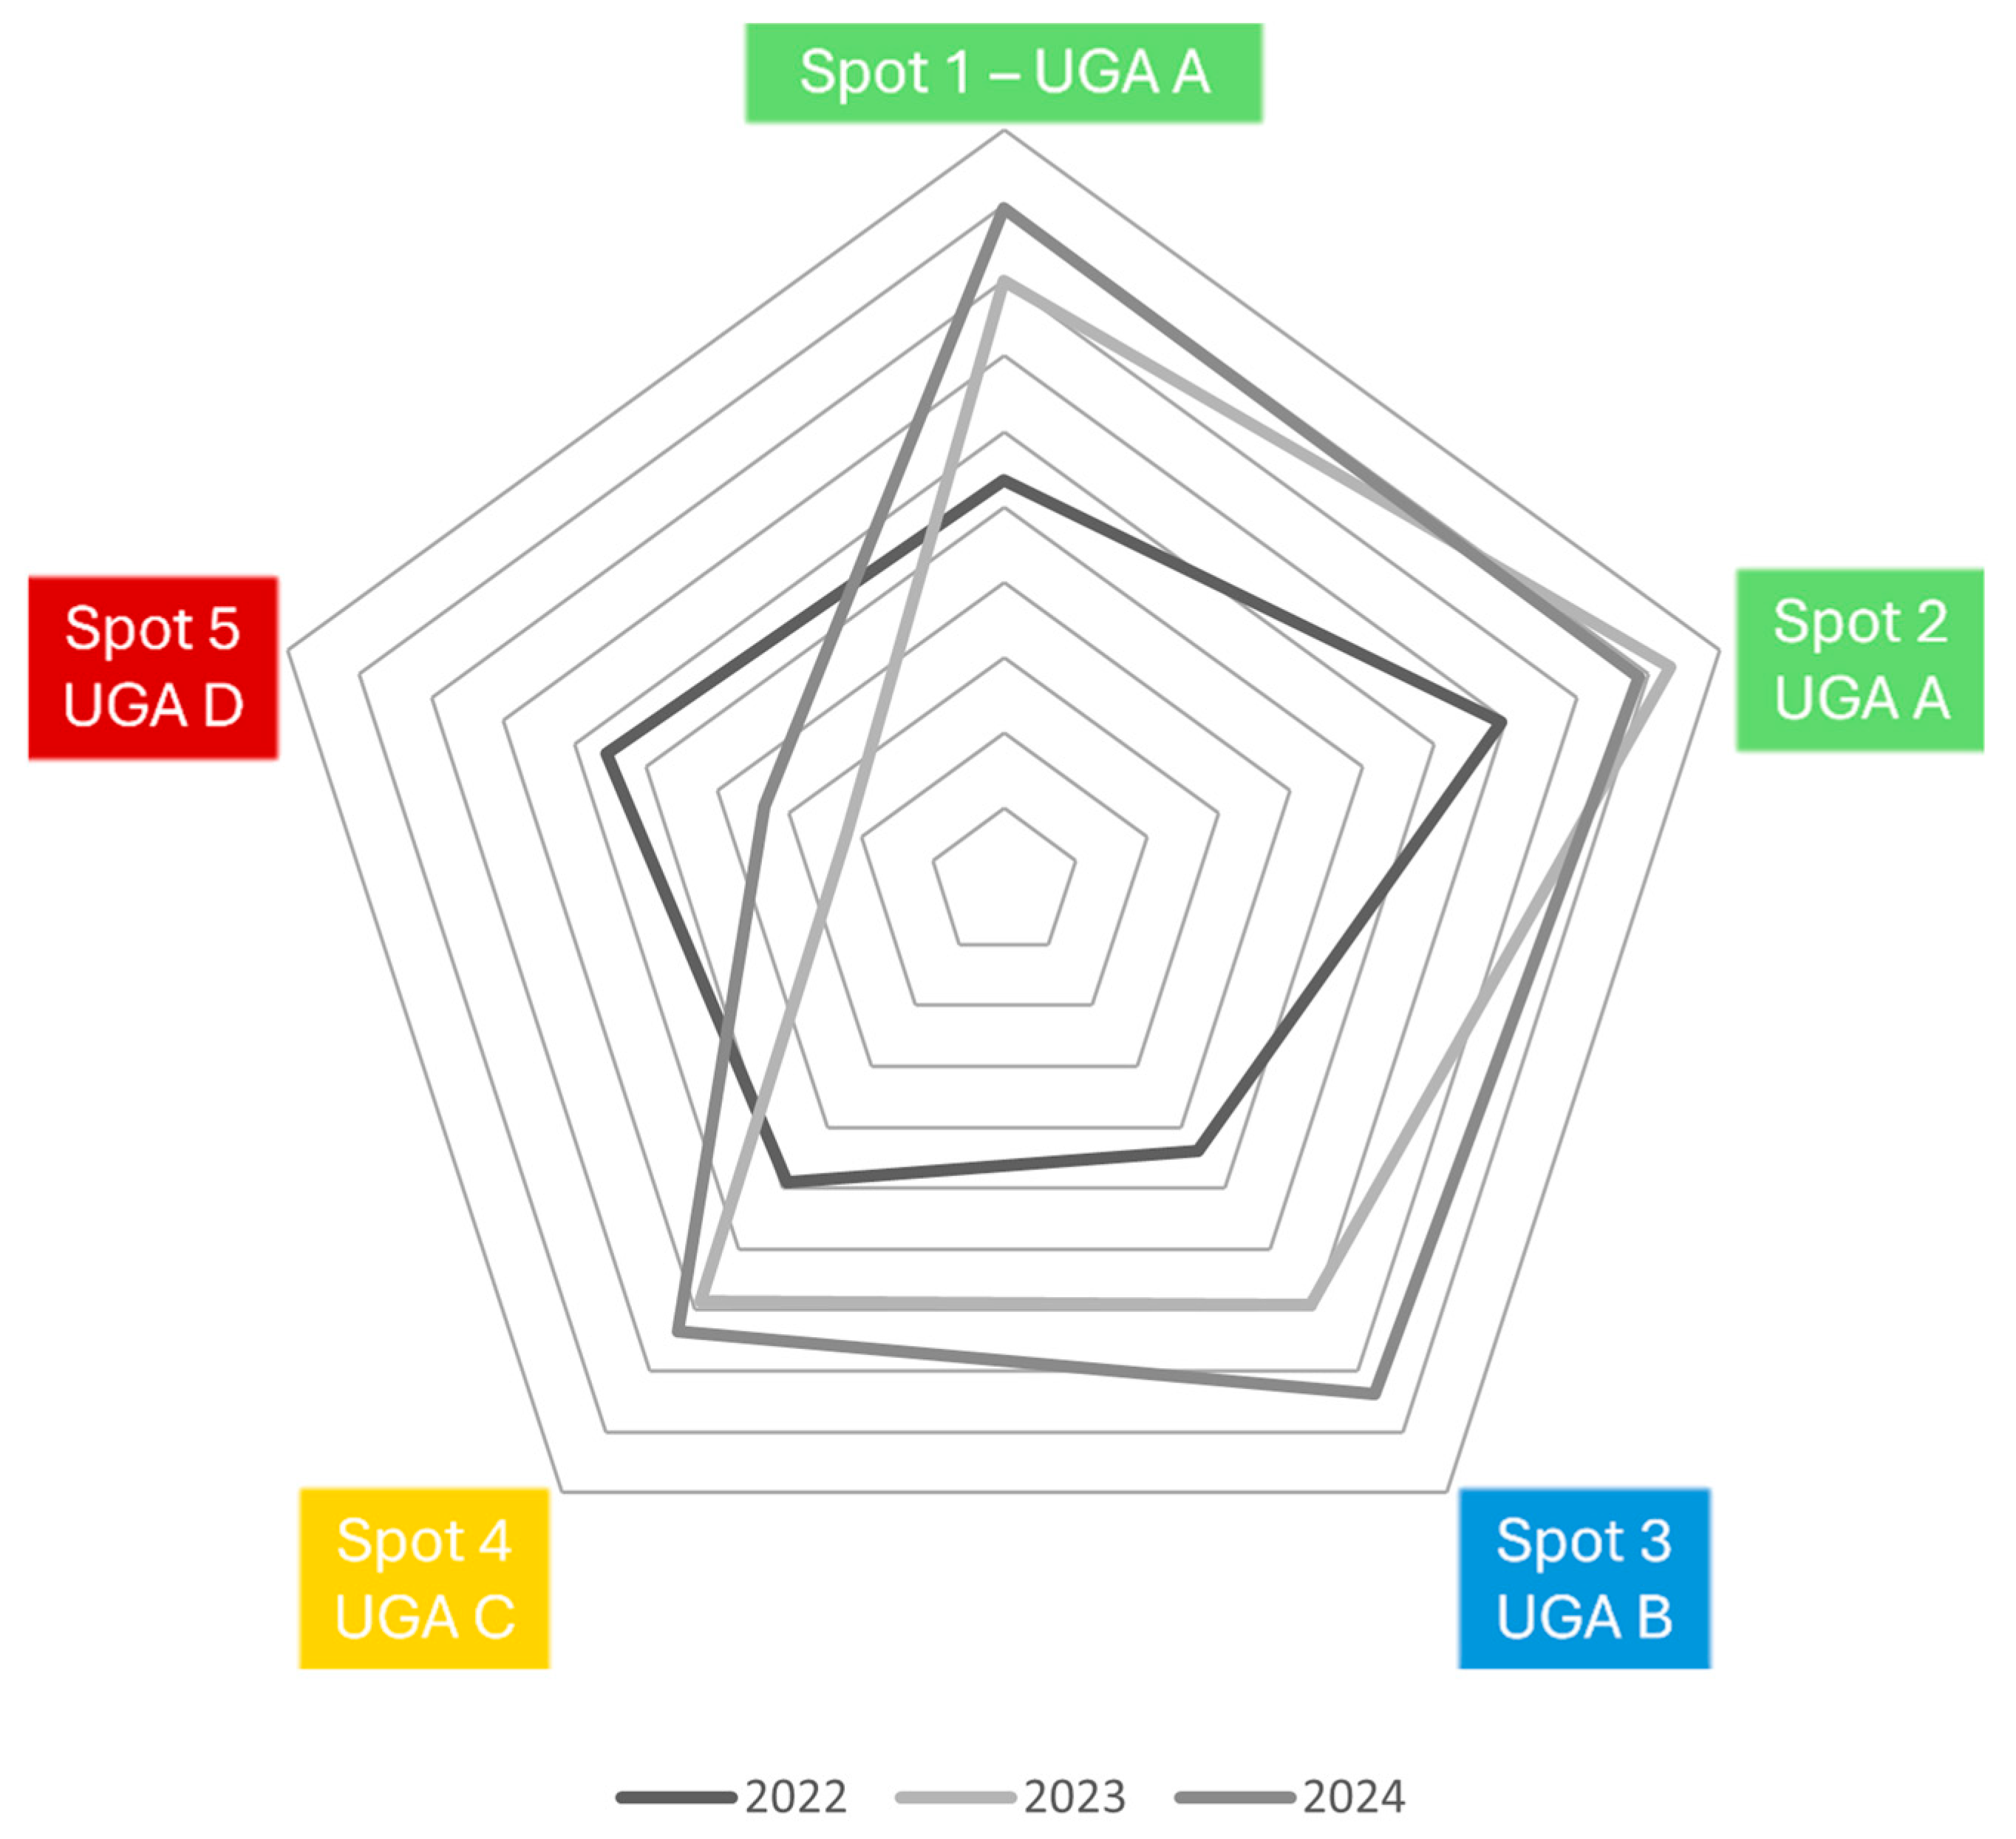
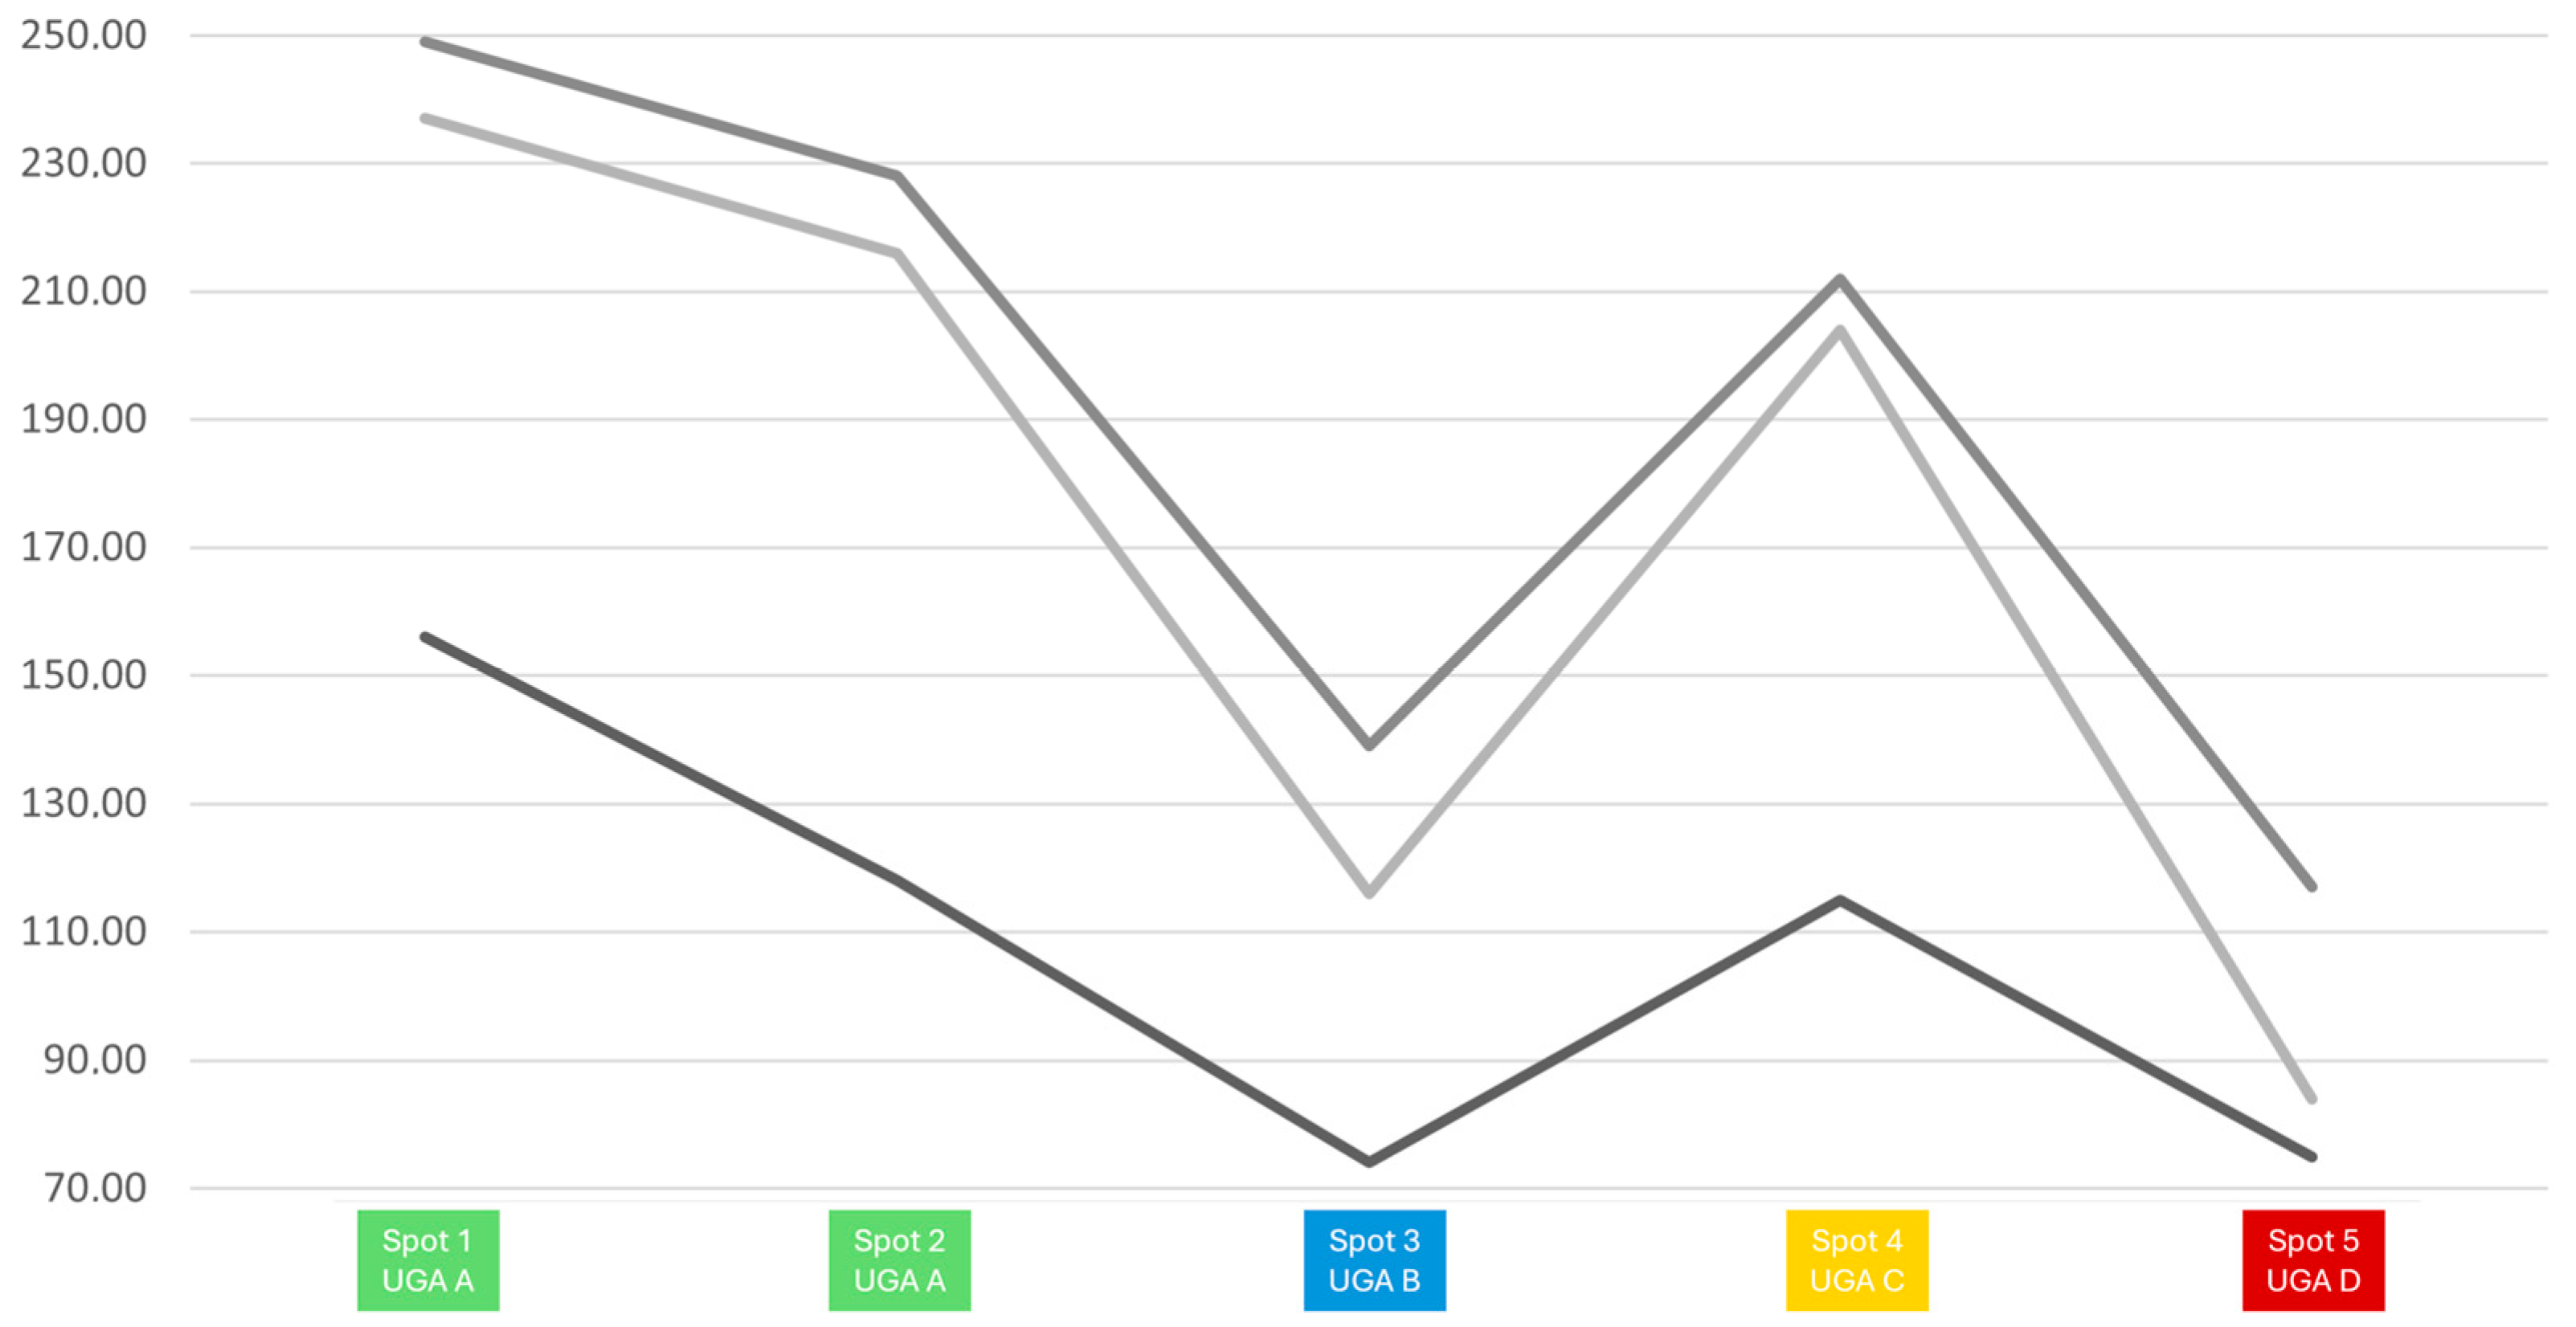
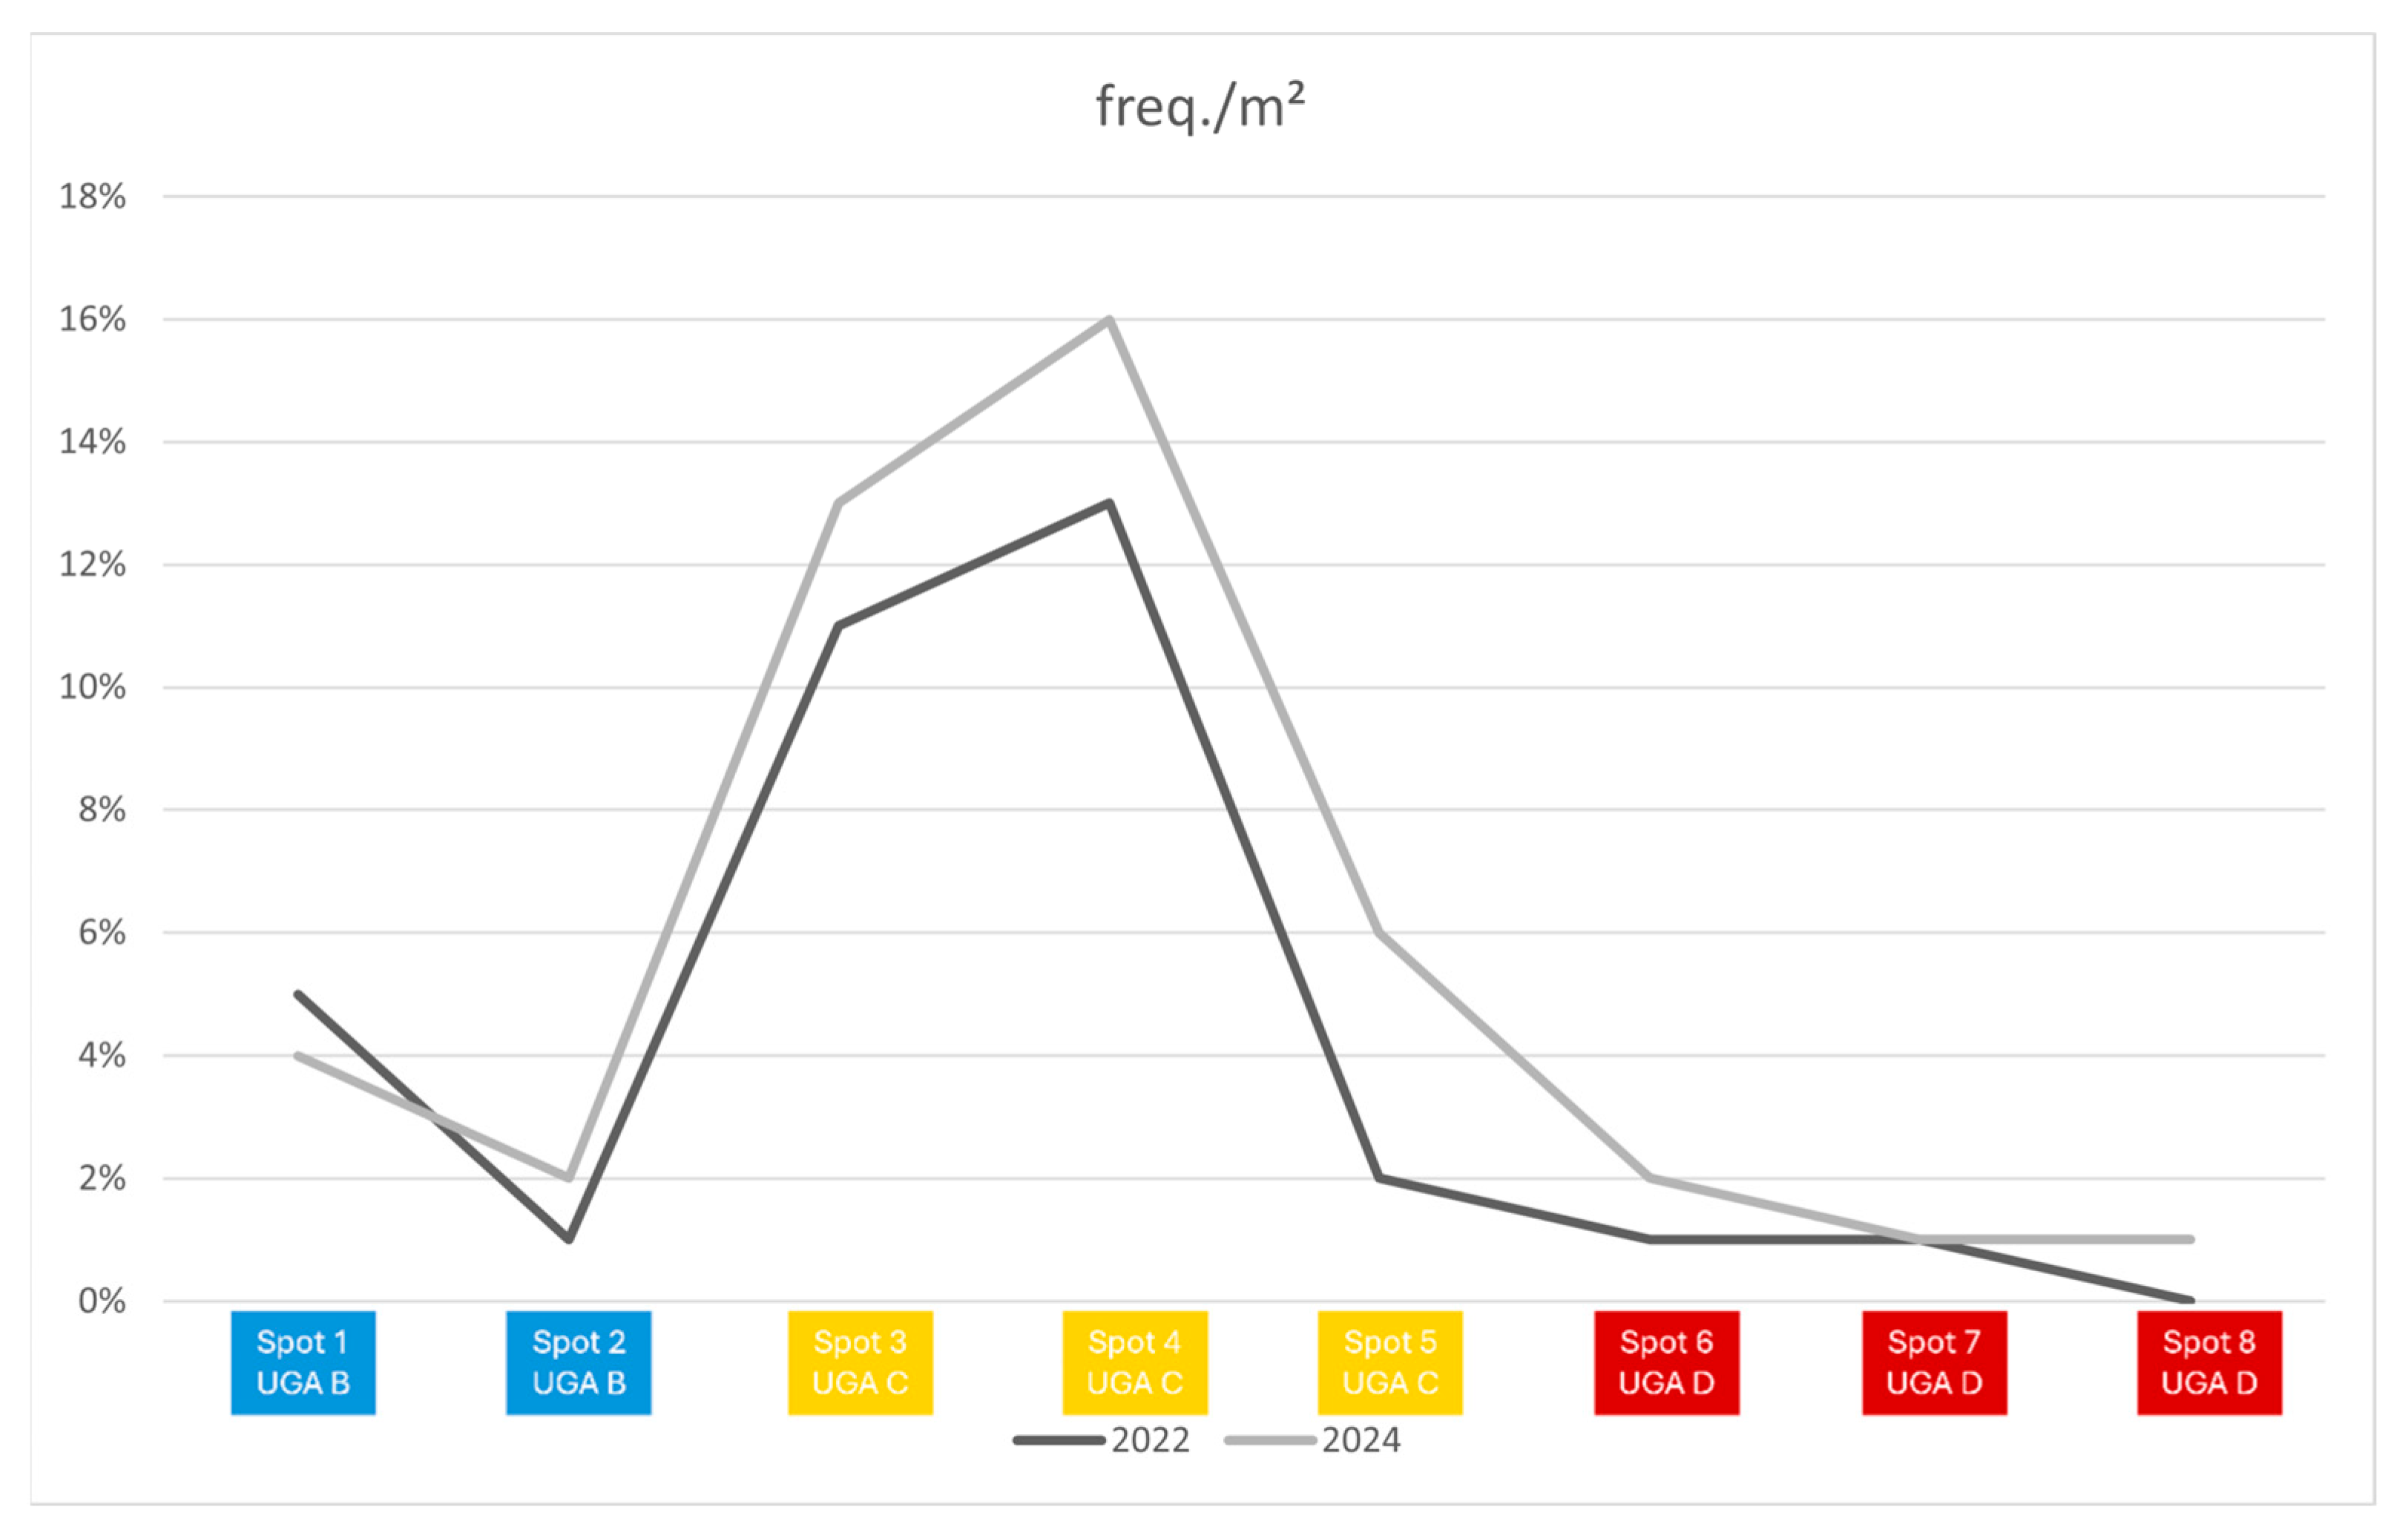
3.3. Effectiveness of Management and Nature-Based Solutions: Temporal Trends and Ecological Patterns
4. Implications for Restoration and Management
5. Conclusions
Author Contributions
Funding
Institutional Review Board Statement
Data Availability Statement
Acknowledgments
Conflicts of Interest
References
- Belaire, J.A.; Higgins, C.; Zoll, D.; Lieberknecht, K.; Bixler, R.P.; Neff, J.L.; Keitt, T.H.; Jha, S. Fine-scale monitoring and mapping of biodiversity and ecosystem services reveals multiple synergies and few tradeoffs in urban green space management. Sci. Total Environ. 2022, 849, 157801. [Google Scholar] [CrossRef] [PubMed]
- Malhi, Y.; Franklin, J.; Seddon, N.; Solan, M.; Turner, M.G.; Field, C.B.; Knowlton, N. Climate change and ecosystems: Threats, opportunities and solutions. Philos. Trans. R. Soc. B Biol. Sci. 2020, 375, 20190104. [Google Scholar] [CrossRef] [PubMed]
- Eyring, V.; Gillett, N.P.; Achuta Rao, K.M.; Barimalala, R.; Barreiro Parrillo, M.; Bellouin, N.; Cassou, C.; Durack, P.J.; Kosaka, Y.; McGregor, S.; et al. Human Influence on the Climate System. In Climate Change 2021: The Physical Science Basis. Contribution of Working Group I to the Sixth Assessment Report of the Intergovernmental Panel on Climate Change; Masson-Delmotte, V., Zhai, P., Pirani, A., Connors, S.L., Péan, C., Berger, S., Caud, N., Chen, Y., Goldfarb, L., Gomis, M.I., et al., Eds.; Cambridge University Press: Cambridge, UK; New York, NY, USA, 2021; pp. 423–552. [Google Scholar]
- Chang, J.; Qu, Z.; Xu, R.; Pan, K.; Xu, B.; Min, Y.; Ren, Y.; Yang, G.; Ge, Y. Assessing the ecosystem services provided by urban green spaces along urban center-edge gradients. Sci. Rep. 2017, 7, 11226. [Google Scholar] [CrossRef] [PubMed]
- Dremel, M.; Goličnik Marušić, B.; Zelnik, I. Defining Natural Habitat Types as Nature-Based Solutions in Urban Planning. Sustainability 2023, 15, 13708. [Google Scholar] [CrossRef]
- Ingaramo, M.; Cammerino, A.R.B.; Rizzi, V.; Gioiosa, M.; Monteleone, M. Birds as Cultural Ambassadors: Bridging Ecosystem Services and Biodiversity Conservation in Wetland Planning. Sustainability 2024, 16, 10286. [Google Scholar] [CrossRef]
- Riechers, M.; Barkmann, J.; Tscharntke, T. Perceptions of cultural ecosystem services from urban green. Ecosyst. Serv. 2016, 17, 33–39. [Google Scholar] [CrossRef]
- Castelo, S.; Amado, M.; Ferreira, F. Challenges and Opportunities in the Use of Nature-Based Solutions for Urban Adaptation. Sustainability 2023, 15, 7243. [Google Scholar] [CrossRef]
- Tiago, P.; Leal, A.I.; Silva, C.M. Assessing Ecological Gains: A Review of How Arthropods, Bats and Birds Benefit from Green Roofs and Walls. Environments 2024, 11, 76. [Google Scholar] [CrossRef]
- Nguyen, H.M. Bird Composition as an Ecological Indicator of Forest Disturbance Levels. Ph.D. Thesis, The University of Texas at Austin, Austin, TX, USA, 2007. [Google Scholar]
- Gregory, R. Birds as biodiversity indicators for Europe. Significance 2006, 3, 106–110. [Google Scholar] [CrossRef]
- Gregory, R.D.; van Strien, A. Wild bird indicators: Using composite population trends of birds as measures of environmental health. Ornithol. Sci. 2010, 9, 3–22. [Google Scholar] [CrossRef]
- de Groot, M.; Flajšman, K.; Mihelič, T.; Vilhar, U.; Simončič, P.; Verlič, A. Green space area and type affect bird communities in a South-eastern European city. Urban For. Urban Green. 2021, 63, 127212. [Google Scholar] [CrossRef]
- Threlfall, C.G.; Mata, L.; Mackie, J.A.; Hahs, A.K.; Stork, N.E.; Williams, N.S.G.; Livesley, S.J. Increasing biodiversity in urban green spaces through simple vegetation interventions. J. Appl. Ecol. 2017, 54, 1874–1883. [Google Scholar] [CrossRef]
- Alvey, A.A. Promoting and preserving biodiversity in the urban forest. Urban For. Urban Green. 2006, 5, 195–201. [Google Scholar] [CrossRef]
- Bretzel, F.; Vannucchi, F.; Romano, D.; Malorgio, F.; Benvenuti, S.; Pezzarossa, B. Wildflowers: From conserving biodiversity to urban greening—A review. Urban For. Urban Green. 2016, 20, 428–436. [Google Scholar] [CrossRef]
- Hutt-Taylor, K.; Ziter, C.D.; Frei, B. What evidence exists for the use of urban forest management in nature-based carbon solutions and bird conservation. A systematic map protocol. Environ. Evid. 2022, 11, 34. [Google Scholar] [CrossRef] [PubMed]
- Mekonen, S. Birds as biodiversity and environmental indicator. Indicator 2017, 7, 28–34. [Google Scholar]
- Canterbury, G.E.; Martin, T.E.; Petit, D.R.; Petit, L.J.; Bradford, D.F. Bird Communities and Habitat as Ecological Indicators of Forest Condition in Regional Monitoring. Conserv. Biol. 2000, 14, 544–558. [Google Scholar] [CrossRef]
- Tzoulas, K.; James, P. Making biodiversity measures accessible to non-specialists: An innovative method for rapid assessment of urban biodiversity. Urban Ecosyst. 2009, 13, 113–127. [Google Scholar] [CrossRef]
- Zari, M.P. The importance of urban biodiversity–an ecosystem services approach. Biodivers. Int. J. 2018, 2, 357–360. [Google Scholar] [CrossRef]
- Li, M.; Remme, R.P.; van Bodegom, P.M.; van Oudenhoven, A.P.E. How do nature-based solutions contribute to biodiversity in cities? Ecol. Indic. 2025, 175, 113523. [Google Scholar] [CrossRef]
- Freitas, L.; Chaminé, H.I.; Afonso, M.J.; Meerkhan, H.; Abreu, T.; Trigo, J.F.; Pereira, A.J.S.C. Integrative Groundwater Studies in a Small-Scale Urban Area: Case Study from the Municipality of Penafiel (NW Portugal). Geosciences 2020, 10, 54. [Google Scholar] [CrossRef]
- Penafiel, C.M.d. Operação de Reabilitação Urbana do Vale do Cavalum. 2015; p. 93. [Google Scholar]
- Barboza, E.P.; Montana, F.; Cirach, M.; Iungman, T.; Khomenko, S.; Gallagher, J.; Thondoo, M.; Mueller, N.; Keune, H.; MacIntyre, T. Environmental health impacts and inequalities in green space and air pollution in six medium-sized European cities. Environ. Res. 2023, 237, 116891. [Google Scholar] [CrossRef] [PubMed]
- Bottalico, F.; Chirici, G.; Giannetti, F.; De Marco, A.; Nocentini, S.; Paoletti, E.; Salbitano, F.; Sanesi, G.; Serenelli, C.; Travaglini, D. Air pollution removal by green infrastructures and urban forests in the city of Florence. Agric. Agric. Sci. Procedia 2016, 8, 243–251. [Google Scholar] [CrossRef]
- SPEA. Censo de Aves Comuns—Instruções. Available online: https://www.spea.pt/wp-content/uploads/2021/04/Instrucoes-CAC_2020.pdf (accessed on 4 September 2022).
- Sauer, J.R. Bird Census Techniques, Second Edition. Condor 2002, 104, 698–701. [Google Scholar] [CrossRef]
- Canedoli, C.; Bullock, C.; Collier, M.J.; Joyce, D.; Padoa-Schioppa, E. Public participatory mapping of cultural ecosystem services: Citizen perception and park management in the Parco Nord of Milan (Italy). Sustainability 2017, 9, 891. [Google Scholar] [CrossRef]
- Falanga, R.; Verheij, J.; Bina, O. Green(er) Cities and Their Citizens: Insights from the Participatory Budget of Lisbon. Sustainability 2021, 13, 8243. [Google Scholar] [CrossRef]
- Greenwood, J.J.D. Citizens, science and bird conservation. J. Ornithol. 2007, 148, 77–124. [Google Scholar] [CrossRef]
- Buchel, S.; Frantzeskaki, N. Citizens’ voice: A case study about perceived ecosystem services by urban park users in Rotterdam, the Netherlands. Ecosyst. Serv. 2015, 12, 169–177. [Google Scholar] [CrossRef]
- Marzluff, J.M.; Bowman, R.; Donnelly, R. Avian Ecology and Conservation in an Urbanizing World; Springer Science & Business Media: Berlin/Heidelberg, Germany, 2012. [Google Scholar]
- Shochat, E.; Lerman, S.B.; Anderies, J.M.; Warren, P.S.; Faeth, S.H.; Nilon, C.H. Invasion, competition, and biodiversity loss in urban ecosystems. BioScience 2010, 60, 199–208. [Google Scholar] [CrossRef]
- Pellissier, V.; Cohen, M.; Boulay, A.; Clergeau, P. Birds are also sensitive to landscape composition and configuration within the city centre. Landsc. Urban Plan. 2012, 104, 181–188. [Google Scholar] [CrossRef]
- Peris, S.; Montelongo, T. Birds and small urban parks: A study in a high plateau city. Turk. J. Zool. 2014, 38, 316–325. [Google Scholar] [CrossRef]
- Gilbert, F.; Gonzalez, A.; Evans-Freke, I. Corridors maintain species richness in the fragmented landscapes of a microecosystem. Proc. R. Soc. Lond. Ser. B Biol. Sci. 1998, 265, 577–582. [Google Scholar] [CrossRef]
- Gillies, C.S.; St. Clair, C.C. Riparian corridors enhance movement of a forest specialist bird in fragmented tropical forest. Proc. Natl. Acad. Sci. USA 2008, 105, 19774–19779. [Google Scholar] [CrossRef] [PubMed]
- Jokimäki, J.; Suhonen, J. Distribution and habitat selection of wintering birds in urban environments. Landsc. Urban Plan. 1998, 39, 253–263. [Google Scholar] [CrossRef]
- Faeth, S.H.; Bang, C.; Saari, S. Urban biodiversity: Patterns and mechanisms. Ann. N. Y. Acad. Sci. 2011, 1223, 69–81. [Google Scholar] [CrossRef] [PubMed]
- Wang, D.; Zhang, L.; Zhong, Q.; Zhang, G.; Chen, X.; Zhang, Q. Analysis of Spatial Divergence in Bird Diversity Driven by Built Environment Characteristics of Ecological Corridors in High-Density Urban Areas. Land 2024, 13, 1359. [Google Scholar] [CrossRef]
- Paquet, J. Development of urban bird indicators using data from monitoring schemes in two large European cities S. Herrando, A. Weiserbs, J. Quesada, X. Ferrer. Development 2012, 35, 141–150. [Google Scholar]
- Savard, J.-P.L.; Clergeau, P.; Mennechez, G. Biodiversity concepts and urban ecosystems. Landsc. Urban Plan. 2000, 48, 131–142. [Google Scholar] [CrossRef]
- Morelli, F.; Reif, J.; Díaz, M.; Tryjanowski, P.; Ibáñez-Álamo, J.D.; Suhonen, J.; Jokimäki, J.; Kaisanlahti-Jokimäki, M.-L.; Pape Møller, A.; Bussière, R.; et al. Top ten birds indicators of high environmental quality in European cities. Ecol. Indic. 2021, 133, 108397. [Google Scholar] [CrossRef]
- Southon, G.E.; Jorgensen, A.; Dunnett, N.; Hoyle, H.; Evans, K.L. Biodiverse perennial meadows have aesthetic value and increase residents’ perceptions of site quality in urban green-space. Landsc. Urban Plan. 2017, 158, 105–118. [Google Scholar] [CrossRef]
- Mason, C.F. Avian species richness and numbers in the built environment: Can new housing developments be good for birds? Biodivers. Conserv. 2006, 15, 2365–2378. [Google Scholar] [CrossRef]
- Pennington, D.N.; Hansel, J.; Blair, R.B. The conservation value of urban riparian areas for landbirds during spring migration: Land cover, scale, and vegetation effects. Biol. Conserv. 2008, 141, 1235–1248. [Google Scholar] [CrossRef]
- Aronson, M.F.; La Sorte, F.A.; Nilon, C.H.; Katti, M.; Goddard, M.A.; Lepczyk, C.A.; Warren, P.S.; Williams, N.S.; Cilliers, S.; Clarkson, B. A global analysis of the impacts of urbanization on bird and plant diversity reveals key anthropogenic drivers. Proc. R. Soc. B Biol. Sci. 2014, 281, 20133330. [Google Scholar] [CrossRef] [PubMed]
- Yang, X.; Tan, X.; Chen, C.; Wang, Y. The influence of urban park characteristics on bird diversity in Nanjing, China. Avian Res. 2020, 11, 1–9. [Google Scholar] [CrossRef]
- Bildstein, K.L.; Therrien, J.-F. Urban Birds of Prey: A Lengthy History of Human-Raptor Cohabitation. In Urban Raptors: Ecology and Conservation of Birds of Prey in Cities; Boal, C.W., Dykstra, C.R., Eds.; Island Press/Center for Resource Economics: Washington, DC, USA, 2018; pp. 3–17. [Google Scholar]
- Bayulken, B.; Huisingh, D.; Fisher, P.M.J. How are Nature-based Solutions helping in the greening of cities in the context of crises such as climate change and pandemics? A comprehensive review. J. Clean. Prod. 2021, 288, 125569. [Google Scholar] [CrossRef]
- Hedblom, M.; Murgui, E. Urban Bird Research in a Global Perspective. In Ecology and Conservation of Birds in Urban Environments; Murgui, E., Hedblom, M., Eds.; Springer International Publishing: Cham, Switzerland, 2017; pp. 3–10. [Google Scholar]
- Jokimäki, J.; Huhta, E. Artificial nest predation and abundance of birds along an urban gradient. Condor 2000, 102, 838–847. [Google Scholar] [CrossRef]
- Pinto, L.V.; Pereira, P.; Gazdic, M.; Ferreira, A.; Ferreira, C.S.S. Assessment of NBS Impact on Pluvial Flood Regulation Within Urban Areas: A Case Study in Coimbra, Portugal. In Nature-Based Solutions for Flood Mitigation: Environmental and Socio-Economic Aspects; Ferreira, C.S.S., Kalantari, Z., Hartmann, T., Pereira, P., Eds.; Springer International Publishing: Cham, Switzerland, 2022; pp. 289–312. [Google Scholar]
- Maes, J.; Quaglia, A.P.; Pereira, Â.G.; Tokarski, M.; Zulian, G.; Marando, F.; Schade, S. BiodiverCities: A Roadmap to Enhance the Biodiversity and Green Infrastructure of European Cities by 2030 BiodiverCities: A Roadmap to Enhance the Biodiversity and Green Infrastructure; European Commission: Brussels, Belgium, 2021. [Google Scholar]
- Goddard, M.A.; Dougill, A.J.; Benton, T.G. Scaling up from gardens: Biodiversity conservation in urban environments. Trends Ecol. Evol. 2010, 25, 90–98. [Google Scholar] [CrossRef] [PubMed]
- Baldock, K.C.; Goddard, M.A.; Hicks, D.M.; Kunin, W.E.; Mitschunas, N.; Osgathorpe, L.M.; Potts, S.G.; Robertson, K.M.; Scott, A.V.; Stone, G.N. Where is the UK’s pollinator biodiversity? The importance of urban areas for flower-visiting insects. Proc. R. Soc. B Biol. Sci. 2015, 282, 20142849. [Google Scholar] [CrossRef] [PubMed]
- Babí Almenar, J.; Elliot, T.; Rugani, B.; Philippe, B.; Navarrete Gutierrez, T.; Sonnemann, G.; Geneletti, D. Nexus between Nature-based Solutions, ecosystem services and urban challenges. Land Use Policy 2021, 100, 104898. [Google Scholar] [CrossRef]
- Figlestahler, J. Gauging the Potential of Urban Environments as Prospective Insect Pollinator Habitat. Master’s Thesis, Lund University, Lund, Sweden, 2018. [Google Scholar]
- Baldock, K.C.R. Opportunities and threats for pollinator conservation in global towns and cities. Curr. Opin. Insect Sci. 2020, 38, 63–71. [Google Scholar] [CrossRef] [PubMed]
- Banaszak-Cibicka, W.; Żmihorski, M. Wild bees along an urban gradient: Winners and losers. J. Insect Conserv. 2012, 16, 331–343. [Google Scholar] [CrossRef]
- Udy, K.L.; Reininghaus, H.; Scherber, C.; Tscharntke, T. Plant–pollinator interactions along an urbanization gradient from cities and villages to farmland landscapes. Ecosphere 2020, 11, e03020. [Google Scholar] [CrossRef]
- Westerfelt, P.; Widenfalk, O.; Lindelöw, Å.; Gustafsson, L.; Weslien, J. Nesting of solitary wasps and bees in natural and artificial holes in dead wood in young boreal forest stands. Insect Conserv. Divers. 2015, 8, 493–504. [Google Scholar] [CrossRef]
- Persulessy, Y.E.; Oszaer, R.; Putuhena, J.D. Hot-Spot Biodiversity Approach by using Birds as Indicators for Development of Ecotourism. Int. J. Curr. Microbiol. Appl. Sci. 2019, 8, 1675–1692. [Google Scholar] [CrossRef]
- Lehmann, S. Growing Biodiverse Urban Futures: Renaturalization and Rewilding as Strategies to Strengthen Urban Resilience. Sustainability 2021, 13, 2932. [Google Scholar] [CrossRef]
- Bellamy, C.; van der Jagt, A.P.N.; Barbour, S.; Smith, M.; Moseley, D.D. A spatial framework for targeting urban planning for pollinators and people with local stakeholders: A route to healthy, blossoming communities? Environ. Res. 2017, 158, 255–268. [Google Scholar] [CrossRef] [PubMed]
- Bona, S.; Silva-Afonso, A.; Gomes, R.; Matos, R.; Rodrigues, F. Nature-Based Solutions in Urban Areas: A European Analysis. Appl. Sci. 2022, 13, 168. [Google Scholar] [CrossRef]


| NbS-Types | NbS Intervention | Objective | UGA |
|---|---|---|---|
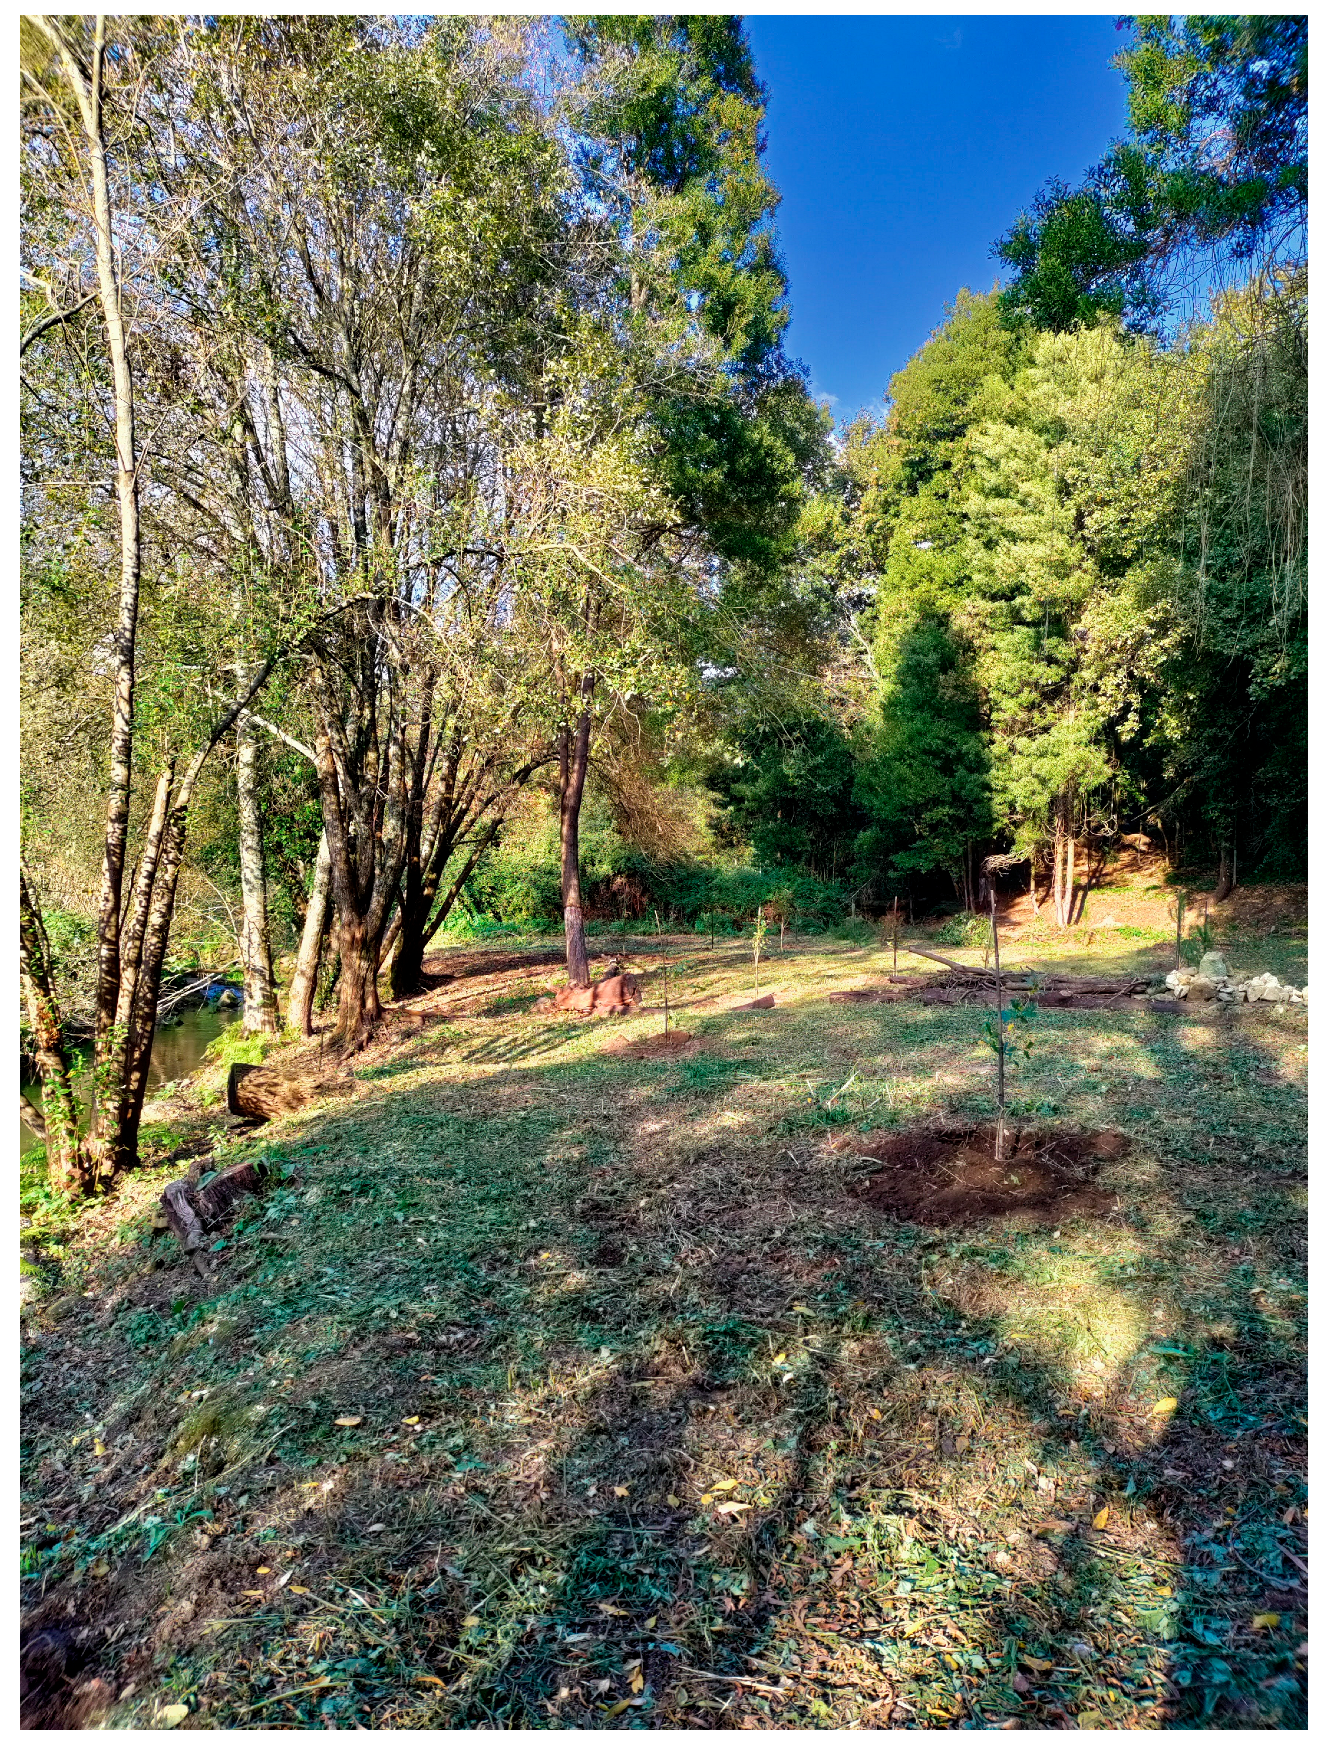
| Ecological Restoration | Recovery and maintenance of riparian vegetation | Reduce water temperature, increase infiltration, reduce riverbank erosion, protect habitats, and increase recreational value, through autochthonous species plantation | A, B and D |
| Natural meadows and pastures seeding | Improve carbon sequestration, enhance biodiversity and improve water quality, through seeding of natural meadows. | C | |
| Ecological Engineering | Natural engineering | Creation of habitats for fauna, stabilize riverbanks, consolidate and promote the accumulation of sediments in specific spots with application of braided Salix atrocinerea. | A and D |
| Forest Landscape Restoration | Afforestation and reforestation with endemic species | Increase tree coverage of endemic species to enhance carbon sequestration; increase endemic biodiversity; control of soil erosion; increase human well-being, by providing areas for recreational activities. | A, B and D |
| Ecosystem-based management | Increasing habitat heterogeneity | Promote an increase in biodiversity and enhance wildfire resilience. | B and D |
| Removal of invasive species | Improving endemic biodiversity and allow native species to prosper. | All | |
| Natural infrastructure | Creation of wetlands | Provide new habitats, water purification through aquatic plants, and increases in cultural ecosystem services, such as esthetic and recreational value or environmental education. | C and D |
| Functional Group | Category | Description |
|---|---|---|
| Foraging | Ground | Take most food from the ground. Includes species that perch in vegetation and prey from the ground |
| Shrubs | Mostly forages in vegetation ≤1 m above ground | |
| Trees | Mostly forages in vegetation >1 m above ground. Includes species that excavate bark | |
| Air | Catches their food flying | |
| All | Forages throughout the range of vertical strata, from ground to the canopy | |
| Nesting | Burrow | Nests in a tunnel in the ground |
| Tree Branches | Constructs nest in trees >1.5 m, in branches or flat parts | |
| Shrubs/Bushes | Nests in shrubs, bushes, or small trees <1 m | |
| Hollow | Nest in a large or small cavity in a tree | |
| Artificial | Nests in anthropic cavities, structures, or others | |
| Other | Not defined or that does not belong in the above definitions | |
| Diet | Frugivore | Mostly raw fruits or succulent fruit-like |
| Granivore | Mainly seeds or grains | |
| Insectivore | Mainly insects | |
| Nectarivores | Main food item is nectar from flowers | |
| Herbivores | Eat different parts of plants | |
| Omnivore | Cannot be differentiated by any type of food | |
| Scavengers | Feed on carrion | |
| Carnivores | Hunts other animals |
| Code | Category | Size | Code | Coverage |
|---|---|---|---|---|
| T | Tree layer | >5 m | 5 | [76%; 100%] |
| St | Shrub layer | Between 2 m and 5 m | 4 | [51%; 75%] |
| Ss | Shrub layer | Between 0.50 m and 2 m | 3 | [26%; 50%] |
| Ht | Herb layer | Between 0.30 m and 1 m | 2 | [6%; 25%] |
| Hm | Herb layer | Between 0.10 m and 0.30 m | 1 | [1%; 5%] |
| Hs | Herb layer | <0.10 m | r | <1% |
| ML | Ground/Rocks | <0.05 m | ||
 ) and insects (
 ) species for the Cavalum Valley per year, as well as the Shannon–Wiener Diversity Index, Simpson’s Reciprocal Index, Simpson’s Index of Dominance, and Cumulative Dominance (%).
) and insects () species for the Cavalum Valley per year, as well as the Shannon–Wiener Diversity Index, Simpson’s Reciprocal Index, Simpson’s Index of Dominance, and Cumulative Dominance (%).
) species for the Cavalum Valley per year, as well as the Shannon–Wiener Diversity Index, Simpson’s Reciprocal Index, Simpson’s Index of Dominance, and Cumulative Dominance (%).
) and insects () species for the Cavalum Valley per year, as well as the Shannon–Wiener Diversity Index, Simpson’s Reciprocal Index, Simpson’s Index of Dominance, and Cumulative Dominance (%).| Baseline | 2022 | 2023 | 2024 | |||||
|---|---|---|---|---|---|---|---|---|
| | | | | | | | |
| Richness | 54 | 11 | 43 | 74 | 42 | 69 | 43 | 74 |
| Average population size | 5.63 | 1.18 | 12.51 | 9.25 | 20.17 | 11.34 | 21.84 | 12.20 |
| Abundance | 304 | 13 | 538 | 685 | 857 | 783 | 941 | 903 |
| Shannon-Wiener Diversity Index | 3.64 | 2.35 | 3.33 | 3.93 | 3.27 | 3.84 | 3.33 | 3.85 |
| Simpson’s Reciprocal Index | 31.65 | 9.94 | 20.97 | 40.25 | 19.55 | 33.80 | 21.12 | 34.56 |
| Simpson’s Index of Dominance | 0.032 | 0.101 | 0.048 | 0.025 | 0.051 | 0.030 | 0.048 | 0.029 |
| Cumulative Dominance (%) | 50.3 | 100 | 46.3 | 22.4 | 52.7 | 30.1 | 47.6 | 10.1 |
| Category | Group | Richness (n=) |
|---|---|---|
| Foraging | Ground | 21 |
| Shrubs | 10 | |
| Trees | 10 | |
| Air | 13 | |
| All | 9 | |
| Nesting | Burrow | 9 |
| Tree Branches | 17 | |
| Shrubs/Bushes | 14 | |
| Hollow | 11 | |
| Artificial | 5 | |
| Other | 7 | |
| Diet | Carnivores | 4 |
| Granivore | 15 | |
| Insectivore | 34 | |
| Omnivore | 10 |
Disclaimer/Publisher’s Note: The statements, opinions and data contained in all publications are solely those of the individual author(s) and contributor(s) and not of MDPI and/or the editor(s). MDPI and/or the editor(s) disclaim responsibility for any injury to people or property resulting from any ideas, methods, instructions or products referred to in the content. |
© 2025 by the authors. Licensee MDPI, Basel, Switzerland. This article is an open access article distributed under the terms and conditions of the Creative Commons Attribution (CC BY) license (https://creativecommons.org/licenses/by/4.0/).
Share and Cite
Pinto, M.Q.; Varandas, S.; Cohen-Shacham, E.; Cabecinha, E. Birds, Bees, and Botany: Measuring Urban Biodiversity After Nature-Based Solutions Implementation. Diversity 2025, 17, 486. https://doi.org/10.3390/d17070486
Pinto MQ, Varandas S, Cohen-Shacham E, Cabecinha E. Birds, Bees, and Botany: Measuring Urban Biodiversity After Nature-Based Solutions Implementation. Diversity. 2025; 17(7):486. https://doi.org/10.3390/d17070486
Chicago/Turabian StylePinto, Mónica Q., Simone Varandas, Emmanuelle Cohen-Shacham, and Edna Cabecinha. 2025. "Birds, Bees, and Botany: Measuring Urban Biodiversity After Nature-Based Solutions Implementation" Diversity 17, no. 7: 486. https://doi.org/10.3390/d17070486
APA StylePinto, M. Q., Varandas, S., Cohen-Shacham, E., & Cabecinha, E. (2025). Birds, Bees, and Botany: Measuring Urban Biodiversity After Nature-Based Solutions Implementation. Diversity, 17(7), 486. https://doi.org/10.3390/d17070486