Article

Land Use Effects on the Space Use and Dispersal of an Apex Predator in an Ecotone Between Tropical Biodiversity Hotspots

by
Bernardo Brandão Niebuhr
1,2,3,*,
Sandra M. C. Cavalcanti
2,
Ermeson A. Vilalba
2,
Vanessa V. Alberico
2,
João Carlos Zecchini Gebin
2,
Danilo da Costa Santos
2,
Ananda de Barros Barban
2,
Raphael de Oliveira
2,
Eliezer Gurarie
4 and
Ronaldo G. Morato
1,5
1
Instituto Chico Mendes de Conservação da Biodiversidade, Centro Nacional de Pesquisa e Conservação de Mamíferos Carnívoros (ICMBio/CENAP), Atibaia 12952-425, São Paulo, Brazil
2
Instituto para a Conservação dos Carnívoros Neotropicais (PRÓ-CARNÍVOROS), Atibaia 12945-010, São Paulo, Brazil
3
Norwegian Institute for Nature Research (NINA), 0855 Oslo, Norway
4
Department of Environmental Biology, SUNY College of Environmental Science and Forestry, Syracuse, NY 13210, USA
5
Panthera, New York, NY 10018, USA
*
Author to whom correspondence should be addressed.
Diversity 2025, 17(6), 435; https://doi.org/10.3390/d17060435
Submission received: 24 March 2025 / Revised: 4 June 2025 / Accepted: 11 June 2025 / Published: 19 June 2025
(This article belongs to the Special Issue Landscape Biodiversity)

Abstract

Assessing the ranging and dispersal behavior of apex predators and its consequences for landscape connectivity is of paramount importance for understanding population and ecosystem effects of anthropogenic land use change. Here, we synthesize ranging and dispersal ecological information on pumas (Puma concolor) and present estimates of how different land uses affect the space use and dispersal of pumas on fragmented landscapes in an ecotone between biodiversity hotspots in southeastern Brazil. Additionally, we evaluate the effect of animal translocations on dispersal and movement patterns. Using location data for 14 GPS-collared pumas and land use data, we assessed when, how long, and how far individuals dispersed; how forest loss and infrastructure influenced puma home range size; and how movement patterns changed according to land use and proximity to infrastructure, during ranging and dispersal, for residents, natural dispersers, and translocated individuals. We present the first detailed record on the dispersal of pumas in Brazil and in the tropics, including long-distance dispersals, and show that pumas moved faster and more linearly during dispersal than during ranging. Their movement was slower and their home ranges were smaller in more forested areas, underscoring the importance of forest as habitat. In contrast, movement rates were higher in open pastures, mainly during dispersal. Our study underscores the scarcity of research on puma space use and dispersal in South America and reveals partial divergences in dispersal behaviors compared to North America and temperate regions, especially concerning dispersal ages. Furthermore, we give the first steps in presenting how land cover and human infrastructure affect the movement of this apex predator in a tropical ecosystem, an important subsidy for land use management. We call for more comprehensive studies on the movement ecology of carnivores combined with long-term population monitoring, to allow linking individual behavior with metapopulation dynamics and landscape connectivity and drawing more effective measures to sustain their populations.

1. Introduction

Habitat loss and fragmentation caused by land use and land cover change have profound effects on biodiversity at multiple spatial and temporal scales, from individuals to populations and ecosystems [1,2,3]. Investigating the effects of landscape changes on animal space use, movement, and behavior is key for understanding how individual responses translate into landscape- and population-level consequences for species [4,5,6]. Space use is an important aspect of animal behavioral ecology and is shaped by interactions among conspecifics, heterospecifics, and the environment [7]. Understanding wildlife movement and space use is pivotal not only for deciphering the dynamics of species’ interactions but also for devising conservation and management strategies in human-modified landscapes.
Most animals live their lives moving between ranges, which can either vary over time (as in seasonal ranges) or be stable (home ranges). Animal ranges and movements within them serve as indicators of a species’ spatial and resource needs [8]. While animals with seasonal ranges often migrate between them, animals with more stable home ranges are either born and stay within them (natal ranges) or need to disperse toward them (e.g., natal and breeding dispersal), possibly reaching new populations and contributing to gene flow [9]. To account for species responses and connectivity in landscape management, we need to understand how animals transition between ranging and dispersal behaviors, and how these behaviors are affected by multiple land use changes. This includes understanding how animals behave not only in natural dispersal but also when individuals and populations are managed, e.g., through translocation [10]. Despite being fundamental aspects of wildlife ecology, ranging and dispersal remain unknown for a wide range of species and regions, as in Central and South America [11,12]. This knowledge gap, associated with the accelerated habitat loss, leads to the need to make predictions and transfer models based on data collected elsewhere, typically in highly studied areas in the Global North (e.g., [13,14]). Since the quality and validity of these transferred models are hardly evaluated [15,16], much remains unknown about land use effects on animal movement and their population consequences in understudied regions, potentially resulting in ineffective or suboptimal conservation policies.
Large carnivores have been shown to use different resources and habitats [17,18] and move smaller distances [19] in human-modified landscapes. As a consequence, these carnivores have less access to high-quality habitats and present decreased connectivity between populations [14], which typically results in diminished genetic variability [20,21] and lower population densities [22,23]. Fragmentation and declines in carnivore populations can have cascading effects on communities and ecosystems, particularly among top predators [24,25,26]. Therefore, understanding ranging and dispersal behavior and landscape connectivity is crucial for apex predators. This is particularly critical within biodiversity hotspots, where these species are linked to a wide web of unstable relations with many other species and habitats [27].
Pumas (Puma concolor) are the top predators with the broadest geographical distribution in the Americas, occurring from Canada to the Southern tip of the Andes [28], and their presence has profound community and ecosystem consequences [25]. While the species is globally categorized as of least concern for conservation [29], within Brazil, it is considered vulnerable in several states [30]. Despite extensive studies on puma space use and population dynamics in North America (e.g., [31,32,33,34,35]), their ecology remains relatively unknown in other regions. In Brazil, the first puma studies occurred in projects where they occurred in sympatry with jaguars (Panthera onca) (see ref. [10] and references therein). More recently, new studies have been unveiling aspects of habitat use [36,37], diet [18,38], landscape genetics [13,39,40], and the reintroduction of individuals in nature [41,42], yet knowledge regarding movement patterns and dispersal remains scarce. Unlike the northern hemisphere, few studies in the southern hemisphere provide detailed descriptions of puma movement and resource selection based on GPS data [36,43], with just one documented case of (long-distance) dispersal in Patagonia [44]. Consequently, critical gaps persist in our understanding of puma ecology, including ranging and dispersal behavior, the determinants of these patterns [45], and their implications for (meta)population dynamics [46].
In North America, 50 to 75% of puma deaths result from human persecution or direct human actions [28,47], and a similar scenario is expected across their distribution [48]. On the one hand, large-scale agricultural expansion, livestock, urbanization, and industrial development have been encroaching on natural areas, leading to habitat loss and fragmentation [11,49]. These changes are expected to lead to increasingly isolated puma populations. On the other hand, the wide variability in puma habitat use, diet, and behavior distinguishes them from jaguars and other small cats [11,18] and might grant them resilience against landscape changes. Research in southern and southeastern Brazil reported the absence of genetic structure in the studied puma populations [13,39], suggesting non-isolated populations (but see [50] for an opposite conclusion). However, one of the studies [13] adapted an approach and data from North America based on expert knowledge [51], and uncertainties persist regarding the applicability of such approaches to the South American and tropical contexts.
We investigated the dispersal, home range, and movement patterns of pumas in fragmented landscapes of southeastern Brazil, in the ecotone between two biodiversity hotspots, and compared them with published information from other regions. Using GPS data, we characterized puma dispersal in highly fragmented landscapes, estimated home range sizes, and investigated the landscape factors that influence home range size and movement patterns during both ranging and dispersal. Furthermore, we compared these patterns across individuals who were permanent residents, natural dispersers, and translocated dispersers to investigate the effects of translocation on puma behavior. We formulated hypotheses for each of these aims. First, we expected pumas to move faster and more directionally during dispersal [52] compared to ranging [fast dispersal hypothesis]. Second, we expected pumas to present smaller home ranges in areas with a higher proportion of forest and close to rivers [23,36], assuming forests and water would provide them with an abundance of prey resources [forest importance hypothesis]. An alternative hypothesis regarding home range areas would be that, given the wide puma behavioral plasticity and the documented consumption of alternative prey from agricultural matrices in fragmented landscapes [18], pumas do not increase their home ranges in landscapes with less forest amount [behavioral plasticity hypothesis]. Third, we expected pumas to use forests less frequently and cross agricultural and anthropogenic areas faster and more often at night, when there is less human disturbance [53], especially during dispersal events [human disturbance hypothesis]. Finally, we expected translocated animals to cross longer distances and move less tortuously than natural dispersers and residents [translocation hypothesis] [54,55].

2. Materials and Methods
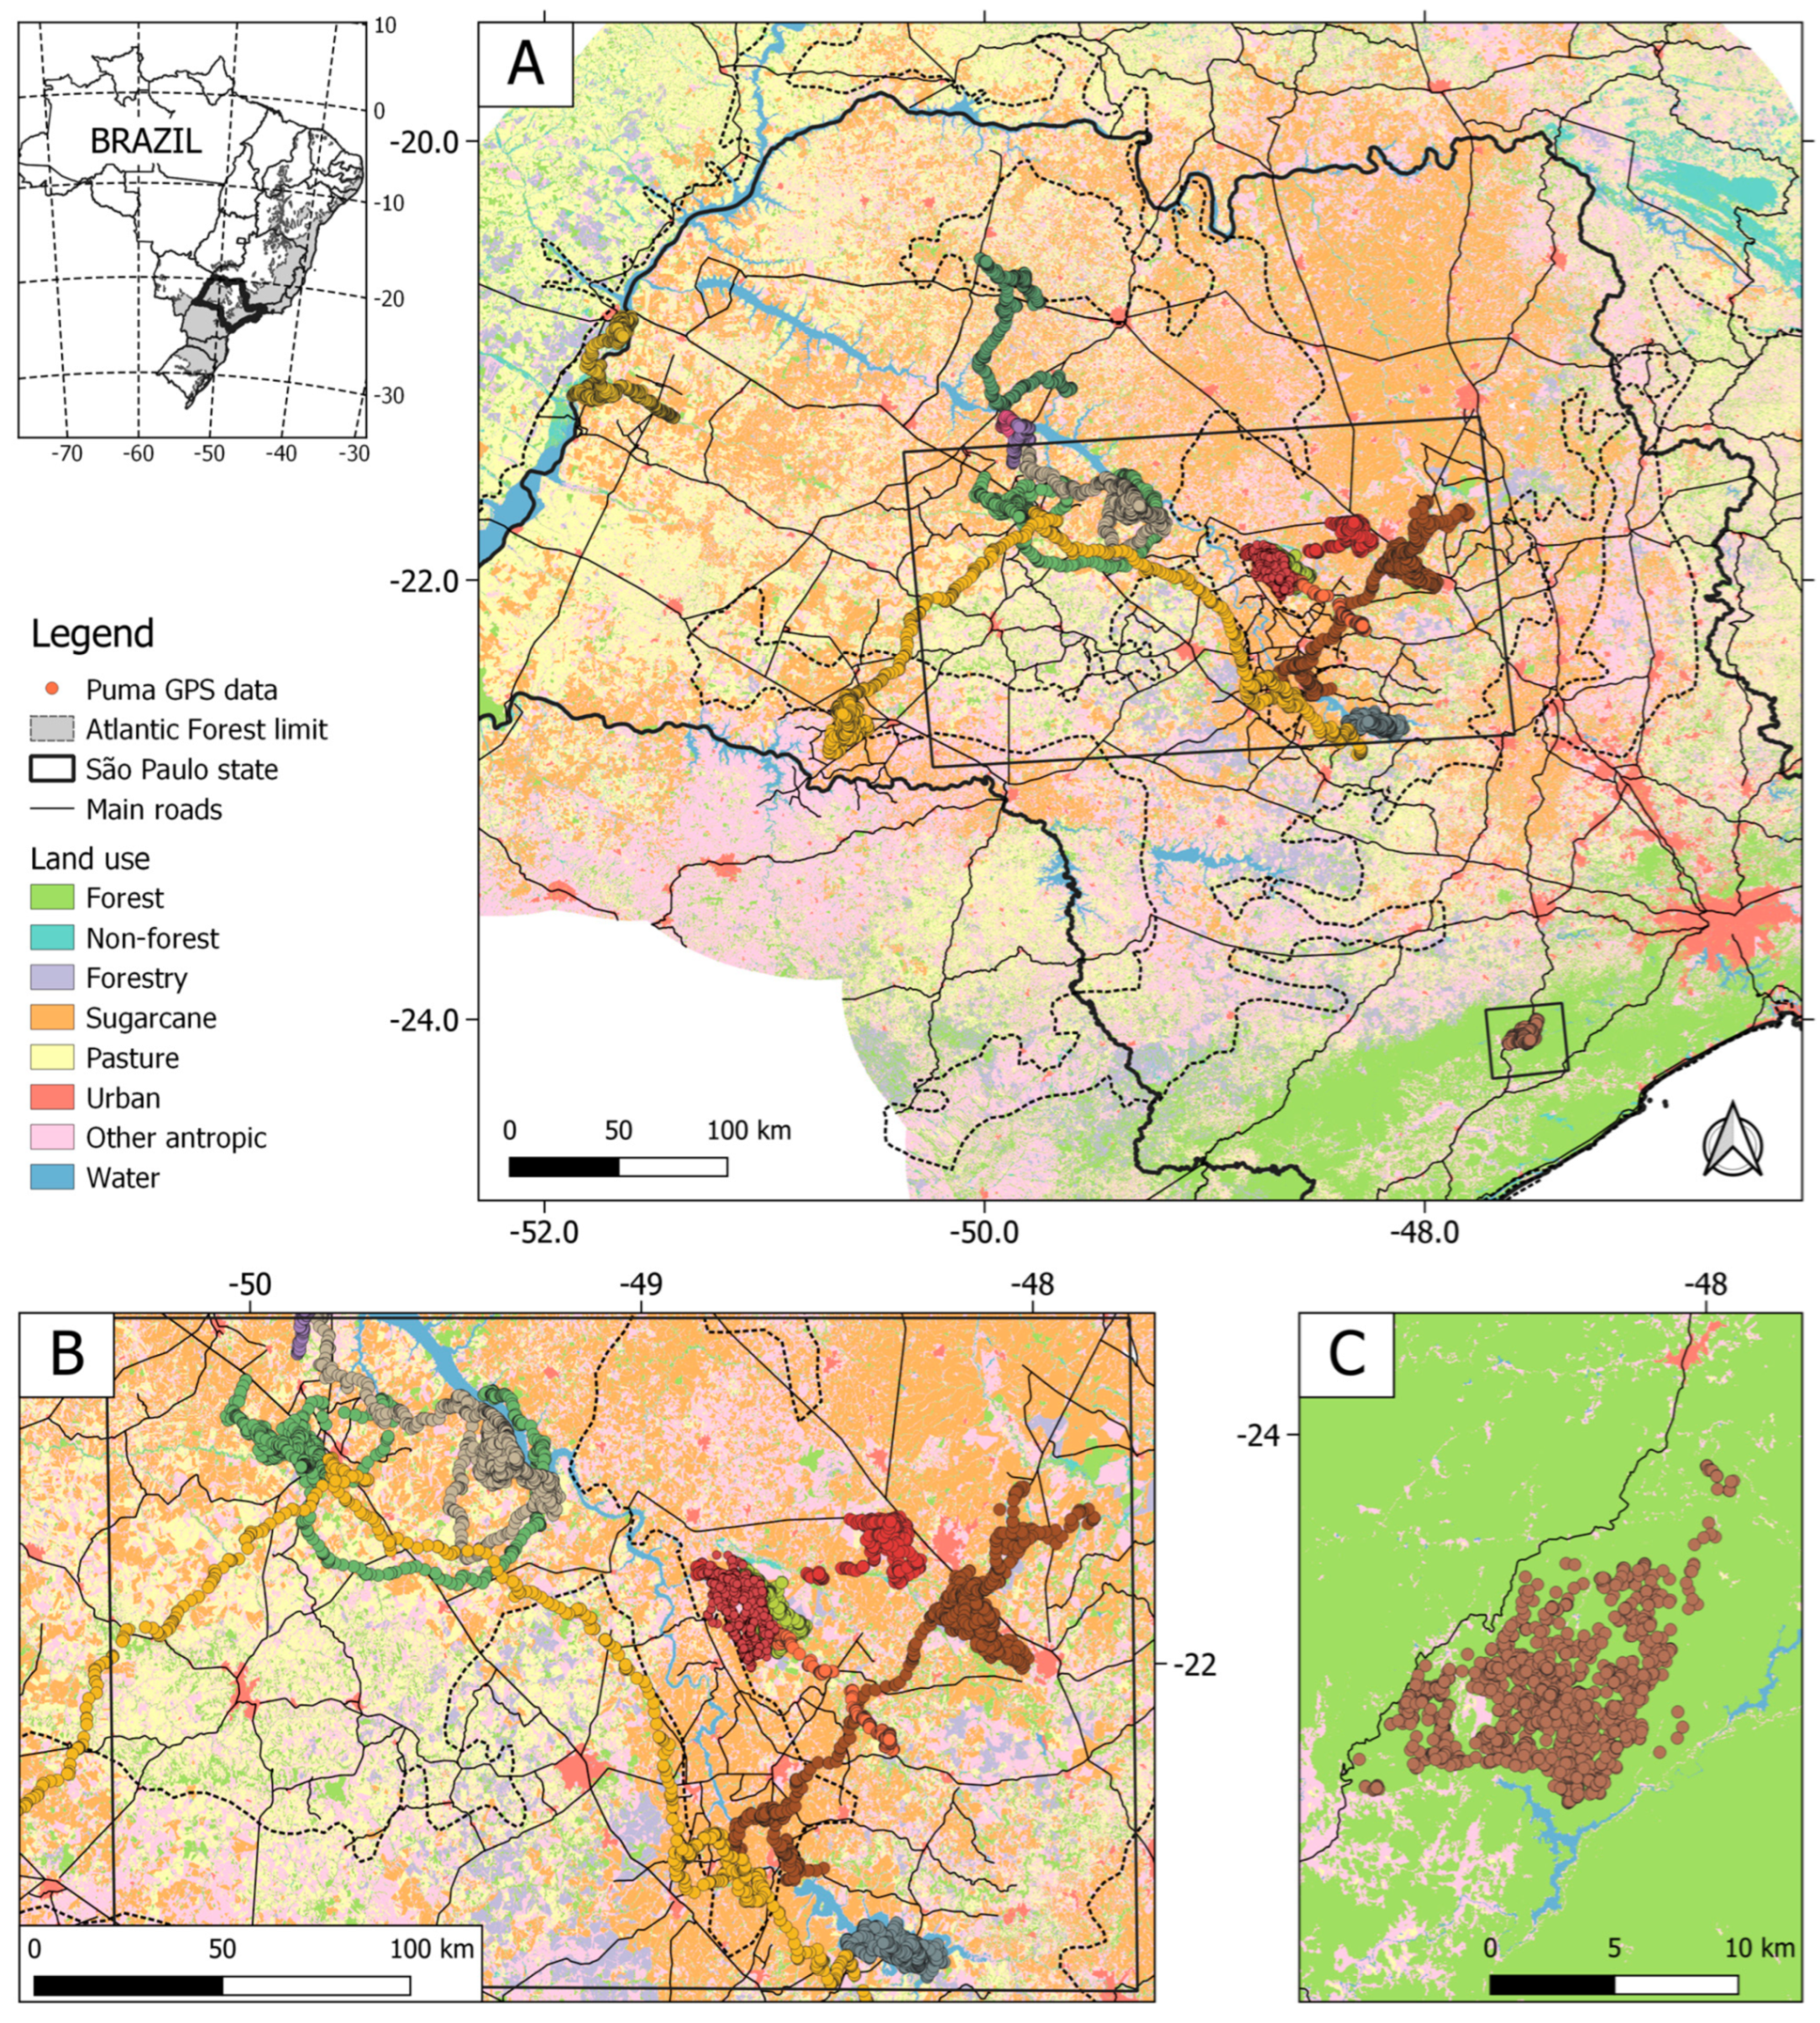
2.1. Study Area

The study was conducted in the ecotone between two biodiversity hotspots, the Atlantic Forest and the Cerrado, in the state of São Paulo, Brazil (Figure 1). The Atlantic Forest, one of the world’s most biodiverse yet fragmented biomes, retains only about 23% of its original forests [56]. The Brazilian Cerrado, the largest Savannah in the Americas and the richest in species worldwide, currently has only 50% of its native vegetation [57,58], despite harboring approximately 30% of Brazil’s biodiversity. In the state of São Paulo, the Atlantic Forest consists of a few very large patches of subtropical moist rainforest close to the coast and thousands of small deciduous and semi-deciduous forest patches in the countryside. The Cerrado in São Paulo is composed of a combination of semi-deciduous forests and savannahs. Most of the loss of natural vegetation in the region happened before 2005, and in the last two decades, the land use changes have mainly consisted of a rotation of types of large-scale agriculture [56].
Apart from one individual that was monitored in the Serra do Mar, a mountainous region located in the largest Atlantic Forest continuum along the Brazilian coast, most pumas were captured and monitored along the Tietê River basin, covering the region between the cities of Promissão, Ibitinga, and Barra Bonita (21°46′04″ S, 48°59′07″ W; Figure 1). The area is predominantly characterized by anthropogenic land use, including sugarcane plantations, pasture lands for cattle production, citrus plantations, and other anthropogenic uses. Forests cover only 13% of the study area [57]. Although urban areas occupy merely 3% of São Paulo, they are home to approximately 44 million people, and the state is traversed by thousands of kilometers of large and small roads.
Jaguars coexist with pumas in the continuous coastal forests of the Atlantic Forest but they were already extirpated from the fragmented landscapes toward the interior part of the state, where pumas remain as the sole top terrestrial mammal predator. In the fragmented areas, pumas primarily prey on nine-banded armadillos (Dasypus novemcinctus), capybaras (Hydrochoeris hydrochaeris), lowland pacas (Cuniculus paca), deer (Subulo gouazoubira or Mazama sp.), wild boars (Sus scrofa), and several small mammals and birds. Occasionally, pumas may also prey on domesticated animals such as lambs and cattle calves.

2.2. Puma GPS Data

Pumas were captured with foot snares [59] and collared with GPS collars with a drop-off system (Sirtrack/Lotek, Havelock North, New Zealand, model Pinnacle). Snares were attached to 7-mm steel cables with swivels at both ends to prevent cable twisting during animals’ attempts to escape. Springs were attached to the handle to help absorb the impact from the pumas trying to pull their feet from the snares. The cables were firmly anchored to the ground by four 1-m-long iron stakes, placed crosswise to ensure a secure anchorage. Trigger tension was set so that it was activated only by large animals (>20 kg). Snares were set on trails, at locations where pumas had been previously recorded by camera traps or footprint tracks. Blind sets were used without the use of baits. Snares were closed daily in the morning, during visual checks of the sets, and reopened late in the afternoon. To minimize the time animals remained trapped, at night, snares were continuously monitored by TBT-500 transmitters (Telonics, Mesa, AZ, USA), which indicated if a snare was triggered.
Captured pumas were immobilized with a combination of tiletamine and zolazepam (10 mg/kg, Fort Dodge do Brasil), with ketamine supplementation when necessary. After examination, measurement, weighting, and sexing, the individual’s age was estimated based on the presence of milk or permanent dentition, tooth staining and wear, and other indicative signs [60,61]. The temperature, pulse, and breathing of the pumas were monitored throughout the procedure until complete recovery from anesthesia.
Fourteen pumas were fitted with GPS collars and most were released at the capture location. Of those, four animals captured within urban areas were opportunistically collared and translocated to high-quality forest patches within the same municipality limits, up to 40 km from the capture site. Another individual was not healthy when captured and was released ca. 100 km from the capture site after 8 months in captivity. GPS collars recorded one position per hour and positions were transmitted daily through satellite to a centralized system. Animals were monitored until death (n = 6), collar failure (n = 7), or collar drop-off (n = 1).
GPS data wrangling was performed in R, version 4.4 [62]. Obvious outlier GPS locations were checked and removed from the data. Since collars were programmed to record one position per hour, locations that were recorded more than 1.5 h apart from each other were separated into different movement bursts, so that no displacement was considered for these intervals. Broader scale analyses for the identification of ranging and dispersal phases and the characterization of dispersal events were based on data regularized with 1 position per day (see below); else, all the fine-scale analyses were based on the hourly displacements, and the gaps between movement bursts were not considered.

2.3. Environmental Data

We compiled environmental data to understand animal movement patterns during ranging and dispersal. We used land cover data from the Brazilian Foundation for Sustainable Development [63], complemented by maps on sugarcane plantations from CanaSat [64] and pastures for cattle production [65]. The final land cover map included eight classes: forest, non-forest natural areas, urban areas, forestry, water, sugarcane, pasture, and other anthropic uses. Geographical information on the main roads was obtained from the National Department of Transport Infrastructure [66]. Distance to and density of water, roads, and urban areas were computed to assess their impact on puma movement patterns. Detailed information on these geographical layers is provided in Table S1 in the Supplementary Material SA. All data processing was conducted using GRASS GIS software, version 7.8 [67].

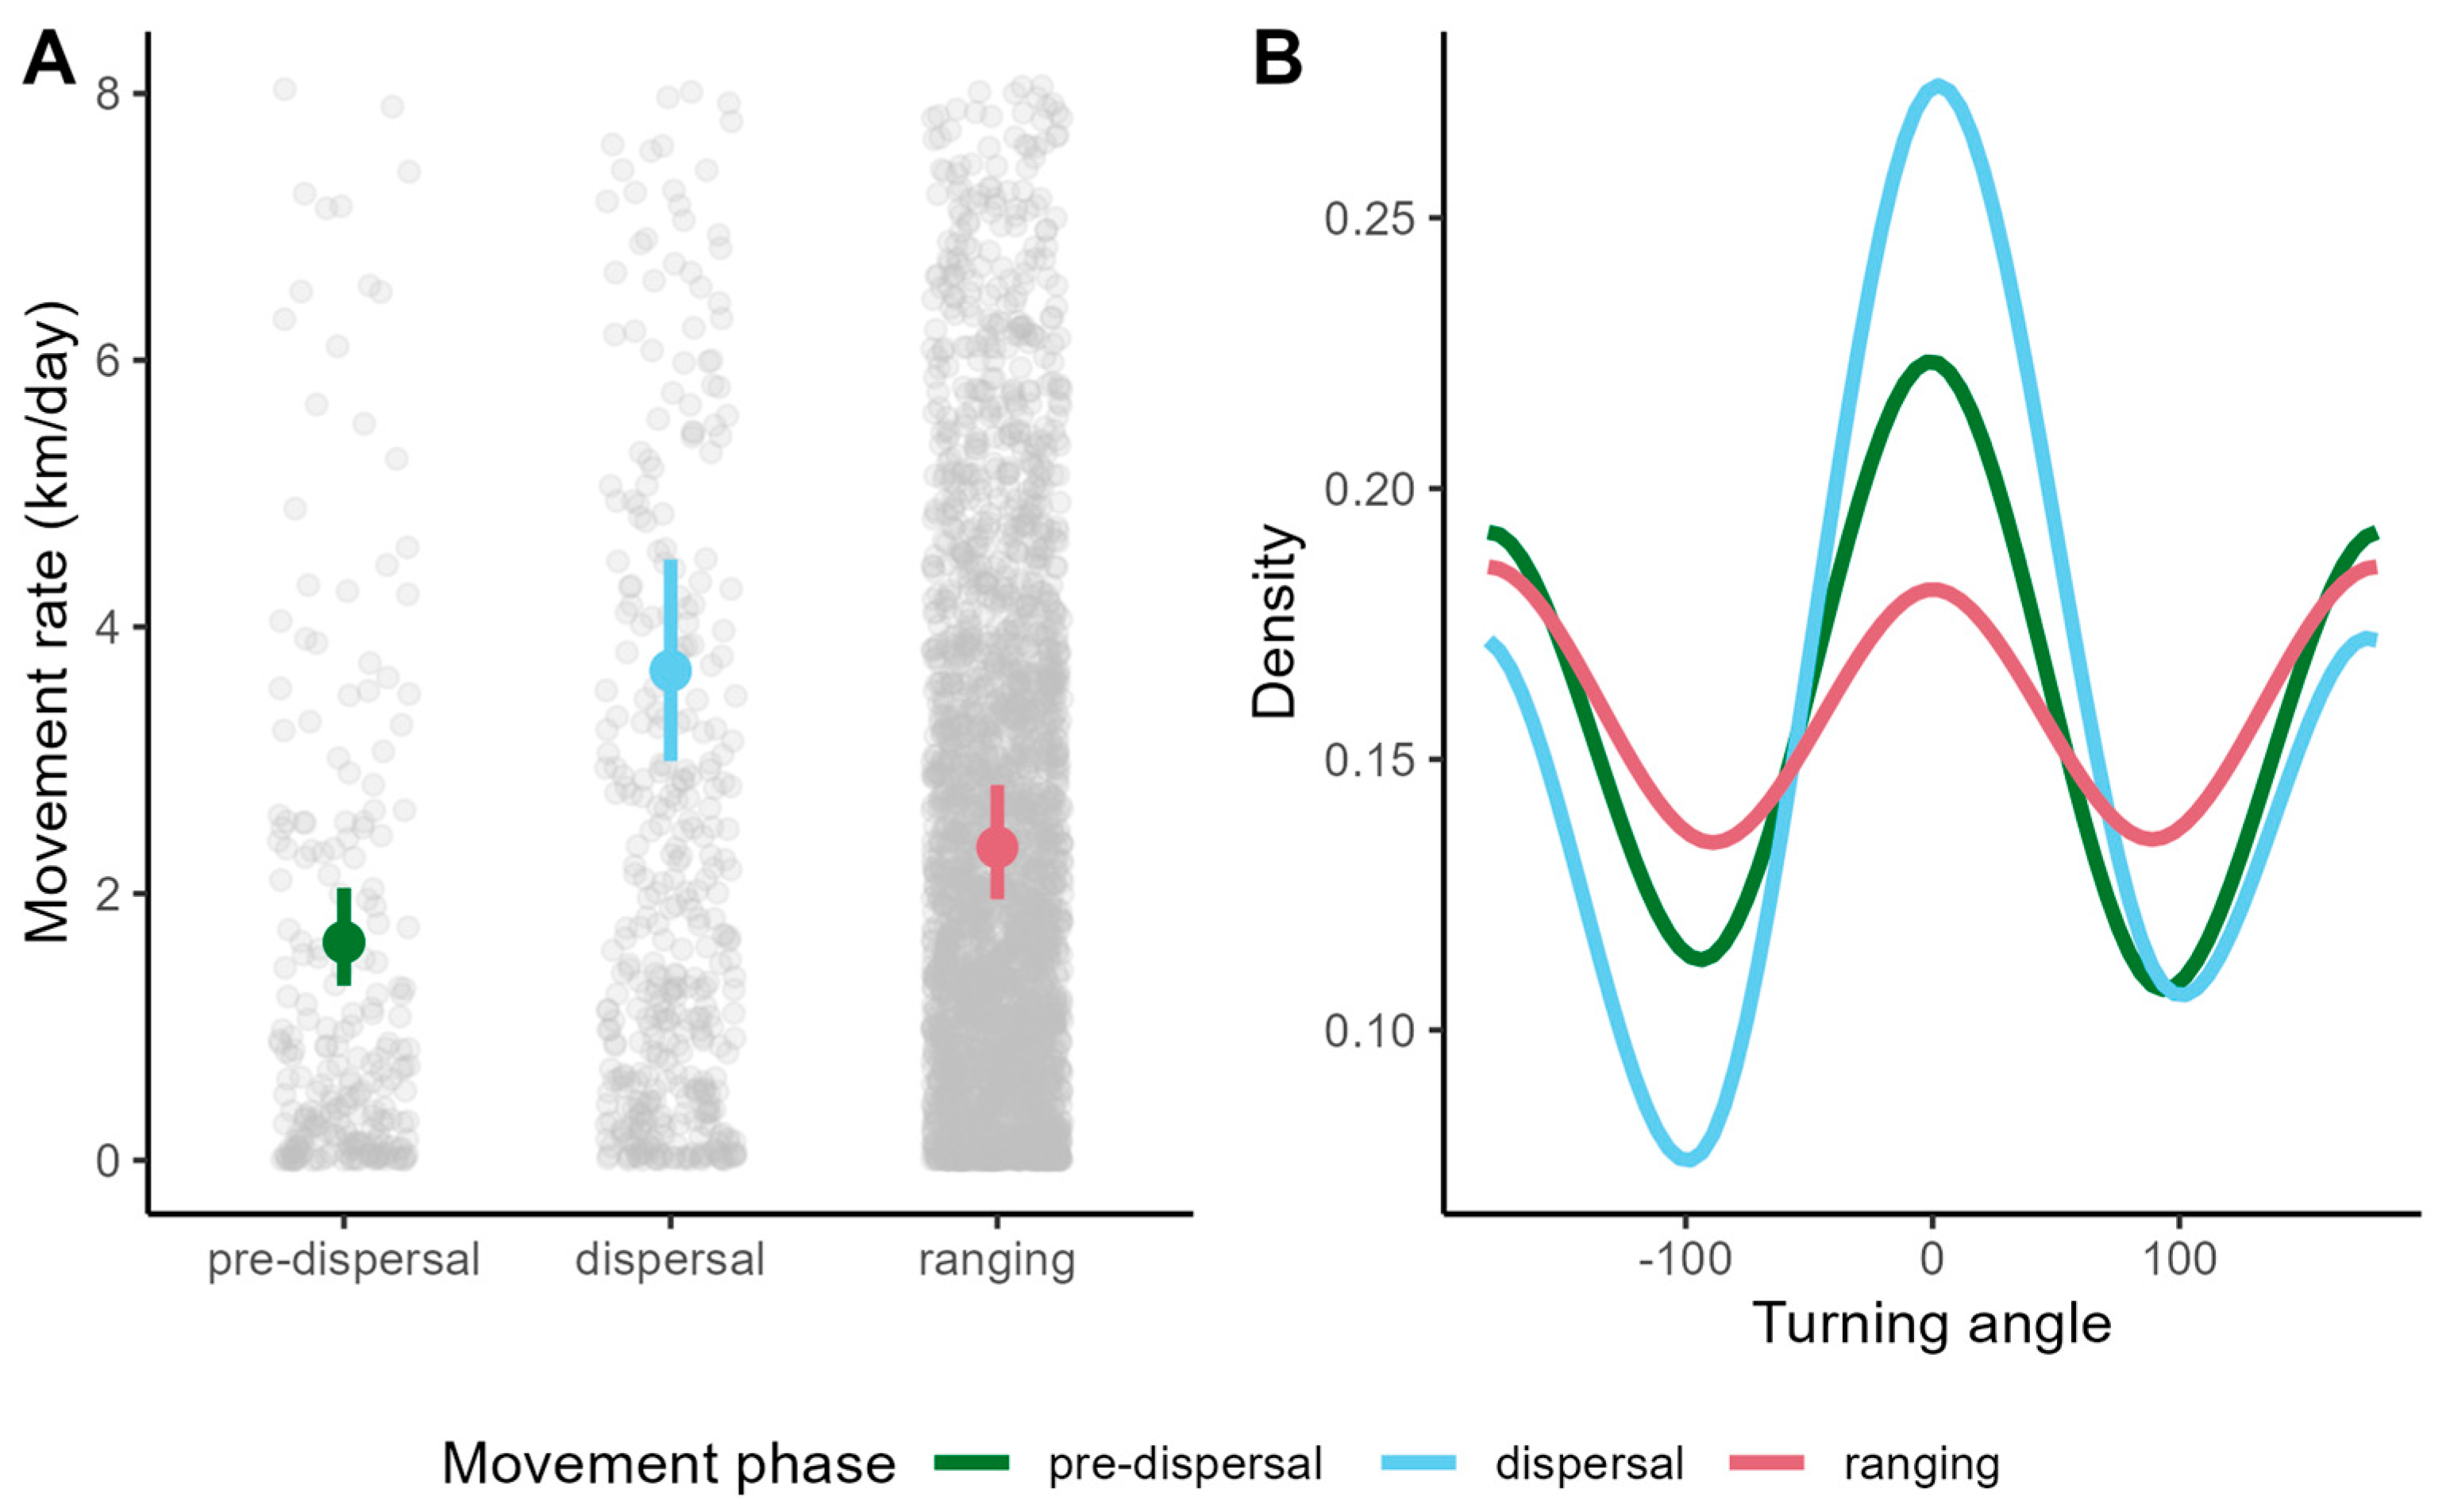
2.4. Identifying and Characterizing Ranging and Dispersal

Our analysis centers on differentiating ranging and dispersal behaviors. As we considered here, ranging is a central-place behavior that defines a home range for the individuals, where they remain for an extended period. As such, ranging is composed of movements constrained by the presence of a central attractor. In contrast, dispersal entails spatially unconstrained movements after departing from or before settling in a range. To identify the transitions between the ranging and dispersal behavioral phases (departure and settling events), we followed the approach by Barry et al. [52] to fit statistical models to each of the ranging and dispersal behaviors and test for the most likely dates of transition between them by calculating and maximizing a joint likelihood function for the two models. We employed an Ornstein–Uhlenbeck–Fleming (OUF) model to represent ranging, characterized by autocorrelation in locations and speed and by a home range area of use [68,69], and a continuous velocity model (CVM) to represent dispersal, defined by a mean value and autocorrelation on speed [70]. For regularly sampled data, the OUF and CVM models may be approximated by autoregressive time series models (an ARMA(1,1) and an ARIMA(1,1,0), respectively; Barry et al., ref. [49]). To ensure regularity, data were resampled to one position per day, which was enough to identify the transitions between movement phases, since dispersal events occur on time scales longer than a few hours. ARIMA models were fitted separately to the x and y coordinates of the movement data, with the same transition dates between behaviors, but a single likelihood function was built for them. For more details, see Barry et al. [52]. To keep the approach simple, after a qualitative evaluation of the movement of pumas, we only fitted models including a single dispersal phase. We used the Akaike information criterion (AIC) to evaluate whether it was more likely that an individual was a resident or a disperser. Residents are defined here as individuals who were permanently in a ranging behavior during their whole monitoring period. In contrast, dispersers are individuals that (i) started in ranging behavior and transitioned to dispersal; (ii) started as dispersers, with unconstrained movements, and switched to ranging behavior; or (iii) dispersed between two periods of ranging behavior. As such, dispersers were further assessed for evidence of one or two ranging phases. Once identified, movement phases were classified into pre-dispersal, dispersal, and ranging. Pre-dispersal and dispersal were restricted to disperser individuals, while ranging was observed in both residents and dispersers. Pre-dispersal was considered in this analysis of the identification of behavioral phases for each individual and in the overall characterization of puma dispersal (see below), but as they were typically short periods in our study, they were removed from further analyses.
To account for the potential effect of translocation on dispersal patterns and movement within dispersal and ranging phases, we tested whether the different analyses varied according to individual status. Given that all translocated individuals dispersed, we evaluated the differences in the space use metrics between residents, natural dispersers, and translocated dispersers.
After movement phases were identified, we first characterized the broad-scale dispersal patterns for dispersers (n = 8). We calculated the duration of the dispersal events and the Euclidean and total dispersal distances. Euclidean distance was computed as the straight-line distance between the first and last location of the dispersal phase, while the total dispersal distance was the sum of the length of all 1 h-steps traveled during dispersal. We also estimated dispersal ages and recorded individuals’ fates. We characterized movement patterns in each behavioral phase by fitting a Gamma distribution to the movement rates and a von Mises distribution to the turning angles, including individuals as a random intercept. We also compared the movement rate and turning angle patterns across movement phases between residents, natural dispersers, and translocated dispersers (n = 14).
To characterize home ranges, for each individual, we computed variograms and estimated continuous-time movement models and home ranges using the ctmm package [68,71]. That was performed only for the data when animals were identified as in ranging behavior (n = 14). We fitted three movement models to the ranging data: (1) an independent identically distributed process (IID), which, although it is not a typical movement model, is characterized by a home range behavior; (2) an Ornstein-Uhlenbeck (OU) model, which assumes autocorrelation in positions but not in velocities; and (3) an OUF model, as explained above. We fitted movement models through a maximum likelihood approach and used starting values taken from the analysis of variograms. Models were compared through AIC adjusted for small samples (AICc) using the standard tools from the ctmm package [68] (see Supplementary Material SB for methodological details). The most likely movement model was used to estimate home range areas using autocorrelated kernel density estimation (AKDE; [72,73]). Even though barriers were not formally included in the computation of the home ranges, when the ranges included large parts of a hydropower reservoir, the 95% AKDE were manually edited to remove the parts within the reservoir limits.

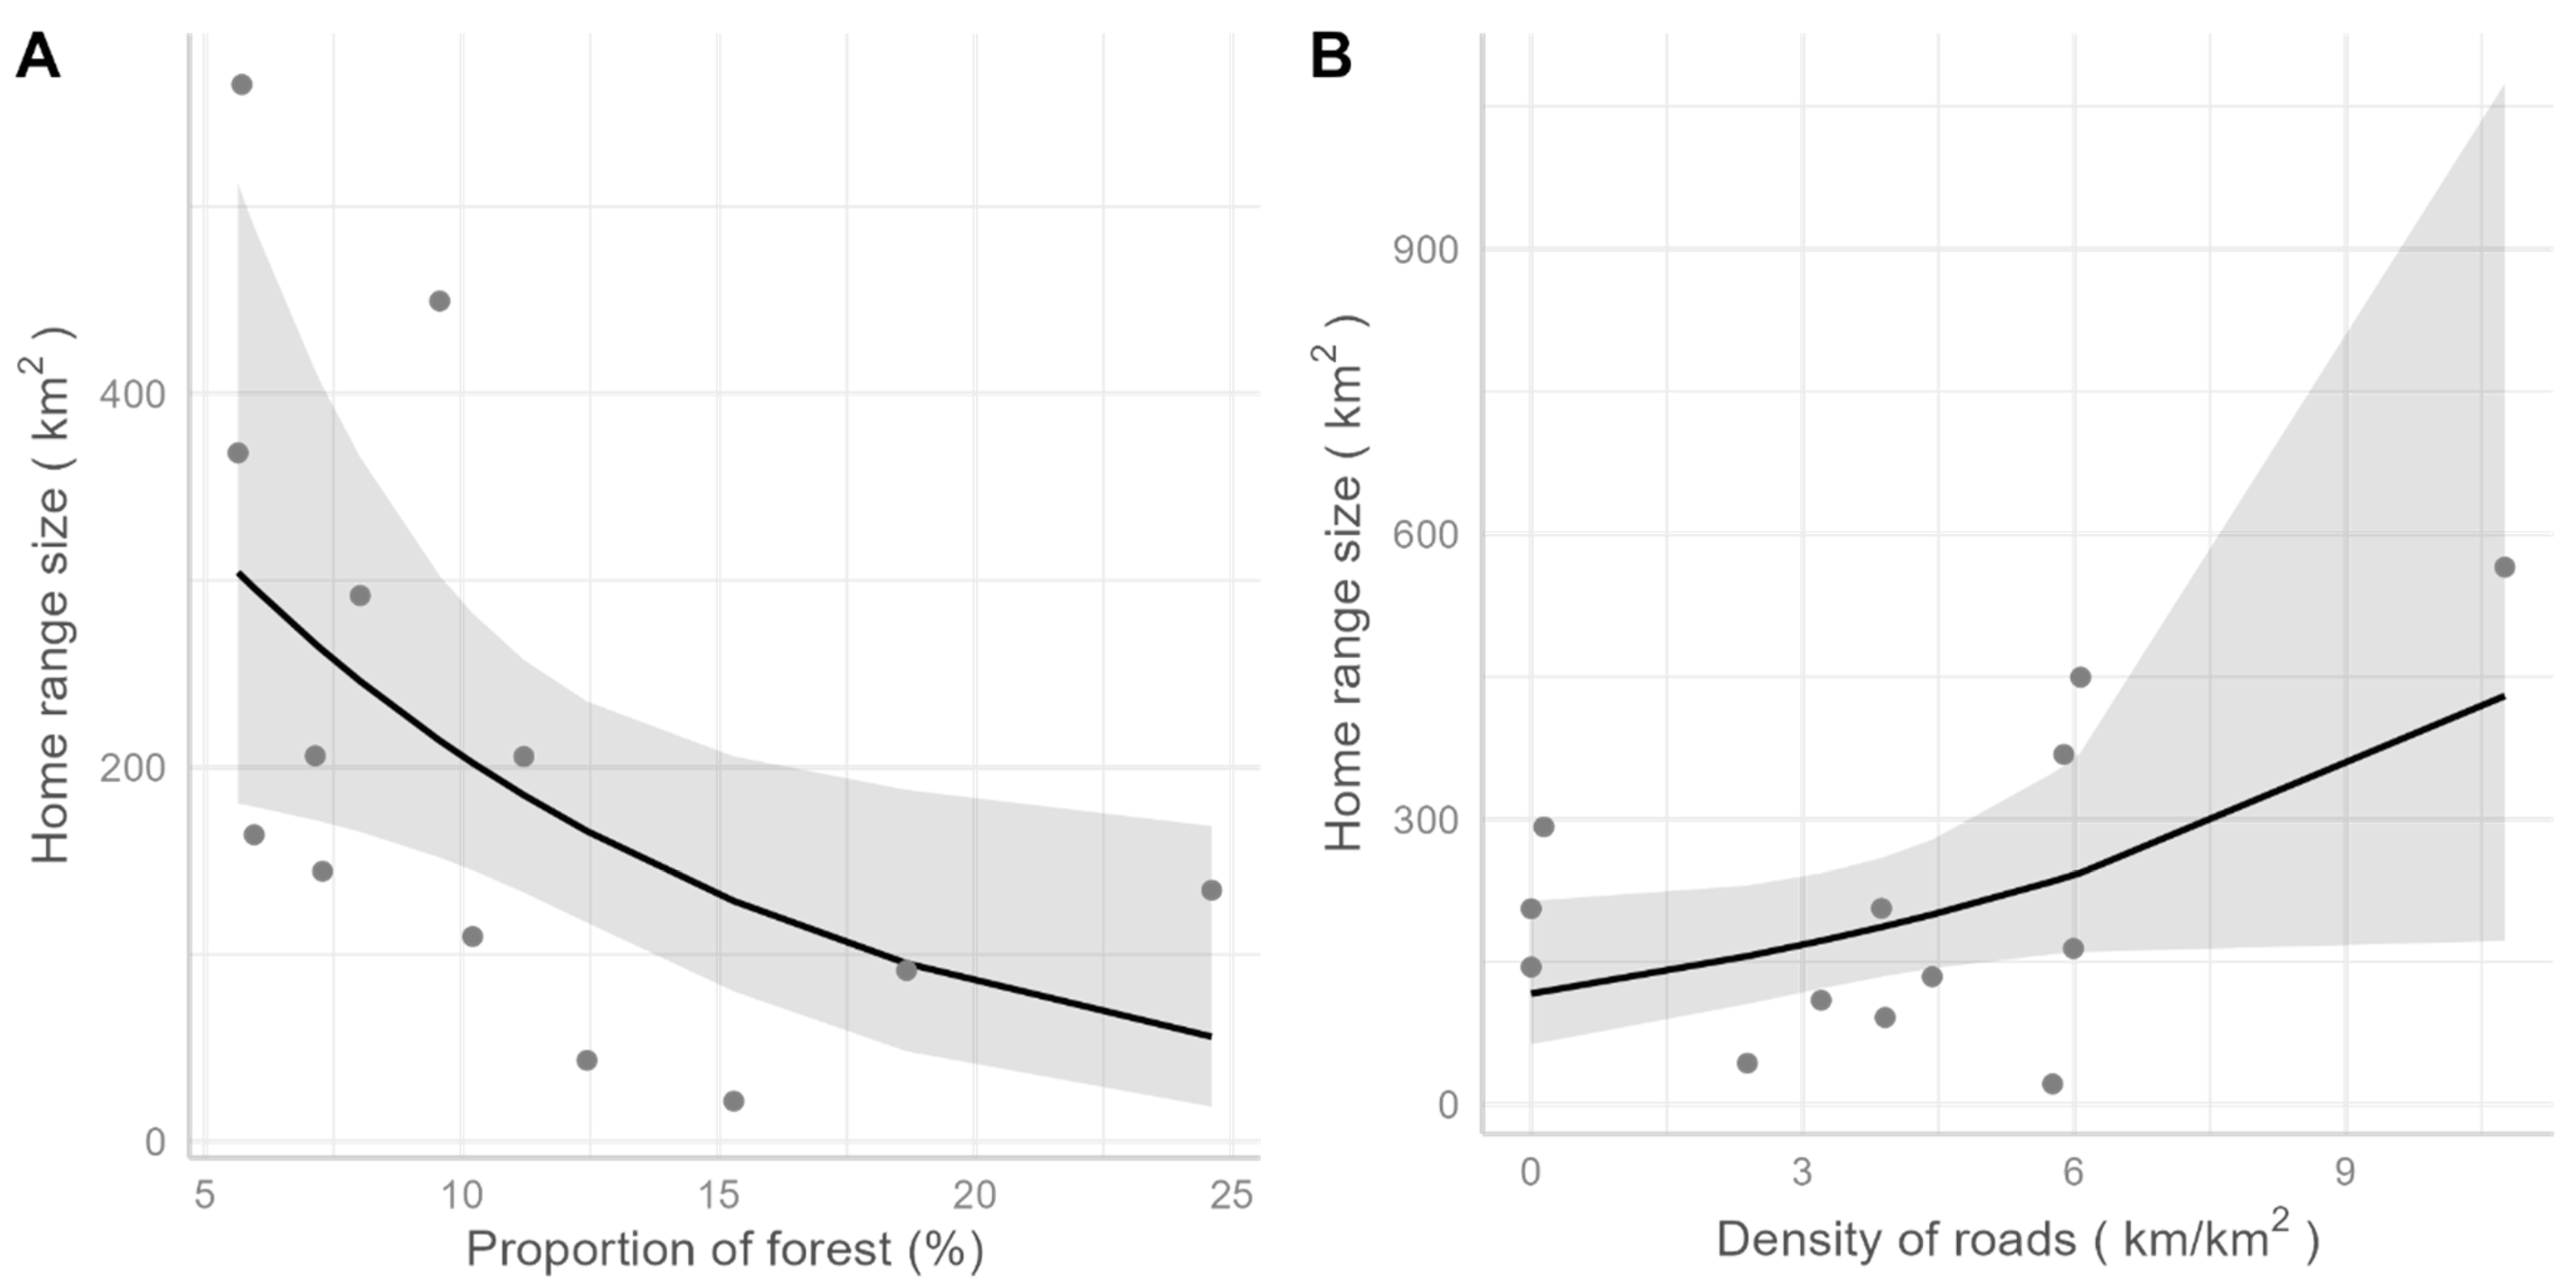
2.5. Effects of the Landscape on Ranging and Dispersal

To understand the effects of landscape on home range size, we fitted multiple generalized linear models with a Gamma response and logarithmic link, using the size of the 95% AKDE isopleths as the response variable and the proportion of different land use classes, average road density, and average distance to urban areas within the AKDE as covariates. Correlation was evaluated between all pairs of covariates, and covariates with a correlation coefficient higher than 0.6 were not included in the same model. For this reason, land use classes were included in the models one at a time, with the additional effect of the mean density of roads and the mean distance to urban areas. Models were compared through AICc; the ones with the lowest AICc were selected as the most parsimonious models. We also fitted models including the difference between residents, natural dispersers, and translocated dispersers to test for translocation effects. One individual who inhabited the coastal Atlantic Forest was removed from this analysis, since it was a clear outlier in terms of the proportion of forest within the home range. In the end, we used n = 13 individuals for the home range landscape analysis.
To understand the effects of landscape and infrastructure on puma movement, we tested for the influence of land use and the proximity to roads, water, and urban areas on movement patterns (n = 14). First, a descriptive analysis was made by quantifying the proportion of positions on each land use class on the three behavioral phases: pre-dispersal, dispersal, and ranging. The analysis was conducted by pooling all individuals, by individual, and by separating them into resident, disperser, and translocated categories. Second, we used a discrete representation of movement, characterized by steps between pairs of positions, to assess the effect of the landscape covariates on movement rates during residency and dispersal. We extracted the landscape information at the beginning of each 1 h step and fitted generalized linear models with a Gamma response, with movement rate (= step length for hourly displacements) as the response variable and explanatory variables including land use, distance to urban areas, roads, and water, considering the interaction between these covariates, time of day, and movement phase. Time of day was included as a binary variable to account for different behaviors during day and night. To test for translocation effects, we also fitted models adding the individual translocation status (resident, natural disperser, translocated disperser) to the model structure. As for the other analyses, variables with a correlation coefficient > 0.6 were not included in the same model. Fitted models were compared through AICc and the model with lowest AICc was considered the most parsimonious. Further methodological details are available in Supplementary Material SB.

2.6. Literature Review

To put our results into context, we conducted a non-systematic review of studies reporting puma dispersal and home range. We searched on Google Scholar for studies including dispersal AND puma or several of the popular names of pumas, in English (e.g., cougar, mountain lion), Spanish (e.g., león de montaña), and Portuguese (e.g., onça parda, suçuarana) from 1980 to 2019. Additionally, we searched for recent reviews of the spatial ecology of pumas and large felids and the references therein. The studies were filtered to keep only research that focused on dispersal (including identifying or comparing dispersal phases, distances, or ages) and possibly other aspects of puma spatial ecology, like home ranges, habitat selection, and population or metapopulation dynamics. For each selected study, we recorded dispersal age, fate after dispersal, monitoring method (e.g., VHF, GPS), method to estimate the dispersal phase, and dispersal distance (Euclidean and total dispersal distance), both for each individual (when reported) or averages, standard deviations, and minimum/maximum values for the set of monitored individuals. Using this data, we made a comparison of dispersal ages and distances between the literature and our study.

3. Results

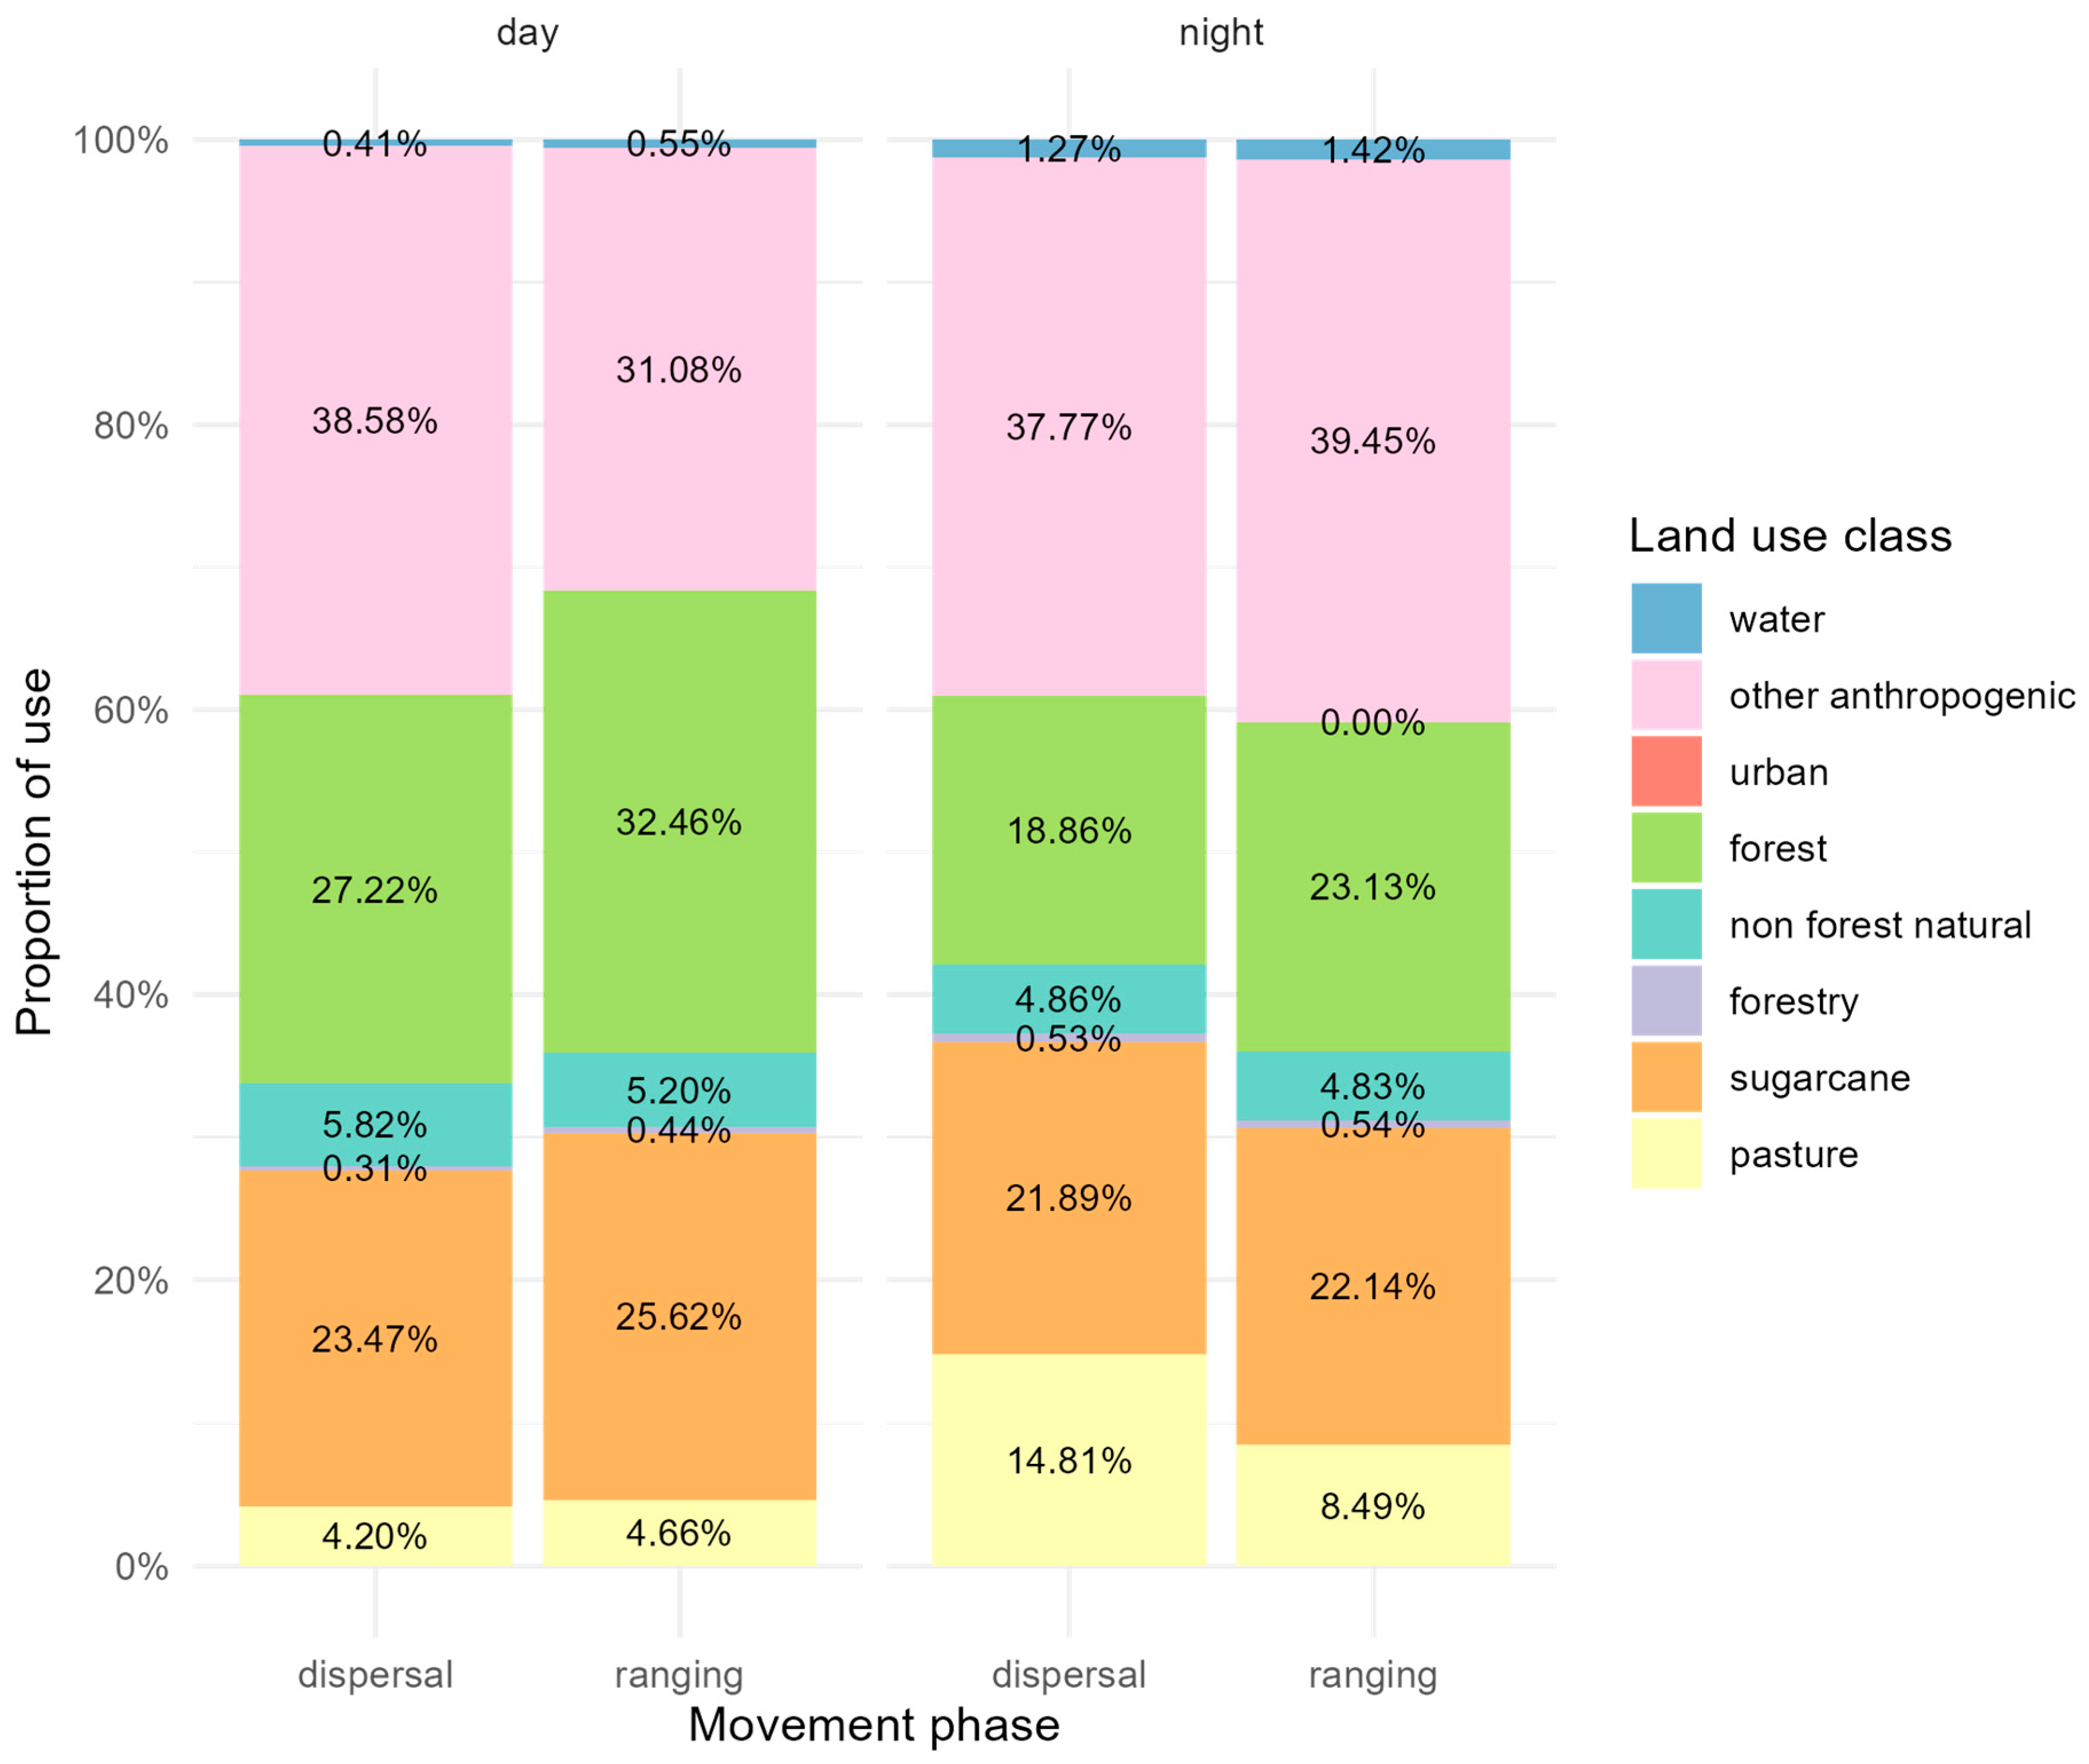
3.1. Pumas in Southeastern Brazil

Between 2015 and 2020, we captured and collared 14 pumas (Figure 1), of which 3 were females (21%) and 11 were males (79%). Individuals were monitored on average per 220 days (range = [93, 408] days, n = 14; Table S2), yielding a total of 57,077 positions, with an average of 4077 per individual (range = [1642; 8044], n = 14). Six individuals (3 F, 3 M) maintained residency throughout the monitoring, while the remaining eight, all males, dispersed (Table S2; Figure S1). Notably, five individuals were translocated before release, four from urban areas to nearby forest fragments, and one individual that was not healthy when captured was kept in captivity for 8 months before translocation (Table S2). All females were residents, and all five translocated males dispersed.
Of the dispersing males, one dispersed immediately when it was released, four started their dispersal within 2 weeks from release, and the last three began dispersal 50, 55, and 88 days after they were collared (Table S3). The only male that dispersed right after release was the one kept in captivity. The average dispersal age was 33 months (range = [22, 43.8] months, n = 8). Dispersal events lasted on average 50 days (range = [11, 140] days, n = 8). Male pumas dispersed a linear median distance of 68.0 km (range = [18.7, 174] km, n = 8), even though the total distance traveled during the dispersal period was much higher, on average 288.3 km (range = [50.6, 524.9] km, n = 7). Translocation had limited effects on the overall dispersal patterns. Dispersal age and total dispersal distance were similar between natural and translocated dispersers (Table S4). However, translocated individuals dispersed longer Euclidean distances (mean = 82.64, range = [53.3–174] km for translocated individuals, 43.7 [18.7–67.9] km for natural dispersers) and tended to take longer to settle, compared to natural dispersers (Table S4).
Pumas moved faster during dispersal (mean movement rate = 3.67 [95% confidence interval CI = 2.99–4.51] km/day) than during ranging (mean = 2.35 [95% CI = 1.96–2.82] km/day) and pre-dispersal phases (mean = 1.64 [95% CI = 1.31–2.04] km/day) (Figure 2A). They also exhibited more directional movement during dispersal, with a mean direction closer to zero and less variation in turning angles (von Mises mean = 0.31 rad [95% CI = −0.08–0.70]), in contrast to ranging (mean = −2.95 rad [95% CI = −0.80–4.93]) and pre-dispersal phases (mean = −0.17 rad [95% CI = −2.90–1.97]), which exhibited higher mean values and greater variation in turning angles (Figure 2B). However, this pattern varied among animals: dispersal could be characterized by a mixture of longer displacements and/or higher directionality (Figures S2–S4). Natural and translocated dispersers did not present differences in their dispersal patterns across the movement phases (Table S5, Figure S5).
Home range sizes varied from 21.6 km2 to 565 km2 (average = 206 km2, n = 14, Table S6, Figure S6). For all individuals, OUF was the best model to represent their ranging behavior (lowest AICc). Therefore, all home ranges were characterized by an OUF model and estimated through AKDE. As expected, home ranges computed through AKDE were larger than those computed through minimum convex polygons (MCP) or traditional KDE (Figure S6), which were historically used in the literature to quantify home range sizes [74,75]. Home range sizes decreased with an increasing proportion of forest (Figure 3A, β = −0.5, SE = 0.22, p = 0.049, n = 13), and there was a small signal of home ranges increasing with road density (Figure 3B, β = 0.368, SE = 0.197, p = 0.095, n = 13). Additionally, home range sizes were negatively correlated with the proportion of non-forest natural areas and the distance to urban areas and positively correlated with the proportion of sugarcane and forestry (Table S8). However, the amount of different land use classes within home ranges covaried, and there was stronger evidence for the effect of forests and roads (Table S7). The model that included the difference between residents, natural dispersers, and translocated animals was the lowest-ranking home range model and was not supported by the data, possibly because of the small sample sizes (Table S7). However, when fitting the data separately by groups, we notice that translocated individuals seemed to have established their home ranges in areas with higher densities of roads (Figure S7), which might have pushed the overall effect of roads observed in Figure 3.
Pumas crossed pastures more often and used fewer forest patches during dispersal at night, compared to ranging and daytime (n = 14, Figure 4). However, individual variation was observed, with some pumas exhibiting increased forest use during dispersal compared to residency (e.g., Mineiro, Tupã; Figures S8 and S9). The most parsimonious model to explain variation in fine-scale, 1-h movement rates included land use, distance to roads, urban areas, and water bodies, all in interaction with the time of day and movement phase, individual status (resident, disperser, translocated), and individual sex. As expected, males moved more (mean = 5.30 [95% CI = 5.10–5.51] km/day) than females (mean = 3.43 [95% CI = 3.21–3.67] km/day), and pumas moved faster at night (mean = 7.47 [95% CI = 7.07–7.89] km/day) than during the day (mean = 2.43 [95% CI = 2.28–2.60] km/day). Pumas moved faster in pastures, mainly at night and during dispersal. Residents moved faster than dispersers during ranging in forests, sugarcane plantations, and other land anthropogenic uses (Figure 5A). During dispersal, translocated dispersers moved faster than natural dispersers in forests and in anthropogenic land uses. In contrast, they tended to move more slowly within 1 km of roads and urban areas, compared to natural dispersers and residents. (Figure 5B,C). Natural dispersers tended to move faster around 1 km of urban areas, especially during ranging behavior (Figure 5C).

3.2. Summary from the Literature Review

We gathered dispersal data from 24 studies (Supplementary Material SC), 23 of which were conducted in North America (95.8%). Earlier studies (pre-2000) primarily used VHF telemetry or capture–recapture methods (n = 17, 70.8%), while GPS collars gained prominence after 2005. Definitions of dispersal differed between studies. Immigration or start of dispersal was often marked by separation from mothers or movement outside the natal range (e.g., [32,45]), or using the location where animals were released (e.g., [44,76]). Settling or end of dispersal was commonly defined by the individual meeting with an individual of the opposite sex, by a residency or site fidelity to a new range, or by the location of an individual’s death [34]. These definitions were far from standardized, adapted to the type and resolution of the data, and were omitted in several studies. Measures of dispersal distance also varied, e.g., as the distance between the borders or the centroids of natal and final home ranges or final locations (e.g., [77]). Apart from 1 study using genetics and 6 studies that did not report the methods to identify dispersal, in all studies (n = 17), the transitions between residency and dispersal were identified visually, with the use of different criteria as those mentioned above. In only one study were statistical methods used to identify dispersal [78], even though that was not their primary focus.
The average Euclidean dispersal distance from the literature ranged from 9.0 to 483 km (maximum = 24.5–1067 km; Figure 6) and was typically smaller for females than males (Figure S10). When compared to the literature data, the mean and the maximum Euclidean dispersal distances for pumas in our study were higher than 55% and 49% of all other studies, respectively (Figure 6). When compared to males only, the mean and maximum dispersal distances we found were higher than 37.5% and 53% of all studies, respectively (Figure S11). However, divergent dispersal definitions and methods to measure them hinder the possibility of direct comparisons.
The total dispersal distance was reported in only four studies, based on GPS or ARGOS data (Table S9). The mean dispersal age found in the literature was 17.7 months (range = [13.3, 31] months), a value considerably lower than our findings in southeastern Brazil (Figure S12). This might have occurred because in our study, almost no individual was tracked from their natal range (or information about natal ranges was unknown), so the dispersal events we recorded are most probably not natal dispersal events. The fate of individuals was only reported in a minority of studies that presented data at the individual level.

4. Discussion

In increasingly fragmented and modified landscapes, understanding animal dispersal and behavioral responses to anthropogenic land use and infrastructure is essential to protect species, their habitats, and the ecological processes they are involved in. For temperate and Arctic ecosystems, such studies abound, especially in North America and Europe, but they are still scarce for many tropical ecosystems and species. Our study is the first in Brazil to document and infer puma dispersal behavior using fine-scale GPS data and one of the first studies of this kind in the tropical Americas. We investigated puma movement responses to landscape changes and compared this data with the literature from North America to identify similarities and differences in the species’ behavioral responses.
Most tracked individuals dispersed, all males, with one performing a long-distance dispersal of 174 km in a straight line and several of them covering a long total dispersal distance—more than 300 km for three of them. Straight line dispersal distances were close to the median distances reported in the literature, which indicates that the dispersal distances are representative of the dispersal patterns of pumas elsewhere [11,48]. However, dispersal ages were higher than those reported in the literature (e.g., [32], the only individual with comparable dispersal age was reported by ref. [44] in Patagonia). This might be a result of individuals not being monitored from their natal ranges but opportunistically from capture sites in temporary home ranges or during transient periods of dispersal. One could think that the discrepancy in dispersal ages between our study and the literature is related to the necessary translocation of individuals captured in urban areas. However, we found no difference in dispersal ages between natural dispersers and translocated animals, which goes against this expectation. Yet, the discrepancy with the literature might be due to the highly fragmented status of the forest landscapes these pumas inhabit (Figure 1), to different movement regimes across their lives (e.g., nomadic behavior [79]), or might point to different behaviors of pumas in South and North America.
Translocated individuals dispersed longer Euclidean distances than natural dispersers and tended to disperse for longer periods, supporting our translocation hypothesis. Translocated animals also moved faster in forests and more slowly close to roads and urban areas during dispersal, compared to natural dispersers. However, the support for the translocation hypothesis was limited. In general, translocated pumas moved similar daily distances and with similar tortuosity compared to natural dispersers, with the same pattern of increased movement rates and directionality during dispersal. The absence of effect of translocation on several dispersal metrics, such as dispersal age and total dispersal distance, might be related to the relatively short translocation distances [80], which were less than 40 km for most translocated pumas in our study.
None of the females in our study dispersed. Summing this to our small sample size (n = 3) makes it hard to compare our findings with patterns of philopatry and dispersal from the literature. Female pumas are generally more prone to philopatry and, when dispersing, often disperse smaller distances [12]. Our low sample size with only three resident females limits what we can infer about their dispersal in South America. Limited female dispersal might not necessarily have strong consequences for gene flow but might affect survival (thus, effective connectivity) in overfragmented landscapes [81]. Future studies are needed to monitor individuals and evaluate puma dispersal patterns between sexes.
We found support for our fast dispersal hypothesis: pumas exhibited increased speed and more directional movement during dispersal than during ranging, in agreement with previous studies of pumas [44,53,82] and other large carnivores [52]. That was consistent regardless of whether the dispersers were translocated or not. During dispersal, pumas crossed longer daily distances and spent less time around local neighborhoods, using less forest areas and more pasturelands than during ranging, even though this pattern varied across individuals. Natural dispersing pumas moved more slowly in forests during dispersal, in contrast to pastures, where they crossed at higher speeds during dispersal than during ranging behavior. They also moved faster around urban areas and roads. This corroborates our human disturbance hypothesis: pumas move more often and faster through areas with more anthropogenic disturbance, mainly at night and during dispersal. In contrast, they spent more time and moved more slowly in safe environments such as the forest and riparian vegetation during ranging behavior. Other studies with pumas also found faster movements in areas with a higher proportion of anthropized land use types, such as agriculture and pasture [53], and avoidance of croplands and open pastures during residency [36]. The contrasting result for translocated pumas challenges this pattern, though. The fact that translocated individuals moved faster in forests, more slowly close to human infrastructure, and established their home ranges in areas with higher densities of roads might be a result of an increased risk-taking behavior for translocated individuals, which might have serious consequences for individual settling and survival.
Pumas in southeastern Brazil had smaller home ranges in landscapes with higher forest cover and lower road density, which supports the forest importance hypothesis. Similar to findings for pumas in other areas [36] and jaguars across their range [23], our results point to the importance of forests as habitat, with smaller but highly forested areas, with low road density, providing ample prey and shelter [74]. The behavioral plasticity hypothesis, which assumed pumas would not necessarily need larger areas in more anthropized landscapes because of their change in diet [18], was not supported by our data. One explanation may be that a change in pumas’ feeding patterns toward smaller prey [38], which is typical in more agriculturally impacted environments, e.g., areas with higher proportions of sugarcane [18], leads to a requirement for larger home ranges than in areas with higher proportions of forest cover and associated larger prey species.

Conservation and Management Implications

Our results underscore the vital role of large forest patches in sustaining carnivore populations, echoing several other studies with small and large felids and top-predator species [36,83,84]. By showing how pumas move during dispersal in parts of two tropical biodiversity hotspots, the Atlantic Forest and the Cerrado biomes in southern Brazil, we identify habitat requirements and behaviors during a key life history phase. This knowledge is important in delineating corridors and policies to maintain puma metapopulations in highly fragmented landscapes. Earlier studies found some level of gene flow between populations in the region but suggested a population bottleneck due to persecution, which is exacerbated by high numbers of road-killed individuals and direct human-puma conflicts [39,85]. More recently, genetic analyses found a fine-scale puma population structuring [50], suggesting that even populations of a plastic species can become genetically structured in increasingly human-modified landscapes. Puma populations without harvest tend to have high survival rates, which is not the case in our study, in which few disperser individuals were confirmed to have survived after a year. This might indicate that this landscape is a sink for the overall puma population in southeastern Brazil, probably related to the multiple impacts and high fragmentation of their habitat. Yet, it might be that the low survival of dispersers is related to a high proportion of translocated individuals, which often wander long distances and have low survival rates [86]. If translocations continue to be common, either out of necessity (as in this study) or as a management strategy, more research is needed in evaluating the movement, habitat use, and performance of individuals, possibly using translocation experiments.
Future monitoring projects and studies should focus on using data-driven estimates of landscape suitability and permeability to model habitat and connectivity, measure survival rates, and identify priority areas for conservation and restoration of habitats and connectivity [2,81,87]. For instance, identifying movement patterns, habitat selection, barriers, and connectivity for individuals with different statuses (male vs. female, translocated vs. non-translocated) and along different periods of the day or along the year might allow us to plan landscapes of coexistence, where different species and human requirements are met with minimal conflicts [88,89]. This approach might also be used to identify areas more sensitive to loss or restoration of connectivity [87], so that new infrastructure is avoided or restoration efforts are directed to areas in which there will be more gain in the amount of habitat reachable for a species.
It is difficult to make a direct comparison of dispersal parameters across puma populations because of the multiple definitions of dispersal and differences in the way they are operationalized into methods. Beyond the definitions, the identification of ranging and dispersal behaviors follows different criteria and is still performed visually in most studies. By using statistical methods that estimate ranging and dispersal movement parameters [52], we provide a basis for more standardized estimation of transience and ranging phases in animal behavior. In spite of the differences between studies, the Euclidean dispersal distances we found were close to median values from studies in North America, suggesting that, in principle, these values could be used to parameterize population and connectivity models in southeastern Brazil [13]. However, dispersal ages differed markedly from the literature, with pumas in Brazil dispersing at significantly higher ages than in North America, at least in part because of the lack of population monitoring. This indicates that there are some limitations in using observations from a particular environmental context (e.g., the North American mountain west) to parameterize models and studies in radically different biomes encompassed by the extensive Puma concolor range.
Notwithstanding the increased accessibility and miniaturization of tracking technologies such as GPS collars, studies on the movement and dispersal monitoring of pumas continue to be a minority in the Global South [11,25], with only 1 of the 24 studies we reviewed. Apart from some charismatic species such as the jaguars [84], the movement behavior of most other carnivores is understudied in Central and South America [12,48]. Given this, we call for more studies documenting the movement of these species, including their dispersal. We note, however, that movement ecology studies alone are insufficient, and the effective link between individuals and populations requires long-term population studies with pumas and other carnivores. Most puma studies in Latin America focus on the analysis of occurrence and activity patterns using camera trap data (e.g., [37,90]) and genetic analyses using structured and opportunistic samples (e.g., road kills) of pumas (e.g., [39,91]). A few studies have used satellite monitoring on pumas [36,44,92], but these studies are still scarce and generally not linked to population monitoring. This makes it impossible to connect movement behavior to natal dispersal and to infer dispersal causes and their consequences for metapopulation maintenance and connectivity. Given the importance of these species to top-down regulation of ecological communities and their potential role as umbrella and surrogate species in conservation projects, mainly in the face of fast-paced forest habitat conversion to urban, agricultural, and pasture areas, we urge that detailed movement studies be conducted in combination with long-term, landscape scale monitoring of populations of pumas and other carnivores, to allow the inference of population sizes and how they are affected by dispersal and land use change. Future studies should compare movement patterns among ecoregions, search for thresholds in forest amount and in the composition of landscapes that lead to changes in behavior and occurrence of pumas, and ultimately search for the patterns and mechanisms that explain the behavioral plasticity of this species and the consequences of anthropogenic infrastructure and activity to their populations.

Supplementary Materials

The following supporting information can be downloaded at https://www.mdpi.com/article/10.3390/d17060435/s1: Supplementary Material SA: Environmental layers; Supplementary Material SB: More details on materials and methods; Supplementary Material SC. Literature review list; Supplementary Material SD: Supplementary tables and figures.

Author Contributions

Conceptualization, B.B.N., S.M.C.C. and R.G.M.; methodology, B.B.N., S.M.C.C., E.G. and R.G.M.; software, B.B.N. and E.G.; validation, S.M.C.C., E.A.V., V.V.A., R.d.O., J.C.Z.G. and A.d.B.B.; formal analysis, B.B.N. and E.G.; investigation, B.B.N., S.M.C.C., E.A.V., V.V.A., R.d.O., J.C.Z.G., A.d.B.B. and R.G.M.; resources, S.M.C.C., E.A.V., V.V.A. and R.G.M.; data curation, B.B.N., S.M.C.C., E.A.V., V.V.A., R.d.O., J.C.Z.G. and A.d.B.B.; writing—original draft preparation, B.B.N.; writing—review and editing, all authors; visualization, B.B.N.; supervision, S.M.C.C. and R.G.M.; project administration, S.M.C.C. and R.G.M.; funding acquisition, S.M.C.C. and R.G.M. All authors have read and agreed to the published version of the manuscript.

Funding

This study was funded by AES Tietê/AES Brasil. BBN was also supported by the NINA basic funding (Research Council of Norway, grant 160022/F40).

Institutional Review Board Statement

The puma captures were conducted with licenses issued by Instituto Chico Mendes de Conservação da Biodiversidade (ICMBio) under authorization SISBIO #45774-1.

Data Availability Statement

The GPS data collected and used in this study are stored on MoveBank (Movebank project ID 577226894—Pumas from Tiete Project; Movebank project ID 594660300—Onças do Legado), and access to it might be requested from the first author or through contact with Instituto Pró-Carnívoros. Data from the literature compilation and R code for all analyses performed in this study are available in the following Github repository: https://github.com/ICMBio-CENAP/puma_dispersal_residency_Brazil.

Acknowledgments

We are grateful to AES Tietê for funding this study and to O. Veronez e T. Rech for supporting the fieldwork. Instituto Pró-Carnívoros provided part of the equipment and staff support. We are grateful to the staff of the Zoological Park of Bauru for providing veterinary assistance and to Tijoá Energia for allowing the use of their facilities and providing accommodation during capture campaigns. We also thank A. Porfirio, E. Moura, A. S. Castilho, M. D. Rosa, J. Schweizer, N. Schweizer, F. Lemos, F. C. de Azevedo, I. Candeias, R. Arrais, M. C. Freitas, J. da Silva, R. R. Martins, O. Carvalho, M. Arruda, P. M. Galetti Jr., B. Saranholi, V. Pismel, J. D. Fernandes, L. Pires, M. E. Santiago, K. Werther, M. H. Barbosa, the staff of Centro de Conservação do Cervo-do-Pantanal, and the rangers of Guarda Ambiental of Pongaí for support during the study. We also thank the editor and two anonymous reviewers for their careful suggestions in the analyses and text.

Conflicts of Interest

The authors declare no conflicts of interest. The funders had no role in the design of the study; in the collection, analyses, or interpretation of data; in the writing of the manuscript; or in the decision to publish the results.

Abbreviations

The following abbreviations are used in this manuscript:
GPSGlobal positioning system
MCPMinimum convex polygon
KDEKernel density estimation
AKDEAutocorrelated kernel density estimation
OUFOrnstein–Uhlenbeck–Fleming model
OUOrnstein–Uhlenbeck model
CVMContinuous velocity model
ARIMAAutoregressive integrated moving average model
IIDIndependent identically distributed process
AICcAkaike information criterion corrected for small samples

References

  1. da Silveira, N.S.; Niebuhr, B.B.S.; Muylaert, R.d.L.; Ribeiro, M.C.; Pizo, M.A. Effects of Land Cover on the Movement of Frugivorous Birds in a Heterogeneous Landscape. PLoS ONE 2016, 11, e0156688. [Google Scholar] [CrossRef] [PubMed]
  2. Van Moorter, B.; Kivimäki, I.; Panzacchi, M.; Saura, S.; Niebuhr, B.B.; Strand, O.; Saerens, M. Habitat Functionality: Integrating Environmental and Geographic Space in Niche Modeling for Conservation Planning. Ecology 2023, 104, e4105. [Google Scholar] [CrossRef] [PubMed]
  3. Gonçalves-Souza, T.; Chase, J.M.; Haddad, N.M.; Vancine, M.H.; Didham, R.K.; Melo, F.L.P.; Aizen, M.A.; Bernard, E.; Chiarello, A.G.; Faria, D.; et al. Species Turnover Does Not Rescue Biodiversity in Fragmented Landscapes. Nature 2025, 640, 701–706. [Google Scholar] [CrossRef] [PubMed]
  4. Morales, J.M.; Moorcroft, P.R.; Matthiopoulos, J.; Frair, J.L.; Kie, J.G.; Powell, R.A.; Merrill, E.H.; Haydon, D.T. Building the Bridge between Animal Movement and Population Dynamics. Philos. Trans. R. Soc. B 2010, 365, 2289–2301. [Google Scholar] [CrossRef]
  5. Niebuhr, B.B.S.; Wosniack, M.E.; Santos, M.C.; Raposo, E.P.; Viswanathan, G.M.; da Luz, M.G.E.; Pie, M.R. Survival in Patchy Landscapes: The Interplay between Dispersal, Habitat Loss and Fragmentation. Sci. Rep. 2015, 5, 11898. [Google Scholar] [CrossRef]
  6. Jeltsch, F.; Bonte, D.; Pe’er, G.; Reineking, B.; Leimgruber, P.; Balkenhol, N.; Schröder, B.; Buchmann, C.M.; Mueller, T.; Blaum, N.; et al. Integrating Movement Ecology with Biodiversity Research—Exploring New Avenues to Address Spatiotemporal Biodiversity Dynamics. Mov. Ecol. 2013, 1, 6. [Google Scholar] [CrossRef]
  7. Nathan, R.; Getz, W.M.; Revilla, E.; Holyoak, M.; Kadmon, R.; Saltz, D.; Smouse, P.E. A Movement Ecology Paradigm for Unifying Organismal Movement Research. Proc. Natl. Acad. Sci. USA 2008, 105, 19052–19059. [Google Scholar] [CrossRef]
  8. Börger, L.; Dalziel, B.D.; Fryxell, J.M. Are There General Mechanisms of Animal Home Range Behaviour? A Review and Prospects for Future Research. Ecol. Lett. 2008, 11, 637–650. [Google Scholar] [CrossRef]
  9. Ronce, O. How Does It Feel to Be like a Rolling Stone? Ten Questions about Dispersal Evolution. Annu. Rev. Ecol. Evol. Syst. 2007, 38, 231–253. [Google Scholar] [CrossRef]
  10. Moraes, A.M.; Ruiz-Miranda, C.R.; Galetti, P.M., Jr.; Niebuhr, B.B.; Alexandre, B.R.; Muylaert, R.L.; Grativol, A.D.; Ribeiro, J.W.; Ferreira, A.N.; Ribeiro, M.C. Landscape Resistance Influences Effective Dispersal of Endangered Golden Lion Tamarins within the Atlantic Forest. Biol. Conserv. 2018, 224, 178–187. [Google Scholar] [CrossRef]
  11. Gonzalez-Borrajo, N.; López-Bao, J.V.; Palomares, F. Spatial Ecology of Jaguars, Pumas, and Ocelots: A Review of the State of Knowledge. Mammal Rev. 2017, 47, 62–75. [Google Scholar] [CrossRef]
  12. Oliveira, M.E.; Saranholi, B.H.; Dirzo, R.; Galetti, P.M. A Review of Philopatry and Dispersal in Felids Living in an Anthropised World. Mammal Rev. 2022, 52, 208–220. [Google Scholar] [CrossRef]
  13. Castilho, C.S.; Marins-Sá, L.G.; Benedet, R.C.; Freitas, T.O. Landscape Genetics of Mountain Lions (Puma concolor) in Southern Brazil. Mamm. Biol. 2011, 76, 476–483. [Google Scholar] [CrossRef]
  14. Crooks, K.R.; Burdett, C.L.; Theobald, D.M.; Rondinini, C.; Boitani, L. Global Patterns of Fragmentation and Connectivity of Mammalian Carnivore Habitat. Philos. Trans. R. Soc. B 2011, 366, 2642–2651. [Google Scholar] [CrossRef] [PubMed]
  15. Yates, K.L.; Bouchet, P.J.; Caley, M.J.; Mengersen, K.; Randin, C.F.; Parnell, S.; Fielding, A.H.; Bamford, A.J.; Ban, S.; Barbosa, A.M.; et al. Outstanding Challenges in the Transferability of Ecological Models. Trends Ecol. Evol. 2018, 33, 790–802. [Google Scholar] [CrossRef]
  16. Gomez, S.; English, H.M.; Bejarano Alegre, V.; Blackwell, P.G.; Bracken, A.M.; Bray, E.; Evans, L.C.; Gan, J.L.; Grecian, W.J.; Gutmann Roberts, C.; et al. Understanding and Predicting Animal Movements and Distributions in the Anthropocene. J. Anim. Ecol. 2025, 94, 1146–1164. [Google Scholar] [CrossRef]
  17. Magioli, M.; Moreira, M.Z.; Fonseca, R.C.B.; Ribeiro, M.C.; Rodrigues, M.G.; De Barros Ferraz, K.M.P.M. Human-Modified Landscapes Alter Mammal Resource and Habitat Use and Trophic Structure. Proc. Natl. Acad. Sci. USA 2019, 116, 18466–18472. [Google Scholar] [CrossRef]
  18. Magioli, M.; Moreira, M.Z.; Ferraz, K.M.B.; Miotto, R.A.; de Camargo, P.B.; Rodrigues, M.G.; da Silva Canhoto, M.C.; Setz, E.F. Stable Isotope Evidence of Puma concolor (Felidae) Feeding Patterns in Agricultural Landscapes in Southeastern Brazil. Biotropica 2014, 46, 451–460. [Google Scholar] [CrossRef]
  19. Tucker, M.A.; Böhning-Gaese, K.; Fagan, W.F.; Fryxell, J.M.; Van Moorter, B.; Alberts, S.C.; Ali, A.H.; Allen, A.M.; Attias, N.; Avgar, T.; et al. Moving in the Anthropocene: Global Reductions in Terrestrial Mammalian Movements. Science 2018, 359, 466–469. [Google Scholar] [CrossRef]
  20. Lino, A.; Fonseca, C.; Rojas, D.; Fischer, E.; Ramos Pereira, M.J. A Meta-Analysis of the Effects of Habitat Loss and Fragmentation on Genetic Diversity in Mammals. Mamm. Biol. 2019, 94, 69–76. [Google Scholar] [CrossRef]
  21. de Almeida-Rocha, J.M.; Soares, L.A.S.S.; de Andrade, E.R.; Gaiotto, F.A.; Cazetta, E. The Impact of Anthropogenic Disturbances on the Genetic Diversity of Terrestrial Species: A Global Meta-analysis. Mol. Ecol. 2020, 29, 4812–4822. [Google Scholar] [CrossRef] [PubMed]
  22. IPBES. Global Assessment Report on Biodiversity and Ecosystem Services of the Intergovernmental Science-Policy Platform on Biodiversity and Ecosystem Services; IPBES secretariat: Bonn, Germany, 2019. [Google Scholar]
  23. Thompson, J.J.; Morato, R.G.; Niebuhr, B.B.; Alegre, V.B.; Oshima, J.E.F.; de Barros, A.E.; Paviolo, A.; de la Torre, J.A.; Lima, F.; McBride, R.T.; et al. Environmental and Anthropogenic Factors Synergistically Affect Space Use of Jaguars. Curr. Biol. 2021, 31, 3457–3466.e4. [Google Scholar] [CrossRef] [PubMed]
  24. Kuijper, D.P.J.; Sahlén, E.; Elmhagen, B.; Chamaillé-Jammes, S.; Sand, H.; Lone, K.; Cromsigt, J.P.G.M. Paws without Claws? Ecological Effects of Large Carnivores in Anthropogenic Landscapes. Proc. R. Soc. B Biol. Sci. 2016, 283, 20161625. [Google Scholar] [CrossRef]
  25. LaBarge, L.R.; Evans, M.J.; Miller, J.R.B.; Cannataro, G.; Hunt, C.; Elbroch, L.M. Pumas Puma concolor as Ecological Brokers: A Review of Their Biotic Relationships. Mammal Rev. 2022, 52, 360–376. [Google Scholar] [CrossRef]
  26. Ritchie, E.G.; Johnson, C.N. Predator Interactions, Mesopredator Release and Biodiversity Conservation. Ecol. Lett. 2009, 12, 982–998. [Google Scholar] [CrossRef]
  27. Jorge, M.L.S.P.; Galetti, M.; Ribeiro, M.C.; Ferraz, K.M.P.M.B. Mammal Defaunation as Surrogate of Trophic Cascades in a Biodiversity Hotspot. Biol. Conserv. 2013, 163, 49–57. [Google Scholar] [CrossRef]
  28. Sunquist, M.E.; Sunquist, F. Wild Cats of the World; University of Chicago Press: Chicago, IL, USA, 2002; ISBN 978-0-226-77999-7. [Google Scholar]
  29. Nielsen, C.; Thompson, D.; Kelly, M.; López-González, C.A. Puma Concolor. In The IUCN Red List of Threatened Species 2015; International Union for Conservation of Nature: Gland, Switzerland, 2015; p. e.T18868A97216466. [Google Scholar]
  30. BRASIL. Portaria M.M.A. de 7 de Junho de 2022. Altera Os Anexos Da Portaria No 443, de 17 de Dezembro de 2014, Da Portaria No 444, de 17 de Dezembro de 2014, e Da Portaria No 445, de 17 de Dezembro de 2014, Referentes à Atualização Da Lista Nacional de Espécies Ameaçadas de Extinção; Ministério do Meio Ambiente: Brasília, Brazil, 2022. [Google Scholar]
  31. Hemker, T.P.; Lindzey, F.G.; Ackerman, B.B. Population Characteristics and Movement Patterns of Cougars in Southern Utah. J. Wildl. Manag. 1984, 48, 1275. [Google Scholar] [CrossRef]
  32. Beier, P. Dispersal of Juvenile Cougars in Fragmented Habitat. J. Wildl. Manag. 1995, 59, 228. [Google Scholar] [CrossRef]
  33. López-González, C.A.; González-Romero, A. A Synthesis of Current Literature and Knowledge about the Ecology of the Puma (Puma concolor Linnaeus). Acta Zool. Mex. 1998, 75, 171–190. [Google Scholar] [CrossRef]
  34. Maehr, D.S.; Land, E.D.; Shindle, D.B.; Bass, O.L.; Hoctor, T.S. Florida Panther Dispersal and Conservation. Biol. Conserv. 2002, 106, 187–197. [Google Scholar] [CrossRef]
  35. Zeller, K.A.; Vickers, T.W.; Ernest, H.B.; Boyce, W.M. Multi-Level, Multi-Scale Resource Selection Functions and Resistance Surfaces for Conservation Planning: Pumas as a Case Study. PLoS ONE 2017, 12, e0179570. [Google Scholar] [CrossRef] [PubMed]
  36. Azevedo, F.C.; Lemos, F.G.; Freitas-Junior, M.C.; Arrais, R.C.; Morato, R.G.; Azevedo, F.C.C. The Importance of Forests for an Apex Predator: Spatial Ecology and Habitat Selection by Pumas in an Agroecosystem. Anim. Conserv. 2021, 24, 499–509. [Google Scholar] [CrossRef]
  37. Lyra-Jorge, M.C.; Ribeiro, M.C.; Ciocheti, G.; Tambosi, L.R.; Pivello, V.R. Influence of Multi-Scale Landscape Structure on the Occurrence of Carnivorous Mammals in a Human-Modified Savanna, Brazil. Eur. J. Wildl. Res. 2010, 56, 359–368. [Google Scholar] [CrossRef]
  38. Magioli, M.; Ferraz, K.M.P.M. Deforestation Leads to Prey Shrinkage for an Apex Predator in a Biodiversity Hotspot. Mammal Res. 2021, 66, 245–255. [Google Scholar] [CrossRef]
  39. Miotto, R.A.; Cervini, M.; Figueiredo, M.G.; Begotti, R.A.; Galetti, P.M. Genetic Diversity and Population Structure of Pumas (Puma Concolor) in Southeastern Brazil: Implications for Conservation in a Human-Dominated Landscape. Conserv. Genet. 2011, 12, 1447–1455. [Google Scholar] [CrossRef]
  40. Miotto, R.A.; Cervini, M.; Kajin, M.; Begotti, R.A.; Galetti, P.M. Estimating Puma Puma concolor Population Size in a Human-Disturbed Landscape in Brazil, Using DNA Mark–Recapture Data. Oryx 2014, 48, 250–257. [Google Scholar] [CrossRef]
  41. Paula, T.A.R.; Araujo, G.R.; Deco-Souza, T.; Csermak, A.C., Jr.; Bergo, L.C.F.; Mantovani, J.E.; Silva, L.C.; Magaldi, R.C.F.; Trece, A.S.; Caliman, J.P. Aspectos do uso territorial por onça parda (Puma concolor), através de monitoramento via satélite, na região do Parque Estadual da Serra do Brigadeiro, MG. Arq. Bras. Med. Veterinária Zootec. 2015, 67, 80–88. [Google Scholar] [CrossRef]
  42. Adania, C.H.; de Carvalho, W.D.; Rosalino, L.M.; de Cassio Pereira, J.; Crawshaw, P.G. First Soft-Release of a Relocated Puma in South America. Mammal Res. 2017, 62, 121–128. [Google Scholar] [CrossRef]
  43. Azevedo, F.C.; Lemos, F.G.; Freitas-Junior, M.C.; Rocha, D.G.; Azevedo, F.C.C. Puma Activity Patterns and Temporal Overlap with Prey in a Human-modified Landscape at Southeastern Brazil. J. Zool. 2018, 305, 246–255. [Google Scholar] [CrossRef]
  44. Elbroch, M.; Wittmer, H.U.; Saucedo, C.; Corti, P. Long-Distance Dispersal of a Male Puma (Puma concolor puma) in Patagonia. Rev. Chil. Hist. Nat. 2009, 82, 459–461. [Google Scholar] [CrossRef]
  45. Stoner, D.C.; Wolfe, M.L.; Mecham, C.; Mecham, M.B.; Durham, S.L.; Choate, D.M. Dispersal Behaviour of a Polygynous Carnivore: Do Cougars Puma concolor Follow Source-Sink Predictions? Wildl. Biol. 2013, 19, 289–301. [Google Scholar] [CrossRef] [PubMed]
  46. Sweanor, L.L.; Logan, K.A.; Hornocker, M.G. Cougar Dispersal Patterns, Metapopulation Dynamics, and Conservation. Conserv. Biol. 2000, 14, 798–808. [Google Scholar] [CrossRef]
  47. Weaver, J.L.; Paquet, P.C.; Ruggiero, L.F. Resilience and Conservation of Large Carnivores in the Rocky Mountains. Conserv. Biol. 1996, 10, 964–976. [Google Scholar] [CrossRef]
  48. Zanin, M.; Palomares, F.; Brito, D. What We (Don’t) Know about the Effects of Habitat Loss and Fragmentation on Felids. Oryx 2015, 49, 96–106. [Google Scholar] [CrossRef]
  49. Souza, C.M.; Shimbo, J.Z.; Rosa, M.R.; Parente, L.L.; Alencar, A.A.; Rudorff, B.F.T.; Hasenack, H.; Matsumoto, M.; Ferreira, L.G.; Souza-Filho, P.W.M.; et al. Reconstructing Three Decades of Land Use and Land Cover Changes in Brazilian Biomes with Landsat Archive and Earth Engine. Remote Sens. 2020, 12, 2735. [Google Scholar] [CrossRef]
  50. Saranholi, B.H.; Chávez-Congrains, K.; Galetti, P.M. Evidence of Recent Fine-Scale Population Structuring in South American Puma Concolor. Diversity 2017, 9, 44. [Google Scholar] [CrossRef]
  51. LaRue, M.A.; Nielsen, C.K. Modelling Potential Dispersal Corridors for Cougars in Midwestern North America Using Least-Cost Path Methods. Ecol. Model. 2008, 212, 372–381. [Google Scholar] [CrossRef]
  52. Barry, T.; Gurarie, E.; Cheraghi, F.; Kojola, I.; Fagan, W.F. Does Dispersal Make the Heart Grow Bolder? Avoidance of Anthropogenic Habitat Elements across Wolf Life History. Anim. Behav. 2020, 166, 219–231. [Google Scholar] [CrossRef]
  53. Morrison, C.D.; Boyce, M.S.; Nielsen, S.E. Space-Use, Movement and Dispersal of Sub-Adult Cougars in a Geographically Isolated Population. PeerJ 2015, 3, e1118. [Google Scholar] [CrossRef]
  54. Heidinger, I.M.M.; Poethke, H.-J.; Bonte, D.; Hein, S. The Effect of Translocation on Movement Behaviour—A Test of the Assumptions of Behavioural Studies. Behav. Process. 2009, 82, 12–17. [Google Scholar] [CrossRef]
  55. Feuka, A.B.; Nafus, M.G.; Yackel Adams, A.A.; Bailey, L.L.; Hooten, M.B. Individual Heterogeneity Influences the Effects of Translocation on Urban Dispersal of an Invasive Reptile. Mov. Ecol. 2022, 10, 2. [Google Scholar] [CrossRef]
  56. Vancine, M.H.; Muylaert, R.L.; Niebuhr, B.B.; Oshima, J.E.d.F.; Tonetti, V.; Bernardo, R.; De Angelo, C.; Rosa, M.R.; Grohmann, C.H.; Ribeiro, M.C. The Atlantic Forest of South America: Spatiotemporal Dynamics of the Vegetation and Implications for Conservation. Biol. Conserv. 2024, 291, 110499. [Google Scholar] [CrossRef]
  57. Project MapBiomas. Project MapBiomas—Collection 5 of Brazilian Land Cover & Use Map Series. Available online: http://mapbiomas.org (accessed on 20 October 2020).
  58. Alencar, A.Z.; Shimbo, J.; Lenti, F.; Balzani Marques, C.; Zimbres, B.; Rosa, M.; Arruda, V.; Castro, I.; Fernandes Márcico Ribeiro, J.; Varela, V.; et al. Mapping Three Decades of Changes in the Brazilian Savanna Native Vegetation Using Landsat Data Processed in the Google Earth Engine Platform. Remote Sens. 2020, 12, 924. [Google Scholar] [CrossRef]
  59. Araujo, G.R.d.; Deco-Souza, T.d.; Morato, R.G.; Crawshaw, P.G., Jr.; Silva, L.C.d.; Jorge-Neto, P.N.; Csermak-Jr, A.C.; Bergo, L.C.F.; Kantek, D.L.Z.; Miyazaki, S.S.; et al. Use of Foot Snares to Capture Large Felids. Methods Ecol. Evol. 2021, 12, 322–327. [Google Scholar] [CrossRef]
  60. Ashman, D.; Christensen, G.C.; Hess, M.L.; Tsukamoto, G.K.; Wickersham, M.S. The Mountain Lion in Nevada; Nevada Fish and Game Department: Reno, NV, USA, 1983; p. 75. [Google Scholar]
  61. Gay, S.W.; Best, T.L. Age-Related Variation in Skulls of the Puma (Puma concolor). J. Mammal. 1996, 77, 191–198. [Google Scholar] [CrossRef]
  62. R Core Team. R: A Language and Environment for Statistical Computing; R Foundation for Statistical Computing: Vienna, Austria, 2024. [Google Scholar]
  63. FBDS. Mapeamento Do Uso Do Solo Dos Biomas Cerrado e Mata Atlântica Na Escala 1:20.000, Projeto de Apoio à Implantação Do CAR; Fundação Brasileira Para o Desenvolvimento Sustentável: Rio de Janeiro, Brazil, 2017. [Google Scholar]
  64. Rudorff, B.F.T.; de Aguiar, D.A.; da Silva, W.F.; Sugawara, L.M.; Adami, M.; Moreira, M.A. Studies on the Rapid Expansion of Sugarcane for Ethanol Production in São Paulo State (Brazil) Using Landsat Data. Remote Sens. 2010, 2, 1057–1076. [Google Scholar] [CrossRef]
  65. Parente, L.; Ferreira, L.; Faria, A.; Nogueira, S.; Araújo, F.; Teixeira, L.; Hagen, S. Monitoring the Brazilian Pasturelands: A New Mapping Approach Based on the Landsat 8 Spectral and Temporal Domains. Int. J. Appl. Earth Obs. Geoinf. 2017, 62, 135–143. [Google Scholar] [CrossRef]
  66. DNIT. Rodovias Georreferenciadas Que Compõem o Subsistema Rodoviário Federal Do Sistema Federal de Viação (SFV) Do Brasil—DNIT (2013); Departamento Nacional de Infraestrutura de Transportes: Brasilia, Brazil, 2013. [Google Scholar]
  67. GRASS Development Team. Geographic Resources Analysis Support System (GRASS) Software, Version 7.8; Open Source Geospatial Foundation OSGEO: Beaverton, OR, USA, 2020. Available online: https://grass.osgeo.org (accessed on 13 June 2025).
  68. Calabrese, J.M.; Fleming, C.H.; Gurarie, E. ctmm: An R Package for Analyzing Animal Relocation Data As a Continuous-Time Stochastic Process. Methods Ecol. Evol. 2016, 7, 1124–1132. [Google Scholar] [CrossRef]
  69. Fleming, C.H.; Calabrese, J.M.; Mueller, T.; Olson, K.A.; Leimgruber, P.; Fagan, W.F. Non-Markovian Maximum Likelihood Estimation of Autocorrelated Movement Processes. Methods Ecol. Evol. 2014, 5, 462–472. [Google Scholar] [CrossRef]
  70. Gurarie, E.; Fleming, C.H.; Fagan, W.F.; Laidre, K.L.; Hernández-Pliego, J.; Ovaskainen, O. Correlated Velocity Models as a Fundamental Unit of Animal Movement: Synthesis and Applications. Mov. Ecol. 2017, 5, 13. [Google Scholar] [CrossRef]
  71. Fleming, C.H.; Calabrese, J.M. ctmm: Continuous-Time Movement Modeling. R Package Version 0.4.1. Available online: https://doi.org/10.32614/CRAN.package.ctmm (accessed on 13 June 2025).
  72. Fleming, C.H.; Fagan, W.F.; Mueller, T.; Olson, K.A.; Leimgruber, P.; Calabrese, J.M. Rigorous Home Range Estimation with Movement Data: A New Autocorrelated Kernel Density Estimator. Ecology 2015, 96, 1182–1188. [Google Scholar] [CrossRef] [PubMed]
  73. Fleming, C.H.; Calabrese, J.M. A New Kernel Density Estimator for Accurate Home-range and Species-range Area Estimation. Methods Ecol. Evol. 2017, 8, 571–579. [Google Scholar] [CrossRef]
  74. Morato, R.G.; Stabach, J.A.; Fleming, C.H.; Calabrese, J.M.; De Paula, R.C.; Ferraz, K.M.P.M.; Kantek, D.L.Z.; Miyazaki, S.S.; Pereira, T.D.C.; Araujo, G.R.; et al. Space Use and Movement of a Neotropical Top Predator: The Endangered Jaguar. PLoS ONE 2016, 11, e0168176. [Google Scholar] [CrossRef] [PubMed]
  75. Noonan, M.J.; Tucker, M.A.; Fleming, C.H.; Akre, T.S.; Alberts, S.C.; Ali, A.H.; Altmann, J.; Antunes, P.C.; Belant, J.L.; Beyer, D.; et al. A Comprehensive Analysis of Autocorrelation and Bias in Home Range Estimation. Ecol. Monogr. 2019, 89, e01344. [Google Scholar] [CrossRef]
  76. Thompson, D.J.; Jenks, J.A. Dispersal Movements of Subadult Cougars from the Black Hills: The Notions of Range Expansion and Recolonization. Ecosphere 2010, 1, 1–11. [Google Scholar] [CrossRef]
  77. López-González, C.A. Implicaciones Para la Conservación y el Manejo de Pumas (Puma concolor) Utilizando Como Modelo una Población Suejta a Caceria Deportiva. Ph.D. Dissertation, Universidad Nacional Autonoma de Mexico, Mexico, Mexico, 1999. [Google Scholar]
  78. Zeller, K.A.; Jennings, M.K.; Vickers, T.W.; Ernest, H.B.; Cushman, S.A.; Boyce, W.M. Are All Data Types and Connectivity Models Created Equal? Validating Common Connectivity Approaches with Dispersal Data. Divers. Distrib. 2018, 24, 868–879. [Google Scholar] [CrossRef]
  79. Teitelbaum, C.S.; Mueller, T. Beyond Migration: Causes and Consequences of Nomadic Animal Movements. Trends Ecol. Evol. 2019, 34, 569–581. [Google Scholar] [CrossRef]
  80. Brunell, A.M.; Deem, V.; Bankovich, B.; Bled, F.; Mazzotti, F.J. Effects of Translocation on American Crocodile Movements and Habitat Use in South Florida. J. Wildl. Manag. 2023, 87, e22427. [Google Scholar] [CrossRef]
  81. Van Moorter, B.; Kivimäki, I.; Panzacchi, M.; Saerens, M. Defining and Quantifying Effective Connectivity of Landscapes for Species’ Movements. Ecography 2021, 44, 870–884. [Google Scholar] [CrossRef]
  82. Choate, D.M.; Longshore, K.M.; Thompson, D.B. Cougar Dispersal and Natal Homing in a Desert Environment. West. North Am. Nat. 2018, 78, 221–235. [Google Scholar] [CrossRef]
  83. Paolino, R.M.; Royle, J.A.; Versiani, N.F.; Rodrigues, T.F.; Pasqualotto, N.; Krepschi, V.G.; Chiarello, A.G. Importance of Riparian Forest Corridors for the Ocelot in Agricultural Landscapes. J. Mammal. 2018, 99, 874–884. [Google Scholar] [CrossRef]
  84. Morato, R.G.; Connette, G.M.; Stabach, J.A.; De Paula, R.C.; Ferraz, K.M.P.M.; Kantek, D.L.Z.; Miyazaki, S.S.; Pereira, T.D.C.; Silva, L.C.; Paviolo, A.; et al. Resource Selection in an Apex Predator and Variation in Response to Local Landscape Characteristics. Biol. Conserv. 2018, 228, 233–240. [Google Scholar] [CrossRef]
  85. Miotto, R.A.; Cervini, M.; Begotti, R.A.; Galetti, P.M., Jr. Monitoring a Puma (Puma concolor) Population in a Fragmented Landscape in Southeast Brazil: Pumas in Southeast Brazil. Biotropica 2012, 44, 98–104. [Google Scholar] [CrossRef]
  86. Linnell, J.D.C.; Aanes, R.; Swenson, J.E.; Odden, J.; Smith, M.E. Translocation of Carnivores as a Method for Managing Problem Animals: A Review. Biodivers. Conserv. 1997, 6, 1245–1257. [Google Scholar] [CrossRef]
  87. Kivimäki, I.; Van Moorter, B.; Saerens, M. Sensitivity to Network Perturbations in the Randomized Shortest Paths Framework: Theory and Applications in Ecological Connectivity. J. Phys. Complex. 2024, 5, 025017. [Google Scholar] [CrossRef]
  88. Rio-Maior, H.; Nakamura, M.; Álvares, F.; Beja, P. Designing the Landscape of Coexistence: Integrating Risk Avoidance, Habitat Selection and Functional Connectivity to Inform Large Carnivore Conservation. Biol. Conserv. 2019, 235, 178–188. [Google Scholar] [CrossRef]
  89. Alegre, V.B.; Rio-Maior, H.; Oshima, J.E.d.F.; Niebuhr, B.B.; Morato, R.G.; Ribeiro, M.C. The Effect of Anthropogenic Features on the Habitat Selection of a Large Carnivore Is Conditional on Sex and Circadian Period, Suggesting a Landscape of Coexistence. J. Nat. Conserv. 2023, 73, 126412. [Google Scholar] [CrossRef]
  90. Gutiérrez-González, C.E.; López-González, C.A. Jaguar Interactions with Pumas and Prey at the Northern Edge of Jaguars’ Range. PeerJ 2017, 5, e2886. [Google Scholar] [CrossRef]
  91. Gallo, O.; Castillo, D.F.; Godinho, R.; Mac Allister, M.E.; Fernández, G.P.; Failla, M.; Casanave, E.B. Molecular Data Reveal a Structured Puma (Puma Concolor) Population in Northern Patagonia, Argentina. Mamm. Biol. 2021, 101, 653–663. [Google Scholar] [CrossRef]
  92. de la Torre, J.A.; Núñez, J.M.; Medellín, R.A. Spatial Requirements of Jaguars and Pumas in Southern Mexico. Mamm. Biol. 2017, 84, 52–60. [Google Scholar] [CrossRef]
Figure 1. Study area and GPS locations of the puma individuals (n = 14) monitored in this study, in southeastern Brazil (A). Most individuals were monitored along the Tietê river basin in the interior part of São Paulo state, in the transition between small patches of Atlantic Forest and Cerrado (B). One individual (in the Southeast) was monitored in a continuous forest along the coastal Atlantic Forest (C). Different point colors represent the locations of different individuals. The inset on the top-left corner shows the location of the São Paulo state and the Atlantic Forest limit within Brazil.
Diversity 17 00435 g001
Figure 2. Estimated movement rate (A) and turning angle distributions (B) for the pre-dispersal (n = 7), dispersal (n = 8), and ranging phases (n = 14) of puma movement in southeastern Brazil. Distances and angles were calculated using one average location per day. Resident animals (n = 6) were considered in ranging behavior only.
Diversity 17 00435 g002
Figure 3. Predicted home range sizes in relation to the proportion of forest (A) and the average density of roads (B) within the home range. The female resident from the coastal Atlantic Forest was removed from this analysis, and all other 13 pumas were pooled together. The density of roads is represented as the length of roads (in km) per 100 km2.
Diversity 17 00435 g003
Figure 4. Proportion of puma GPS locations in different land use types, for dispersal and ranging phases, during day and night, with all individuals pooled together (n = 14). Other anthropogenic uses consist of agricultural areas (mainly citrus and small areas of coffee or other crops) as well as low-productive pastures and bare soil.
Diversity 17 00435 g004
Figure 5. Predicted movement rates of pumas across land use classes (A) and for different distances to roads (B) and urban areas (C), for dispersal and ranging phases, for residents, natural dispersers, and translocated dispersers. The figures show the predicted values and coefficients (lines, points) and the 95% confidence intervals of the estimates (shaded area).
Diversity 17 00435 g005
Figure 6. Histogram of mean (A) and maximum (B) Euclidean dispersal distance (i.e., the straight-line distance between the start and end point of the dispersal), including all puma studies listed from the literature (grey bars). The red lines represent the mean (in (A)) and maximum (in (B)) Euclidean dispersal values estimated in this study for pumas in southeastern Brazil.
Diversity 17 00435 g006
Disclaimer/Publisher’s Note: The statements, opinions and data contained in all publications are solely those of the individual author(s) and contributor(s) and not of MDPI and/or the editor(s). MDPI and/or the editor(s) disclaim responsibility for any injury to people or property resulting from any ideas, methods, instructions or products referred to in the content.

