Article

Identification and Optimization of Urban Avian Ecological Corridors in Kunming: Framework Construction Based on Multi-Model Coupling and Multi-Scenario Simulation

College of Landscape and Horticulture, Southwest Forestry University, Kunming 650224, China
*
Author to whom correspondence should be addressed.
Diversity 2025, 17(6), 427; https://doi.org/10.3390/d17060427
Submission received: 22 May 2025 / Revised: 10 June 2025 / Accepted: 11 June 2025 / Published: 17 June 2025

Abstract

This study employs a multi-model coupling and multi-scenario simulation approach to construct a framework for identifying and optimizing avian ecological corridors in the urban core of Kunming. The framework focuses on the ecological needs of resident birds (64.72%), woodland-dependent birds (39.87%), and low-mobility birds (47.29%) to address habitat fragmentation and enhance urban biodiversity conservation. This study identifies 54 core ecological corridors, totaling 183.58 km, primarily located in forest–urban transition zones. These corridors meet the continuous habitat requirements of resident and woodland-dependent birds, providing a stable environment for species. Additionally, 55 general corridors, spanning 537.30 km, focus on facilitating short-distance movements of low-mobility birds, enhancing habitat connectivity in urban fringe areas through ecological stepping stones. Eighteen ecological pinch points (total area 5.63 km2) play a crucial role in the network. The northern pinch points, dominated by forest land, serve as vital breeding and refuge habitats for woodland-dependent and resident birds. The southern pinch points, located in wetland-forest ecotones, function as critical stopover sites for low-mobility waterbirds. Degradation of these pinch points would significantly reduce available habitat for birds. The 27 ecological barrier points (total area 89.79 km2), characterized by urban land use, severely impede the movement of woodland-dependent birds and increase the migratory energy expenditure of low-mobility birds in agricultural areas. Following optimization, resistance to resident birds in core corridors is significantly reduced, and habitat utilization by generalist species in general corridors is markedly improved. Moreover, multi-scenario optimization measures, including the addition of ecological stepping stones, barrier improvement, and pinch-point protection, have effectively increased ecological sources, met avian habitat requirements, and secured migratory pathways for waterbirds. These measures validate the scientific rationale of a multidimensional management strategy. The comprehensive framework developed in this study, integrating species needs, corridor design, and spatial optimization, provides a replicable model for avian ecological corridor construction in subtropical montane cities. Future research may incorporate bird-tracking technologies to further validate corridor efficacy and explore planning pathways for climate-adaptive corridors.

1. Introduction

Urbanization, one of the most significant socioeconomic phenomena globally, has had a profound impact on natural ecosystems. Urban green spaces serve not only as critical recreational areas for residents but also as vital habitats for a diverse array of wildlife species. Birds, functioning as keystone species in urban ecosystems, exhibit remarkable sensitivity to environmental changes, where the integrity and connectivity of their habitats play a pivotal role in maintaining urban ecological equilibrium [1,2]. With the accelerating pace of urbanization, the fragmentation of urban green spaces has become increasingly severe, substantially compromising habitat connectivity for avian species. This degradation not only threatens avian survival and reproduction but also undermines the ecosystem services provided by urban environments [3,4,5]. Consequently, the identification and optimization of avian ecological corridors within urban green spaces hold substantial scientific significance and practical value for conserving avian biodiversity and enhancing the stability and resilience of urban ecosystems [6].
In recent years, ecological corridor research has emerged as a focal point in ecology and landscape ecology [7]. Serving as a critical mechanism for linking fragmented habitats, these corridors facilitate species migration, gene flow, and the continuity of ecological processes [8,9]. Empirical studies demonstrate that constructing and optimizing ecological corridors can effectively mitigate the adverse effects of habitat fragmentation. For instance, investigations employing circuit theory have revealed that ecological corridors significantly expand avian activity ranges and enhance population connectivity in urban landscapes [10]. Similarly, applications of morphological spatial pattern analysis (MSPA) and the minimum cumulative resistance (MCR) model in natural World Heritage sites highlight the pivotal role of landscape patterns in shaping ecological processes [11,12]. Despite these advances, existing research remains limited in several key aspects. Most studies concentrate on single ecosystems or localized regions, with systematic investigations of avian ecological corridors in urban green spaces remaining comparatively scarce [13]. Furthermore, while significant attention has been devoted to corridor identification and construction, optimization strategies and conservation measures have not been thoroughly explored. For example, studies that integrate the PLUS-InVEST model to analyze avian distribution and ecosystem services offer insights for optimizing ecological spatial patterns; however, they lack in-depth examination of corridor-specific optimization approaches [14,15,16]. Similarly, although circuit theory has been applied to assess the impacts of urbanization on avian habitat connectivity, multi-scenario corridor optimization remains understudied [17,18]. Consequently, advancing research on the identification and optimization of avian ecological corridors in urban green spaces holds both substantial theoretical significance and addresses pressing practical demands.
As a pivotal city in Southwest China, Kunming boasts a distinctive geographical location and exceptional biodiversity. Its subtropical low-latitude plateau monsoon climate provides critical wintering grounds and migratory stopover sites for numerous avian species [19]. However, rapid urbanization has precipitated severe threats to Kunming’s bird habitats, with marked declines in avian diversity and escalating habitat fragmentation over recent decades. These ecological challenges have garnered significant attention from both governmental and academic sectors [20]. In response, the Kunming Territorial Spatial Planning (2021–2035) [21] explicitly mandates the reinforcement of ecological protection red lines, optimization of urban ecological spatial patterns, and enhancement of ecosystem service functions. Complementing this, the Report on the Dianchi Wetland Ecological Restoration Project [22] underscores the imperative of wetland conservation and restoration for sustaining avian habitats. The main urban area, as the city’s core zone, hosts concentrated economic, cultural, and social activities while confronting acute ecological pressures. Avian habitats in this region endure not only direct impacts of urbanization, such as high-intensity land development, but also compounded stressors, including dense transportation networks, elevated population density, and environmental pollution [23,24]. Collectively, these factors have precipitated a drastic reduction in habitat connectivity, severely constricting viable avian habitats. Research on avian ecological corridors in Kunming’s main urban area is not only an urgent priority but also holds substantial scientific and practical significance for biodiversity conservation and sustainable urban planning.
The identification and optimization of bird ecological corridors in the primary urban area is the focal point of this study. The objective is twofold: firstly, to enhance bird habitat connectivity, and secondly, to provide safer and more continuous roosting and migratory corridors for birds. The overarching ambition is to enhance the overall stability and resilience of the urban ecosystem. This study employs a multifaceted approach, utilizing a range of methodologies, including the InVEST ecosystem service model, GIS ecological sensitivity analysis, morphological spatial pattern analysis (MSPA), the minimum cumulative resistance model (MCR), and circuit theory. These methods are employed comprehensively to identify and enhance ecological corridors for birds within urban green spaces. The primary objectives of this study are as follows: (1) to identify ecological source sites in urban green spaces in the main urban area of Kunming; (2) to construct a comprehensive resistance surface to identify ecological corridors, ecological pinch points, and ecological obstacle points; and (3) to propose strategies to optimize ecological corridors based on multi-scenario simulation. Distinct from prior studies in Kunming and analogous urban systems, which have predominantly focused on generalized ecological security patterns of green infrastructure [25,26], this study addresses a critical knowledge gap in avian-specific corridor modeling. The research makes three pivotal contributions to urban ecological science: (1) construction of a species-specific corridor network explicitly tailored to meet avian ecological requirements within Kunming’s urban core; (2) proposal of an innovative multi-model integration framework by combining InVEST, Ecological Sensitivity, MSPA, MCR, and circuit theory; and (3) pioneering of the practical integration of ecosystem service quantification with spatial ecological principles for urban avian conservation. These outcomes not only provide theoretical underpinnings for enhancing urban ecological resilience but also offer a replicable technical framework for biodiversity preservation in rapidly developing regions, particularly relevant to subtropical montane cities.

2. Methodology

2.1. Study Area

Kunming is located on the Yunnan Guizhou Plateau in southwestern China (102°10′ to 103°40′ east longitude, 24°23′ to 26°22′ north latitude). The total area of the city is approximately 21,015 km2, with the main urban area covering approximately 3205 km2. The topography of the region is characterized by an increase in altitude from north to south, with an average elevation of approximately 2 km, thus classifying it as a plateau city. The city experiences a subtropical low-latitude plateau mountain monsoon climate, characterized by abundant sunshine and heat throughout the year, as well as a distinct four-season cycle. This region serves as a wintering ground for numerous avian species and functions as a transit point during the migratory period, making it a valuable resource for birdwatchers. The primary urban districts of Kunming City within the designated area, namely Panlong, Wuhua, Chenggong, Guandu, and Xishan, are characterized by diverse bird habitats that encompass croplands, woodlands, water bodies, grasslands, and residential areas (Figure 1).

2.2. Data Sources and Processing

2.2.1. Avian Data

The data sources for the study birds were categorized into two main sources: (1) The research team conducted field surveys in the main urban area of Kunming City from January 2022 to December 2022. These were classified according to the urban green space system and comprised three types of representative urban green spaces: park green spaces, street-side green spaces, and community green spaces. The bird survey was conducted using the sample line method. The selection of green space was based on the accessibility of the area and the characteristics of the green space, and the survey sample lines were established. Each sample line spanned a distance of 100 m, with the distance between the first and last intervals exceeding 100 m. A 50 m buffer zone defined the boundary of the green space. A total of 145 sample lines were recorded, encompassing 44 green spaces. The survey was conducted every month, during clear and windless weather conditions, across two time periods: 7:00–11:00 and 15:00–17:00. During the survey, BOSMA Coyote binoculars were utilized to traverse a fixed line at a speed of 2 km/h, to document the number of bird species observed, their behavior, and the vegetation habitat on both sides of the sample line within a 25 m area. The avian species, numbers, behaviors, stopover locations, and vegetation habitats observed were recorded within 25 m of each side of the sample line. The identification and classification of the avian species were conducted using the Field Manual of Chinese Birds [27] and the List of Classification and Distribution of Birds in China [28]. A 20 m × 20 m sample square was set on one side of each bird survey sample line for tree surveys, 5 m × 5 m medium sample squares were set at the four corners and centers within the large sample squares for shrub surveys, and 1 m × 1 m small sample squares were selected within the medium sample squares for herbaceous surveys. A total of 283 species counts were collected, and 31,058 species counts were collected. (2) The data presented herein is derived from the observation records of the China Birdwatching Records Center (http://www.birdreport.cn) containing bird data in the five urban areas of the main city from January 2022 to December 2022, with a total of 305 records and 726 species counts.
Based on 46,830 avian observation records from 195 sampling sites in the main urban area of Kunming, this study employed the SDM tool in ArcGIS to establish a three-dimensional avian classification system (Table 1). The system includes three dimensions: migratory behavior (resident birds 64.72%, migratory birds 35.28%), habitat preference (forest-dwelling species 39.87%, wetland-dependent species 37.63%, open-habitat species 22.50%), and migratory capacity (high 43.52%, medium 9.19%, low 47.29%). Representative species for each category are detailed in Table 2. These classifications were designed to address the diverse ecological needs of birds in urban environments. Resident birds rely on ecological corridors for food, nesting, and shelter, while migratory birds use them as stopover and transit routes. Forest-dwelling, wetland-dependent, and open-habitat species require diverse habitats within the corridors. Migratory capacity classification (high, medium, low) is crucial for understanding birds’ movement dynamics and habitat connectivity needs. These dimensions collectively form an integrated framework for avian ecological adaptation strategies, providing a scientific basis for constructing stratified ecological corridors that support diverse avian communities.

2.2.2. Model Data

The environmental data of this study are based on three major models: InVEST ecosystem services, GIS ecological sensitivity analysis, and MSPA morphological spatial pattern analysis. The data were obtained from various platforms, including the Geospatial Data Cloud (https://www.gscloud.cn/), the Resource and Environmental Science Data Platform (https://www.resdc.cn/), and the Geo-Remote Sensing Ecological Network (http://www.gisrs.cn). A comprehensive overview of the data sources is provided in Table 3.

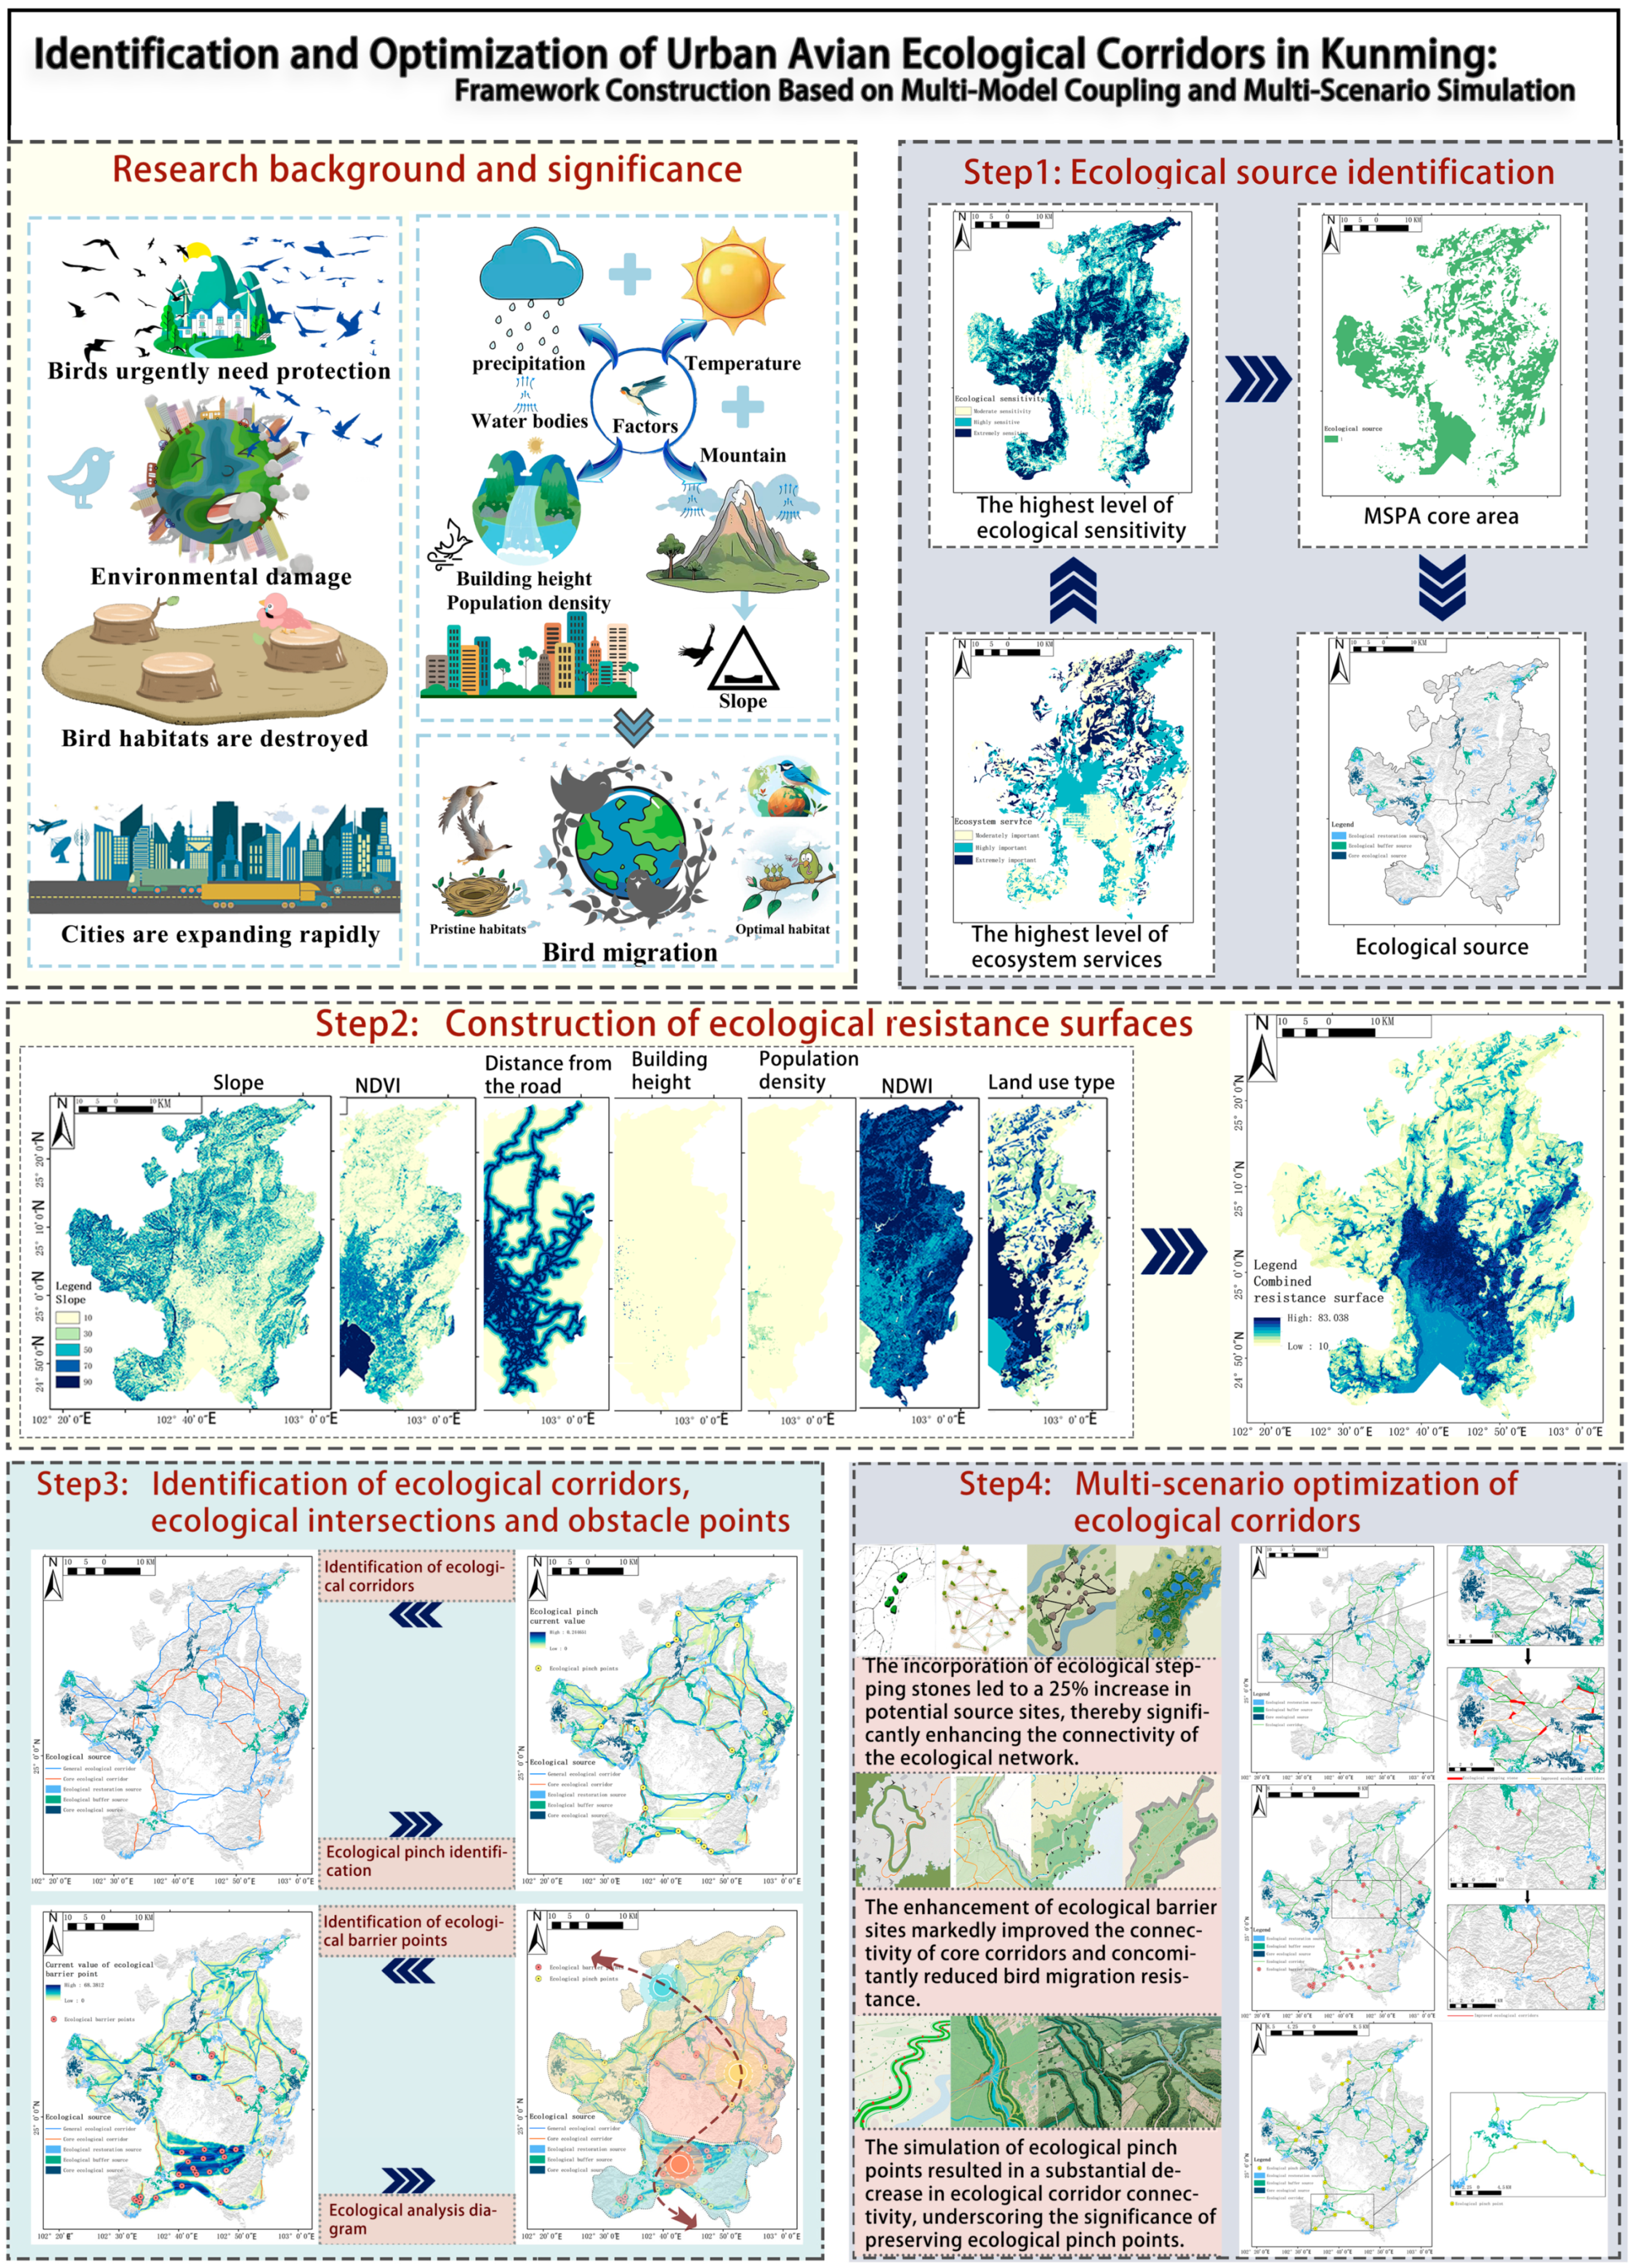
2.3. Research Framework

In this study, we integrated the InVEST ecosystem service assessment, GIS ecological sensitivity analysis, and MSPA morphospatial analysis to identify ecological source sites. We then constructed integrated resistance surfaces based on the MCR model and circuit theory. We subsequently extracted ecological corridors and identified key pinch points and obstacle points. Finally, we optimized the ecological corridor network through multi-scenario simulation (Figure 2).

2.4. Identification of Ecological Source Sites

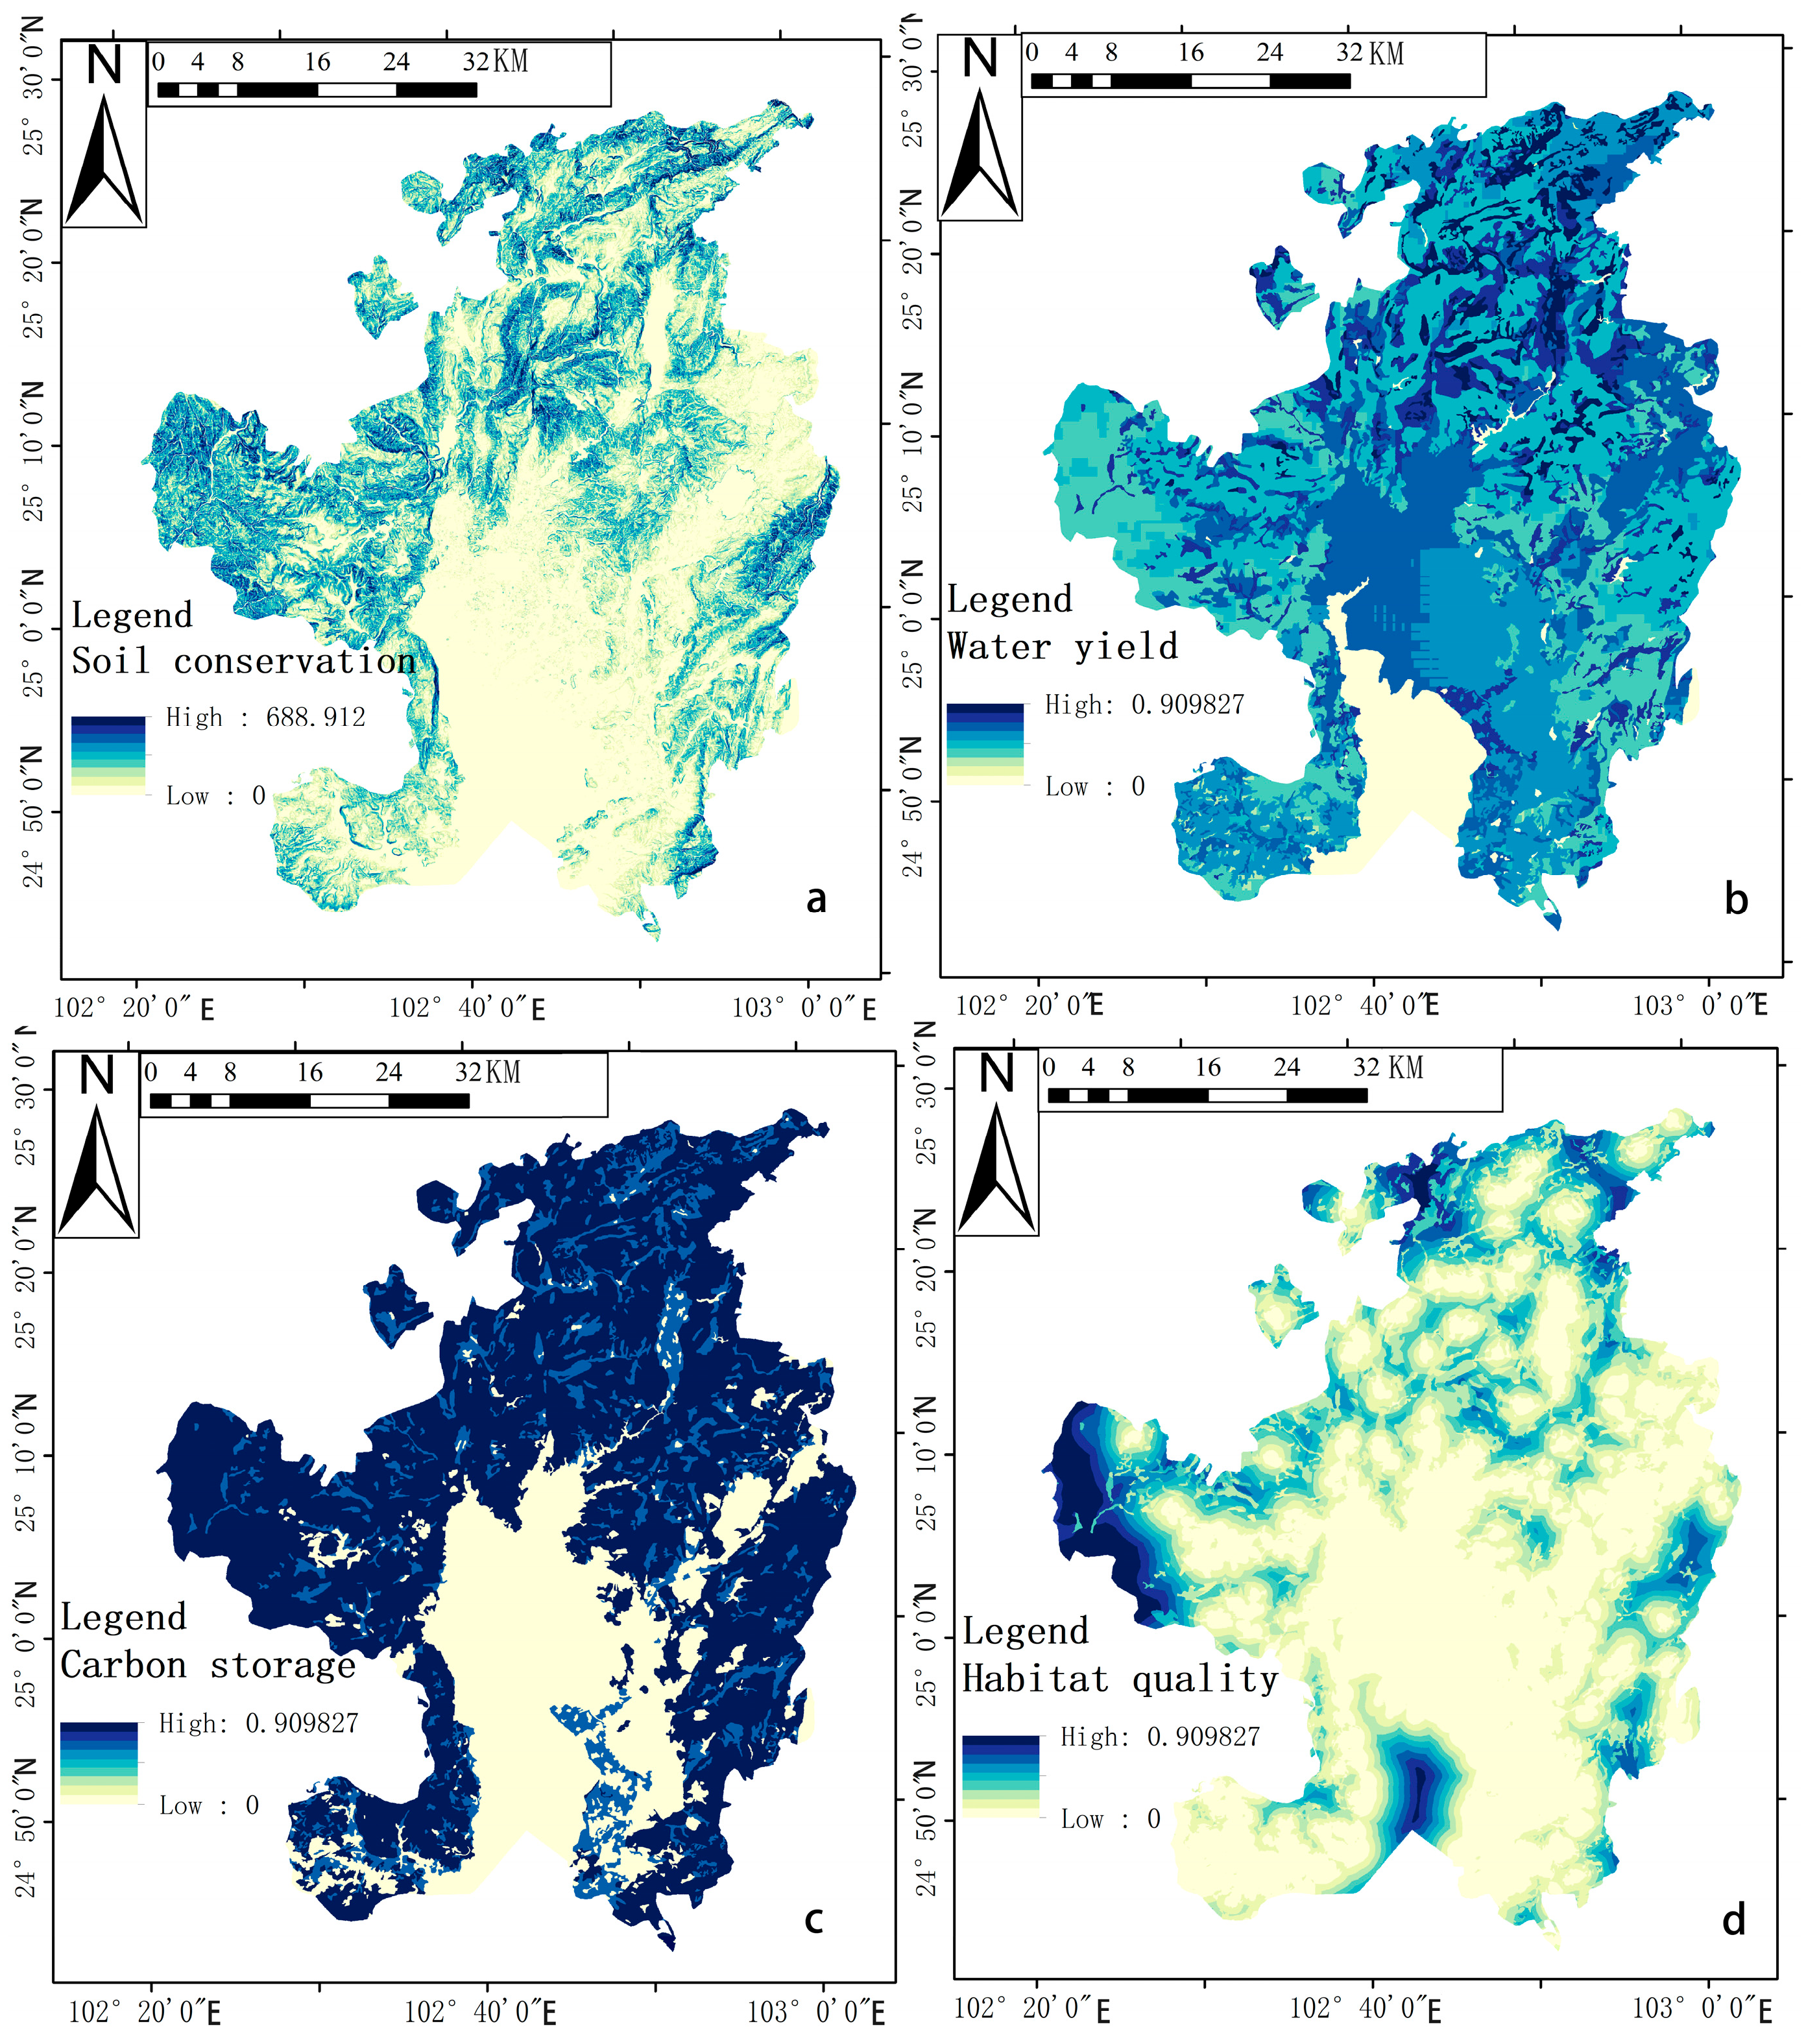
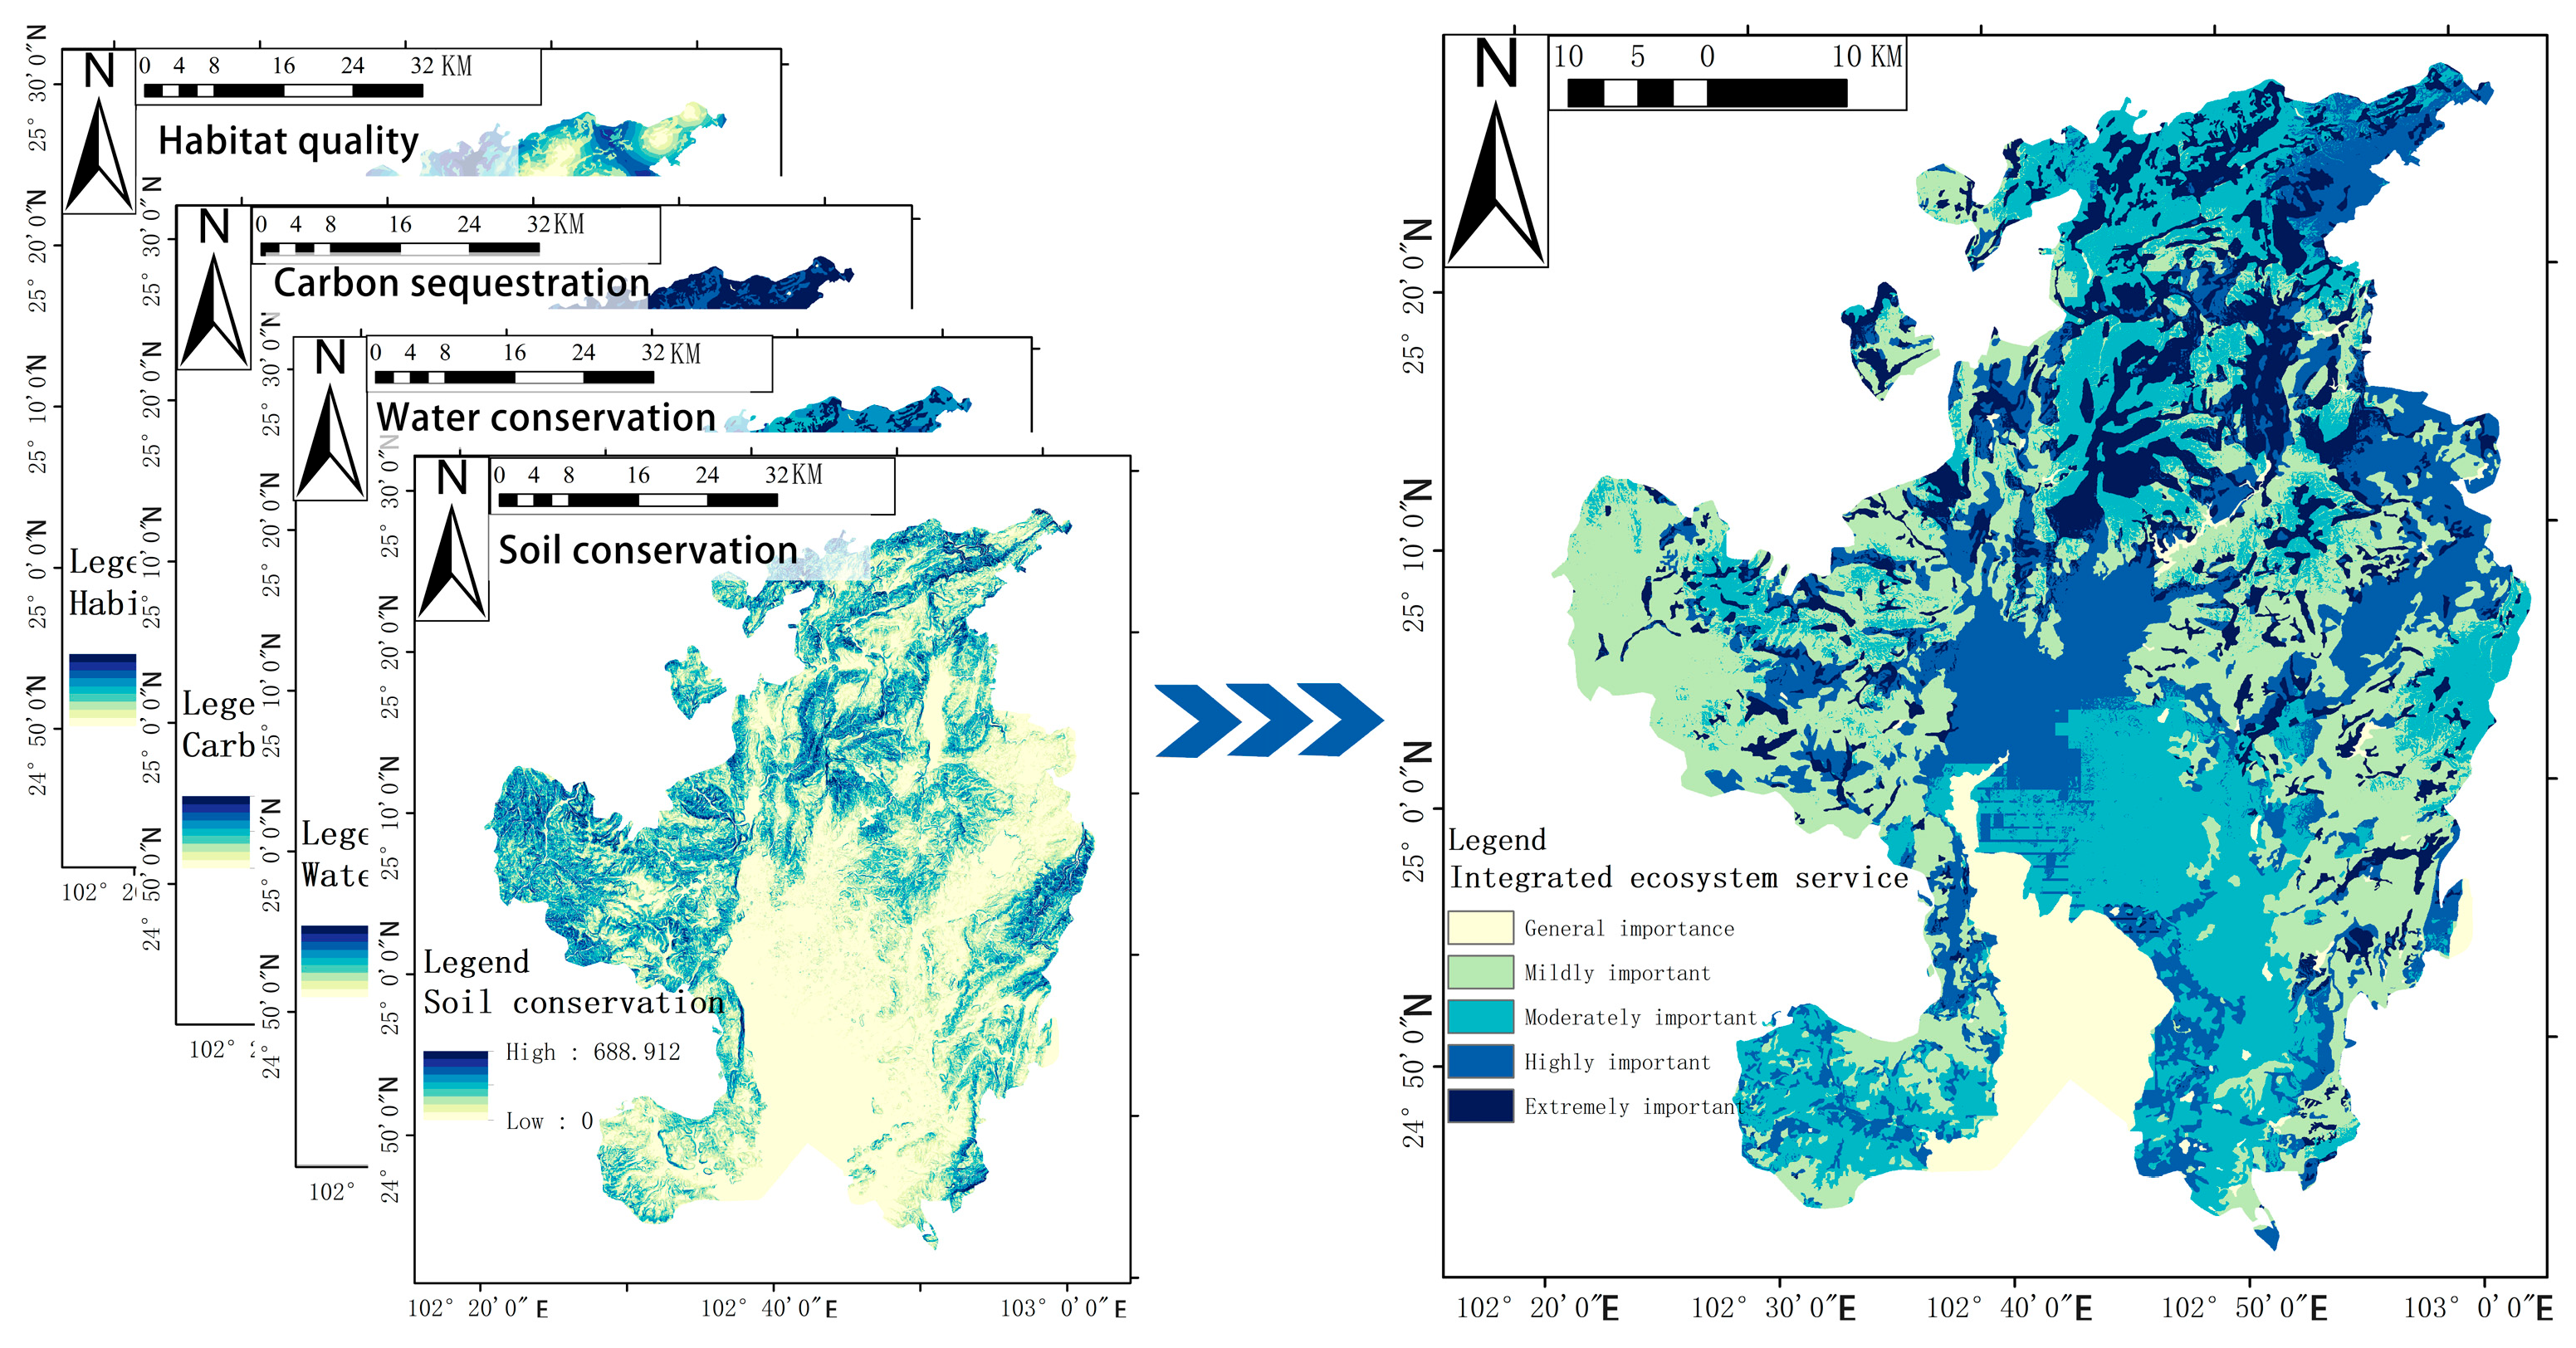
2.4.1. InVEST Ecosystem Services

The InVEST model is a quantitative ecosystem services assessment tool that was developed in collaboration between Stanford University, The Nature Conservancy (TNC), and the World Wide Fund for Nature (WWF). It systematically analyzes the functions of ecosystem services and their trade-offs. The model’s carbon sequestration assessment is based on the carbon density values of different ecosystem types, which combine land use types with the four basic carbon pools (above-ground biomass, below-ground biomass, soil organic carbon, and dead organic matter) to calculate changes in regional carbon stocks. The habitat quality assessment quantifies the ability of ecosystems to support the survival and reproduction of species by resolving the sensitivity of threat factors, the intensity of external threats, and their spatial effects [11,15].
In this study, the InVEST model was employed to comprehensively assess four key ecosystem services in the main urban area of Kunming City. These services were as follows: (1) soil retention (SDR module), (2) water conservation (Water Yield module), (3) carbon sequestration (Carbon module), and (4) habitat quality (Habitat Quality module) [29]. Combined with GIS technology, the spatial patterns of ecosystem services and their dynamic change characteristics were systematically revealed, encompassing the dimensions of provisioning, regulating, and supporting service functions. The spatial heterogeneity of regional ecological functions was also elucidated [30] (Figure 3).
(1)
Soil conservation formula:
A = R × K × L S × C × P
where A is the soil and water conservation amount (t hm−2 a−1); R is the rainfall erosivity factor (MJ. mm hm−2 h−1 a−1), calculated using the annual precipitation proposed by Arnoldus; K is the soil erodibility factor (t hm2 h MJ−1 hm⁻2 mm−1), calculated based on the organic carbon content of the soil and the composition of the soil particle size using the EPIC model; LS is the slope length and gradient factor (dimensionless); C is the vegetation cover and crop management factor (dimensionless); and P is the soil and water conservation measures factor (dimensionless) [31].
(2)
Water conservation formula:
Y ( x ) = 1 A E T x P x × P ( x )
  A E T ( x ) P ( x ) = 1 + P E T ( x ) P ( x ) 1 + P E T ( x ) P ( x ) ω 1 ω
ω ( x ) = Z A W C x P x + 1.25
where Y(x) is the water yield (mm) of raster x; AET(x) is the annual actual evapotranspiration (mm) of raster x; and P(x) is the annual precipitation (mm) of raster x [32]. PET(x) is the potential evapotranspiration (mm) of raster x; and ω is a nonphysical empirical parameter representing the natural climatic and soil properties. AWC(x) is the effective soil water content (mm), which is determined by the soil texture and effective soil depth; and Z is a seasonal constant, referring to the literature related to the InVEST model.
(3)
Carbon sequestration formula:
C t o t = C a b o v e + C b e l o w + C s o i l + C d e a d
where Ctot is total carbon (t/hm2); Cabove is above-ground biogenic carbon (t/hm2); Cbelow is below-ground biogenic carbon (t/hm2); and Cdead is dead organic carbon (t/hm2). Biomass was multiplied by a carbon content factor to determine the carbon content, and above-ground biomass was calculated based on net primary productivity (NPP) estimates for each ecosystem type. The root-to-stem ratio was used to calculate the coefficient of proportionality between below-ground and above-ground biomass, thereby determining the proportion of below-ground biomass to total biomass. Both soil carbon density and dead organic carbon density were referenced to parameters in the literature.
(4)
Habitat quality formula:
Q x j = H j 1 D x j z D x j z + K z
D x j = 1 T R 1 y ω T R R = 1 n ω R × T R y × i T R x y × β x × S j T R
where Qxj denotes the habitat quality index of raster x in land cover type j; Hj is the habitat suitability in land cover type j; the z-value is the default parameter of the model, set to 2.5; the k-value is the half-saturation constant, which is based on half of the degradation degree of the Dxj habitat, and the final half-saturation parameter is taken to be 0.31; TR is the threat source factor; ωTR is the threat source factor weights; y is the number of rasters of the threat source; TRy is the stress value in raster y; iTRxy is the stress level of the threat source TR in raster y on raster x; βx is the accessibility level of threat source to grid x; and SjTR is the sensitivity of habitat type j to threat source TR [33].

2.4.2. GIS Ecological Sensitivity Analysis

Ecological sensitivity is defined as the vulnerability of ecosystems in a given area to external disturbances and their potential ecological conservation value, reflecting the responsiveness of ecosystems to external disturbances and their potential exposure to risk [34,35,36]. The assessment focuses on quantifying the likelihood and severity of ecological problems, thereby revealing the potential negative impacts of human activities on ecosystems. Typically, areas of high ecological sensitivity exhibit poor ecosystem stability and are prone to ecological and environmental problems, such as soil erosion, biodiversity loss, and land degradation [37,38].
The following four main dimensions are covered: geological sensitivity, climatic sensitivity, natural resource sensitivity, and human disturbance sensitivity. Each of these dimensions can be further subdivided into several context-specific indicators, as illustrated in Table 3. In the assessment process, according to the Guidelines for the Delineation of the Ecological Protection Red Line [39], the high-, medium-, and low-sensitivity ranges of each impact factor were defined, and the weights of each indicator were determined using the hierarchical analysis method (AHP). The sensitivity assignment results for the four types of factors were then analyzed in a weighted superimposed manner to obtain the spatial distribution pattern of the ecosystem sensitivity in the main urban area of Kunming City (Figure 4). The ecological sensitivity index was calculated by the weighted summation method with the formula [40]:
E I i = j = 1 n Y i j × W j
where EIi is the ecological sensitivity index of the ith evaluation unit; Yij is the standardized value of the jth indicator of the ith evaluation unit; Wj is the weight of the jth indicator; and n is the total number of indicators. The value range of EIi is [0, 1]; the larger the value of EIi, the higher the degree of ecological sensitivity and the higher the probability of ecological problems in the region; the smaller the value of EIi, the lower the degree of ecological sensitivity and the lower the probability of ecological problems in the region.

2.4.3. Spatial Pattern Analysis of MSPA Morphology

The MSPA method, founded on mathematical and morphological principles, has been demonstrated to be an effective tool for reclassifying raster image pixels and identifying ecological sources [41]. In this study, the main habitat types of birds (woodland and grassland) were used as foreground, and the rest of the area was used as background. Among them, large-scale habitat patches in the foreground pixels serve as core areas that provide essential living space for species, are crucial for biodiversity conservation, and are often utilized as ecological sources [10].
Conefor Landscape Connectivity is a tool used to assess the role of the landscape in facilitating or hindering biological migration and ecological processes between patches. This is achieved through the dimensions of structural connectivity and functional connectivity. It serves as an important basis for identifying high-quality ecological sources and integrating the roosting and foraging ranges of birds, as well as connectivity between habitat patches. The current assessment tools employed are the Connectivity Integral Index (IIC), the Connectivity Probability (PC), and the Patch Importance Index (dPC). The PC index is advantageous because it contains richer connectivity models and is not affected by neighboring patches. In contrast, dPC considers the impact of patch size, shape, and location on connectivity. Higher dPC values indicate that patches contribute more to overall landscape connectivity [42]. Furthermore, the possible connectivity index can reflect both landscape structural features and behavioral features of species dispersal, thereby providing effective support for the association study between urban green spaces and bird species. Conefor software version 2.6 was utilized to calculate dPC, and patches with dPC > 1 were designated ecological source patches according to the following formula:
P C = i = 1 n j = 1 n a i × a j × p i j * / A L 2
d P C = P C P C r e m o v e / P C × 100
where n denotes the total number of patches in the study area, and ai and aj are the areas of patch i and patch j, respectively. The parameter p i j * is the maximum product probability of all paths between patch i and patch j. AL is the total area of the landscape type contained within the study area. PC denotes the index of possible connectivity of patches and takes the value of [0, 1]; the smaller its value, the lower the connectivity between patches, which is unfavorable for species exchange. PCremove represents the overall index after the removal of a specific patch. The dPC index measures the importance of each patch in maintaining landscape connectivity by assessing the change in PC after the removal of a specific patch.

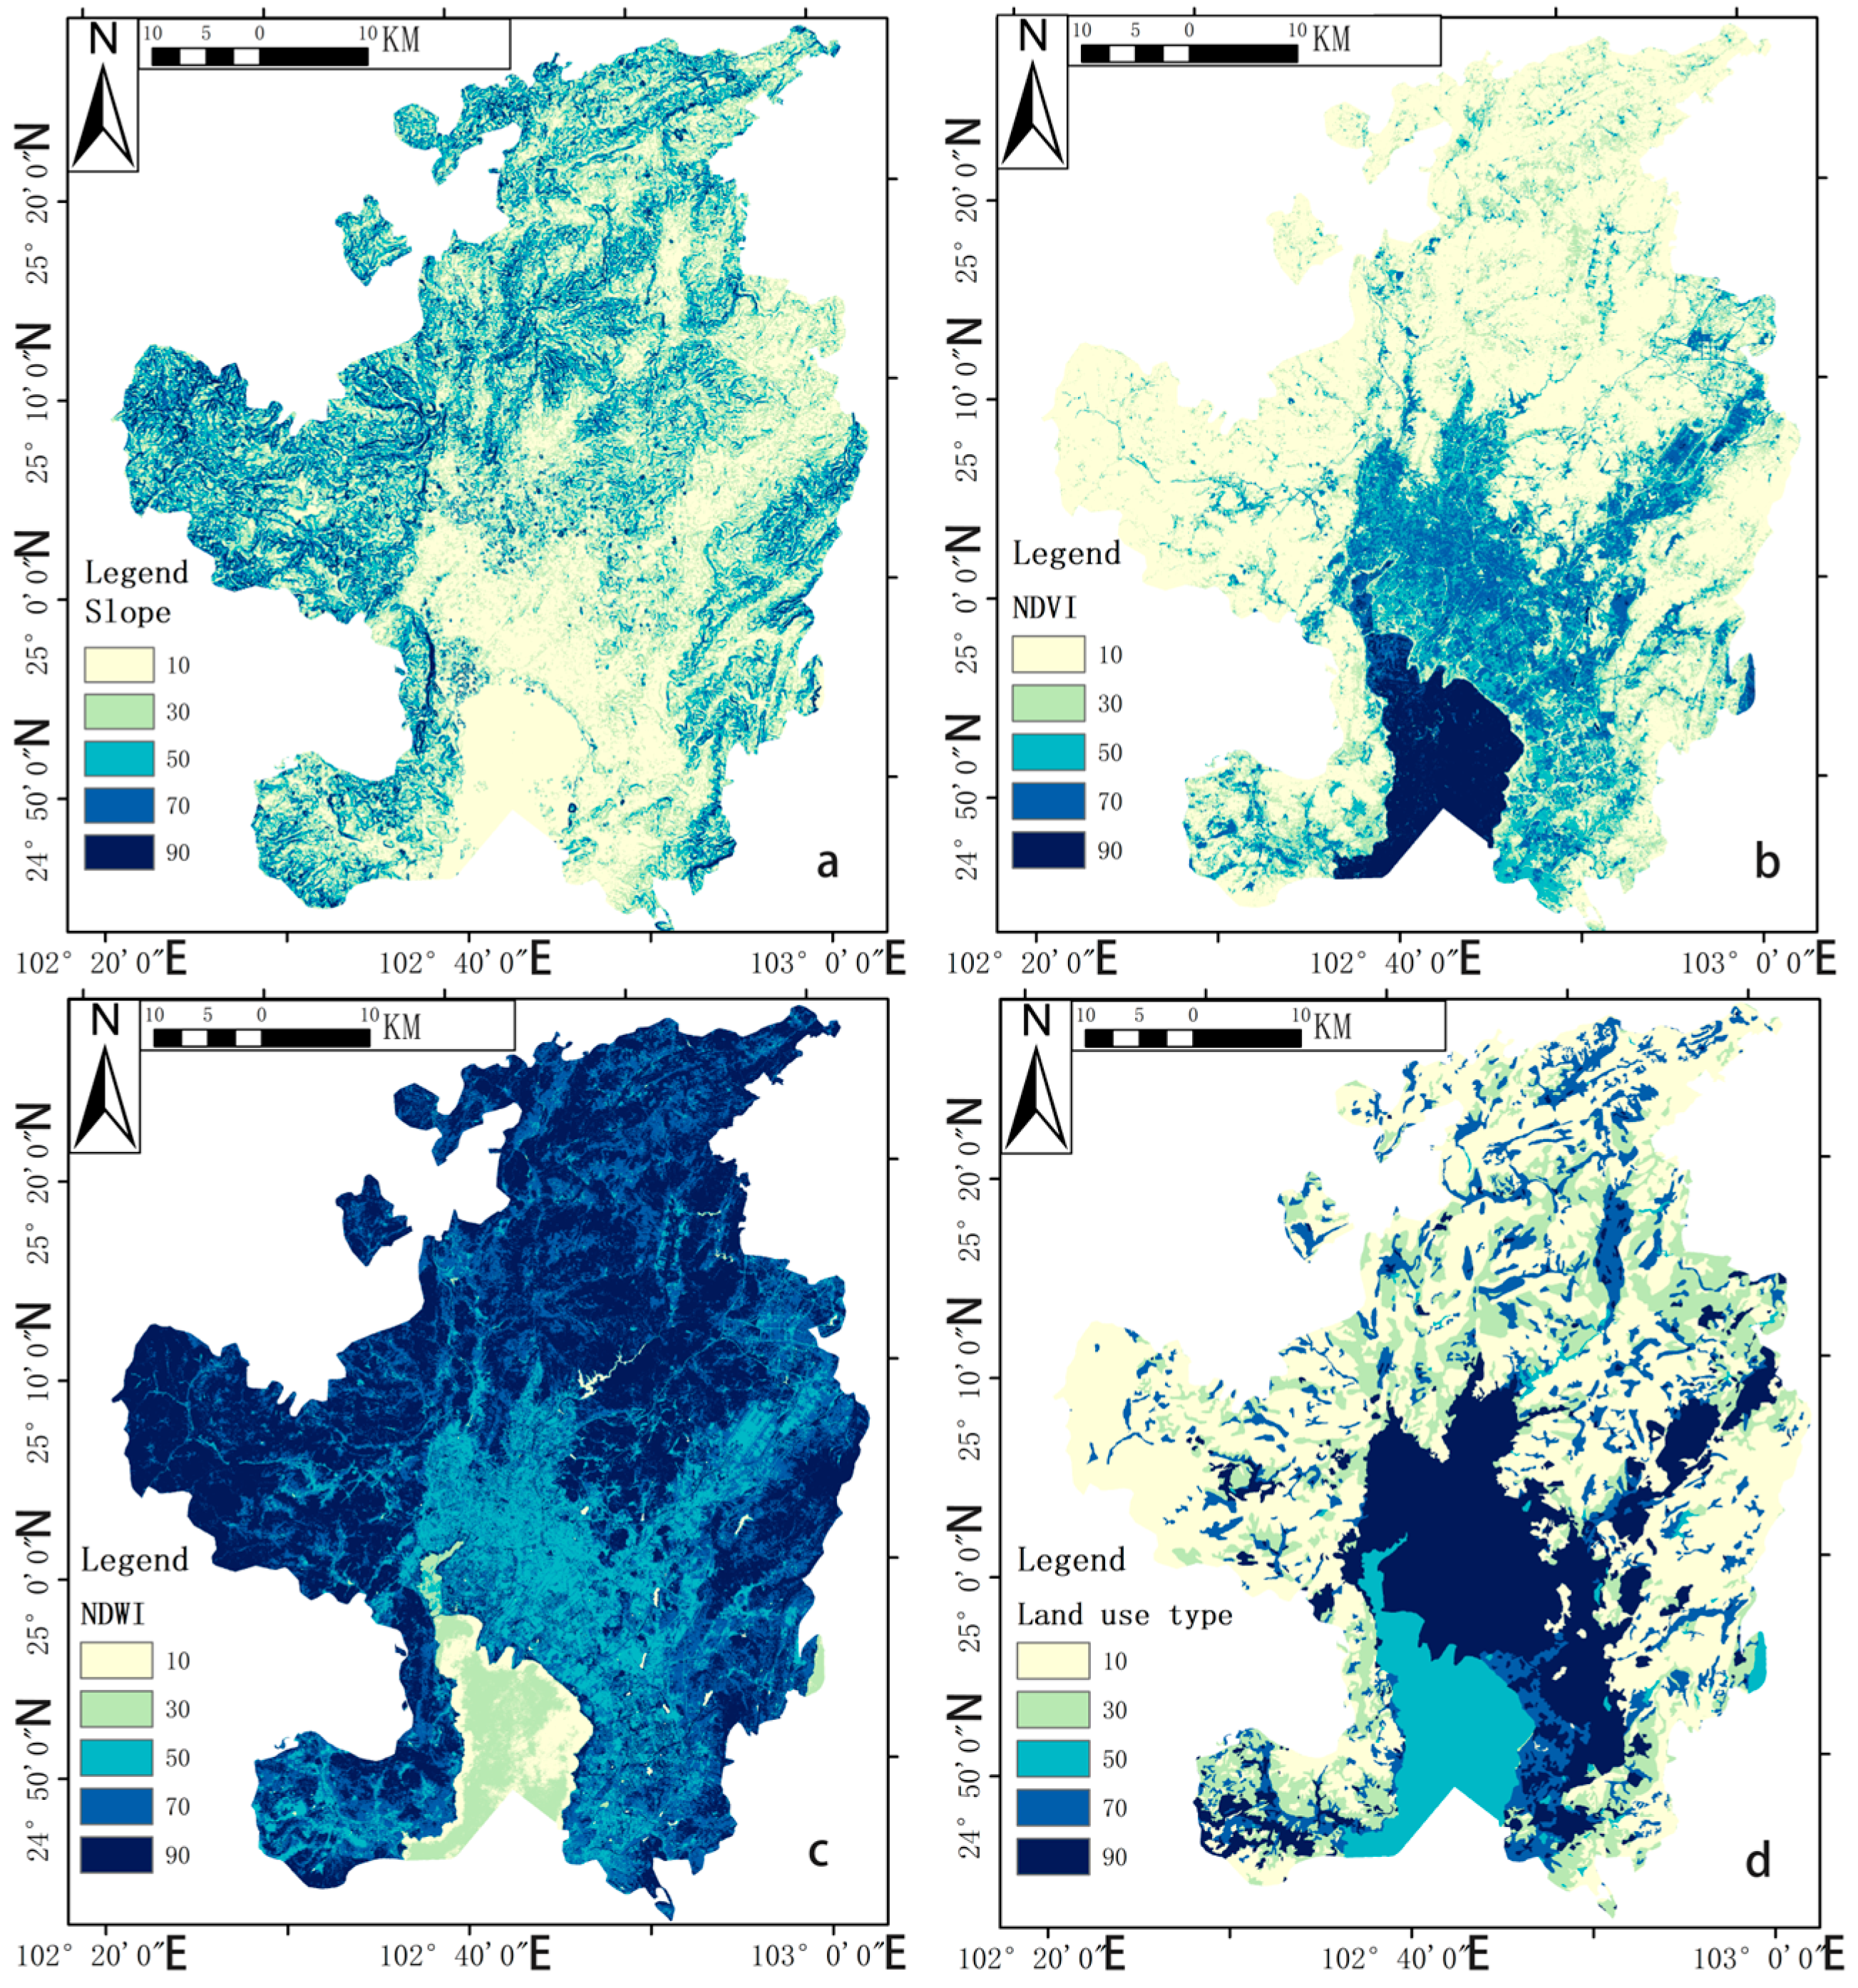
2.5. Resistance Surface Construction

2.5.1. Resistance Factor Identification

In natural environments, resistance surfaces act as barriers to the migration of species or the flow of energy. In the case of birds, food sources and human activities are the primary factors influencing migration, roosting, and other ecological behaviors [43,44]. Among the various categories of land cover, built-up land has been found to exhibit the most intensive human activity, resulting in the highest resistance values in the landscape and the most significant impacts on birds. Conversely, highly natural and minimally disturbed landscapes, such as forests and grasslands, typically exhibit lower ecological resistance. While farmland provides certain ecological resources, it generally exhibits higher ecological resistance compared to forests and grasslands, attributable to the presence of human disturbances.
The identification of resistance surface factors constitutes a pivotal step in the process of constructing ecological corridors. These factors exert a direct influence on the dispersal of species and the connectivity of ecological processes. A comprehensive analysis of the natural environment and human activities can facilitate the identification of primary resistance factors impacting ecological processes, including terrain slope, vegetation cover, water quality, and human activities [42,45]. It is evident that the topographic slope exerts a significant influence on the selection of habitat and the mobility of species [3]. Vegetation cover plays a pivotal role in providing sustenance and a conducive environment for species to thrive. However, it is essential to recognize the potential consequences of human activities, which can lead to the fragmentation and obstruction of ecological corridors [46]. Furthermore, factors such as distance from roads, building height, and land use type were used to quantify the resistance surface [13,47], with the selection of these factors based on the ecological needs of the species and landscape characteristics to ensure the model’s accuracy and applicability. Consequently, in this study, we selected the natural factors of slope, vegetation normalization, and water body normalization, as well as the anthropogenic factors of land use type, distance from the road, building height, and population density, and seven resistance factors to construct the resistance surface (Figure 5 and Figure 6).
Hierarchical analysis (AHP) is a widely employed methodology for determining the weights of resistance factors [12,48,49]. AHP employs a hierarchical model to decompose complex problems into three levels: objectives, guidelines, and programs, and determines the relative importance of each factor through an expert scoring method. This method effectively reduces the influence of subjective assignment, making the construction of resistance surfaces more scientific and reasonable. The resistance values assigned by AHP, combined with ArcGIS, are 10, 30, 50, 70, and 90 in descending order (Table 4).

2.5.2. Comprehensive Resistance Surface Construction

The identification of resistance surface factors has led to the frequent use of the minimum cumulative resistance (MCR) model in conjunction with circuit theory for constructing comprehensive resistance surfaces [5,16]. The model has been demonstrated to reveal the influence of landscape patterns on ecological processes by calculating the path of least cumulative resistance to species movement between different ecological sources. The model’s core equations involve parameters such as spatial distance (Dij), resistance coefficient (Ri), and ecological process correlation (fmin). By superimposing the resistance surfaces of each factor, the MCR model generates an integrated resistance surface, which in turn identifies ecological corridors, ecological pinch points, and ecological obstacle points (Figure 7). The public notice is as follows:
M C R = f m i n j = n i = m D i j × R i
where fmin is the correlation between the ecological process and the minimum cumulative resistance; Dij is the distance at which the species reproduces; and Ri is the resistance coefficient of the resistive surface.

2.6. Identification of Ecological Corridors and Ecological Nodes

In the present study, the Linkage Mapper toolbox was utilized to extract ecological corridors and potential ecological corridors, setting the cost-weighted distance threshold at 40 km, and determining the smallest cost-path distance between sources as the optimal corridor, to identify ecological corridors in the main urban area of Kunming. Subsequently, the Linkage Pathways Tool was used to assess the importance of the various corridors, enabling the classification of ecological corridors into core corridors and general corridors based on their importance scores [50,51].
The Linkage Mapper toolbox was utilized as a multi-scale analysis method, enabling the systematic identification of ecological barrier points and ecological pinch points. Initially, the Barrier Mapper module was utilized to identify ecological obstacle points, with a radius ranging from 100 to 500 m set, and 50 m designated as the step size for multi-scale analysis. The ‘Maximum’ mode was employed for iterative operation to comprehensively capture the multilevel impacts of landscape heterogeneity on ecological processes. The output raster data were then reclassified using the natural breakpoint classification method, and high-value areas were extracted using the Feature to Point tool in ArcGIS. The output raster data were then subjected to reclassification by the natural breakpoint classification method, and the high-value areas were subsequently extracted using the Feature to Point tool in ArcGIS to identify the key ecological obstacles.
In terms of identifying ecological pinch points, the Circuitscape model and the Pinchpoint Mapper module of the Linkage Mapper toolbox are integrated to construct an ecological corridor importance assessment system based on circuit theory. Circuit simulation was performed using the “all-to-one” model, with eight cost-weighted width parameters ranging from 1 km to 8 km, for a multi-scenario comparative analysis. The calculation of the current density probability distribution was undertaken, and key bottleneck regions of ecological flow were identified. A standard deviation-based grading method was employed to extract high-value regions, and the spatial distribution of key ecological pinch points was determined.

2.7. Optimize the Ecological Corridor Network

The present study focuses on the ecological corridors of birds in urban green spaces. It takes ecological node patches as objects and proposes bird habitat protection strategies through multi-scenario simulations. These include the optimization of ecological stepping stone patches, the improvement of ecological obstacle points, and the simulation of ecological pinch-point degradation. The purpose of this study is to provide a scientific basis for urban biodiversity conservation [52,53].

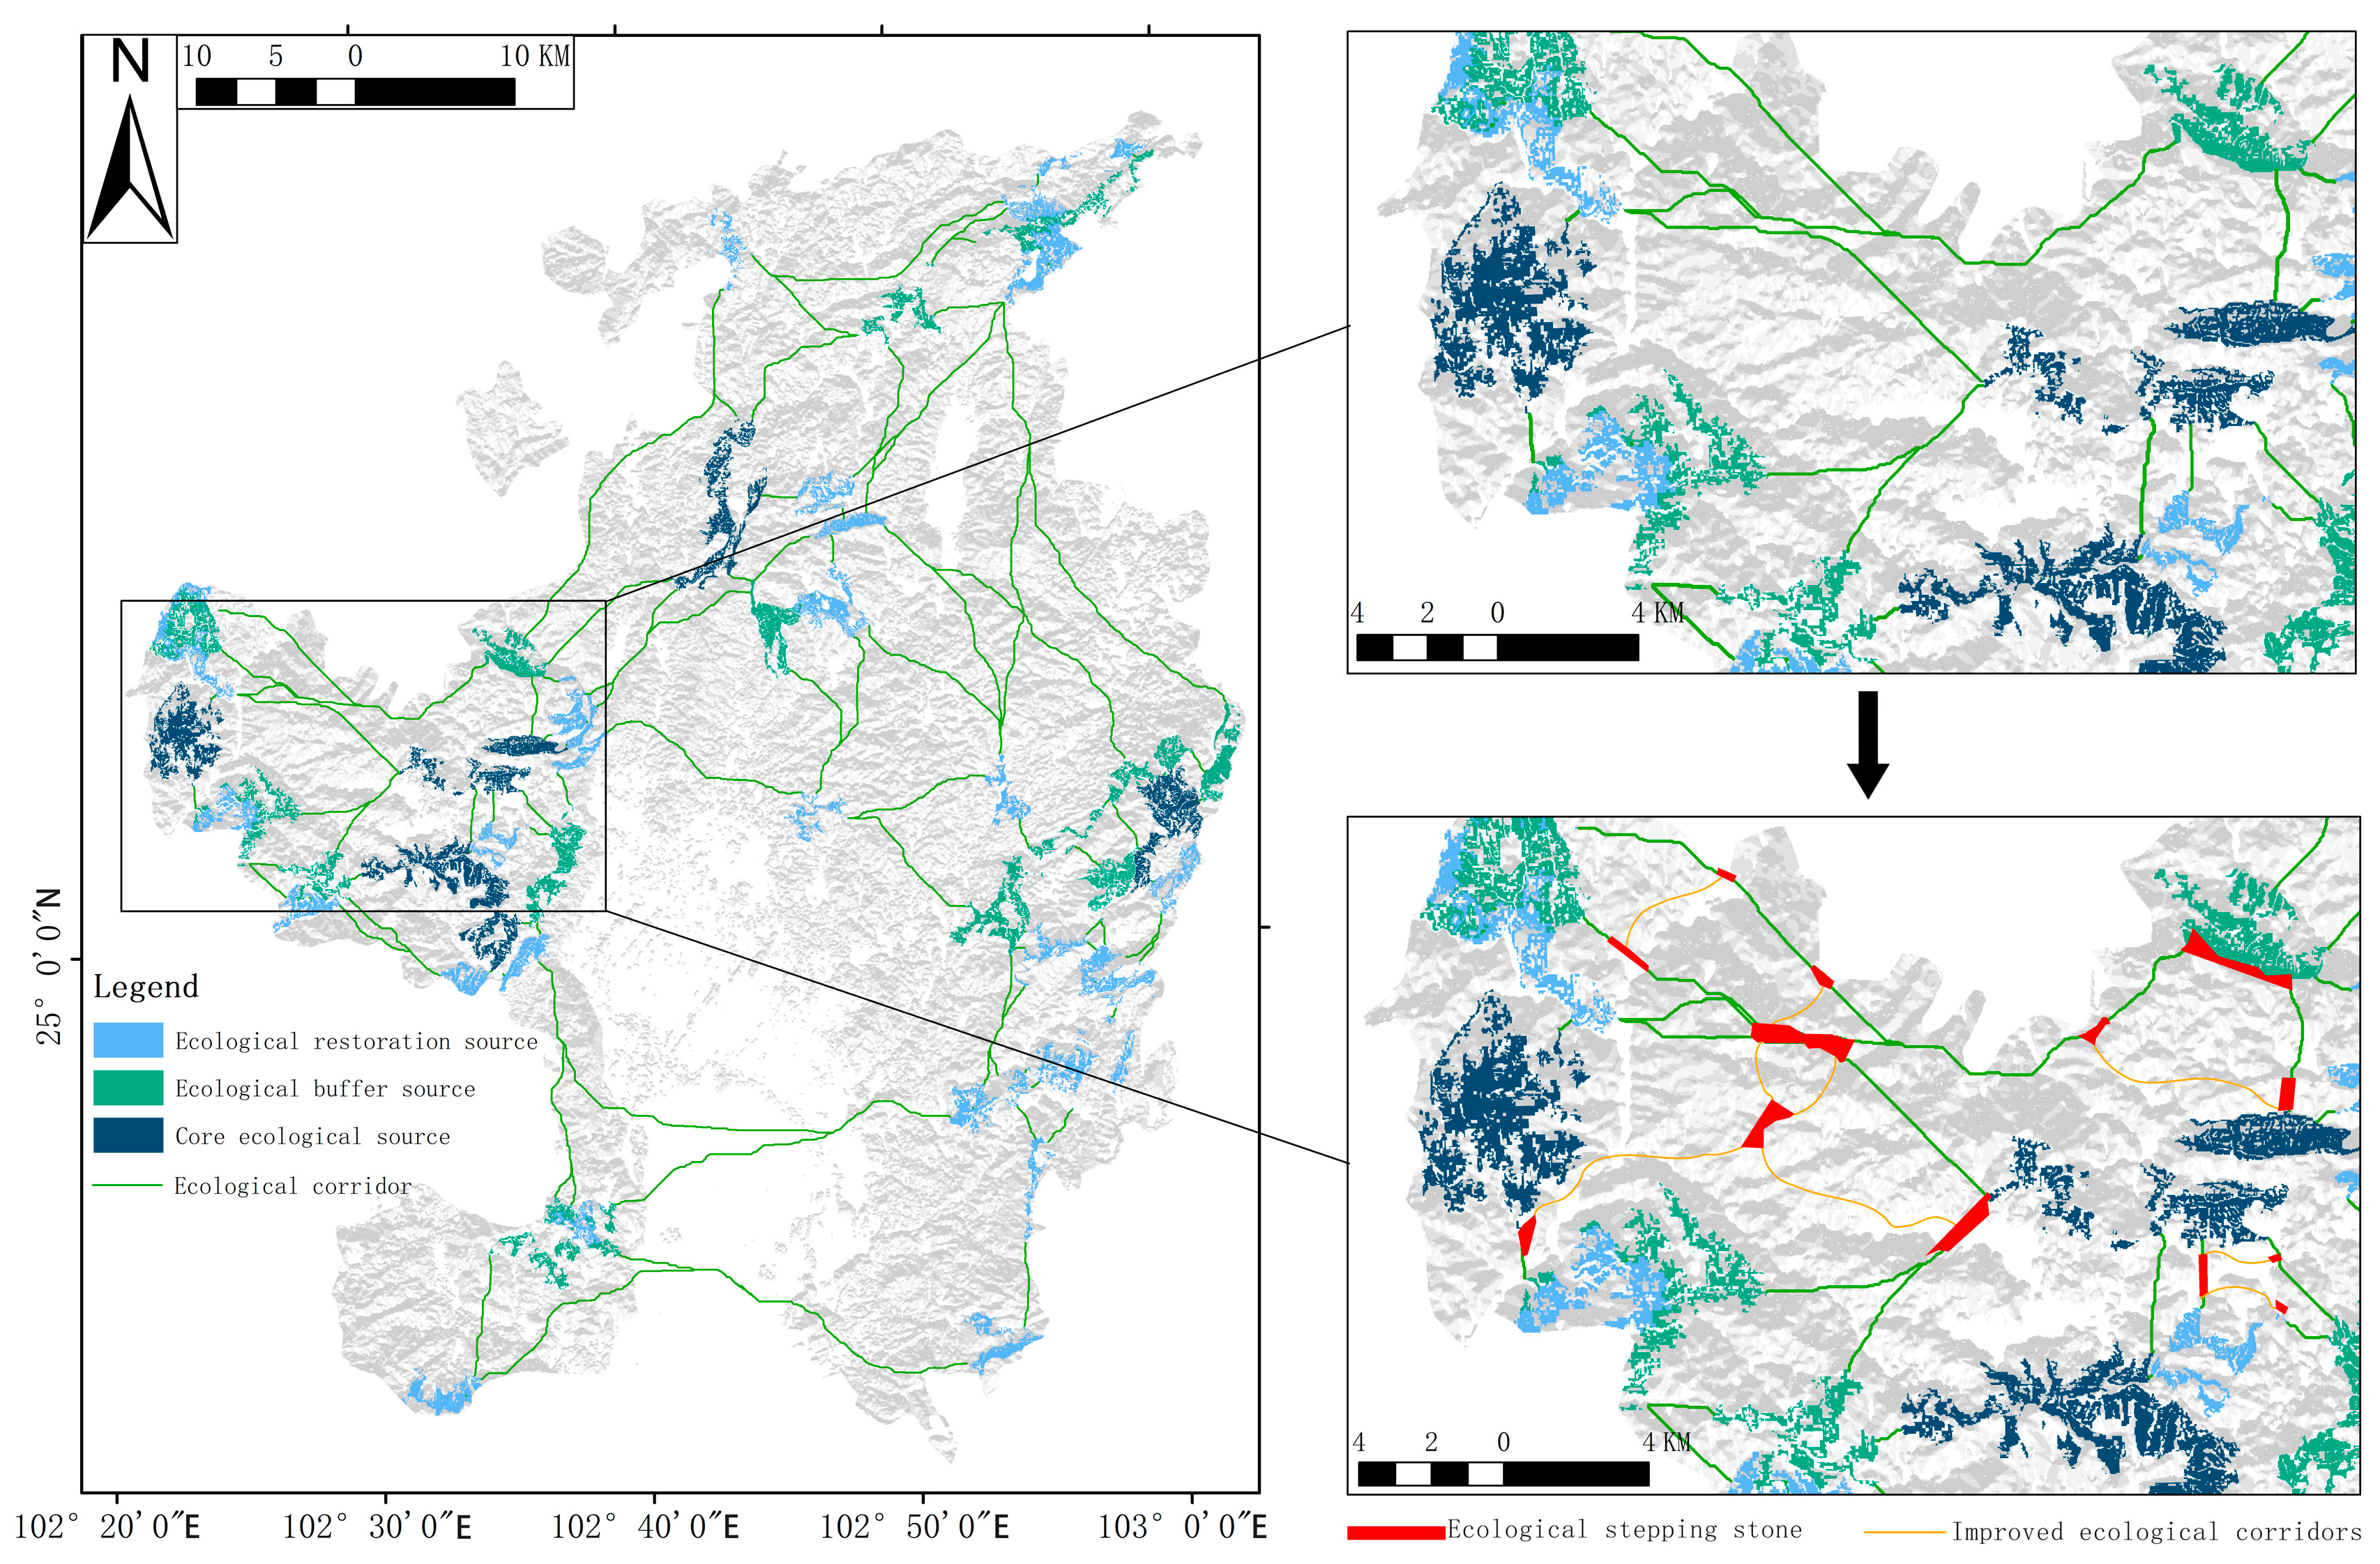
2.7.1. Adding Ecological Stepping Stones

The construction of a network of ecological stepping stones involves the strategic placement of point ecological patches at the junctions of primary ecological source patches, thereby reducing the spatial distance between ecological sources and optimizing the structure of ecological corridors. This approach is intended to enhance ecosystem connectivity and mitigate habitat fragmentation [54]. The siting of ecological stepping stones focuses on areas around primary ecological source sites and the 20% of areas with the lowest ecological resistance values. The selection process employs a combination of spatial analysis and field verification to prioritize non-rural and urban residential land types, intending to preserve the structural integrity of the ecosystem and maintain the ecological function of the corridor.

2.7.2. Improvement of Ecological Barrier Sites

To reduce bird migration resistance, it is necessary to rehabilitate barrier sites within ecological corridors, thereby enhancing the quality of these corridors. To address the variability of bird communities in different regions, a multi-scale analysis method was used to identify key barrier points. The Barrier Mapper tool, based on the Linkage Mapper module of the ArcGIS platform, was then used to analyze the vector layer of the barrier points spatially. This involved improving or optimizing the habitat areas with high resistance values, such as urban residential land and arable land. The top 20% of areas with the highest barrier values were then extracted as priority restoration targets through the natural breakpoint method [55].

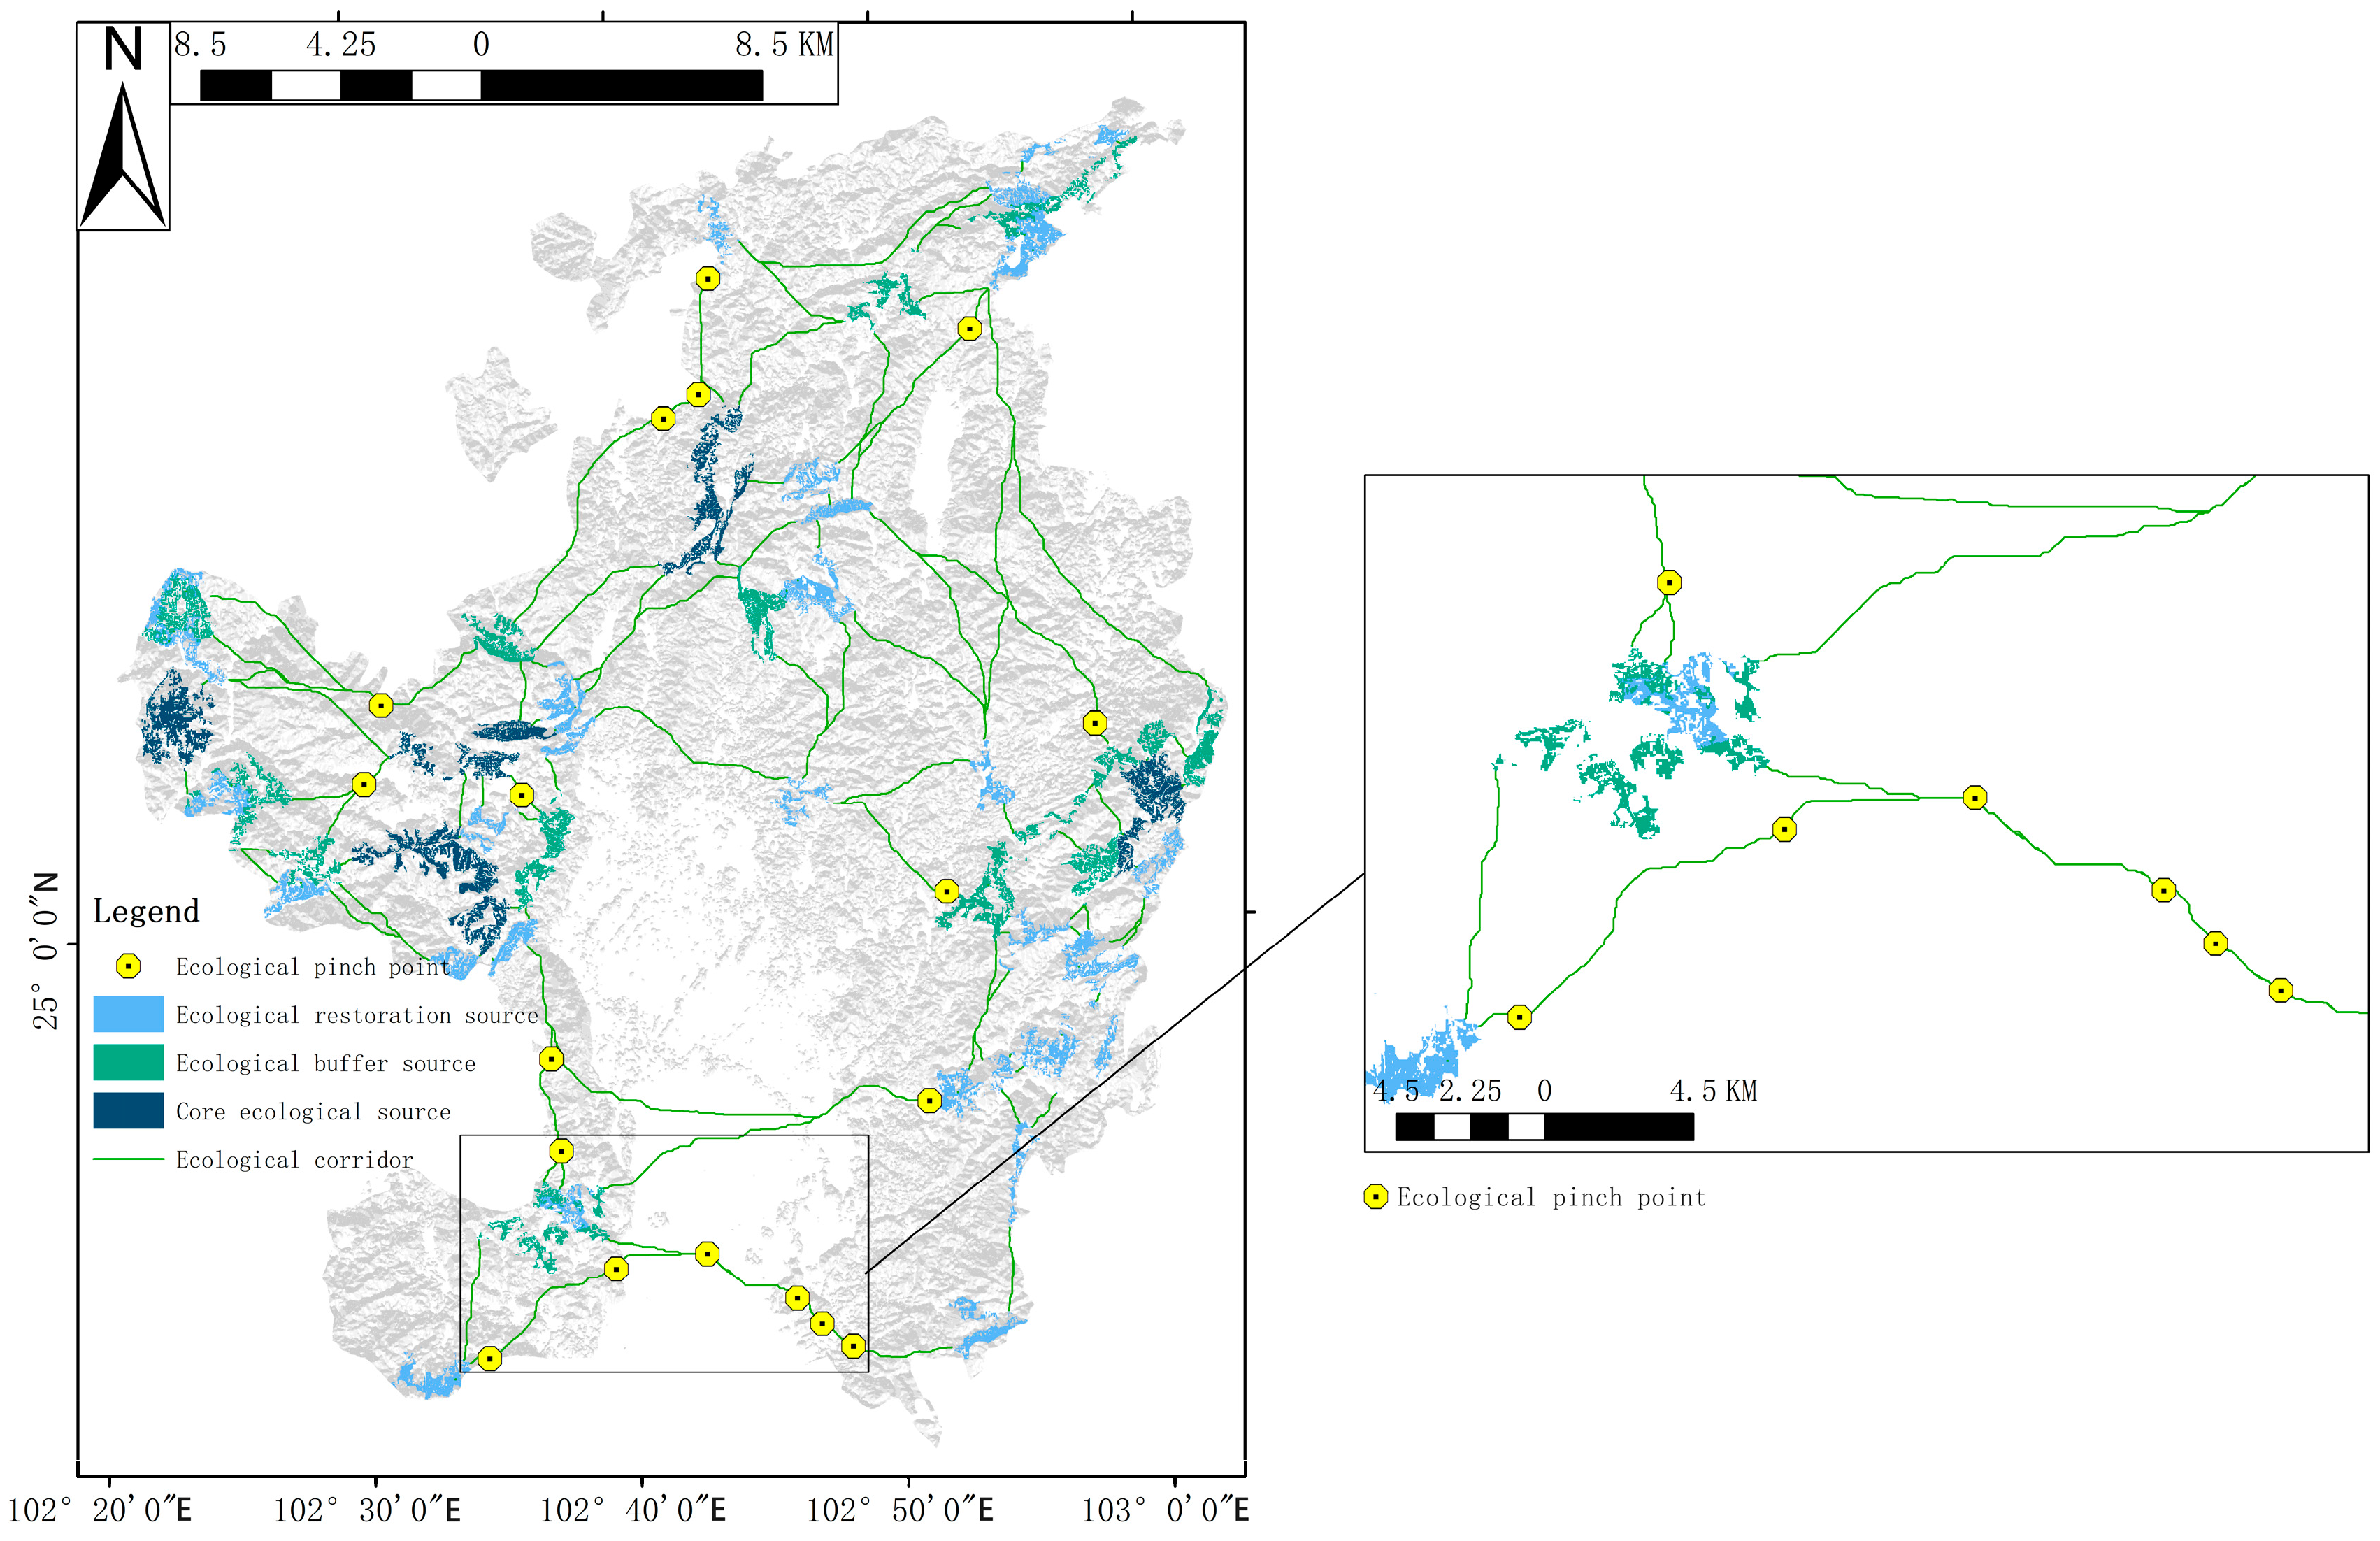
2.7.3. Modeling Ecological Pinch Point Degradation

The pinch points with high current density in the ecological corridors represent pivotal nodes for maintaining landscape connectivity. These areas are also characterized as fragile regions within the ecological network, exhibiting heightened susceptibility to ecological degradation. Consequently, their protection assumes paramount importance in ensuring the functional integrity of the corridors. This study developed an ecological network degradation model under the condition of no pinch-point protection using the scenario simulation method. It quantitatively assessed the ecological benefits of pinch-point protection in enhancing the quality of corridors and strengthening weak links. Based on the ArcGIS platform, the Linkage Mapper module was utilized to analyze the raster layer of pinch points spatially, and the natural breakpoint method was employed to identify the top 20% of pinch points with the highest current density values as priority protection areas [56].

3. Results

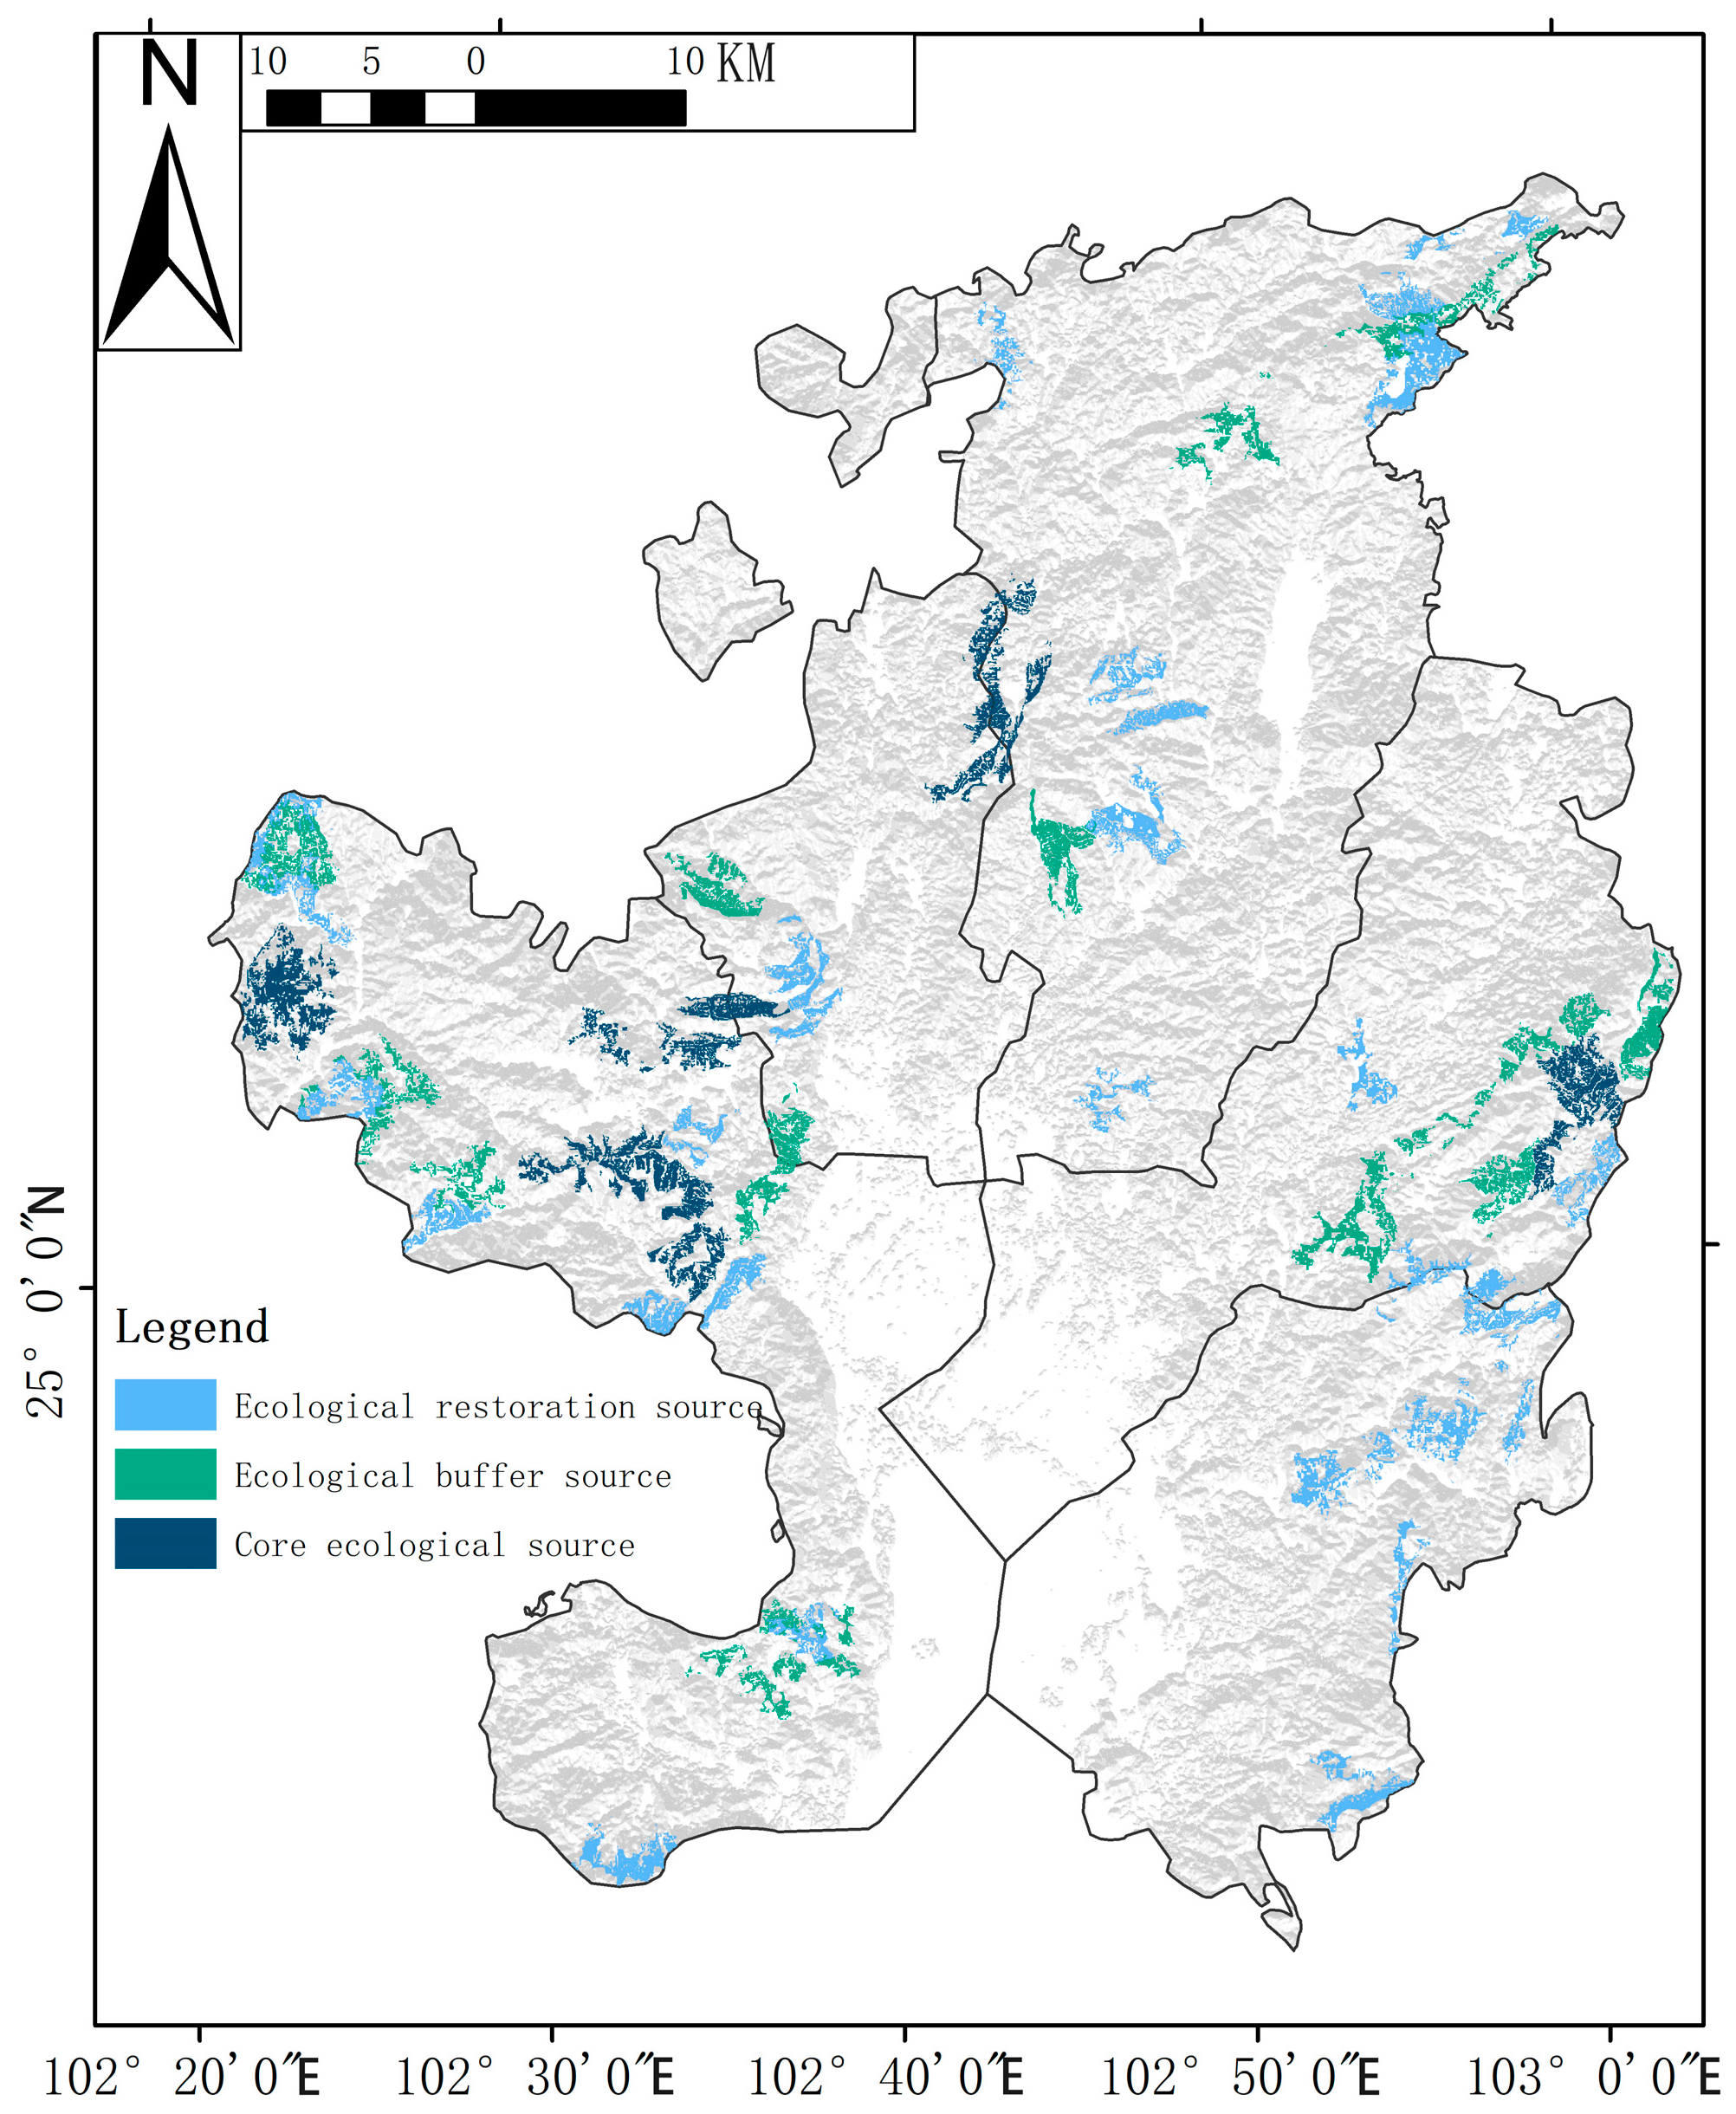
3.1. Bird Species and Ecological Source Identification

Monitoring data (Table 1 and Table 2) revealed a pronounced spatial aggregation pattern of avian populations in Kunming’s urban green spaces, with the highest densities observed in residential areas, a distribution primarily constrained by the availability of food resources. To enhance urban biodiversity, composite ecological sources were proposed for establishment, integrating woodlands, grasslands, and wetlands to support avian communities with diverse environmental traits. The avian assemblage was systematically classified into (1) resident (64.72%) and migratory (35.28%) species based on migratory behavior; (2) woodland-dependent (39.87%), wetland-associated (37.63%), and open-landscape (22.50%) species according to habitat preference; and (3) low- (<1 km, 47.29%), medium- (1–5 km, 9.19%), and high-mobility (>5 km, 43.52%) groups based on dispersal capacity. Notably, the designed ecological corridor system demonstrated distinct service targets: it primarily supported resident species (64.72%) in terms of migratory behavior, woodland-dependent birds (39.87%) in terms of habitat preference, and low-mobility avian groups (<1 km, 47.29%) in terms of dispersal capacity. This targeted design reflected an optimal adaptation between corridor construction and local avian community characteristics.
The assessment results based on the InVEST model demonstrated that the integrated ecosystem services (comprising habitat quality, soil conservation, carbon sequestration, and water supply) in the primary urban area of Kunming City exhibited marked spatial gradient characteristics, with the collective service function increasing from southwest to northeast. The categorization of importance levels employed the natural breakpoint method, which divided importance levels into five categories: mild, moderate, high, and extreme. The moderately important (26.82%), highly important (22.43%), and extremely important (14.31%) areas accounted for 63.56% of the total area of the main urban area. The most concentrated areas were located in the Panlong District, accounting for 50% of the extremely important areas. In contrast, the areas of primary importance were mainly distributed in the southeastern part of the Xishan District, the western part of the Chenggong District, and the northern section of the Dianchi Pond in the southwestern part of the Guandu District. The areas classified as highly important and extremely important exhibited a high degree of concurrence with the spatial distribution of national nature reserves. This finding suggested that the ecosystem service function of the primary urban area of Kunming City was overall excellent and exhibited a substantial spatial correlation with the system of nature reserves (Figure 8).
The GIS-based ecological sensitivity assessment was a scientific approach that, through the use of geographic information technology, comprehensively analyzed the impacts of four significant factors: geology, climate, natural resources, and human activities, on the ecological environment. In the study of Kunming City, the natural breakpoint method was employed to classify the assessment results into five levels: general, low, moderate, high, and extremely high. The overall performance of the distribution pattern strengthened from the central urban area towards the periphery. The results demonstrated that the ecological sensitivity exhibited a distribution characteristic of increasing from the central urban area to the periphery. Notably, the highly sensitive areas coincided significantly with geological fault zones. Moreover, due to the superimposition of urban development and ecological fragility, the west bank of Dianchi Lake became an extremely sensitive area. This study provided accurate spatial decision-making support for urban environmental conservation. The combined percentage of moderately sensitive (21.07%), highly sensitive (29.90%), and extremely sensitive (31.20%) areas totaled 82.16%, forming the primary framework of ecological sensitivity in the study area.
Concerning spatial distribution, extremely sensitive areas were widely distributed in the main urban area, with Panlong District, Wuhua District, and Xishan District accounting for particularly significant proportions. In contrast, generally sensitive areas were concentrated in the central urban area, whereas highly and extremely sensitive areas were located in the periphery. The results indicated that a considerable spatial gradient characterized the ecological sensitivity of the primary urban zone of Kunming City, and its distribution pattern demonstrated a clear correspondence with the spatial expansion pattern of the city (Figure 9).
The morphological spatial pattern analysis (MSPA) method was utilized in the present study to quantitatively assess the land use types in the primary urban area of Kunming City in 2020. This study incorporated three types of ecological land, namely forest land, grassland, and watershed, as the foreground elements, with the remaining land use types designated as the background. The analysis yielded results indicating that the core ecological patches within the main urban area encompassed an area of 1273.03 km2, constituting 39.72% of the total study area of 3205 km2.
To accurately identify the most important ecological source areas, this study employed a multi-criteria overlapping analysis method. Firstly, the most significant levels of zoning were identified based on an evaluation of ecosystem service importance and ecological sensitivity. Secondly, a spatial overlay analysis was performed with the core area obtained from MSPA, and the most optimal ecological source distribution was obtained through intersection processing (Figure 10). The results of the landscape connectivity analysis, conducted using Conefor software, revealed that a total of 52 ecological source sites (covering an area of 200.95 km2) were identified in the study area, forming a remarkable three-level structural system. Of these, 5 Level 1 ecological core source sites (50.96 km2, 1.59%) were concentrated in ecologically critical nodes, 14 Level 2 ecological buffer source sites (62.82 km2, 1.96%) were mainly located in ecological transition zones, and 33 Level 3 ecological restoration source sites (87.18 km2, 2.72%) were widely distributed in ecologically marginal areas. The gradient distribution pattern of the ecosystem in the study area not only revealed its spatial heterogeneity but also provided quantitative support for optimizing the regional ecological security pattern by constructing a three-level ecological protection network, characterized by a “core–transition–edge” structure.

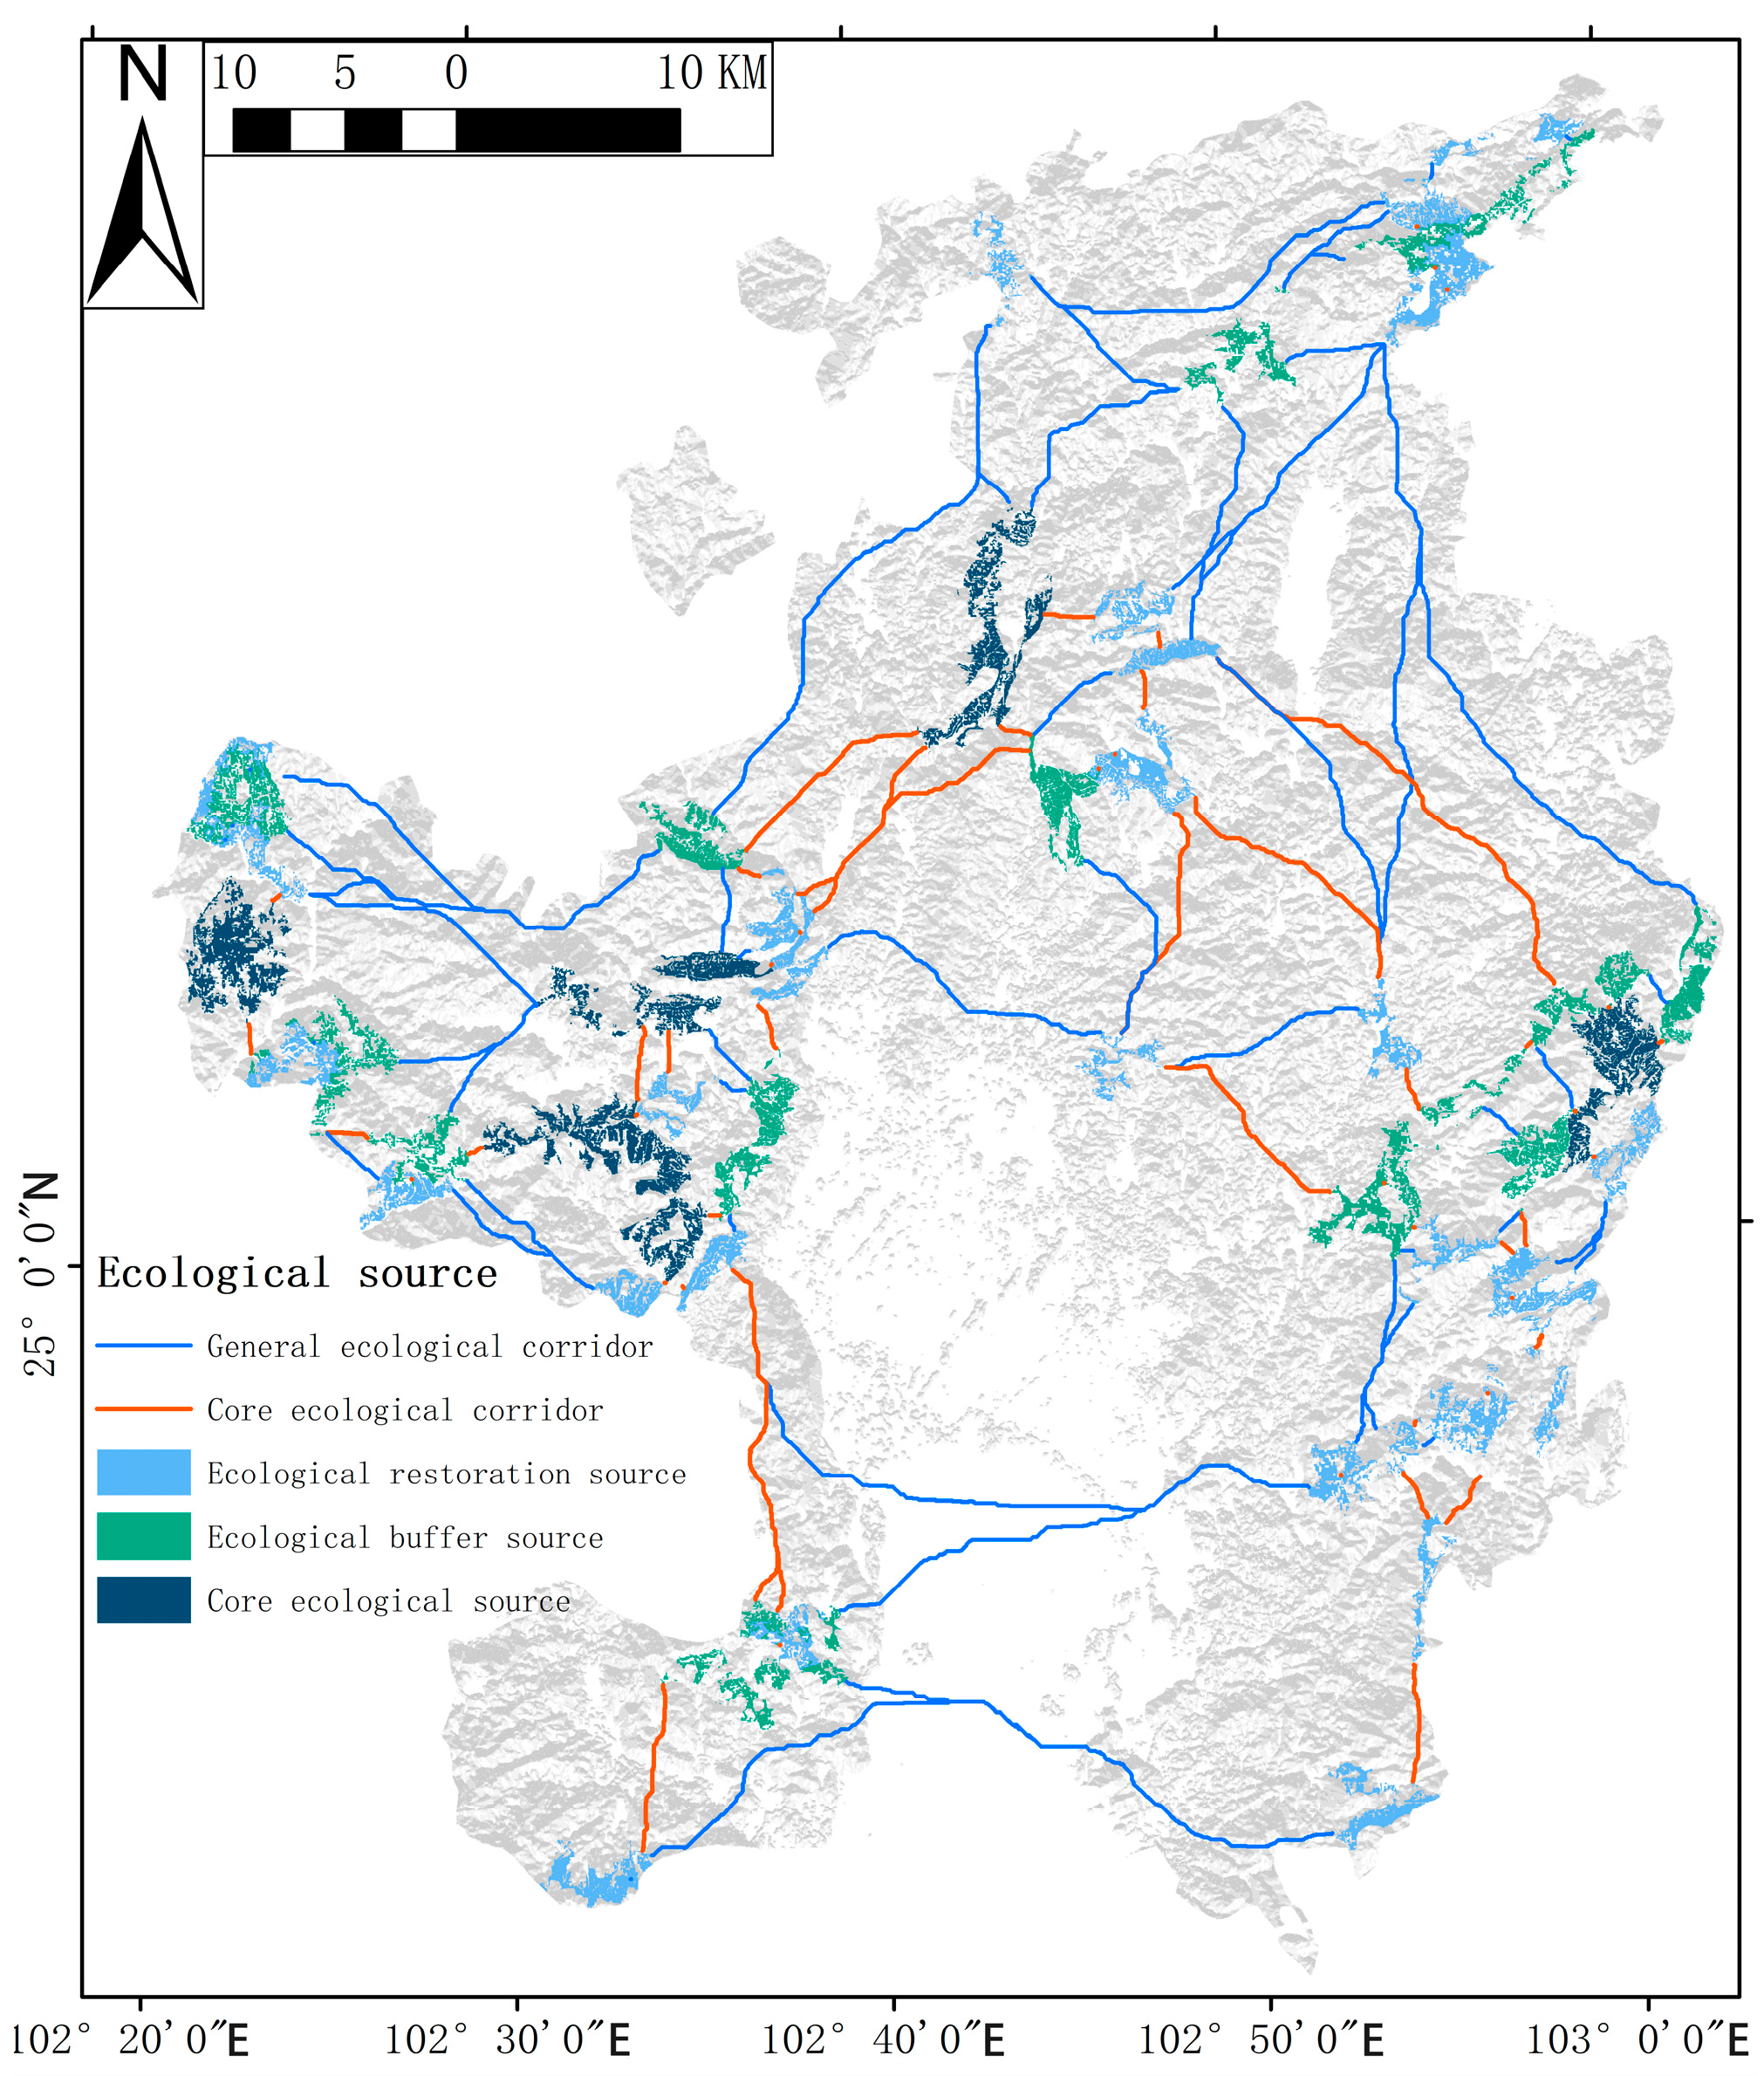
3.2. Identification of Integrated Resistance Surfaces and Ecological Corridors

This study’s methodology involved the selection of seven key resistance factors, namely, slope, vegetation cover (NDVI), water body index (NDWI), land use type, road distance, building height, and population density, and the construction of a comprehensive resistance surface model by hierarchically assigning values (Table 4). The principles for assigning values to each factor were as follows: (1) slope was positively correlated with resistance value; (2) vegetation cover (NDVI) and the water body index (NDWI) were negatively correlated with resistance value; (3) the highest resistance value was assigned to residential land in the land use type; and (4) distance from the road, building height, and population density were positively correlated with resistance value (Figure 7). The spatial analysis demonstrated that the integrated resistivity surface exhibited clear spatial differentiation. The high-resistance area was found to be concentrated in the central city of Kunming (Wuhua, Panlong, Guandu, Xishan, and Chenggong), which was characterized by a high-density built environment (high proportion of residential land, dense road network, high building heights, and dense population), thus serving as a significant barrier to bird activities. In contrast, the low-resistance area was primarily located in the peripheral ecological reserves (e.g., Xishan Nature Reserve), where the resistance value exhibited a decreasing gradient as the distance from the built-up area increased (Figure 7). The spatial pattern of the resistance surface exhibited a high degree of consistency with the gradient of urban expansion, manifesting a decreasing distribution pattern from the central city, the core, to the periphery in a radial fashion.
A total of 109 ecological corridors were identified within the designated study area, and an ecological connectivity network with a total length of 720.88 km was constructed using spatial network modeling analysis of the Linkage Pathways Build Network and Map Linkages tool (Figure 11). The length of individual corridors exhibited significant heterogeneity, with the longest measuring 37.36 km, the shortest 0.03 km, and the average 6.61 km. The avian community analysis of ecological corridors in Kunming’s urban core revealed that resident birds significantly outnumbered migratory birds. Resident birds relied on these corridors for foraging, nesting, and shelter, while migratory birds utilized them as transit routes and stopover sites. Additionally, the corridors provided diverse habitats and movement support for birds with different habitat preferences (forest-dwelling, wetland-dependent, open-habitat) and migratory capacities (high, medium, low). Specifically, the corridors primarily benefited resident birds, forest-dwelling species, and low-migratory-capacity birds by connecting fragmented forest habitats for foraging and breeding and enhancing habitat connectivity to facilitate resource access within their limited ranges. The Linkage Priority tool was used to calculate the network centrality index, and the corridor system was divided into two levels of structure using the quartile reclassification method. The 54 core corridors, with a total length of 183.58 km (accounting for 25.47%), exhibited high topological centrality and played a key role in maintaining the connectivity of the ecological network. The general corridors, comprising 55 corridors with a total length of 537.30 km, accounted for 74.53% of the network’s basic support framework. The 55 general corridors, which collectively spanned a total length of 537.30 km (accounting for 74.53% of the total network), served as the fundamental support framework.
Following a comprehensive analysis, it was determined that an optimal ecological corridor width threshold of 8 km would effectively meet the ecological activity needs of bird species. This conclusion was drawn from an analysis of the calculation results of the 1–8 km weighted distance thresholds of the Linkage Pinch Mapper tool. A total of 18 key ecological pinch points (exceeding 0.1 km2) were identified through area screening, covering a combined area of 5.63 km2. These were mainly distributed in the southern part of the main urban area, with the largest patch located at the junction of the northern part of Wuhua District and the western part of Panlong District. These pinch points were characterized by low-resistance land use types, such as forests, grasslands, and watersheds, which exhibited significant bird habitat suitability (Figure 12). Conversely, 262 smaller pinch points (i.e., those with a surface area of less than 0.1 km2) were excluded because they were highly fragmented and located on the urban fringe, where ecological functions remained limited.
Utilizing the Linkage Barrier Mapper tool, the weighted distance thresholds were systematically evaluated through multi-scale analysis with a step size of 50 m, ranging from 100 to 500 m. Following a comprehensive analysis, 250 m was identified as the optimal threshold for identifying ecological barrier points. A total of 27 ecological barrier sites (exceeding 0.1 km2) were identified through area screening, covering a combined area of 89.79 km2. The spatial distribution characteristics of the ecological barriers demonstrated a concentration in the southern part of the metropolitan area (particularly in the southern part of Xishan District and the western part of Chenggong District), in addition to sporadic distribution in the southwestern part of Panlong District, the southeastern part of Wuhua District, and the southwestern part of Guandu District. The largest barriers were found in the southeastern part of Xishan District and the western part of Chenggong District. The analysis of land use revealed that these ecological barriers were predominantly characterized by high-resistance types, including watersheds, croplands, and residential areas, which posed a substantial threat to the ecological activities of bird species (Figure 13).
This study identified ecological pinch points and barriers, each exerting distinct influences on resident birds, forest-dwelling species, and birds with low migratory capacity. Specifically, the environmental pinch points, predominantly located in the southern part of the urban core, facilitated the connectivity of fragmented habitats. These pinch points provided essential foraging, breeding, and sheltering sites for resident and forest-dwelling birds, while enhancing habitat connectivity to support low-migratory-capacity birds in accessing resources within their restricted ranges. In contrast, ecological barriers, mainly concentrated in the southern metropolitan area and its surroundings and characterized by high-resistance land use types, restricted birds’ movement and posed significant threats to their ecological activities.

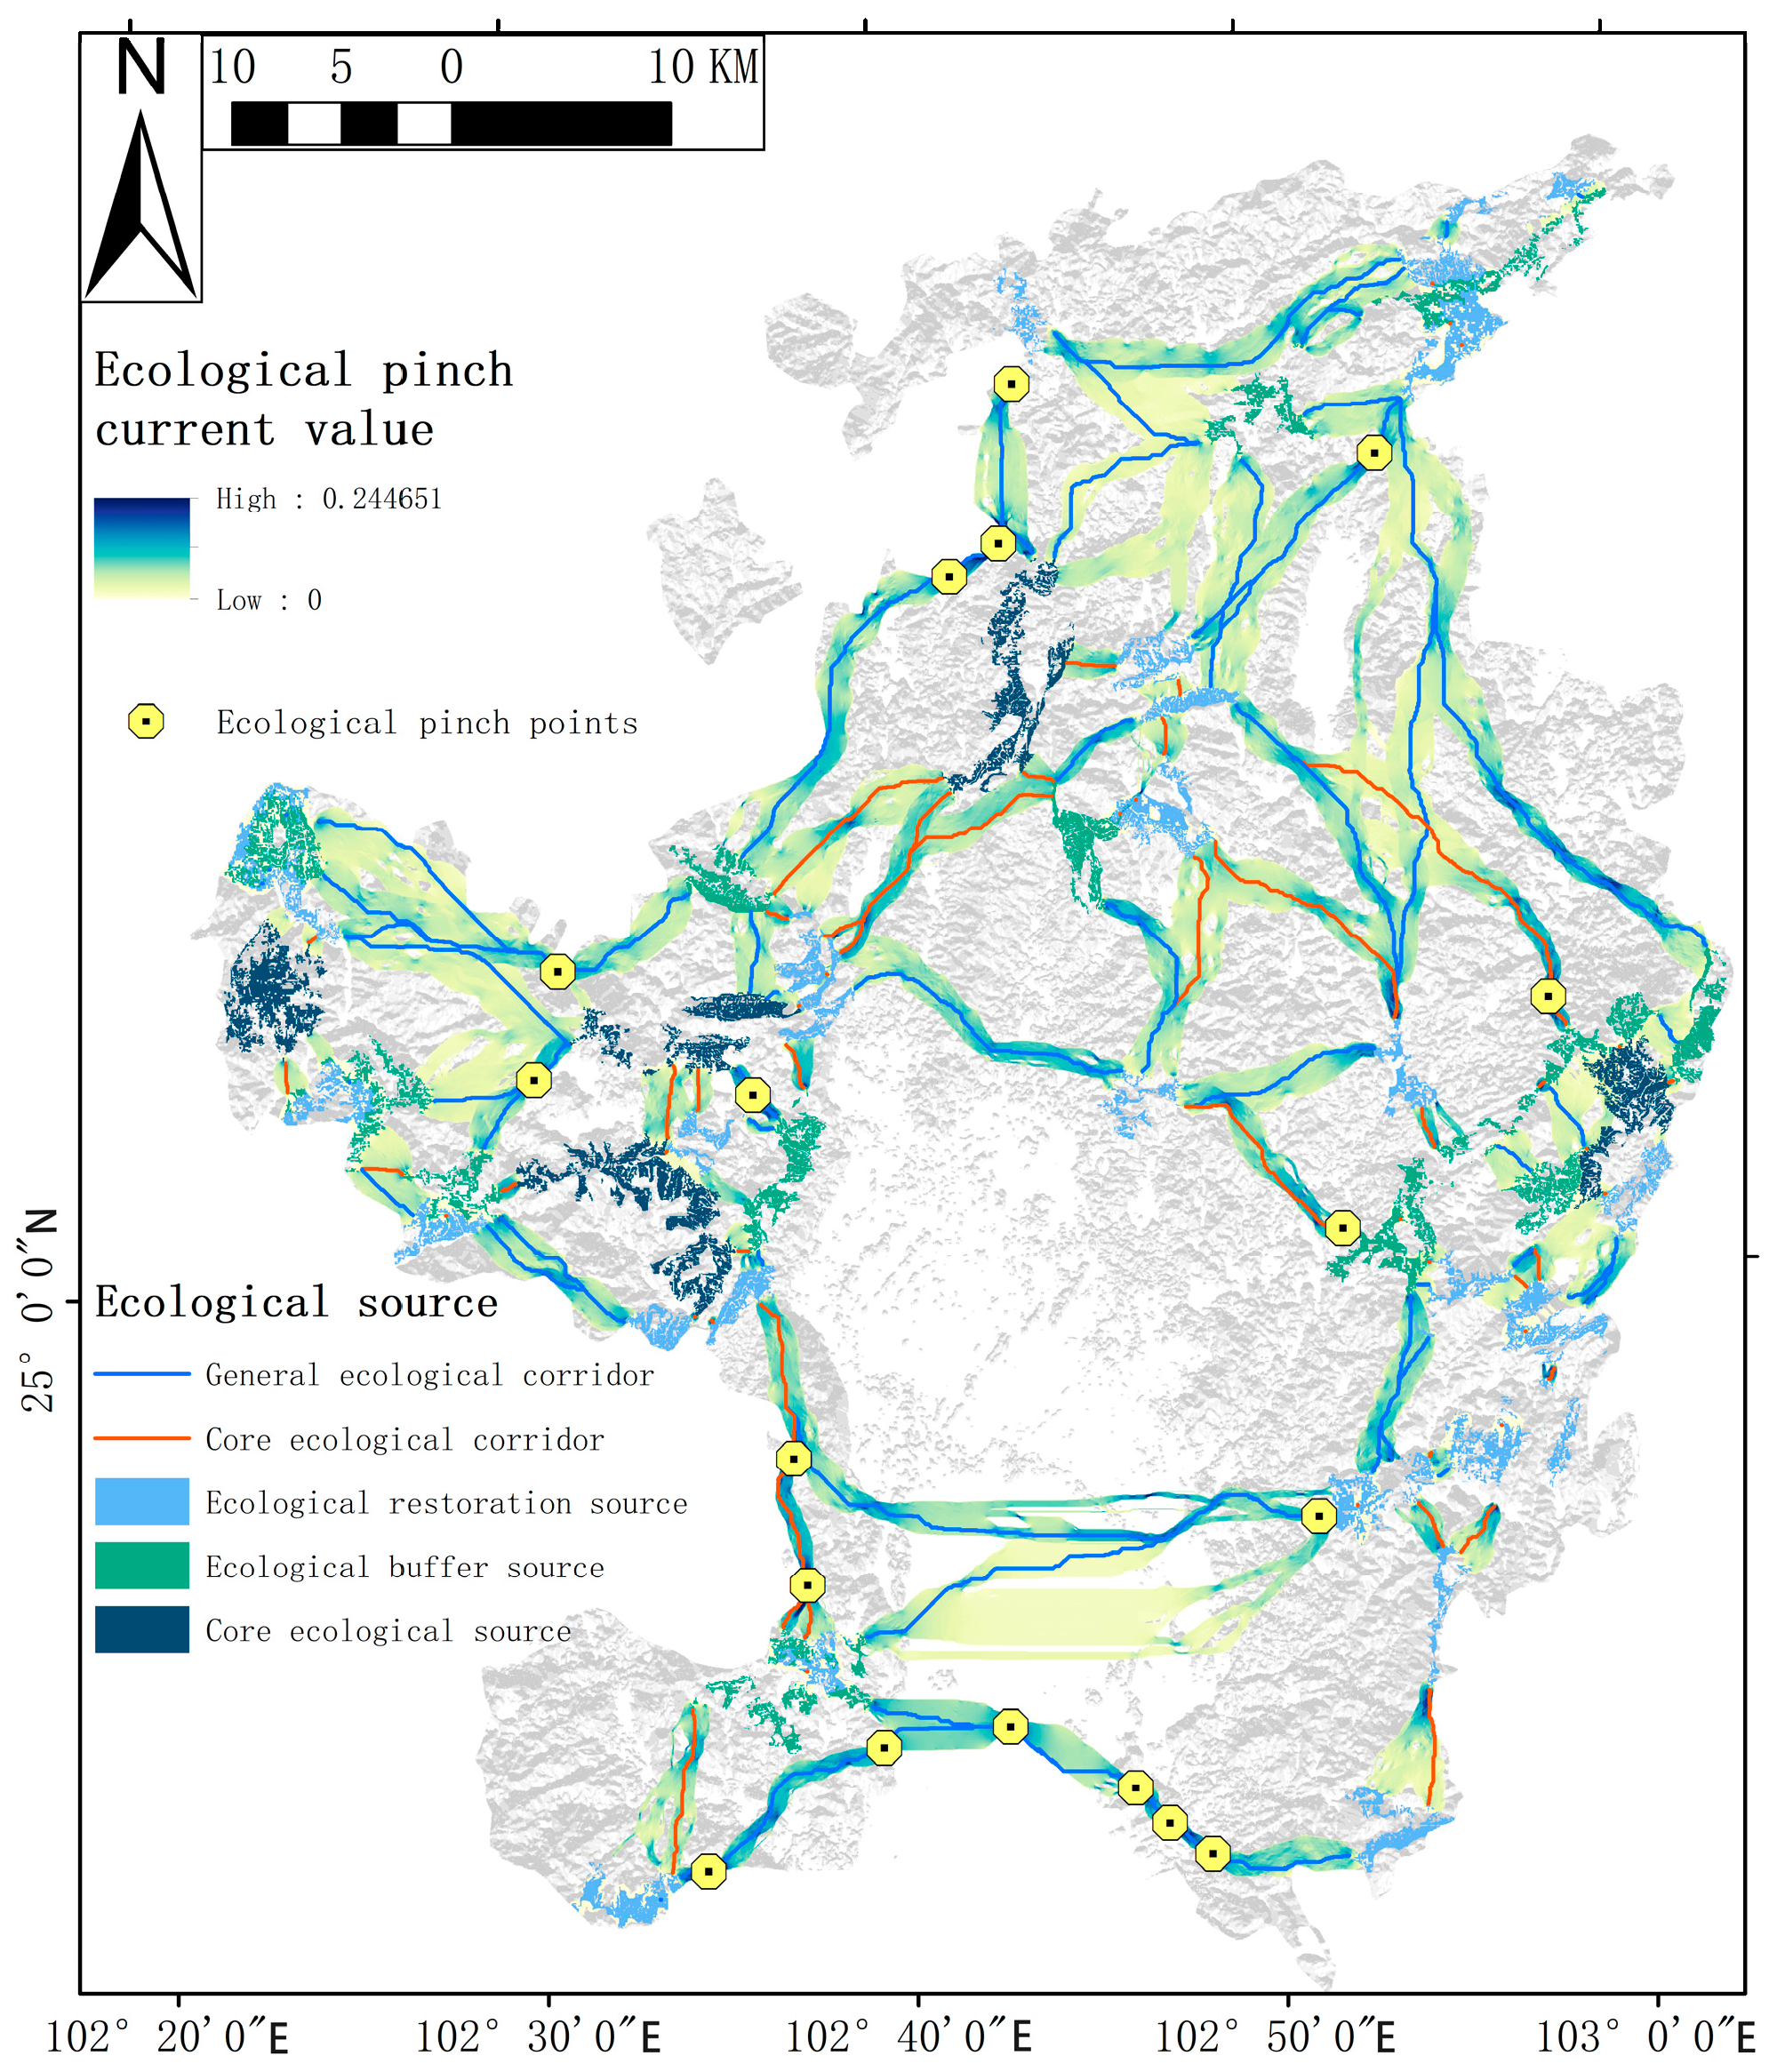
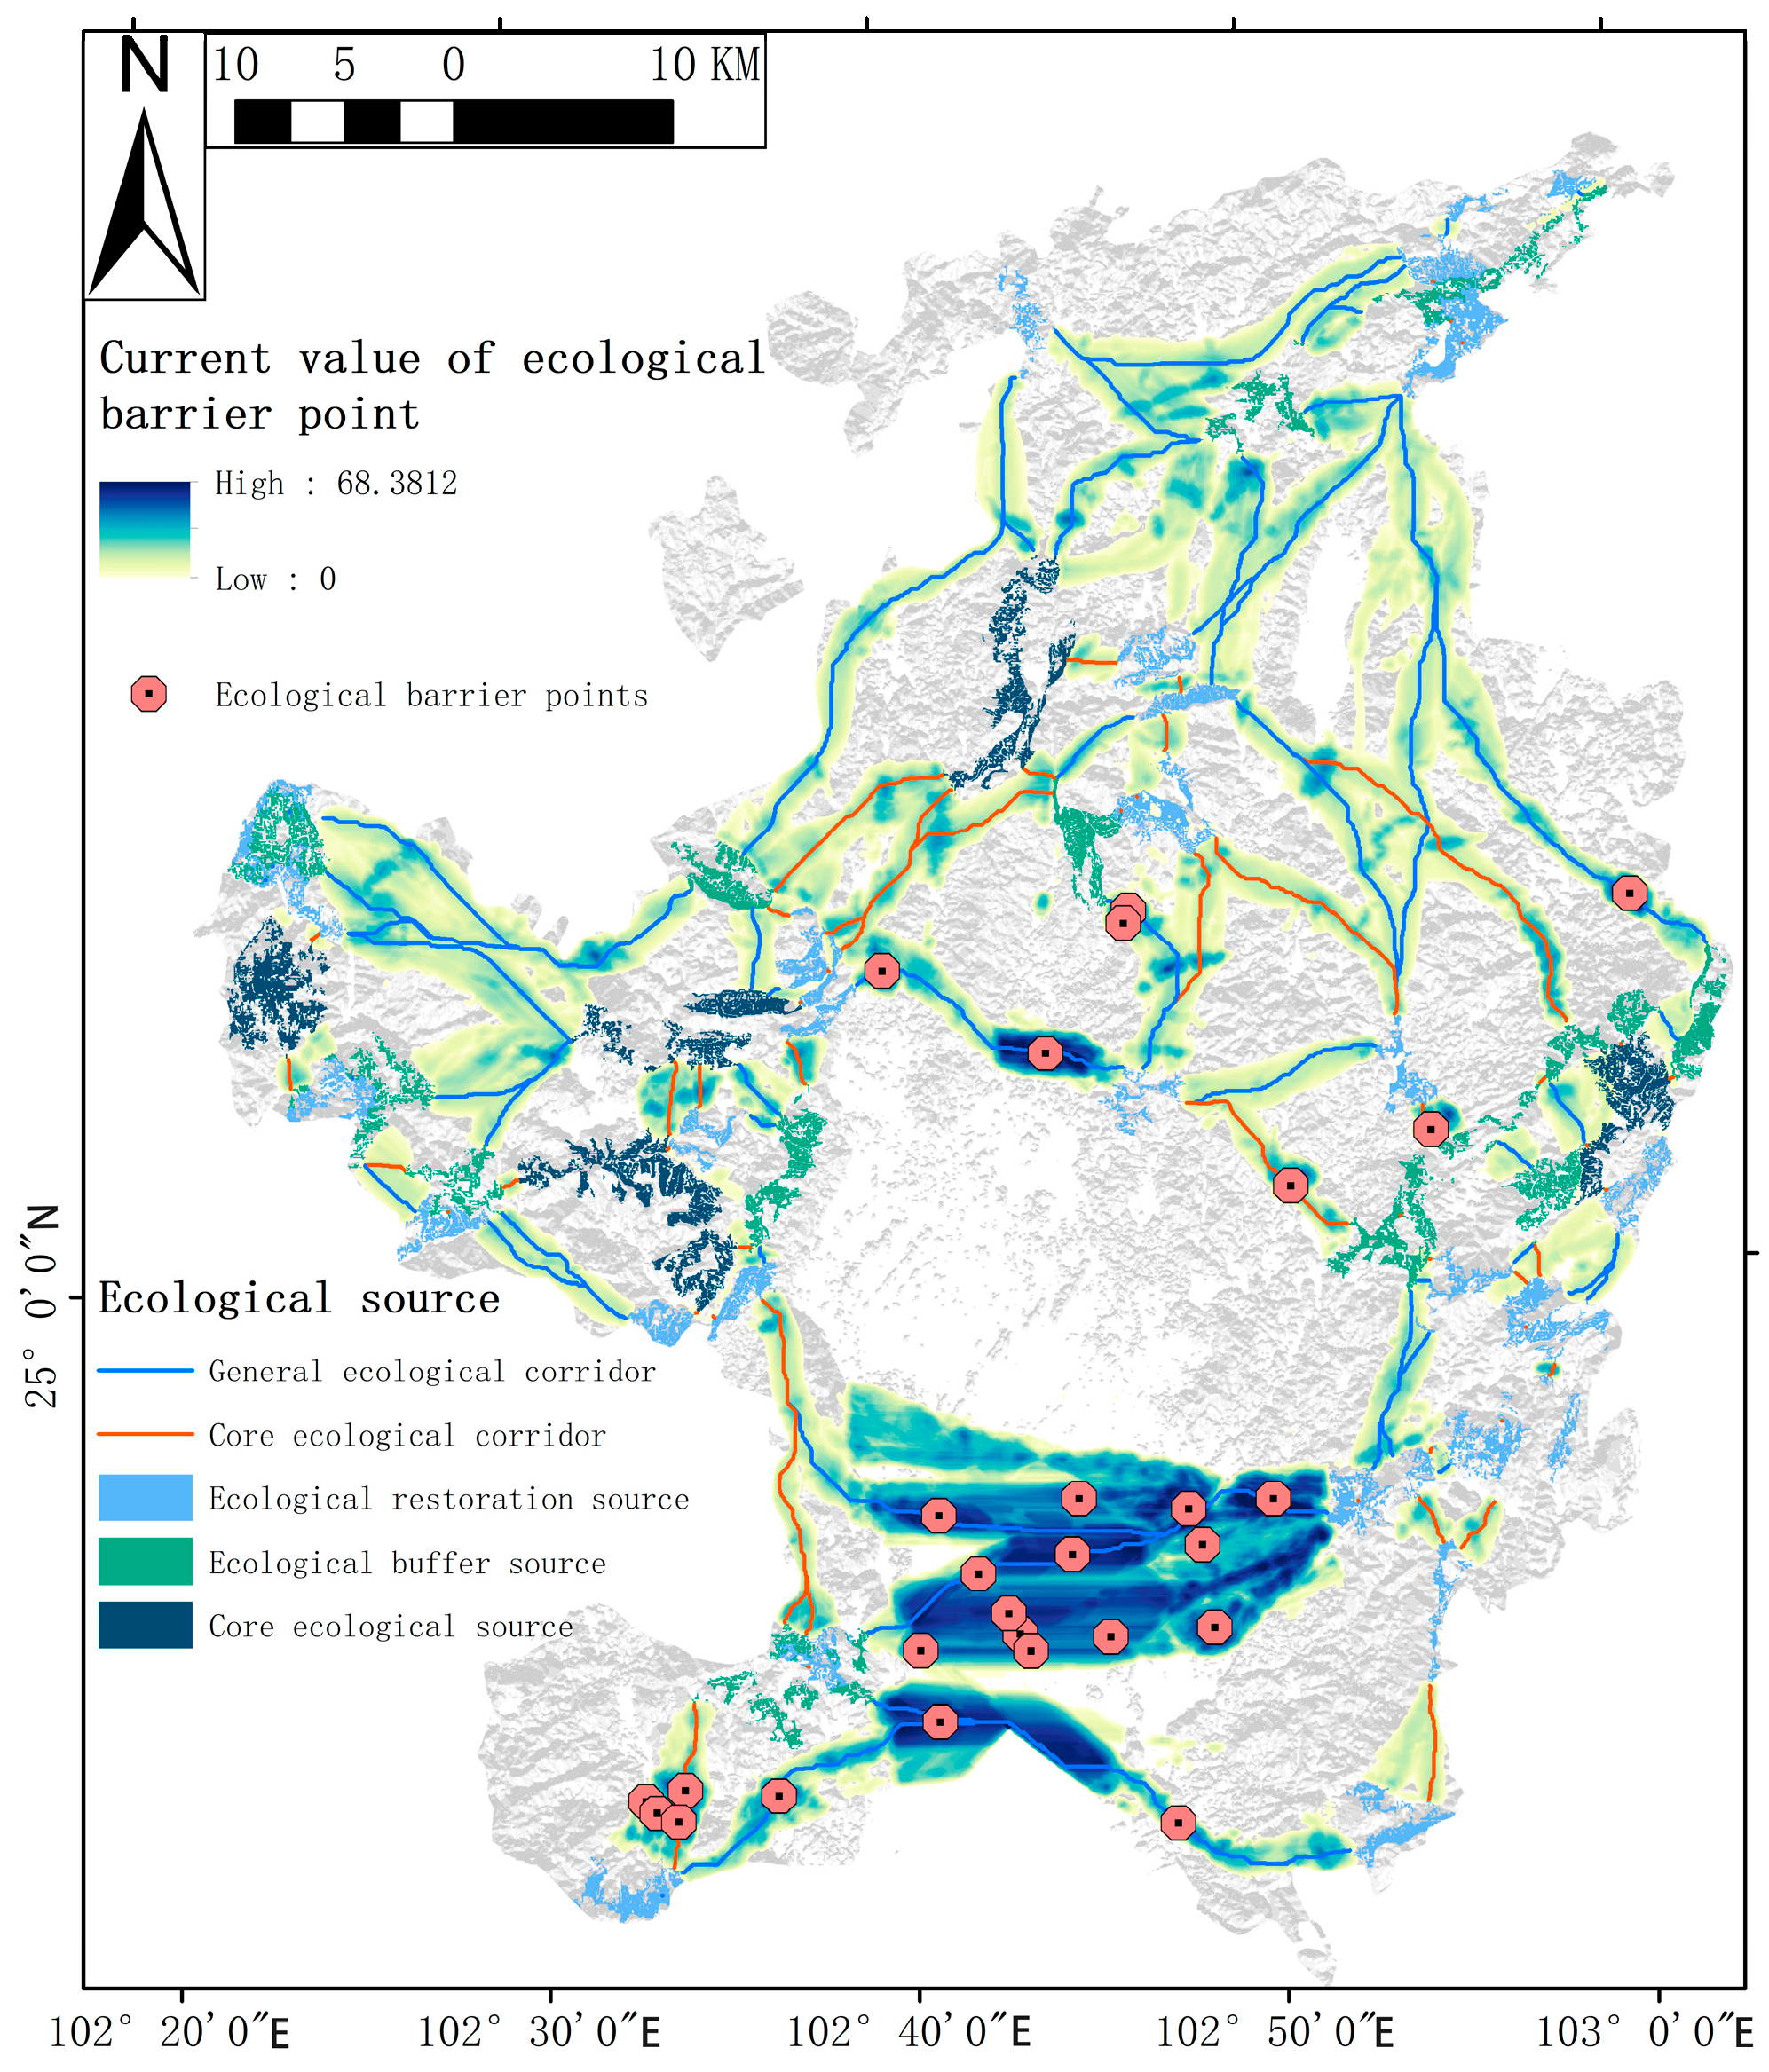
3.3. Ecological Corridor Networks for Multi-Scenario Modeling

To optimize the nodal configuration of the composite ecological corridors and better accommodate the environmental needs of birds, particularly those characterized by resident migratory behavior, forest-dwelling habitat preferences, and low migratory capacity, this study designed and implemented three scenarios: adding ecological stepping stones, improving ecological barriers, and simulating the degradation of ecological pinch points. Three scenarios were designed and implemented in this study: adding ecological stepping stones, improving ecological barrier points, and simulating the degradation of environmental pinch points.
In Scenario 1 (Figure 14), the addition of ecological stepping stones resulted in a significant enhancement of connectivity between ecological corridors. This development led to the establishment of numerous new short-distance ecological corridors. This measure resulted in a 25% increase in potential ecological sources, leading to a reduction in electrical resistance within the area and creating more favorable conditions for the survival of bird species. Concurrently, there was an overall increase in the number of ecological corridors modeled for bird species, as well as an increase in the ecological network connectivity index.
In Scenario 2 (Figure 15), the optimization of ecological corridors was achieved by enhancing ecological barrier points. Specific measures encompassed anthropogenic enhancements to ecological barrier sites to enhance landscape connectivity, the restoration of ecological corridors, and the reduction in the resistance value of bird species to ecological activities. This study recommended improvements to the six ecological barrier sites indicated in the box on the map, with four located in the general corridor and two in the core corridor. The predominant land use types in the area encompassed by these barriers were residential and cropland, which exerted the most significant influence on the ecological activity resistance values of bird species.
In Scenario 3 (Figure 16), a simulation was used to highlight the importance of safeguarding ecological pinch points, illustrating the degradation process that occurred. The simulation results demonstrated that degradation of ecological pinch points resulted in an increase in resistance values, compelling birds to detour during their migrations. This, in turn, increased the distance of ecological corridors and decreased the ecological network connectivity index.

4. Discussion

4.1. Ecological Source Area Identification Based on a Combination of Factors

As a key hub of the East Asia–Australia migratory bird corridor and a global biodiversity hotspot, Kunming City accounts for 70% of China’s total bird diversity. However, rapid urbanization has led to a 70% shrinkage of the Dianchi wetland area and severe habitat fragmentation, posing a significant threat to many endangered bird species. Kunming City is also home to numerous rare and endangered species. The impact on these birds varies under different classification criteria. To more precisely focus the research content, the primary target species of this study are resident birds categorized by migratory behavior, forest-dwelling birds categorized by habitat preference, and low-migratory-capacity birds categorized by migratory capacity (Table 2). Accordingly, this study employs a multi-model coupling approach to construct an ecological corridor network, which effectively connects key habitats, mitigates migration barriers, reduces the risk of bird strikes, and enhances regional climate resilience. Firstly, the ecosystem service value of the study area is quantified using InVEST software (3.14.2) and GIS technology and classified into five levels using the natural discontinuity method. Secondly, the ecological sensitivity assessment is conducted using the GIS platform and classified into five levels. The core ecological area is then identified using the morphological spatial pattern analysis (MSPA) method, with the top two levels of ecosystem services (highly and extremely important) used as the prospective data. The identification of core ecological areas is achieved. The final identification of the ecological source area is achieved by integrating three types of key indicators: the first three levels of ecological services (moderate, high, and extreme), the first three levels of ecological sensitivity (moderate, high, and extreme), and the core area obtained from the MSPA. Compared to single methods used in previous studies, such as extracting source sites based only on land use coupled with MSPA [57], directly selecting areas of high habitat quality as source sites [58], coupling habitat quality with MSPA to determine source sites, or classifying source sites based only on ecological sensitivity and ecosystem services [59,60], the integration of three distinct models—ecosystem services, ecological sensitivity, and MSPA spatial behavioral analysis—leads to substantial advancements in the precision and scientific rigor of ecological source identification. This, in turn, furnishes a more robust foundation for the formulation of spatial plans aimed at conserving biodiversity.
The results of the landscape connectivity analysis identify a total of 52 ecological source sites (with a total area of 200.95 km2) in the study area, which exhibit a significant three-level hierarchical structure: five core ecological source sites (level 1 source sites, with an area share of 1.59%), 14 ecological buffer source sites (level 2 source sites, with an area share of 1.96%), and 33 ecological restoration source sites (level 3 source sites, with an area share of 2.72%). Collectively, these elements constitute a hierarchical ecological protection network (Figure 10). The spatial distribution characteristics demonstrate that the core ecological source areas are concentrated in the following areas: the junction between the western part of Panlong District and the northeastern part of Wuhua District in the metropolitan area; the junction zone between the southwestern part of Wuhua District and the western part of Xishan District; and the eastern part of Xishan District and the eastern part of Guandu District. The buffer ecological source areas are primarily located in the northern and southwestern parts of Panlong District, the western part of Wuhua District, the northwestern part of Xishan District, the southern part of the border area with Wuhua District, and the eastern part of Guandu District. The restored ecological source sites are widely distributed in the outskirts of various urban areas, including the northwestern, northeastern, and southern parts of Panlong District; the southwestern part of Wuhua District; the eastern and southeastern parts of Xishan District; the eastern part of Guandu District; and the northeastern and southeastern parts of Chenggong District. In Chenggong District, the presence of restoration ecological source sites is notable. Yet, the absence of high-level ecological source sites can be primarily attributed to the multidimensional coercive effects of strong urbanization on bird habitats. Between 2015 and 2022, the area of wetlands around Dianchi decreased by 23% (corresponding to a 0.38 increase in the landscape fragmentation index) [9], while the intensity of nighttime light pollution increased by 14% per year. The farmland–wetland interspersed zone decreased by 37% [61], which synergistically led to a significant decrease in habitat suitability.
In terms of the size of the source sites, the largest area of core ecological source sites (14.35 km2) is located in the eastern part of Xishan District, and the largest area of ecological buffer source sites (6.05 km2) is distributed in the southeastern part of Xishan District. The largest area of ecological restoration source sites (3.96 km2) is located in the southeastern part of Chenggong District. A subsequent land use analysis demonstrates that all ecological source sites are dominated by forested land (97% of the total), supplemented by grassland (3%). In terms of spatial distribution, Xishan District has the largest number of ecological sources (18, 34.62%), followed by Panlong District (13, 25%), Guandu District (9, 17.31%), and Chenggong District (8, 15.38%), and Wuhua District has the fewest (4, 7.69%). The ecological advantages of Xishan District are outstanding. The district is observed to exhibit a “three-dimensional synergy effect.” In terms of spatial structure, two independent core sites and one interadministrative core site (Wuhua District Junction) are established. This configuration results in the establishment of a comprehensive “mountain–city–water” ecological continuum [61]. Specifically, the hydrological dimension preserves the largest natural lakeshore zone of Dianchi, the environment maintains the lowest level of light pollution in the city, and the space achieves optimal connectivity. This three-dimensional synergy supports significant biodiversity, with 85% of Xishan Forest Park’s native vegetation forming a vertical gradient habitat with the Caohai Wetland Complex, making it the core area of Kunming’s bird diversity (238 species, or 63% of the city’s population) and providing a stable system of key habitats for bird communities.

4.2. Identification of Ecological Corridors Based on a Combination of Factors

4.2.1. Ecological Corridor Identification

The study of bird ecological corridors in the primary urban area of Kunming City is of considerable ecological and practical significance. As a key biodiversity conservation measure, ecological corridors can effectively maintain habitat connectivity for urban bird populations and provide necessary ecological corridors for migratory species [62]. Research has demonstrated that the implementation of ecological corridors, meticulously designed according to scientific principles, cannot only mitigate the consequences of habitat fragmentation resulting from urbanization but also substantially enhance the ecological services provided by urban green space systems [7]. A total of 109 ecological corridors were identified in the study area. A construction project for an ecological network system was undertaken, spanning a total length of 720.88 km (Figure 11). The length of the corridors exhibited considerable spatial heterogeneity, ranging from 0.03 to 37.36 km, with an average of 6.61 km. The centrality-based analysis demonstrated that the network was characterized by a clear hierarchical structure: The network was supported by 54 core corridors (a total length of 183.58 km, accounting for 25.47%), which formed its skeletal structure, and 55 general corridors (a total length of 537.30 km, accounting for 74.53%), which provided the basic support functions. A paucity of core corridors was evident in the network structural analysis. Concerning spatial resistance effects, core corridors were found to exhibit lower landscape resistance due to shorter distances. They were thus more conducive to facilitating the migration of bird species and ecological processes. In contrast, longer distances of general corridors were shown to lead to increased landscape resistance and relatively limited support for bird ecological functions.
The spatial analysis of the distribution pattern reveals that the core corridor exhibits a ring-like distribution characteristic in the center of the capital city, particularly concentrated in the south of Panlong District, the central part of Wuhua District, the northwestern and northeastern parts of Xishan District, the western and southern parts of Guandu District, and the eastern part of Chenggong District, with the central part of Wuhua District and the southern part of Panlong District forming a dense area. In contrast, common corridors are extensively distributed throughout the peripheral ring areas of the five major urban areas. However, these corridors create empty spaces in the center of the urban interface. The densest concentrations of these corridors are primarily situated in the northwestern part of Xishan District and the central part of Panlong District.
In the core corridor system, the Panlong–Guandu inter-district corridor, the longest (23.64 km), serves as a key ecological backbone and is important for maintaining large waterbird migratory corridors and regional ecological connectivity [63]. Micro-corridors, the shortest of which is 0.03 km, are scattered throughout the region and provide important stepping stones for small birds’ habitats [18]. In the general corridor system, the Xishan–Chenggong corridor (37.36 km) is classified as a general corridor. However, its core ecological function is to connect two important habitat patches, namely the Dianchi wetland and the Xishan forest. The spatial distribution of the five fractured corridors is concentrated in Xishan District, with a distance of 0.03 km. The spatial distribution of the five fractured corridors (the shortest being 0.03 km) in the mountainous area is highly consistent with the gradient of urbanization intensity [64,65], intuitively reflecting the habitat fragmentation effect caused by high-intensity human activities. According to the principles of landscape ecology, it is recommended to adopt a three-level optimization strategy [66], establish a mechanism for reassessing corridor functions, focus on implementing the “corridor stitching” project in the northwestern part of the country [67], and improve the management framework of its inter-administrative ecological coordination to enhance the integrity and functionality of the ecological network.

4.2.2. Identifying Ecological Pinch Points and Barriers

A total of 18 key ecological pinch points, defined as areas with a surface area greater than 0.1 km2 and a total area of 5.63 km2, are identified in this study. The spatial distribution of these pinch points reveals significant regional heterogeneity (Figure 12). The pinch points are predominantly concentrated in the southern part of the main urban area, with the largest patch located at the junction of Wuhua District and Panlong District. The land use is dominated by low-resistance types such as forest, grassland, and water, which provide a large bird habitat. Spatial analysis further reveals that Xishan District (7, or 38.89%) and Chenggong District (5, or 27.78%) constitute the core of the regional ecological network, with their pinch-point clusters playing a pivotal role in maintaining ecological connectivity (Figure 13). The pinch points (four in total) located along the core corridor exhibit typical spatial clustering characteristics: two are distributed in the northern and southeastern parts of Xishan District, and two are distributed in the central and northeastern parts of Guandu District. These nodes are of particular significance due to their role as key control points for bird migration along ecological corridors. They thus represent vital elements in the conservation of regional biodiversity. In contrast, pinch points located on general corridors (a total of 14) have weaker ecological functions. However, they are still valuable in enhancing urban ecological resilience by providing secondary habitats, such as those found in five locations in Xishan District and four in Chenggong District within the same corridor clusters.
A total of 27 key ecological obstacle sites (individual site area >0.1 km2, total area 89.79 km2) are identified in this study, and their spatial distribution exhibits significant regional clustering characteristics, primarily concentrated in the southern part of Xishan District and the western part of Chenggong District, and sporadically distributed in the southwestern part of Panlong District, the southeastern part of Wuhua District, and the southwestern part of Guandu District (Figure 13). The most significant obstacle is located at the junction of Xishan District and Chenggong District. High-resistance land use types, including watersheds, cultivated land, and residential land, characterize the topography of the area. These land use types have a substantial impact on bird migration corridors and therefore require priority in terms of ecological restoration. Regarding the configuration of administrative divisions and the distribution of corridors, Xishan District exhibits the highest density of obstacle points, with a total of 11, accounting for 40.74% of the total number of obstacle points. The district features two points along the core corridor and four points along the general corridor. Chenggong District is the second-largest district in this regard, with eight points, accounting for 29.63%. Four of these points are located on the general corridor. The distribution of obstacle points in the southern part of Panlong District (3), the southern part of Wuhua District (1), and Guandu District (4) is relatively decentralized; however, some of them exhibit continuous distribution characteristics along the same corridor. The Xishan and Chenggong Districts are identified as the primary clusters of ecological obstacle sites (accounting for 70.37%), and thus, they should be regarded as the primary focuses for regional ecological corridor restoration.
As is typical of the spatial differentiation of the ecological network in the main urban area of Kunming, Xishan District and Chenggong District present a significant ecological functional dichotomous pattern. The area concentrates 72.2% of the ecological pinch points (seven in Xishan District and five in Chenggong District) and 70.4% of the ecological obstacles (eleven in Xishan District and eight in Chenggong District). This constitutes the ecological protection and development in the urbanization process of the core conflict zone. Spatial analysis indicates that the northern cluster of ecological pinch points is predominantly distributed in the Dianchi Basin, characterized by superior natural substrates. The formation mechanism of this cluster is attributed to the synergistic effect of topographic and geomorphic background characteristics, as well as artificial ecological restoration. Conversely, the southern ecological barrier zone exhibits a notable impact from the gradient of urban expansion, a phenomenon characterized by the spatial superposition of multiple coercive factors, including encroachment of construction land, disruption of agricultural activities, and infrastructural blockage. The polarized pattern of “northern superiority and southern obstruction” [68] highlights the spatially heterogeneous characteristics of ecosystem services in rapidly urbanizing areas, underscoring the urgent need to implement differentiated restoration strategies based on the principles of landscape ecology. On the one hand, the ecological hub function of the northern pinch-point network should be strengthened. On the other hand, it is necessary to focus on breaking through the connectivity bottleneck of the southern obstacle zone. The establishment of a multi-scale ecological corridor system is crucial for achieving comprehensive enhancement of the regional ecological security pattern.

4.2.3. Avian Species-Specific Utilization Patterns in Ecological Corridors

The avian survey data (Table 1 and Table 2) revealed multidimensional classification characteristics in the utilization of ecological corridors. From a migratory behavior perspective, resident species (64.72%) constituted the primary beneficiary group. Habitat preference analysis indicated that forest-dependent birds (39.87%) dominated the assemblage, while mobility capacity assessment showed that low-mobility species (47.29%) represented the most abundant category. These three dominant groups collectively formed the core beneficiaries of ecological corridors and demonstrated significant responses to the spatial configuration of ecological pinch points and barrier zones. Specifically, resident species relied on core corridors to fulfill their stable habitat requirements. Forest-dependent birds exhibited strong spatial congruence with forested corridors, and low-mobility species were predominantly confined to micro-corridor networks (minimum length: 0.03 km). This study identified spatial superposition effects in ecological demands among these groups. For instance, pinch-point areas in the central Panlong District simultaneously met the habitat requirements of all three groups. In contrast, barrier zones in the western Chenggong District negatively impacted them all through vegetation fragmentation.
The findings demonstrated that conservation strategies must integrate multidimensional classification characteristics. In northern pinch-point areas, priority should be given to enhancing forest connectivity and supplementing native tree species to address the combined needs of resident and forest-dependent species. Southern barrier zones required the establishment of stepped vegetation belts to simultaneously mitigate mobility constraints for low-mobility species and habitat fragmentation for forest-dependent birds. This study confirmed that multidimensional classification, based on migratory behavior, habitat preference, and mobility capacity, enables a more comprehensive identification of core beneficiary groups in ecological corridors. The observed superposition effects underscored the necessity of incorporating multidimensional interactions in differentiated landscape management, providing critical insights for achieving systematic urban biodiversity conservation.

4.3. Optimization Strategy Based on Multi-Scenario Simulation

4.3.1. Optimization Strategy Recommendations Under Multi-Scenario Simulation Frameworks

In recent years, Kunming has made substantial progress in enhancing biodiversity within its urban areas through the implementation of systematic conservation initiatives. For instance, the Dianchi Wetland Restoration Project, initiated in 2014, has resulted in the restoration of 2000 hectares of wetlands, leading to the return of species such as the colorful ibis, which had previously been absent from the area. Building on this success, in 2015, the city promulgated the Red-billed Gull Protection Regulations, establishing a precedent for the legislative protection of migratory birds [69]. Between 2016 and 2018, the number of bird species in the urban area increased from 120 to 160. In 2017, critical habitats were designated as ecological red lines, and Operation Clean Net initiated enforcement measures to address illegal bird hunting. By 2023, the wintering population of red-billed gulls had stabilized at 41,000, and the number of white-boned tops and other waterbirds had reached a record high [70]. In 2024, the construction of the Urban Bird Habitat Network was initiated, thereby marking the inception of a new phase in the protection system. Nevertheless, the efficacy of conservation measures has remained deficient in certain regions, where challenges such as habitat fragmentation, water contamination, drone disruption, and illicit trade in painted birds have persisted. The ecological corridors identified in the numerical model have been found to be inadequate in meeting the anticipated conservation objectives [17,71,72], indicating a discrepancy between habitat conservation plans and strategies, which in turn has limited the efficacy of conservation initiatives. To address these issues, this study employs a multi-scenario simulation approach: (1) enhancing habitat connectivity through the addition of ecological stepping stones; (2) mitigating migration resistance by optimizing critical ecological barrier points; and (3) assessing the impact of ecological pinch-point degradation on population stability. The rationale for adopting this methodology lies in its capacity to quantitatively evaluate the potential efficacy of various intervention measures quantitatively, thereby providing a scientific foundation for formulating targeted conservation strategies.
This study employs a multi-scenario simulation approach, drawing on international cases from Singapore and Seattle, which has been specifically adapted to the unique geographical characteristics of Kunming as a subtropical plateau city. The significance of this methodology lies in its advancement beyond existing ecological corridor research in other plateau cities of the Yunnan-Guizhou region, such as Chongqing [73] and Guiyang [74]. While previous studies in these areas have primarily utilized single-method approaches with multiple parameter combinations (e.g., three land use change scenarios or protection-versus-development comparisons), they have failed to systematically integrate multidimensional conservation measures, including habitat connectivity enhancement, ecological obstacle optimization, and pinch-point degradation simulation. In contrast, our multi-scenario simulation framework not only enables a more comprehensive evaluation of the synergistic effects of various intervention strategies but also provides a transferable conservation model for plateau cities sharing similar “mountain–city–water” spatial configurations. This approach effectively bridges critical gaps between current conservation plans and strategic implementation, offering significant demonstrative value for advancing regional biodiversity conservation efforts.

4.3.2. Implementation Pathways for Simulated Optimization Strategies

In the first scenario, this study constructs ecological stepping stones in key connectivity areas between ecologically essential source areas for birds (see Figure 14). The stepping stone is situated in the northern Xishan District of Kunming, at the junction of the southwestern Wuhua District (85% of the area; 15%), an area of ecological significance. This area is not only the core area with the highest density of ecological source sites (especially the concentrated distribution area of Tier 1 source sites) but also a key bird ecological node of the city cluster in central Yunnan. The area’s noteworthy characteristics, including its remarkable habitat heterogeneity and its strategic position as an essential node in the East Asia–Australasia migratory bird migration corridor [75], support the critical ecological needs of 128 bird species (including 12 nationally significant key conservation species, such as black-necked cranes) [76]. The index of regional habitat fragmentation increased by 37% between 2015 and 2020, directly contributing to a 21% decline in resident bird populations and a 34% reduction in migratory bird stopover frequency. The ecological stepping stones (artificial wetlands, vegetation corridors, etc.) implemented by this study have three core values: the reestablishment of bird migration pathways in fragmented habitats; the alleviation of erosive pressures on core habitats from urban sprawl; and the enhancement of ecosystem climate resilience. The implementation of this measure is of paramount importance, as it plays a crucial role in conserving endemic bird species and maintaining ecological balance in the region. This urgency has been elevated to a priority level to avert irreversible environmental degradation.
In the second scenario, this landscape connectivity optimization study demonstrates that by improving six pivotal ecological barrier points (comprising four on general corridors and two on core corridors), the landscape resistance value for bird ecological activities can be considerably diminished, thereby facilitating the enhancement of regional ecological network connectivity (Figure 15). The improvement and restoration of six critical ecological barrier sites located at the intersection of the southeastern part of Wuhua District (16.67% of the area), the southern part of Panlong District (50% of the area), and the western part of Guandu District (33.33% of the area) in Kunming City are identified as a critical bottleneck area for bird migration by the Least-Cost Pathways and Circuits theoretical model. Following the elimination of barriers in the study area, the core corridor in the southern Panlong District experiences a substantial decrease in migration resistance for forest birds. This includes species such as the white-cheeked thrush. Concurrently, the general corridor in the western Guandu District exhibits enhanced habitat connectivity for broadly adapted species, including house swallows. Additionally, the East Asia–Australasia migration corridor sees an improvement in stopover environments for waterbirds, such as the purple water thrush [77]. Of these factors, residential land and cropland exhibit the most substantial impact on landscape resistance [78]. While the elimination of ecological barrier sites has been demonstrated to be an effective strategy for promoting bird dispersal and gene flow, particularly in terms of restoring ecological functions within the core corridor area [79], its implementation has been hindered by socioeconomic factors, including land tenure disputes and imperfect ecological compensation mechanisms. This study optimizes the ecological restoration strategy using cost–benefit analysis. It also employs bird migration tracking techniques, such as ringing and satellite remote sensing. This allows long-term monitoring of the restoration effect of the corridor. It also assesses the ecological benefits.
The third scenario, which involves simulating the degradation of ecological pinch points, generates problems that are compared with those in the existing scenario. This process highlights the necessity and significance of safeguarding and enhancing ecological hotspots (Figure 16). The core study area for simulating ecological pinch-point degradation is identified as the intersection of the southeastern part of Xishan District and the southwestern part of Chenggong District, encompassing 42.86% of Xishan District and 57.14% of Chenggong District. The necessity of this action is supported by scientific evidence. The area is located within the ecologically sensitive zone of the Dianchi Basin, thereby serving as a critical node for maintaining the integrity of waterbird migration pathways [80]. Its higher habitat heterogeneity (Shannon diversity index 1.82) than the surrounding areas provides irreplaceable habitats for canopy nesting species, wading birds, and fringe species. The area is ecologically typical, and its simulation results will inform the protection of highland lakes. As a pivotal ecological node within the Dianchi Basin, the degradation of this area directly disrupts the migratory corridors of waterbirds, such as black-winged long-footed sandpipers. This disruption forces these birds to reroute their migratory paths, leading to an increase in energy expenditure of more than 30% [14]. Concurrently, a substantial decrease in habitat heterogeneity (as measured by Shannon’s index, from 1.82 to 0.98) would lead to a 45% decline in the breeding success of canopy-dwelling species (e.g., life bands) [1]. This decline would also result in severe fragmentation of the territories of resident birds (e.g., magpie robins), reducing their effective radius of mobility by 40% and impeding gene exchange [81]. These results contrast with the current situation, highlighting the irreplaceable role of this ecological pinch point in maintaining regional ecological connectivity and biodiversity. Consequently, the preservation and enhancement of this ecosystem are crucial in maintaining the ecological integrity of plateau lakes.
This study primarily focused on sedentary birds (accounting for 64.72%), woodland-dwelling birds (representing 39.87%), and species with low migratory capabilities (comprising 47.29%) within the context of avian migration behaviors. Through multiple scenario simulations, targeted optimization strategies were proposed. Specifically, ecological stepping stones, including artificial wetlands and vegetative corridors, were constructed at critical nodes, such as the northern part of the West Mountain District. These measures effectively mitigated the movement restrictions imposed by habitat fragmentation on sedentary and low-migratory-capability species, thereby increasing the potential ecological source areas. Additionally, six high-resistance barrier points at the junctions of Wuhua District and Panlong District were restored and optimized. This action reduced the migration resistance of core corridors, significantly improving the habitat connectivity for woodland birds. Furthermore, by simulating the degradation of high-heterogeneity pinch points at the junction of West Mountain and Chenggong, the irreplaceability of these pinch points was highlighted.

5. Conclusions

A comprehensive framework for identifying and optimizing avian ecological corridors in the urban core of Kunming was developed, with particular focus on resident birds (64.72%), woodland-dependent birds (39.87%), and low-mobility birds (47.29%). The constructed ecological network comprises 109 corridors with a total length of 720.88 km, revealing differentiated demands for ecological corridors among various avian groups. Of these corridors, 54 core corridors (25.47% of the total length) primarily serve resident birds, providing continuous habitats essential for their daily activities, while 55 general corridors (74.53% of the total length) function as stopover sites for migratory birds during their journeys. Ecological corridor design incorporates habitat preferences of birds: woodland-dependent birds rely on forest-covered corridors, wetland-associated birds benefit from corridors adjacent to wetlands, and open-landscape birds utilize corridors in open areas. For birds with low mobility (<1 km), the continuity of ecological corridors proves particularly crucial, whereas those with medium (1–5 km) and high (>5 km) mobility use the corridors more as transit points during migration.
The innovation of this research lies in the integration of multi-model coupling (InVEST-GIS-MSPA-MCR-circuit theory) with corridor design tailored to specific avian groups, addressing a significant gap in urban avian conservation. Through quantification of the dependence of resident birds on corridor continuity, the habitat requirements of woodland-dependent and wetland-associated birds, and the spatial needs of birds with varying mobility levels, a refined approach to ecological corridor planning was developed. The effectiveness of the optimization strategies was further validated through multi-scenario simulations: the addition of ecological stepping stones increased potential ecological sources by 25%, improvements to environmental barriers significantly enhanced the connectivity of core corridors, and simulations of pinch-point degradation highlighted the necessity of protecting these key nodes to maintain the integrity of ecological networks.
A replicable framework for subtropical montane cities was developed by integrating ecological corridor planning with avian behavioral characteristics. The findings not only offer scientific support for urban biodiversity policies but also emphasize the importance of differentiated management. In the northern pinch-point areas, efforts should focus on optimizing habitats for resident and woodland-dependent birds. In the southern barrier zones, priority should be given to removing obstacles that impede the migration of migratory and wetland-associated birds. Through the integration of ecosystem services, spatial ecology, and species-specific data, actionable solutions for balancing urbanization with ecological resilience were provided, setting a new standard for urban biodiversity conservation. Future research will further investigate the long-term ecological effects of environmental corridors and avian behavioral responses to optimize urban ecological networks continuously.

Supplementary Materials

The following supporting information can be downloaded at https://www.mdpi.com/article/10.3390/d17060427/s1. The supplementary materials provided by this study include: the basic data of GIS; Initial remote sensing data Boundary data of the study area Data on the distribution of bird species Survey data on birds in urban green Spaces in 2022.

Author Contributions

Conceptualization, X.Z. and Z.Z.; methodology, X.Z.; software, X.Z.; validation, X.Z. and Z.Z.; formal analysis, X.Z.; resources, Z.Z.; writing—original draft preparation, X.Z.; writing—review and editing, X.Z.; visualization, Z.Z.; supervision, Z.Z.; project administration, Z.Z.; funding acquisition, Z.Z. All authors have read and agreed to the published version of the manuscript.

Funding

This research was funded by the Basic Research Project of Yunnan Province, grant number 202301AT070222, and sponsored by Research on the Influence Mechanism of Bird Diversity Enhancement in Urban Green Space of Kunming, grant number 202401BD070001-11, and the first-class discipline Landscape Architecture Construction Fund of Yunnan Province.

Institutional Review Board Statement

Not applicable.

Informed Consent Statement

Informed consent was obtained from all subjects involved in this study.

Data Availability Statement

The authors confirm that the data supporting the findings of this study are available within the Supplementary Materials. All the required data are uploaded as Supplementary Materials.

Acknowledgments

Thanks to the reviewers and editors for their contributions to this article. We are very thankful for the funding from Yunnan Province for this research, funding number: 202301AT070222. This study examines the impact mechanism of increasing bird diversity in urban garden green spaces in Kunming, China, funding number: 202401BD070001-11.

Conflicts of Interest

The authors declare that they have no conflicts of interest.

References

  1. Hilty, J.A.; Keeley, A.T.; Lidicker, W.Z., Jr.; Merenlender. Corridor ecology: Linking landscapes for biodiversity conservation. Trends Ecol. Evol. 2020, 35, 679–690. [Google Scholar]
  2. Grimm, N.B.; Faeth, S.H.; Golubiewski, N.E.; Redman, C.L.; Wu, J.; Bai, X.; Briggs, J.M. Global change and the ecology of cities. Science 2008, 319, 756–760. [Google Scholar] [CrossRef]
  3. Grafius, D.R.; Corstanje, R.; Siriwardena, G.M.; Plummer, K.E.; Harris, J.A. A bird’s eye view: Using circuit theory to study urban landscape connectivity for birds. Landsc. Ecol. 2017, 32, 1771–1787. [Google Scholar] [CrossRef]
  4. Bai, X.; McPhearson, T.; Cleugh, H.; Nagendra, H.; Tong, X.; Zhu, T.; Zhu, Y.G. Linking urbanization and the environment: Conceptual and empirical advances. Annu. Rev. Environ. Resour. 2017, 42, 215–240. [Google Scholar] [CrossRef]
  5. Tian, Z.Q.; Liu, S.; Gu, P.C.; Lyu, X.; Peng, W.L. Construction of ecological security pattern in Huludao City based on MSPA-MCR-FLUS model. J. Agric. Resour. Environ. 2024, 1–17. [Google Scholar]
  6. Haddad, N.M.; Brudvig, L.A.; Clobert, J.; Davies, K.F.; Gonzalez, A.; Holt, R.D.; Lovejoy, T.E.; Sexton, J.O.; Austin, M.P.; Collins, C.D.; et al. Habitat fragmentation and its lasting impact on Earth’s ecosystems. Sci. Adv. 2015, 1, e1500052. [Google Scholar] [CrossRef] [PubMed]
  7. Li, Q.; Chen, J.; Liu, W. A method for constructing ecological corridors across administrative districts. J. Appl. Ecol. 2022, 33, 567–576. [Google Scholar]
  8. D’Aloia, C.C.; Naujokaitis-Lewis, I.; Blackford, C.; Chu, C.; Curtis, J.M.; Darling, E.; Guichard, F.; Leroux, S.J.; Martensen, A.C.; Rayfield, B.; et al. Coupled networks of permanent protected areas and dynamic conservation areas for biodiversity conservation under climate change. Front. Ecol. Evol. 2019, 7, 27. [Google Scholar] [CrossRef]
  9. Li, H.; Zhang, Y.; Huang, H.; Chen, F. Ecological network construction in Lushan City based on MSPA and MCR models. J. Cent. South For. Univ. Sci. Technol. 2024, 44, 98–107. [Google Scholar]
  10. Ye, H.; Yang, Z.; Xu, X. Ecological Corridors Analysis Based on MSPA and MCR Model—A Case Study of the Tomur World Natural Heritage Region. Sustainability 2020, 12, 959. [Google Scholar] [CrossRef]
  11. Xu, C.; Yu, Q.; Wang, F.; Qiu, S.; Ai, M.; Zhao, J. Identifying and optimizing ecological spatial patterns based on the bird distribution in the Yellow River Basin, China. J. Environ. Manag. 2023, 348, 119293. [Google Scholar] [CrossRef] [PubMed]
  12. Sun, X.; Shen, J.; Xiao, Y.; Li, S.; Cao, M. Habitat suitability and potential biological corridors for waterbirds in Yancheng coastal wetland of China. Ecol. Indic. 2023, 148, 110090. [Google Scholar] [CrossRef]
  13. Yang, H.; Xu, W.; Chen, Z.; Xie, X.; Yu, J.; Lei, X.; Guo, S.; Ding, Z. Ecological network construction for bird communities in high-density urban areas: A perspective of integrated approaches. Ecol. Indic. 2024, 158, 111592. [Google Scholar] [CrossRef]
  14. Lussier, S.M.; Enser, R.W.; Dasilva, S.N.; Charpentier, M. Effects of habitat disturbance from residential development on breeding bird communities in riparian corridors. Environ. Manag. 2006, 38, 504–521. [Google Scholar] [CrossRef] [PubMed]
  15. Regolin, A.L.; Oliveira-Santos, L.G.; Ribeiro, M.C.; Bailey, L.L. Habitat quality, not habitat amount, drives mammalian habitat use in the Brazilian Pantanal. Landsc. Ecol. 2021, 36, 2519–2533. [Google Scholar] [CrossRef]
  16. Zhang, L.X.; Chai, B.; Zhang, Y.; He, W.Q.; Tan, X.Q. A comparative study of ecological networks based on gravity modeling and circuit theory—A case study of Jining City. J. Ecol. 2025, 45, 1684–1696. [Google Scholar]
  17. Zhang, Y.; Yang, L.; Yang, X.; Li, J.; Lan, S.; Yang, J. Avian diversity changes in Kunming urban area (2016–2018). Biodivers. Sci. 2019, 27, 245–253. [Google Scholar]
  18. Yang, J.; Hu, T.; Li, B.; Zhang, Y.; Li, Y.; Wang, J.; Liu, J. Characteristics of the spatial and temporal evolution of ecological sensitivity in the Dianchi Basin based on the CA-MC model. J. Yunnan Agric. Univ. (Nat. Sci.) 2023, 38, 894–906. [Google Scholar]
  19. Liu, Q.; Yang, X.; Li, C. Study on the diversity of wintering waterbirds in Kunming Dianchi Wetland. J. Ecol. 2018, 38, 4321–4330. [Google Scholar]
  20. Yunnan Provincial Department of Ecology and Environment. Yunnan Province Biodiversity Conservation Strategy and Action Plan (2021–2035); Yunnan People’s Publishing House: Kunming, China, 2021.
  21. Kunming Planning Bureau. Kunming Territorial Spatial Planning (2021–2035); Kunming Planning Bureau: Kunming, China, 2022.
  22. Yunnan Provincial Forestry Department. Ecological Restoration Planning in Central Yunnan; Yunnan Provincial Forestry Department: Kunming, China, 2023. [Google Scholar]
  23. Wang, L.; Zhang, Y.; Li, X. Mechanisms of green space fragmentation on bird diversity in the main urban area of Kunming. J. Ecol. 2022, 42, 3125–3136. [Google Scholar]
  24. Yunnan Institute of Environmental Science. Analysis of the coercive effects of environmental pollution on bird habitats in the main urban area of Kunming. Res. Environ. Sci. 2020, 33, 1021–1030. [Google Scholar]
  25. Li, Z.Y.; Li, Y.Y.; Li, W.X.; Wang, Y.; Zhang, Y.; Yang, J. Construction of ecological security pattern in Kunming City based on morphological spatial pattern analysis and minimum cumulative resistance model. J. Ecol. Rural. Environ. 2023, 39, 69–79. [Google Scholar]
  26. Qin, B.G.; Lin, Y.L.; Zhao, J.S.; Zhang, Y.; Yang, J.; Li, W.X.; Wang, Y. Identification of key areas for ecological restoration in Kunming territorial space based on InVEST model and circuit theory. China Environ. Sci. 2023, 43, 809–820. [Google Scholar]
  27. Ma, J.J.; Phillips, K.; He, F. Field Manual of the Birds of China; Hunan Education Press: Changsha, China, 2000. [Google Scholar]
  28. Zhengm, G. Classification and Distribution of Birds in China; Science Press: Beijing, China, 2005. [Google Scholar]
  29. Peng, Q.Q.; Dilinur, A.J.; Li, P.P.; Hu, C.Q.; Kang, J.J.; Wang, K. Spatio-temporal Evolution and Prediction of Carbon Storage in Arid Areas Based on the PLUS-InVEST Model: A Case Study of the Kaidu River Basin. Environ. Sci. 2025, 1–16. [Google Scholar]
  30. Fang, G.; Shang, B.; Zhao, W.; Zhang, Y.; Yang, J.; Li, W.X.; Wang, Y. Research on soil erosion in the Lhasa River basin based on GIS and RUSLE. J. Soil Water Conserv. 2015, 29, 6–12. [Google Scholar]
  31. Lu, H.; Huang, Q.; Zhu, J.; Zhang, Y.; Yang, J.; Li, W.X.; Wang, Y. Changes in ecosystem type and quality and their impacts on ecosystem services in the Lhasa River Basin. J. Ecol. 2018, 38, 8911–8918. [Google Scholar]
  32. Huang, L.; He, C.; Wang, B. Study on the spatial changes concerning ecosystem services value in Lhasa River Basin, China. Environ. Sci. Pollut. Res. 2022, 29, 7827–7843. [Google Scholar] [CrossRef] [PubMed]
  33. Lv, D.W. Study on the Spatio-Temporal Evolution of Ecosystem Services in the Xinjiang River Basin Based on the InVEST Model; Jiangxi Agricultural University: Nanchang, China, 2022. [Google Scholar]
  34. Zhao, Y.; He, L.; Bai, W.; He, Z.; Luo, F.; Wang, Z. Prediction of ecological security patterns based on urban expansion: A case study of Chengdu. Ecol. Indic. 2024, 158, 111467. [Google Scholar] [CrossRef]
  35. Zhu, D.; Xie, B.; Chen, Y. Tourism land use strategy for mountainous tourist cities based on ecological sensitivity evaluation--Taking Zhangjiajie City as an example. Econ. Geogr. 2015, 35, 184–189. [Google Scholar]
  36. Li, Y.; Guan, C.; Zhu, J. Evaluation of ecological sensitivity of Nebula Lake watershed based on GIS. Res. Soil Water Conserv. 2017, 24, 266–271, 278. [Google Scholar]
  37. Chen, Y.; Luo, Z.; Qi, S.; Zhang, L.; Wang, X.; Liu, H.; Yang, J. Construction of ecological security pattern in Nanchang based on ecological sensitivity and ecological network. Soil Water Conserv. Res. 2021, 28, 342–349. [Google Scholar]
  38. Liu, H.; Wang, W.; Wang, Y.; Zhang, Y.; Yang, J.; Li, W.X.; Chen, Y. Comprehensive evaluation of ecological sensitivity and spatial and temporal evolution of the Fen River Basin. J. Ecol. 2021, 41, 3952–3964. [Google Scholar]
  39. Wang, J.; Chen, M.; Gou, A. Differences in ecological protection red line delineation methods in provincial areas under the goal of one blueprint. Jiangsu Agric. Sci. 2020, 48, 290–297. [Google Scholar]
  40. Liu, H.; Wang, W.; Wang, Y.; Zhang, Y.; Yang, J.; Li, W.X.; Chen, Y. Evaluation of ecological sensitivity and zoning study of proposed photovoltaic bases in ecologically fragile areas—Taking Qilian County as an example. J. Ecol. 2025, 45, 1–13. [Google Scholar]
  41. Guo, X.N.; Zhang, X.L.; Du, S.H.; Li, Y.Y.; Wang, J.; Liu, H.; Yang, J. The impact of onshore wind power projects on ecological corridors and landscape connectivity in Shanxi, China. J. Clean. Prod. 2020, 254, 120075. [Google Scholar] [CrossRef]
  42. Xu, Z.W.; Dong, B.; Wang, C.Y.; Zhang, Y.; Li, W.X.; Liu, H.; Yang, J. Construction of an internationally important wetland White-headed crane ecological corridor in Chongming Dongtan, China. Ecol. Indic. 2023, 149, 110156. [Google Scholar] [CrossRef]
  43. Seward, A.M.; Beale, C.M.; Gilbert, L.; Jones, T.H.; Thomas, R.J. The impact of increased food availability on the survival of a long-distance migratory bird. Ecology 2013, 94, 221–230. [Google Scholar] [CrossRef]
  44. Stutchbury, B.J.M.; Tarof, S.A.; Done, T.; Gow, E.; Kramer, P.M.; Tautin, J.; Fox, J.W.; Afanasyev, V. Migratory connectivity of a Neotropical migratory songbird revealed by archival light-level geolocators. Ecol. Appl. 2016, 26, 757–767. [Google Scholar]
  45. Wei, Z.; Xu, Z.; Dong, B.; Xu, H.; Lu, Z.; Liu, X. Habitat suitability evaluation and ecological corridor construction of wintering cranes in Poyang Lake. Ecol. Eng. 2023, 189, 106894. [Google Scholar] [CrossRef]
  46. Taubert, F.; Schrodt, F.; Shenkin, A.; Martius, C.J.; Coomes, D.A.; Fischer, R. Global patterns of tropical forest fragmentation. Nature 2018, 554, 519–522. [Google Scholar] [CrossRef]
  47. Li, Q.; Tang, L.H.; Qiu, Q.Y.; Zhang, L.; Chen, Y.; Lin, J.X.; Lin, Y.B. Construction of urban ecological safety pattern based on morphological spatial pattern analysis and minimum cumulative resistance model—Taking Xiamen City as an example. J. Ecol. 2024, 44, 2284–2294. [Google Scholar]
  48. Morandi, T.D.; França, J.D.C.L.; Menezes, S.E.; Pinto, A.A.; Carvalho, L.M.T.; Ribeiro, S.C. Delimitation of ecological corridors between conservation units in the Brazilian Cerrado using a GIS and AHP approach. Ecol. Indic. 2020, 115, 106440. [Google Scholar] [CrossRef]
  49. Shen, X.; Rezaei, T.; Kachenchart, B.; Liu, W.; Li, S.; Chen, Y.; Zhang, L. Optimal region connection: Establishing effective ecological corridors for biodiversity conservation in Yunnan Province, China. Ecol. Indic. 2024, 169, 112918. [Google Scholar] [CrossRef]
  50. Song, L.L.; Qin, M.Z. Identification of ecological corridors and their importance by integrating circuit theory. Chin. J. Appl. Ecol. 2016, 27, 3344–3352. [Google Scholar]
  51. Peng, J.; Zhao, H.; Liu, Y. Ecological corridor construction based on least-cost path analysis: A case study of the giant panda in the Qinling Mountains, China. Environ. Manag. 2017, 60, 920–933. [Google Scholar]
  52. Yang, C.; Xu, M.; Kang, S.; Fu, C.; Hu, D. Improvement of streamflow simulation by combining a physically based hydrological model with deep learning methods in a data-scarce glacial river basin. J. Hydrol. 2023, 625, 129990. [Google Scholar] [CrossRef]
  53. Hou, Y.; Zhao, W.; Liu, Y.; Yang, S.; Hu, X.; Cherubini, F. Relationships of multiple landscape services and their influencing factors on the Qinghai–Tibet Plateau. Landsc. Ecol 2021, 36, 1987–2005. [Google Scholar] [CrossRef]
  54. McRae, B.H.; Hall, S.A.; Beier, P.; Theobald, D.M.; Bengsen, A. Where to restore ecological connectivity? Detecting barriers and quantifying restoration benefits. PLoS ONE 2017, 7, e52604. [Google Scholar] [CrossRef]
  55. Tian, Y.; Zhang, Q.; Huang, H.; Chen, B.; Jia, M.; Wang, D.; Wang, X. Aboveground biomass of typical invasive mangroves and its distribution patterns using UAV-LiDAR data in a subtropical estuary: Maoling River estuary, Guangxi, China. Ecol. Indic. 2022, 136, 108694. [Google Scholar] [CrossRef]
  56. Huang, G.; Hu, W.; Du, J.; Li, X.; Chen, Y.; Wang, Z.; Zhang, L. Identification and scenario-based optimization of ecological corridor networks for waterbirds in typical coastal wetlands. Ecol. Indic. 2025, 171, 113147. [Google Scholar] [CrossRef]
  57. Dang, H.; Lü, Y.; Guo, J.; Zhang, L.; Fu, B.; Liu, J.; Wang, X. Multi-scenario simulation can contribute to identifying priorities for regional ecological corridors conservation. Ecol. Indic. 2024, 165, 112166. [Google Scholar] [CrossRef]
  58. Wang, Z.; Xiao, L.; Yan, H.; Lin, J.; Chen, Y.; Li, X.; Zhang, W. Optimization of the ecological network structure based on scenario simulation and trade-offs/synergies among ecosystem services in nanping. Remote Sens. 2022, 14, 5245. [Google Scholar] [CrossRef]
  59. Fan, F.; Wen, X.; Feng, Z.; Yang, Y.; Liu, G.; Zhang, J. Optimizing urban ecological space based on the scenario of ecological security patterns: The case of central Wuhan, China. Appl. Geogr. 2022, 138, 102619. [Google Scholar] [CrossRef]
  60. Luo, X.; Le, F.; Zhang, Y.; Wang, J.; Chen, L.; Liu, Y.; Li, S. Multi-scenario analysis and optimization strategy of ecological security pattern in the Weihe river basin. J. Environ. Manag. 2024, 366, 121813. [Google Scholar] [CrossRef]
  61. Yang, W.; Ye, H. Identification of ecological networks in the Guangdong-Hong Kong-Macao Greater Bay Area based on habitat quality. J. Ecol. 2023, 43, 10430–10442. [Google Scholar]
  62. Kong, F.; Duan, S.; Xu, C. Construction of ecological security pattern based on ecosystem services and ecological sensitivity—A case study of Qiantang River Basin. J. Ecol. 2024, 44, 11359–11374. [Google Scholar]
  63. Qiu, S.; Hu, J.; Yang, H. Construction of ecological security pattern of Li River basin based on ecosystem service and ecological sensitivity evaluation. J. Northwest For. Coll. 2024, 39, 153–162. [Google Scholar]
  64. Liu, G.; Peng, X.; Su, C. A review of research on the effects of artificial lighting on birds. J. Light. Eng. 2017, 28, 70–76. [Google Scholar]
  65. Luo, K.; Wu, Z.; Bai, H.; Zhang, L.; Yang, X.; Wang, Y.; Li, D. Bird diversity and waterbird habitat preferences in relation to wetland restoration at Dianchi Lake, south-west China. Avian Res. 2019, 10, 374–385. [Google Scholar] [CrossRef]
  66. Li, M.; Wang, F.; Chen, L. Effects of urban ecological corridors on bird diversity. J. Ecol. 2020, 40, 4123–4132. [Google Scholar]
  67. Zhang, W.; Liu, Y.; Wu, P. Research progress on ecological network planning and climate adaptation of urban green space. Landsc. Archit. 2021, 28, 56–63. [Google Scholar]
  68. Luo, Y.; Zhu, Z.; Wu, J.; Zhang, Y. Exploring habitat patch clusters based on network community detection to identify restored priority areas of ecological networks in urban areas. Urban For. Urban Green. 2022, 78, 127771. [Google Scholar] [CrossRef]
  69. Huang, X.; Xiu, L.; Lu, Z.; Wang, Y.; Chen, J.; Zhang, K.; Li, M. Ecological networks construction and optimization in the Longdong Loess Plateau: The advantages of self-organizing map and complex networks. Ecol. Indic. 2025, 170, 113138. [Google Scholar] [CrossRef]
  70. Chen, W.; Chi, G. Urbanization and ecosystem services: The multi-scale spatial spillover effects and spatial variations. Land Use Policy 2022, 114, 105964. [Google Scholar] [CrossRef]
  71. Kunming Forestry and Grassland Bureau. Report on Dianchi Wetland Ecological Restoration Project; Kunming Forestry and Grassland Bureau: Kunming, China, 2015. [Google Scholar]
  72. Standing Committee of the Kunming People’s Congress. Regulations on the Protection of Red-billed Gulls in Kunming; Standing Committee of the Kunming People’s Congress: Kunming, China, 2015. [Google Scholar]
  73. Feng, Y.L.; He, M.; Li, B.; Zhang, W.; Chen, X.; Wang, L.; Liu, Y. Construction and optimization of urban ecological network in main urban area of Chongqing. Ecol. Environ. Sci. 2025, 34, 699–709. [Google Scholar]
  74. Xiao, Y.; Zhou, X.; Jiang, X.; Wang, L.; Chen, Y.; Zhang, H.; Li, M. Research on ecological security pattern maintenance in Guiyang based on ecosystem service function evaluation. Ecol. Sci. 2020, 39, 244–251. [Google Scholar]
  75. Li, W.; Zhang, Y.; Chen, X.; Wang, J.; Liu, H.; Yang, S.; Zhou, L. Long-term monitoring of wintering waterbirds in Dianchi Lake. Chin. J. Zool. 2024, 59, 112–120. [Google Scholar]
  76. Liang, Q.; Zhai, J.; Li, C. From separation to incorporation: Development of a unifying framework that integrates bird habitats with public recreation spaces within the wetland park system. J. Clean. Prod. 2023, 430, 139647. [Google Scholar] [CrossRef]
  77. Wang, C.; Wang, G.; Dai, L.; Zhang, Y.; Li, X.; Chen, J.; Liu, W. Study on the effect of habitat function change on waterbird diversity and guilds in Yancheng coastal wetlands based on structure–function coupling. Ecol. Indic. 2021, 122, 107223. [Google Scholar] [CrossRef]
  78. Wang, C.; Wang, G.; Guo, Z.R.; Li, X.; Zhang, Y.; Chen, J.; Liu, W. Effects of land-use change on the distribution of the wintering red-crowned crane (Gnus japonensis) in the coastal area of northern Jiangsu Province, China. Land Use Policy 2020, 90, 104269. [Google Scholar] [CrossRef]
  79. Zhang, Y.; Li, H.; Wang, J. Spatial heterogeneity and conservation priority of avian habitats in central Yunnan. Landsc. Ecol. 2021, 36, 1123–1136. [Google Scholar]
  80. Chen, Y.; Liu, M.; Zhao, K. Impacts of urbanization on avian communities in southwest China. Ecol. Indic. 2022, 138, 108843. [Google Scholar]
  81. Wang, S.; Zhang, L.; Li, M. Ecological sensitivity assessment and conservation priority identification in urbanizing watersheds. Landsc. Ecol. 2021, 36, 1327–1343. [Google Scholar]
Figure 1. Location map of the main urban area of Kunming. Plan approval number: reproduction GS (2024) 0650—source osm website (https://www.openstreetmap.org/; 5 September 2024).
Diversity 17 00427 g001
Figure 2. Detailed diagram of the study framework.
Diversity 17 00427 g002
Figure 3. Indicator map for ecosystem services assessment. ((a): soil conservation (b): water yield (c): carbon storage (d): habitat quality).
Diversity 17 00427 g003
Figure 4. Map of indicators for ecological sensitivity assessment. ((a): geological sensitivity (b): climate sensitivity (c): sensitivity to natural resources (d): human interference sensitivity).
Diversity 17 00427 g004
Figure 5. Resistance surface factor indicator chart 1. ((a): slope; (b): NDVI; (c): NDWI; (d): land use type).
Diversity 17 00427 g005
Figure 6. Resistance surface factor indicator chart 2. ((a): distance from the road; (b): building height; (c): population density).
Diversity 17 00427 g006
Figure 7. Composite resistance surface indicator chart.
Diversity 17 00427 g007
Figure 8. Map of integrated ecosystem services.
Diversity 17 00427 g008
Figure 9. Integrated ecological sensitivity map.
Diversity 17 00427 g009
Figure 10. Ecological source distribution map.
Diversity 17 00427 g010
Figure 11. Distribution of ecological corridors.
Diversity 17 00427 g011
Figure 12. Distribution of ecological pinch points.
Diversity 17 00427 g012
Figure 13. Distribution of ecological barrier sites.
Diversity 17 00427 g013
Figure 14. Scenario 1: Adding environmental stepping stones.
Diversity 17 00427 g014
Figure 15. Scenario 2: Improving ecological barriers.
Diversity 17 00427 g015
Figure 16. Scenario 3 simulates environmental pinch point degradation.
Diversity 17 00427 g016
Table 1. Detailed table of urban green space bird survey in the main urban area of Kunming City.
Urban Green Space ZoningNumberSample NameEast LongitudeNorthern LatitudeUrban Green Space ZoningNumberSample NameEast LongitudeNorthern Latitude
Panlong District1Yunnan map B region102.75983525.0876Xishan District99Grand View Park—Yu Garden102.67533325.021333
2Kunming Botanical Garden102.74925325.144056100Lakeside Ecological Wetland Park102.66933324.966333
3Expo eco-city102.76780525.086325101Wujiadui Wetland Park102.692324.9963
4Golden Hall Park102.77805325.091071102300 m northeast of Zhangmei Village Pier102.66337724.983377
5Kunming Botanical Garden102.74882925.148032103Kunming West Zhixuan Holiday Inn102.67964125.050374
6Yunnan Forest Nature Center102.80825325.093439104Xishan Scenic Spot—Kunming Xishan Forest Park102.64433324.993333
7Yunnan Academy of Forestry102.75346325.151988105Panlong River Changlin102.69563924.958128
8Kunming Branch of the Chinese Academy of Sciences102.74537325.143676106Grand View Park—Yu Garden102.68233324.970333
9Kunming Zhongnong Organic Agriculture Certification demonstration base, 100 m west102.75473825.11077107Lakeside Ecological Wetland Park102.69459224.826829
10Golden Hall Park102.76714325.071602108Wujiadui Wetland Park102.64433324.993333
11Kunming Botanical Garden—Fuli Palace102.75107725.086333109300 m northeast of Zhangmei Village Pier102.69033324.972333
12East Garden of Kunming Botanical Garden102.75239625.140271110Kunming West Zhixuan Holiday Inn102.62233324.973333
13Kunming World Horticultural Exposition Park102.7710125.059675111The Caohai lakeside wetland of Dianchi Lake102.67533324.998333
14Expo Eco-City South District102.77031725.053324112Daguan Tower102.67837725.023522
15World Horticultural Expo Park102.7710125.059675113Xishan scenic area, Yulan Garden, north102.64433324.994333
16Waterfall Park102.7037325.122392114Nie Er Memorial Hall102.68833324.975333
17Kunming University of Science and Technology Xinying campus102.78517725.042776115Haigeng dam102.69233324.975333
18Kunming World Horticultural Exposition Park102.7710125.059675116No.1 Inpatient Building, The First Affiliated Hospital of Kunming Medical University102.69033325.030333
19Expo Eco-City Banshan Neighborhood102.7702125.05521117Longmen Village, Kunming City102.64033324.988333
20Expo eco-city102.77031725.053324118Xi Hua Yuan102.69081325.028415
21Zhujiashan102.75914325.050717119Longjiang Park102.72386124.99614
22Huanglongqing Resort102.76525.065120Huaxia Tianjing Bay102.66742724.998344
23Jinguishan sightseeing park, bird valley102.82945725.091622121Haihong Wetland Park102.69249124.960412
24Longchuan Bridge Forest Park102.79704525.141371122Avant-garde Road West102.69917724.997614
25Kunming Institute of Zoology, Chinese Academy of Sciences102.749325.0852123Yongchang wetland102.65903724.992885
26Tanhua Temple (opposite to Jinyuan residential area, Tongxing Group, Tanhua Road)102.79225.033124The famous city of Biji102.67707625.041194
27Tuanshan102.78122225.208543125Fivestars Garden102.67586725.048306
28Manzhewa102.78634325.076714126Grand View Park South Garden102.67733325.022333
29Kunming Botanical Garden West Garden102.74886325.144512Cheng gong District127Jiangwei102.79099824.883766
30Kunming University of Science and Technology Xinying Campus102.78517725.042776128Wulong Chuen Temple102.7938524.863009
31Yingchun Yayuan ecological villa102.83116225.099388129Ancient Dian Boutique Wetland Park102.75133824.779033
32Zhujiashan, Shuanglong Street102.75914325.050717130Along the fishing river102.77894524.829072
33Yunnan Fengzeyuan Botanical Garden102.69834325.114343131Yunnan University Zehu102.85153524.837137
34Huanglongtan Ecological Park102.86810825.246757132Xinghu Bay102.80087524.864377
35Songhuaba Reservoir102.71472225.145556133Lao Yu River Wetland Park102.77611924.827499
36Bailongtan102.84390825.233517134Yunnan University Lixian Building102.85558524.838663
37Kunming University of Science and Technology102.78517725.042776135Guangtian East Road, Yunnan University102.85903124.836355
38Tanhua Temple Park102.79199725.033334136Dounan wetland102.77434124.900178
39Jindian reservoir102.76433325.079333137Yunnan University Zehu102.85153524.837137
40Bailongt102.78333325.028333138Dounan street Jiangwei village102.78867324.882152
41Dianwei Village102.74533325.111333139Jiangwei Village102.79099824.883766
42Southwest Forestry University arboretum102.77916725.046389140Dounan Street house bay102.78335724.88355
43Black Dragon Pool Park102.75702425.148149141University Station Metro Station102.77331424.925233
44Jindian Forest Park102.77789925.090123142Dounan street Jiangwei village102.76373724.976697
45Waterfall Park102.77125.133329143Yupu Cold Spring Forest Ecological Wetland Park102.77333724.907337
46Tanhua Temple102.7563325.052291144College station102.77333324.92
47Baiyi Temple102.74635925.069727145Ma Jinpu Street, Yangliuchong102.67836324.894337
48Low-carbon center102.76328925.087632146Yangwangsan102.67333324.946667
49Drum Tower Park102.71883425.053474147Venice Hotel Kunming102.81689524.787264
50The Golden Juice River Bridge102.75770325.120348148Dounan street office, Jiangwei community neighborhood committee102.76373724.976697
51Sunflower Commune102.72658625.080815149Lo Yu River102.77894524.829072
52Muyang River102.82297225.297208150Tuyere village102.69477224.944693
Wuhua District53Cuihu Park102.71016925.054743151Yunnan University102.7731424.922237
54Maitreya Temple Park102.70564925.036663152Along the fishing river102.77913224.830684
55Lotus Pond102.70755325.067459153Lorong Park102.82583624.895635
56Changzhong Mountain Ecological Park102.71136325.120145154Ginkgo Park102.8276424.779937
57Kunming Zoo102.7167925.059918155Yupu Park102.82379524.79626
58North City Lotus Pond Moonlight west102.72856525.099512156TV tower line102.87920824.757029
59Crescent Lake Park102.73287425.096864157Municipal administrative center102.84281424.884307
60Kunming Zoo—Yutong Mountain102.71771225.058963158The Fish River Park102.77611924.827499
61Forest Hubei 150 m102.63548324.962334159Blue Light Joy City102.78081824.89808
62Kunming Zoo, 50 m northeast of Yuantong Mountain102.70837225.049627160Langxi Street102.8702424.854228
63Jinniu Park102.70029325.042605161Luoyang Street102.83708224.908072
64Yunnan Provincial People’s Government102.7029325.041619162Dounan Wetland Park102.77434124.900178
65Garden102.63770325.120856163Haiyan Village102.7333924.947333
66Donglu Campus of Yunnan University102.70060925.034834164Xinghu Bay (No.258 Haihu Road, Kunming)102.67331224.872537
67West Zhuahene Street Pear Pass102.6070625.11639Guandu District165Kunming Haidong Wetland Park102.73694224.927936
68Hongpo Reservoir102.669325.0623166Baofeng Wetland Park102.7329224.933701
69Yuantong Mountain Zoo102.70806225.04926167Guandu Street Baofeng102.72960724.936855
70Lihuaqing102.6070625.11639168Baofeng102.72959524.936318
71Countrypark102.62443325.074668169Guandu Street Baofeng village102.72708624.936163
72Saikyoji102.74588525.114013170Baofeng Wetland Park—Baoxang River into the lake estuary wetland102.73181624.928483
73Bozhong Garden102.68373525.095646171Xinghai Peninsula Wetland Park102.69429624.952984
74Jintai International102.67987725.069866172Kunming Dianchi Baofeng Wetland Park102.73218924.93396
75Crystal Seol102.70420425.079893173Liujia street, Qinghe village102.69102624.942453
76Wuhua Plaza102.71254425.050389174Fubao wetland102.70115124.936674
77Sumishan Park102.66435225.097941175Kunming Xinghai Peninsula Wetland Park102.69429624.952984
78Crescent Lake Park102.73287425.096864176Kunming Dianchi Baofeng Wetland Park102.70834924.929352
79Kunming Zoo (92 Qingnian Road, Kunming City)102.70806225.04926177Baofeng Wetland Park102.70834924.929352
Xishan District80News Road Book Market (News Road Store)102.69481625.040655178Changshui Airport102.9757725.119272
81Kunming Dianchi National Tourism Resort102.670624.988083179Baofeng Side102.70834924.929352
82Huiwan wetland102.65676124.914068180Helen International, 4 Hyde area102.73906724.902235
83Longniwan102.65254124.791456181Haidong Wetland Park102.71939424.923222
84Hongjia Village102.69553524.957482182Kunming Dianchi Baofeng Wetland Park102.70834924.929352
85Baozhu Ecological Park102.63345125.045769183Light Flight Collection Hotel Kunming102.92743125.122292
86Light Bay102.64900224.925581184Baofeng Wetland Park—Baoxang River into the lake estuary wetland102.70834924.929352
87Haigeng Park102.66526324.966196185Guandu Forest Park102.75775525.014273
88Biji Road (North of Lehaiche City)102.63149925.000938186Helen International102.73906724.902235
89Caohai tunnel102.67204125.017698187Xiliangtang Wetland102.74293724.941968
90Scenic Road (inside Dianchi Dam)102.65692824.987938188Ruyi Park102.75978924.971024
91Biji Road (East of Education and Training Center of Kunming Transportation Bureau)102.63628425.014742189Dongjiawan102.74575825.041025
92Hongjia Village102.66525.023190Jerlin Park102.73243825.028173
93Yunnan Highway development and Investment Company, Kunming west management office, east102.63412125.005992191Romma Road102.73131224.941083
94Ma Street, Puping village102.63925.021192Dongxu Juncheng102.78687825.033786
95Kunming Sunac Sea World102.62925.005193Shut down the rule of law102.74139825.031417
96Kunming Daguan Park—South Garden102.67733325.022333194Jinshu Spring Ribbon Park102.74601425.045171
97Dianchi Fortress-Ziying (South of Wanda Avenue)102.67333324.970333195New house102.73432324.904333
98Lakeside Ecological Wetland Park102.66933324.966333
Table 2. Bird species classification.
Classification BasisAvian SpeciesPercentage (%)Typical Species
Migratory behaviorResident bird64.72%Pycnonotus xanthorrhous, Passer domesticus, Egretta garzetta
Migratory bird35.28%Chroicocephalus ridibundus, Hirundo rustica, Phylloscopus proregulus
Habitat preferenceWoodland birds39.87%Pycnonotus xanthorrhous, Aegithalos concinnus, Zosterops japonicus
Wetland birds37.63%Chroicocephalus ridibundus, Egretta garzetta, Motacilla alba
Open-country Birds22.50%Passer domesticus, Pycnonotus aurigaster, Copsychus saularis
Migratory abilityLow-mobility Species47.29%Pycnonotus xanthorrhous, Passer domesticus, Aegithalos concinnus
Moderate migrants9.19%Gallinula chloropus, Motacilla alba, Zosterops japonicus
Long-distance migrants43.52%Chroicocephalus ridibundus, Egretta garzetta, Hirundo rustica
Table 3. Detailed table of model data sources.
Digital ModelData
Classification
Data TypeData SourceSpatial
Resolution
InVEST
Ecosystem
Services
\Land use typeData Center for Resources and Environmental Sciences, Chinese Academy of Sciences (https://www.resdc.cn/)30 m
Traffic network1 km
Watershed boundary1 km
Density of the river network\
Evaporation capacity\
Precipitation\
Ecological sensitivity of
GIS
Climate sensitivityMean air temperatureData Center for Resources and Environmental Sciences, Chinese Academy of Sciences (https://www.resdc.cn/)1 km
Relative humidity1 km
Mean annual precipitationNational Oceanic and Atmospheric Administration (https://www.noaa.gov/)1 km
Geological sensitivityElevationGeospatial Data Cloud (http://www.gscloud.cn/)30 m
SlopeBased on elevation data extracted from ArcGIS30 m
Aspect of slope30 m
Relief of relief30 m
Topographic roughness30 m
Surface cutting depth30 m
Natural resource sensitivityStream density bufferBased on elevation data extracted from ArcGIS30 m
Lake extentGeospatial Data Cloud (http://www.gscloud.cn/)30 m
Soil typeData Center for Resources and Environmental Sciences, Chinese30 m
Land use type30 m
Vegetation coverageNational Data Center for Ecological Sciences (http://www.nesdc.org.cn/)30 m
Human interference sensitivityRoad densityData Center for Resources and Environmental Sciences, Chinese Academy of Sciences (https://www.resdc.cn/)30 m
Population densityORNL Landscn (https://landscan.ornl.gov/citations (accessed on 10 June 2025))30 m
Morphological spatial analysis of
MSPA
/Land use typeData Center for Resources and Environmental Sciences, Chinese Academy of Sciences (https://www.resdc.cn/)30 m
Table 4. Resistance values and weights of resistance surface factors.
Resistance FactorsResistance ValueDrag CoefficientWeight
Slope0–6.09100.0268
6.09–13.0630
13.06–21.1950
21.19–31.9270
31.92–74.3090
NDVI7893–9999100.3302
6021–789330
3704–602150
797–370470
−3698–79790
NDWI0.40–0.89100.0348
0.06–0.4030
−0.33–0.0650
−0.55 + 0.3370
−0.86 + 0.5590
Land use typeForest land100.3257
Meadow30
Waters50
Plowland70
Residential land90
Distance from the road>1500 m100.1112
1000–1500 m30
500–1000 m50
200–500 m70
<200 m90
Building height3.50–14 m100.0467
14–31.5 m30
31.5–56 m50
56–91 m70
91–140 m90
Population density0.04–27.79100.1246
27.79–104.1130
104.11–360.8250
360.82–825.6870
825.68–1776.2090
Disclaimer/Publisher’s Note: The statements, opinions and data contained in all publications are solely those of the individual author(s) and contributor(s) and not of MDPI and/or the editor(s). MDPI and/or the editor(s) disclaim responsibility for any injury to people or property resulting from any ideas, methods, instructions or products referred to in the content.

