Article

Locally Measured Functional Traits Predict Species Registrability in Herbaceous Flora

by
Caihong Wei
1,
Si Liu
1,
Xiaoyue Liang
1,
Yingcan Chen
1,
Jiaen Zhang
1,2,3,* and
Ronghua Li
1,2,3,*
1
College of Natural Resources and the Environment, South China Agricultural University, Guangzhou 510642, China
2
Key Laboratory of Agro-Environment in the Tropics, Ministry of Agriculture and Rural Affairs, South China Agricultural University, Guangzhou 510642, China
3
Guangdong Engineering Technology Research Centre of Modern Eco-Agriculture and Circular Agriculture, South China Agricultural University, Guangzhou 510642, China
*
Authors to whom correspondence should be addressed.
Diversity 2025, 17(6), 408; https://doi.org/10.3390/d17060408
Submission received: 19 April 2025 / Revised: 20 May 2025 / Accepted: 22 May 2025 / Published: 10 June 2025

Abstract

:
Understanding why some plant species become widespread while others remain restricted to limited ranges is a central challenge in ecology and biogeography. This study investigates how functional traits, including morphological, physiological, and nutrient-related traits, relate to the global registrability—defined as the likelihood of a species being observed and recorded—for 144 herbaceous plant species from Guangzhou, China. We combined field-measured morphological, physiological, and nutrient-related traits with occurrence data from the Global Biodiversity Information Facility (GBIF), quantified as the number of unique 10 km × 10 km grid cells per species. Our analyses reveal that resource-acquisitive traits—such as high leaf water content, chlorophyll concentration, and photosynthetic capacity—are positively associated with registrability, whereas traits linked to nutrient conservation (e.g., high leaf carbon content and leaf carbon-to-nitrogen ratios) show negative associations. Principal component analysis further indicates that multivariate trait axes characterized by acquisitive strategies are significantly and positively associated with higher registrability. These findings suggest that species with fast-growth, resource-intensive strategies are more likely to be encountered and reported, potentially due to both ecological generalism and observation bias.

1. Introduction

A central goal in ecology and biogeography is to understand why some plant species become widespread while others remain restricted to limited ranges [1,2,3]. Species’ geographic distributions are the result of complex interactions among evolutionary history, ecological strategies, environmental tolerance, human factors, and dispersal ability [3,4]. While species distributions have traditionally been studied under the assumption of natural conditions, recent research highlights that species’ distributions, particularly in human-modified landscapes, are influenced by factors such as land use, climate change, and ecosystem disruptions [3,5]. Human-driven changes have significantly impacted the geographic ranges of many species, making it important to reconsider how we understand species distributions in a world where human influence is increasingly pervasive.
In recent years, the Global Biodiversity Information Facility (GBIF) has emerged as one of the most widely used sources of occurrence data for studying species distributions. With over three billion records compiled from herbarium specimens, museum collections, citizen science initiatives, and ecological surveys, GBIF provides a powerful platform for macroecological analyses. Researchers have used GBIF data to map species richness, identify biodiversity hotspots, assess invasion risk, and model species distributions under various climate change scenarios. However, GBIF records reflect where species have been observed and recorded, not necessarily where they actually occurred. A growing body of literature has pointed out that GBIF data are subject to various forms of sampling bias, including spatial (e.g., overrepresentation near roads and cities), taxonomic (e.g., preference for showy or familiar species), and temporal (e.g., seasonally or historically skewed) biases. These limitations mean that raw occurrence counts from GBIF should not be treated as accurate proxies for species’ global distribution ranges or population abundances. Rather than reflecting true geographic range, these records instead indicate where and how frequently species have been registered. Instead, GBIF data may better represent a species’ registrability—that is, the probability of being detected, identified, and uploaded to global biodiversity databases. This registrability reflects a mixture of ecological presence and observer behavior and is influenced by a species’ visibility, habitat accessibility, and how often it occurs in areas of high human activity. For instance, species that grow in urban green spaces, along roadsides, or in public parks are more likely to be recorded, while those restricted to remote or inaccessible habitats—such as tropical forests or mountain interiors—may be underrepresented, regardless of their actual abundance.
Trait-based ecology has emerged as a powerful framework for uncovering general mechanisms that shape species’ ecological performance and biogeographic patterns [6,7]. Functional traits—measurable characteristics of plants that influence growth, survival, and reproduction—have been widely used to explain species’ responses to environmental gradients, competitive interactions, and demographic outcomes [8,9]. One of the most influential frameworks in trait-based ecology is the leaf economics spectrum (LES), which describes a continuum from fast-growing, acquisitive species with high photosynthetic capacity and short leaf lifespans to slow-growing, conservative species with long-lived tissues [9]. This spectrum reflects broader differences in resource-use strategies: acquisitive species tend to have high photosynthetic capacity, rapid turnover, and efficient nutrient use, enabling them to thrive in resource-rich or disturbed environments [10,11]. Conversely, conservative species invest in structural protection and metabolic efficiency, making them better suited to low-resource or stressful conditions [12,13]. These strategies, reflected in suites of functional traits, are not only relevant to individual performance but also hypothesized to scale up to influence population dynamics, competitive ability, and ultimately species distributions [14,15]. Recent ecological theory has extended this perspective by suggesting that traits can shape not only how species function locally but also how they succeed globally [16,17].
Species with traits associated with rapid growth and high fecundity may be more likely to establish in new environments, disperse widely, and build large populations, especially in human-disturbed landscapes [18,19,20]. As a result, such species are more likely to be repeatedly encountered and documented, leading to higher representation in global biodiversity databases. In contrast, slow-growing or highly specialized species may have limited dispersal ability and narrower habitat preferences, reducing their chances of being observed and recorded [1,21]. Despite these theoretical insights, empirical evidence linking plant functional traits to global patterns remains limited and fragmented [6,14,22]. Most trait-based studies that explore species’ global patterns rely heavily on large-scale trait databases, which aggregate data from disparate sources that differ in sampling methods, environmental contexts, and developmental stages [23]. Moreover, these studies frequently emphasize a narrow subset of “soft” traits such as specific leaf area or seed mass [6,15]. Consequently, our understanding of how variation in functional traits shapes species’ likelihood of being recorded in global databases remains limited, leaving a gap in linking local ecological strategies to global registrability patterns [3,24].
To address the gap in understanding how functional traits relate to species’ detectability at a global scale, we conducted a standardized field survey of 144 herbaceous plant species—including both native and introduced taxa—in Guangzhou, China [25]. For each species, we measured a suite of morphological and physiological traits reflecting resource acquisition and utilization strategies, with particular emphasis on variation along the leaf economic spectrum (LES). These field-based measurements, collected under consistent environmental conditions, provide a robust basis for trait comparisons. To evaluate species’ global registrability, we extracted georeferenced occurrence records from the GBIF and calculated the number of unique 10 km × 10 km grid cells in which each species was recorded. This grid-based approach reduces the influence of spatial sampling bias and better reflects the geographic spread of observations rather than raw record counts. We then examined whether species with acquisitive traits—such as high SLA, photosynthetic rates, and nutrient content—tend to be registered across more grid cells than conservative species characterized by slow growth, structural investment, and resource conservation. By linking local trait expression to spatially standardized registrability measures, our study offers a new perspective on how local trait expression—particularly along the LES axis—can scale up to shape species’ likelihood of being detected and documented in global biodiversity databases.

2. Materials and Methods

2.1. Study Area

The study was conducted in Guangzhou (112°57′–114°03′ E, 22°26′–23°56′ N), a subtropical metropolis situated in southern China, encompassing an area of approximately 7434 km2. The region experiences a humid subtropical monsoon climate, characterized by hot, wet summers and mild winters. Annual precipitation exceeds 1800 mm, with rainfall distributed across more than 150 days per year. The mean annual temperature ranges from 21.5 °C to 22.2 °C. The city’s landscape is topographically diverse, with a mix of hills, lowlands, and rivers, supporting a high diversity of spontaneous vegetation. Despite rapid urbanization, many green spaces such as roadsides, urban parks, abandoned lots, and peri-urban wastelands maintain considerable herbaceous plant diversity.
To assess species’ global registrability (REG), we obtained georeferenced occurrence records from the Global Biodiversity Information Facility (GBIF, https://www.gbif.org) using the “rgbif” R package. To reduce sampling bias and ensure data quality, we filtered the occurrence records by removing entries lacking geographic coordinates, duplicate records, and spatial outliers (e.g., marine or institutional coordinates). For each species, we then calculated the number of unique 10 km × 10 km grid cells in which it was recorded globally. This grid-based approach minimizes spatial clustering and overrepresentation of well-sampled regions, providing a spatially standardized measure of registrability. To visualize the variation in species registrability, we generated a rank–abundance curve and a histogram of log-transformed registrability across all 144 species (Figure S1), which revealed a strongly right-skewed distribution, typical of ecological abundance datasets [6].

2.2. Functional Traits Measurements

We compiled a dataset of 144 herbaceous plant species commonly found in urban and peri-urban open habitats [25]. Most of these species occur in disturbed or unmanaged areas such as wastelands, roadsides, and abandoned lots, where they frequently co-occur. Given that herbaceous vegetation is typically concentrated in these environments, the majority of trait sampling was conducted in urban and peri-urban sites. However, to capture a broader ecological gradient, we also included herbaceous species occurring within secondary forests and protected natural reserves. Field surveys were conducted during the peak growing season in 2022 to locate and identify target species across various habitats in Guangzhou (Table S1). All trait measurements were subsequently conducted in 2023, ensuring consistency in sampling conditions. We measured 3–5 healthy, mature individuals per species and quantified a total of 16 functional traits that capture key aspects of plant ecological strategies. Together, these traits describe major axes of plant strategies related to resource acquisition, structural investment, and growth performance.
Morphological traits included plant height (H), measured from the base to the tallest vegetative or reproductive part using a ruler, and thousand-seed weight (TSW), expressed for the weight per thousand seeds. TSW data were primarily obtained from the Kew Seed Information Database and supplemented with values from published literature before December 2023. When multiple records were available for a species, we used the mean value. Leaf thickness (LT) was measured using a digital micrometer. Leaf area (LA) was determined using a LI-3000A leaf area meter (Li-Cor, Lincoln, NE, USA). Fresh leaves were weighed, oven-dried at 70 °C for 48 h, and reweighed to obtain dry mass. Specific leaf area (SLA) was calculated as the ratio of LA to dry mass. Leaf water content (LWC) was computed as the difference between fresh and dry mass divided by fresh mass.
Leaf nutrients related traits were analyzed from dried, ground leaf samples. Leaf nitrogen (N) was measured via the Kjeldahl method, phosphorus (P) via atomic absorption spectrometry, and carbon (C) using potassium dichromate oxidation. Elemental ratios (C:N and N:P) were calculated accordingly. Chlorophyll content was estimated using a SPAD-502 chlorophyll meter (Konica Minolta, Tokyo, Japan) on mature leaves.
Physiological traits were measured using a portable LI-6400 photosynthesis system (Li-Cor, Lincoln, NE, USA) on sunny days between 9:00 and 11:00 a.m. Specifically, photosynthetically active radiation was maintained at 1500 μmol m−2 s−1 during measurements, which is considered saturating for herbaceous species. Leaf temperature was set at 25 ± 1 °C, relative humidity between 50–70%, and the ambient CO2 concentration at 400 ppm. For each species, 5 to 10 mature, sunlit leaves were selected to measure the maximum photosynthetic rate per unit area (Aarea, μmol m−2 s−1) and stomatal conductance per unit area (gsa, mol m−2 s−1). Mass-based assimilation rate (Amass) and mass-based stomatal conductance (gs) were calculated as follows: Amass = SLA × Aarea/10,000 and gs = SLA × gsa/10.

2.3. Statistical Analyses

All statistical analyses were performed using R version 4.3.2. To reduce skewness and improve the normality of trait distributions, we applied log-transformation to several variables including thousand-seed weight (TSW), leaf area (LA), plant height (H), and the response variable—species registrability (log-transformed REG), defined as the number of 10 km × 10 km grid cells in which a species was recorded.
To reduce dimensionality and account for correlations among functional traits, we performed principal component analysis (PCA) on the standardized trait matrix using the “FactoMineR” and “factoextra” packages. The first two principal components (PC1 and PC2) captured the dominant axes of trait variation and were interpreted in the context of ecological strategies, including the leaf economics spectrum. To evaluate the relationship between trait syndromes and species registrability (REG), we conducted separate linear regressions using log-transformed REG as the dependent variable and either PC1 or PC2 as the independent variable. This approach allowed us to assess whether major axes of trait variation—particularly those reflecting acquisitive versus conservative strategies—are associated with variation in the likelihood of species being recorded in global biodiversity databases.

3. Results

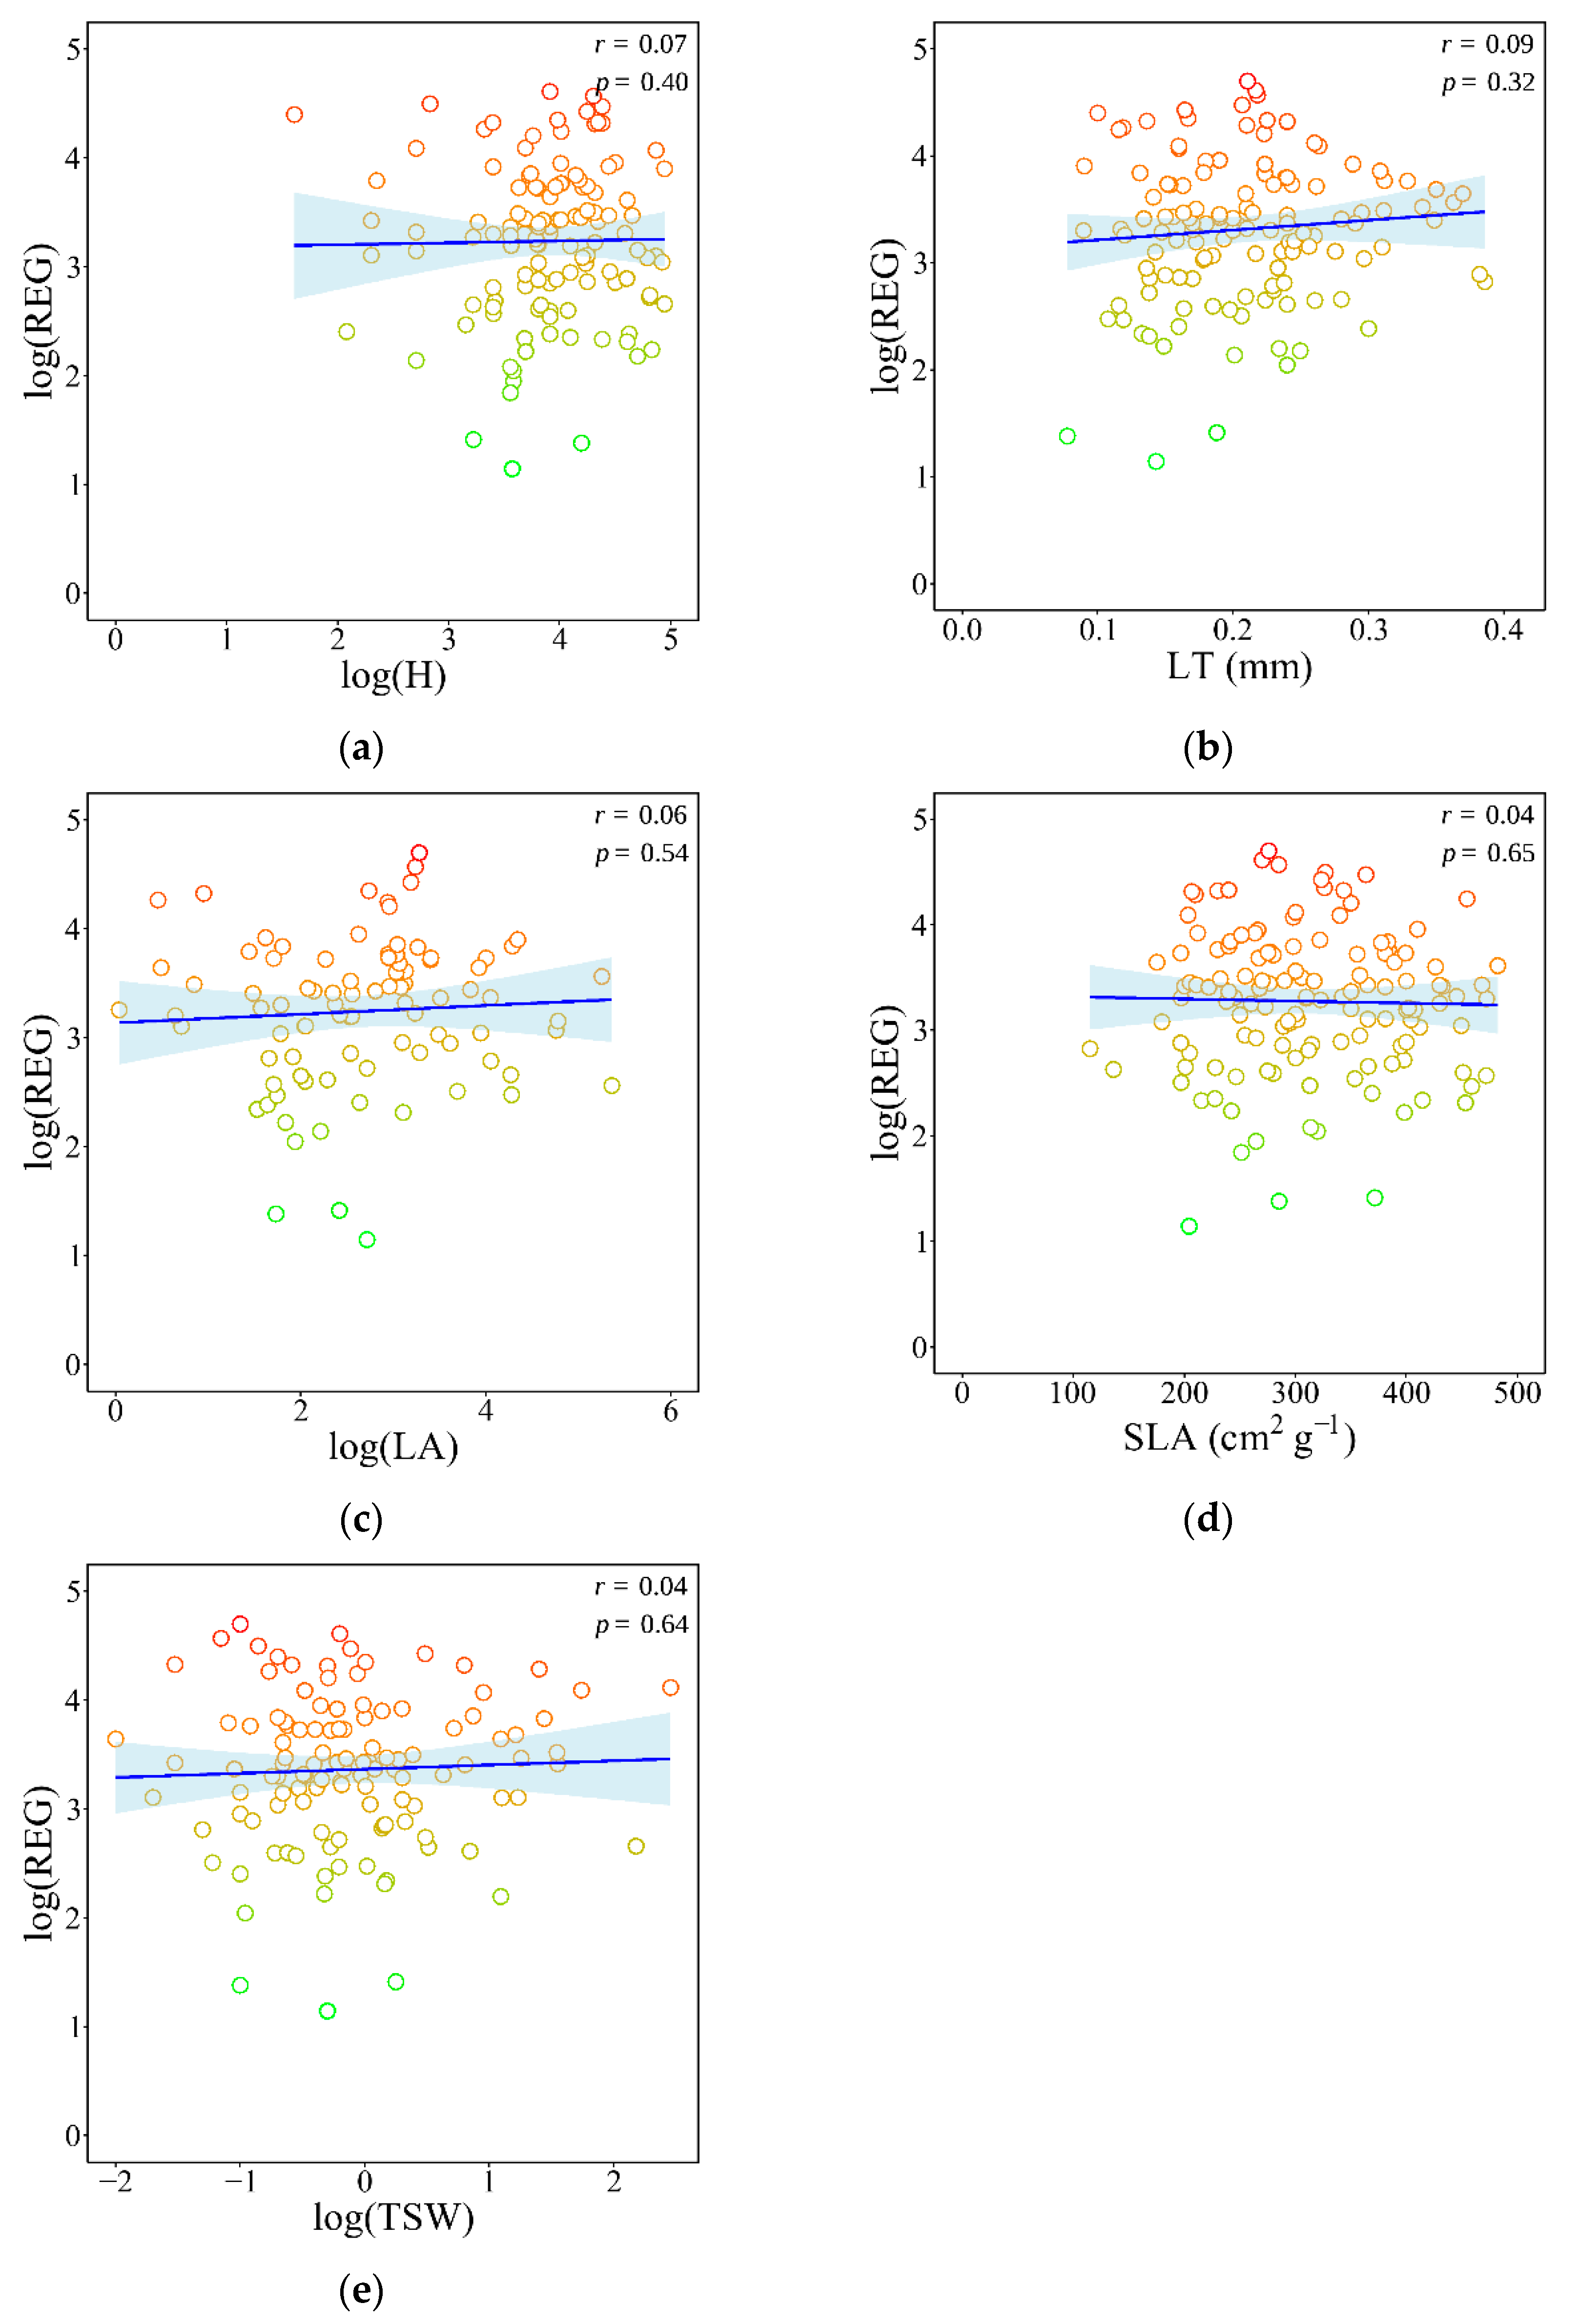
3.1. Associations Between Plant Morphological Traits and Species’ Registrability

None of the analyzed morphological traits showed statistically significant relationships with species’ registrability (log-transformed REG). Specifically, plant height (H), leaf area (LA), specific leaf area (SLA), leaf thickness (LT), and thousand-seed weight (TSW) all exhibited non-significant correlations with registrability (r = 0.07, p = 0.40 for H; r = 0.09, p = 0.32 for LT; r = 0.06, p = 0.54 for LA; r = 0.04, p = 0.65 for SLA; and r = 0.04, p = 0.64 for TSW; Figure 1a–e).

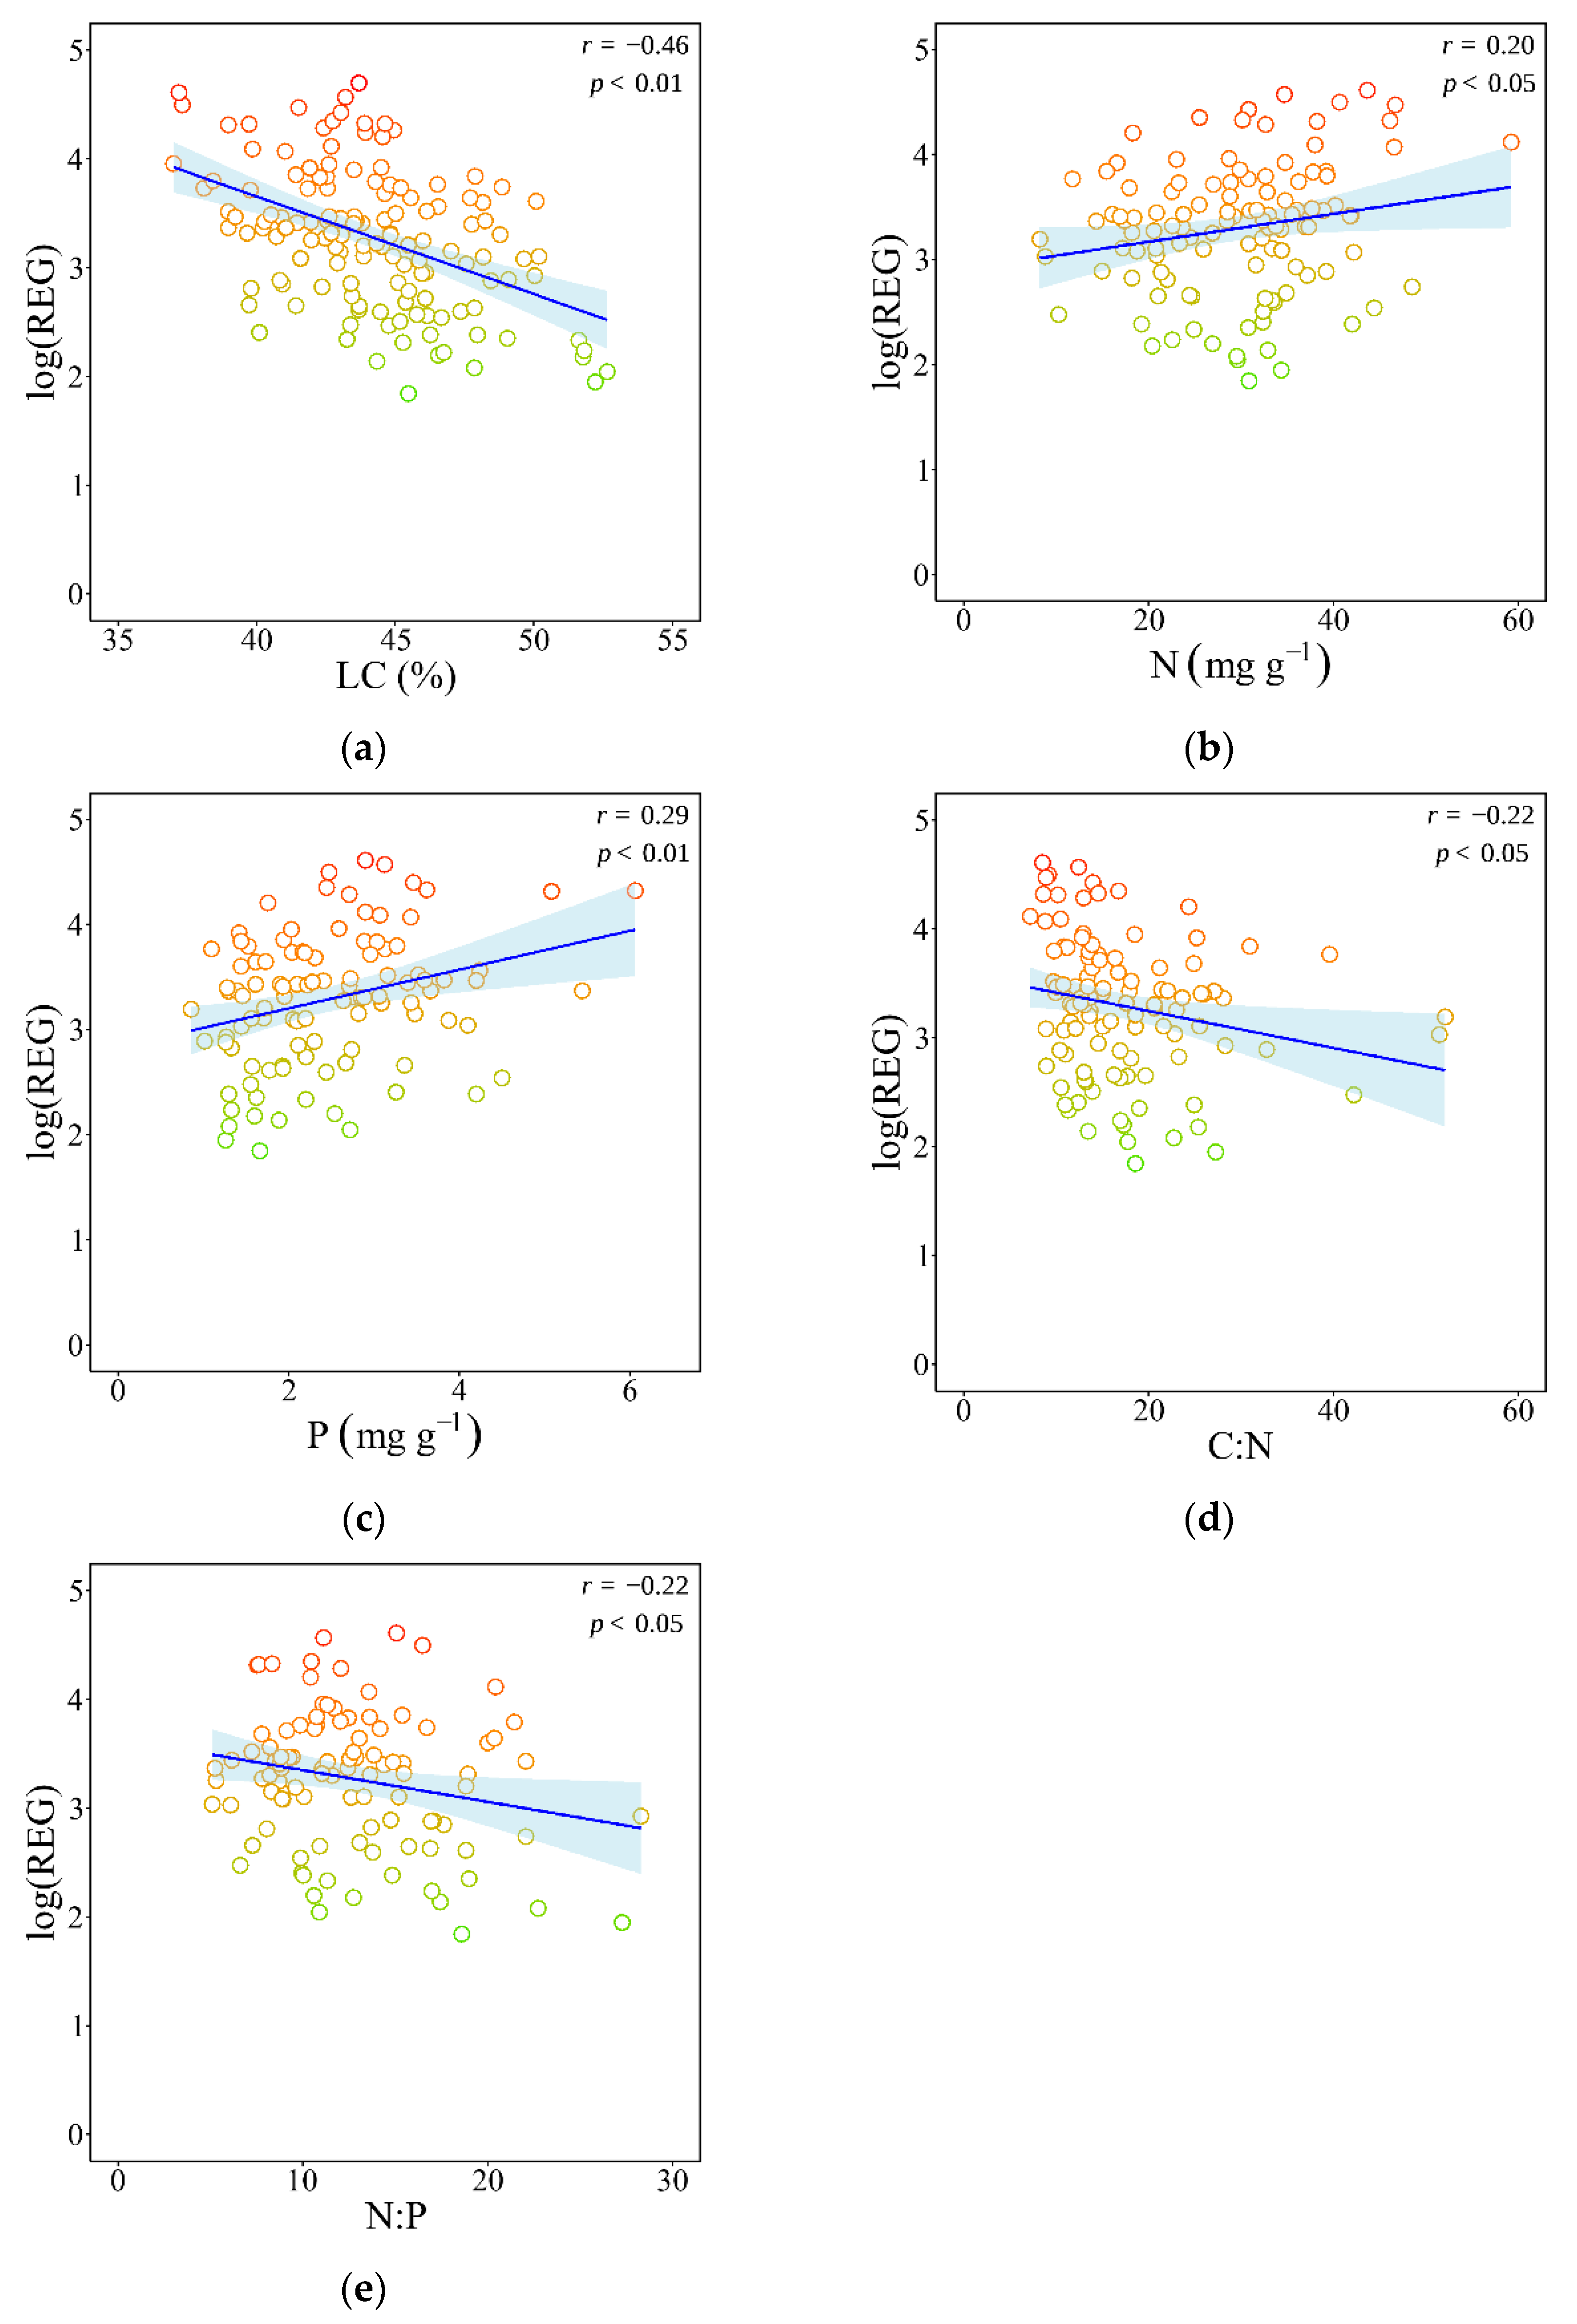
3.2. Associations Between Nutrient-Related Traits and Species’ Registrability

Among the nutrient-related traits examined, leaf carbon content (LC) showed the strongest relationship with species’ registrability (log-transformed REG). Specifically, LC was negatively correlated with REG (r = –0.46, p < 0.01; Figure 2a). Leaf nitrogen (N) and phosphorus (P) contents both displayed significant positive associations with REG. Leaf N was modestly correlated with registrability (r = 0.20, p < 0.05; Figure 2b), while leaf P showed a stronger positive relationship (r = 0.29, p < 0.01; Figure 2c). In contrast, nutrient stoichiometry ratios exhibited negative relationships with REG. The carbon-to-nitrogen (C:N) ratio was negatively associated with REG (r = –0.22, p < 0.05; Figure 2d), as was the nitrogen-to-phosphorus (N:P) ratio (r = –0.22, p < 0.05; Figure 2e).

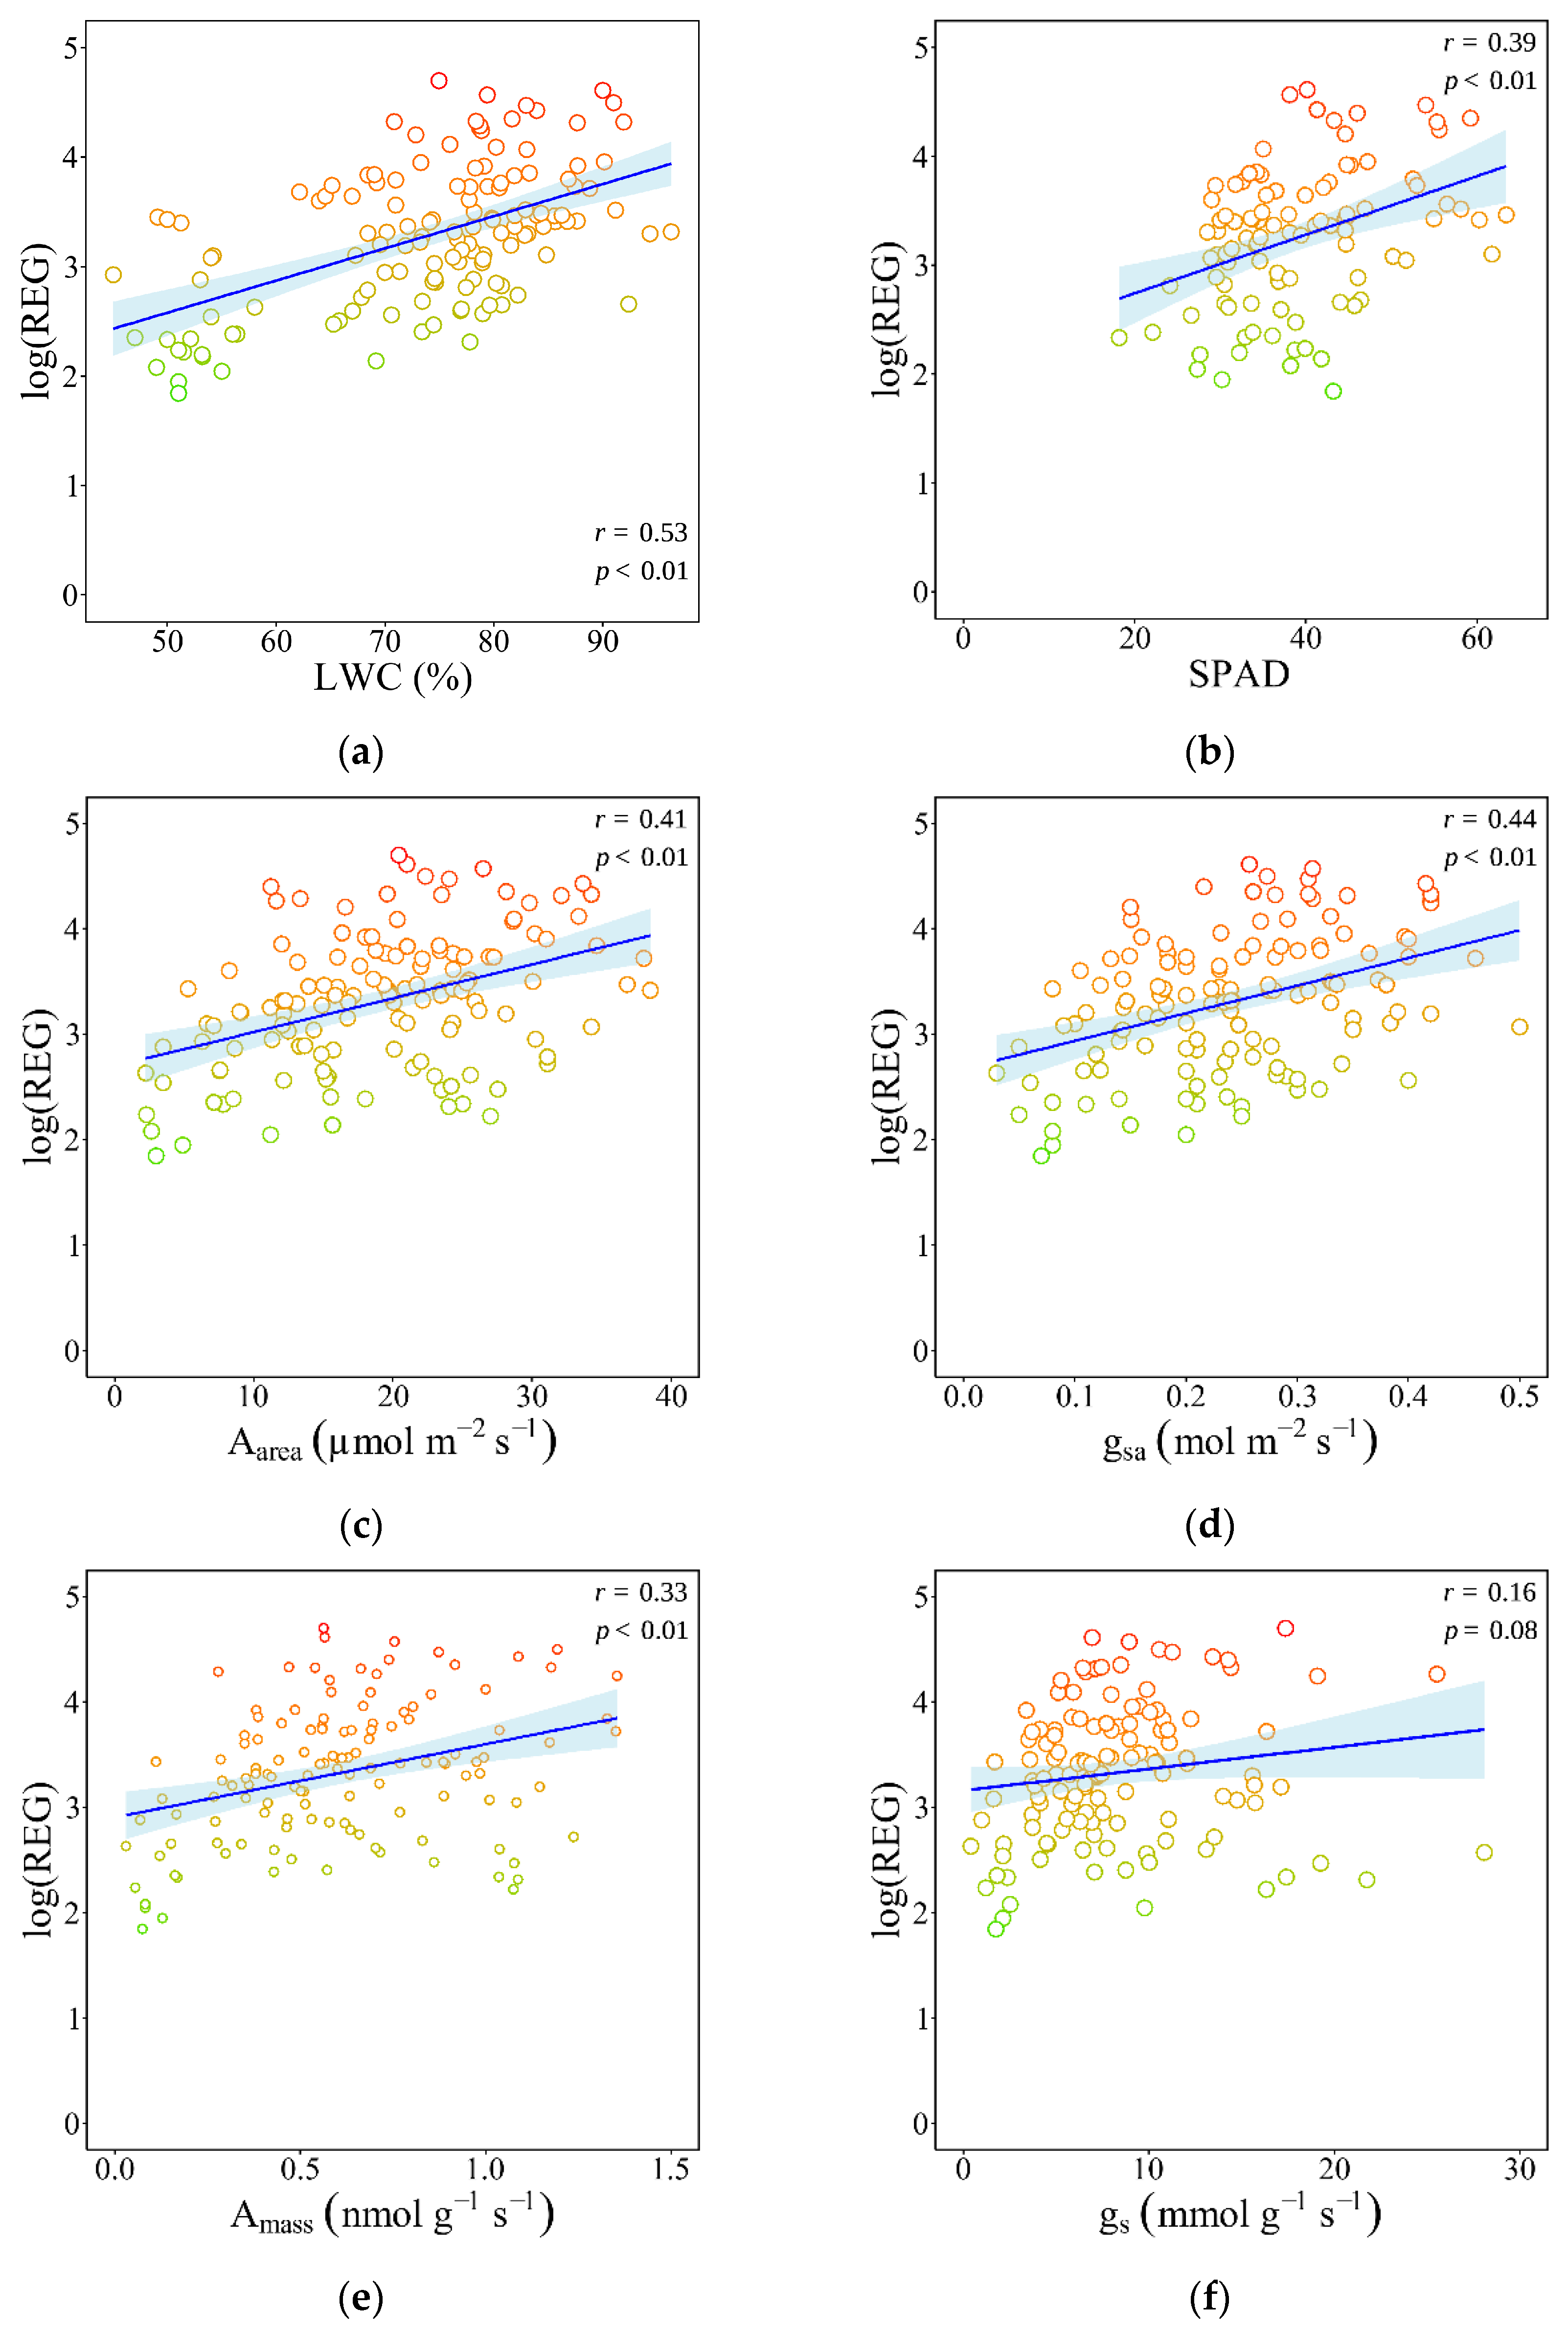
3.3. Associations Between Physiological Traits and Species’ Registrability

Most physiological traits were positively associated with species’ registrability (log-transformed REG). Among these, leaf water content (LWC) exhibited a significantly positive correlation with registrability (r = 0.53, p < 0.01; Figure 3a). Leaf chlorophyll content (SPAD) showed a significantly and relatively strong positive correlation with REG (r = 0.39, p < 0.01; Figure 3b). Area-based photosynthetic rate (Aarea) also exhibited a significantly positive relationship (r = 0.41, p < 0.01; Figure 3c), as did area-based stomatal conductance (gsa, r = 0.44, p < 0.01; Figure 3d). Mass-based photosynthetic rate (Amass) demonstrated a significant but weaker correlation (r = 0.33, p < 0.01; Figure 3e), while mass-based stomatal conductance (gs) was not significantly associated with registrability (r = 0.16, p = 0.08; Figure 3f).

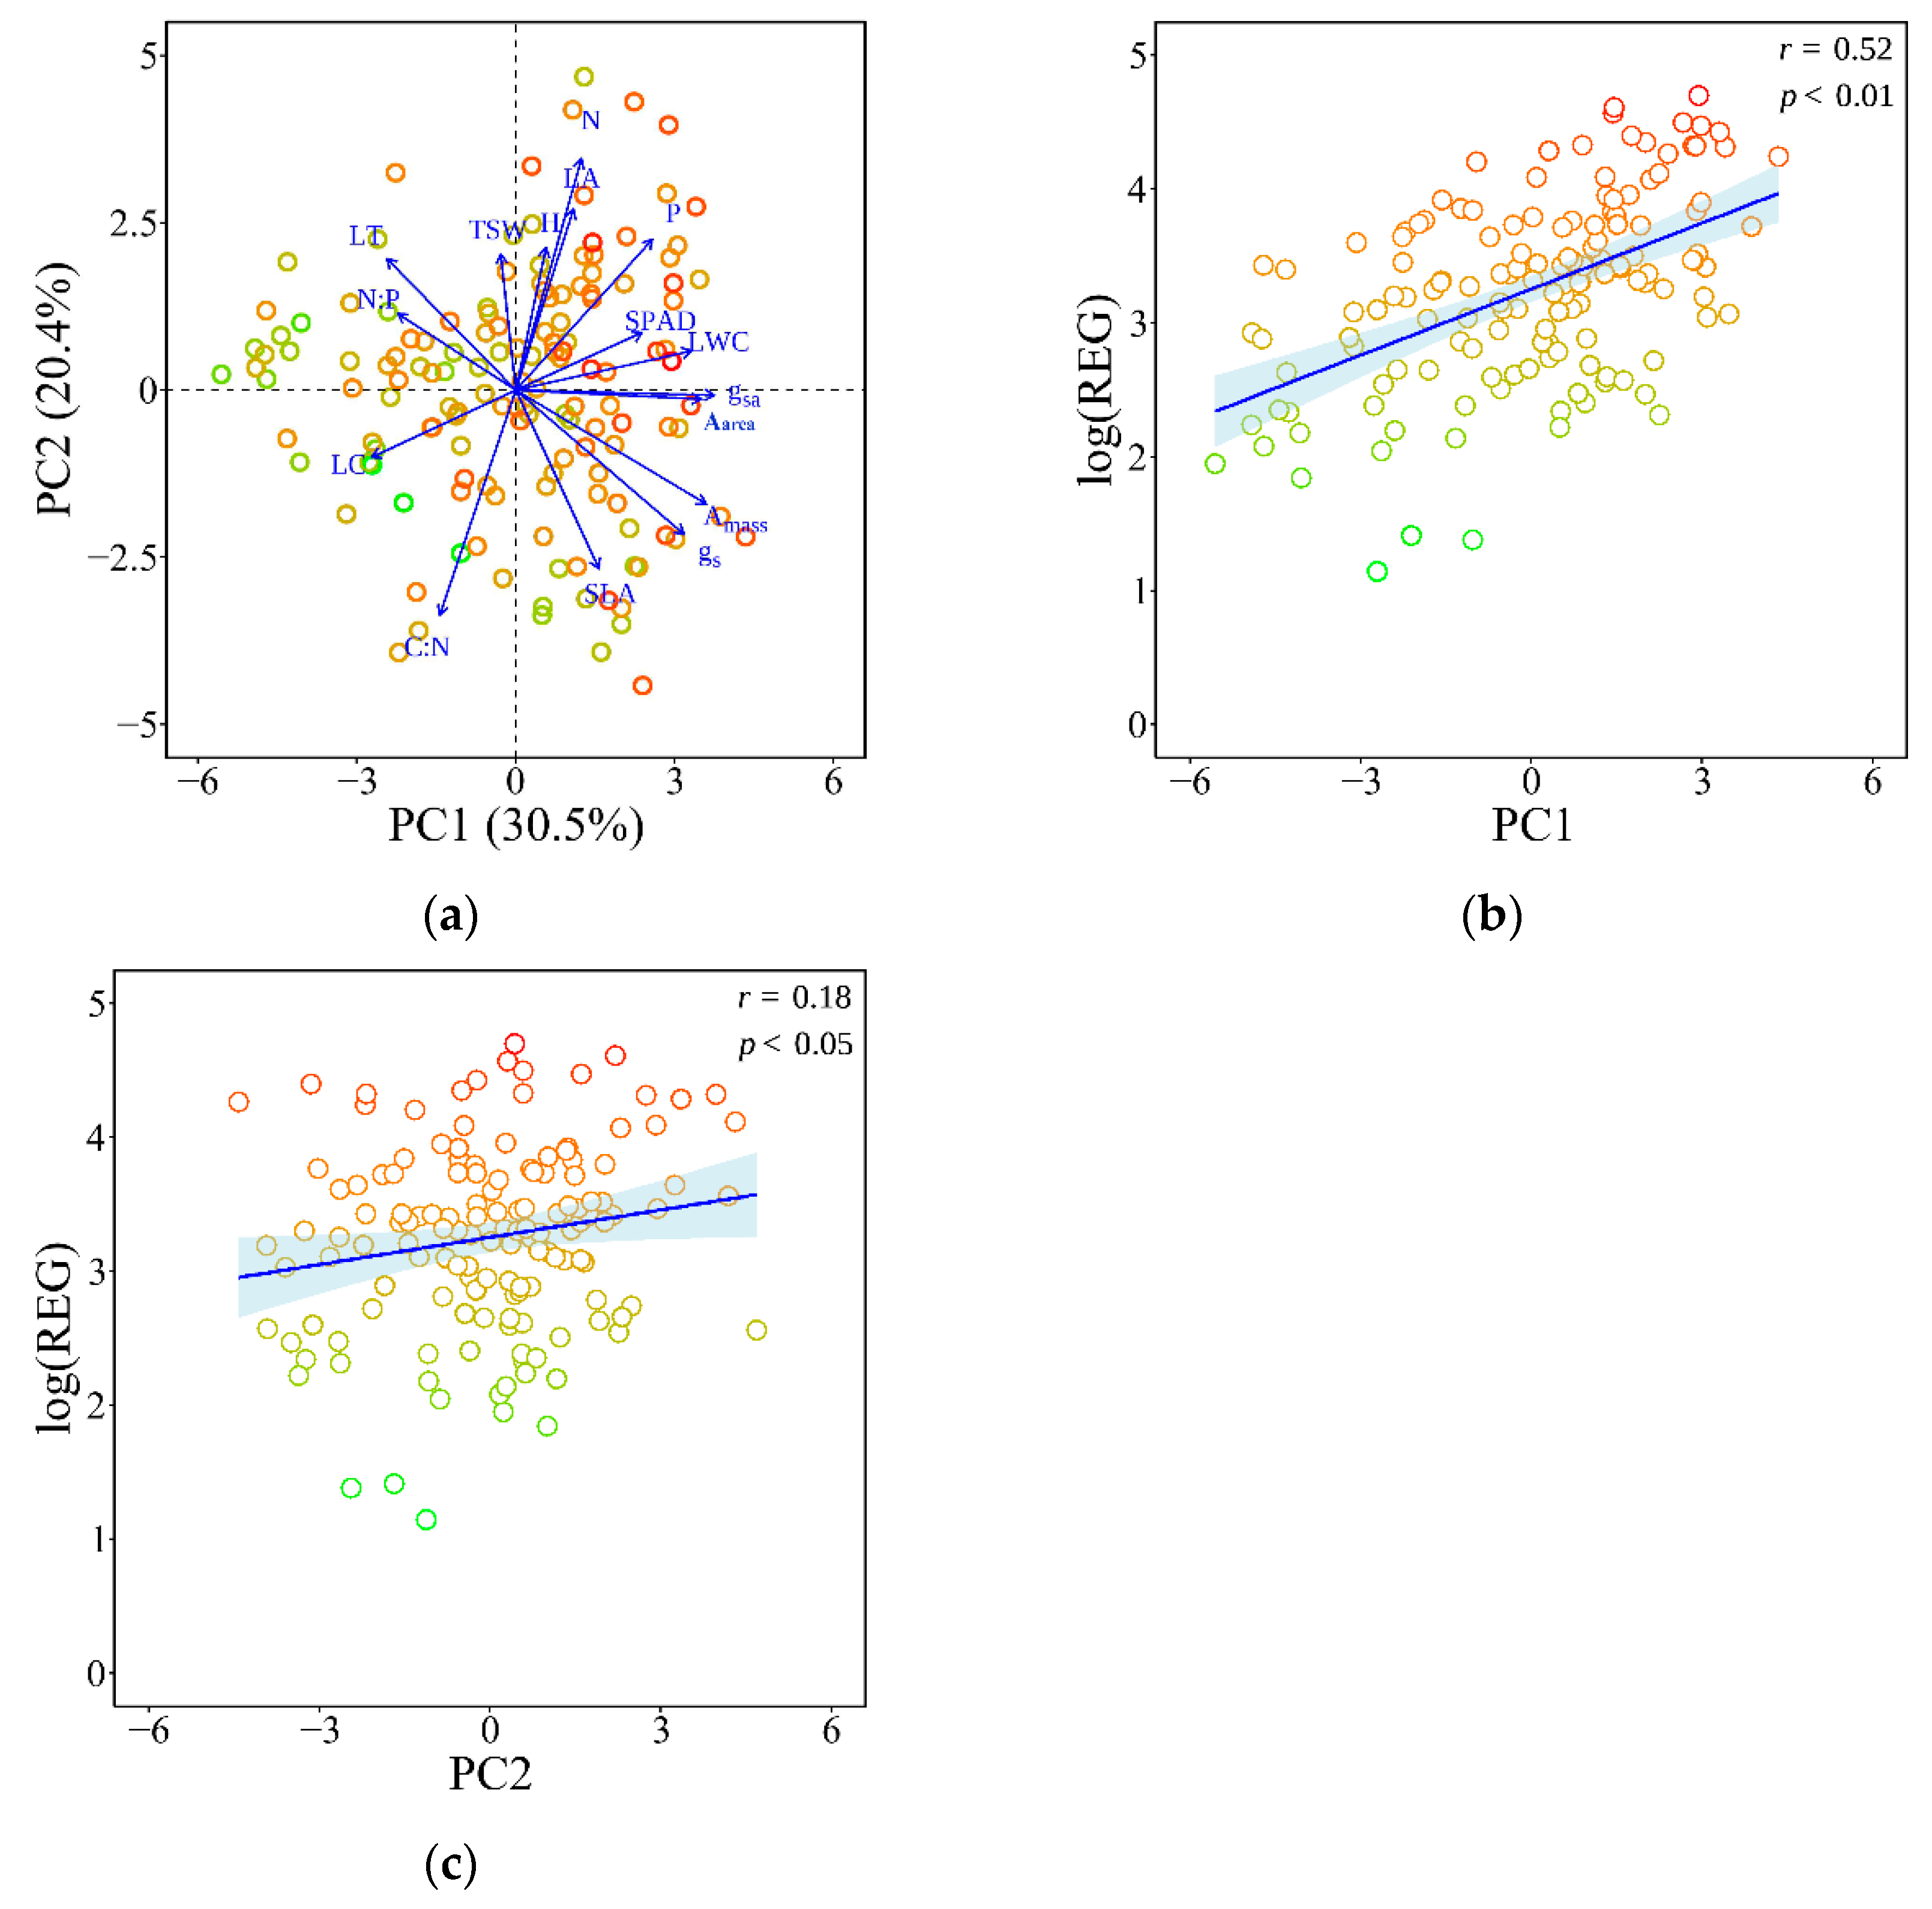
3.4. Trait Syndromes and Registrability Along Principal Component Axes

Principal component analysis (PCA) of 16 functional traits revealed two dominant axes of trait variation (Figure 4a). The first principal component (PC1), which explained 30.5% of the total variance, was positively associated with traits indicative of acquisitive strategies, including high chlorophyll content (SPAD), leaf water content (LWC), and photosynthetic rates. The second principal component (PC2), accounting for 20.4% of the variance, was primarily associated with variation in leaf nutrient content, leaf area (LA), and specific leaf area (SLA). Species scores along PC1 were significantly and positively correlated with REG (r = 0.52, p < 0.01; Figure 4b), while species scores along PC2 also showed a weaker but significant positive correlation with REG (r = 0.18, p < 0.05; Figure 4c).

4. Discussion

Our study demonstrates that functional traits, particularly those associated with resource acquisition strategies, can predict species’ registrability in global biodiversity databases. By linking field-measured traits of 144 herbaceous species to the number of georeferenced GBIF grid cells (as a proxy for registrability), we found consistent trait–registrability associations, both at the individual trait level and along multivariate trait syndromes.

4.1. Morphological Traits and Registrability

We found no significant associations between key morphological traits, such as plant height (H), leaf area (LA), specific leaf area (SLA), leaf thickness (LT), and thousand-seed weight (TSW), and species registrability (REG). This lack of correlation contrasts with some broad-scale studies where plant traits like height and SLA have shown positive links to range size [26], or where small seed mass has been associated with larger distributional ranges [27]. One explanation is that morphological trait effects are often context-dependent and obscured by trait plasticity and scale mismatches. Many of these structural traits can vary greatly within a species across environments—for instance, intraspecific variation can comprise ~25% of total leaf trait variation, and wide-ranging species often exhibit especially high trait variability [28,29,30]. A single-site measurement may not capture a species’ trait values under other climatic or edaphic conditions, weakening any global relationship. Indeed, the utility of global trait patterns (e.g., the leaf economics spectrum) at local scales has been questioned [28], and our results reciprocally suggest that local trait data might not straightforwardly upscale to global species registrability.
Another factor is that different processes govern performance at local vs. global scales. Competition and filtering within local communities may reward certain morphologies (e.g., tall stature or large leaves for light capture), yet those same traits might not constrain a species’ ability to colonize new regions [14]. For example, while a pan-European analysis found that taller herbs and those with higher SLA tend to have larger range sizes [26], our tropical herb dataset did not show this pattern, possibly because most species were short-lived and opportunistic, minimizing height differences. Traits like SLA and leaf area are highly plastic in response to light or moisture, so species can adjust their morphology to local conditions and still persist widely [31,32].

4.2. Nutrient-Related Traits Differentiate Acquisitive Versus Conservative Strategies

In contrast to morphology, nutrient-linked leaf traits showed strong and significant associations with registrability. Species with higher leaf nitrogen (N) and phosphorus (P) were recorded in a greater number of 10 km × 10 km grid cells, whereas those with higher leaf carbon (% C), C:N ratio, and N:P ratio had substantially lower registrability. These patterns suggest that widespread species tend to adopt an “acquisitive” nutrient strategy, investing heavily in N and P to support rapid growth and resource capture. High leaf N and P are hallmarks of the global fast-return syndrome—they correlate with high photosynthetic enzymes and metabolic activity, enabling quick turnover of tissues [33,34]. Our results imply that species with nutrient-rich, easily constructed leaves can thrive across diverse regions (often in disturbed or resource-rich habitats), thus accumulating more occurrence records. By contrast, species with high leaf C content and high C:N (thick, carbon-dense, low-nutrient leaves) exemplify a “conservative” strategy of slow growth and long leaf lifespan [35]. Such species—often stress-tolerators with tough, fibrous foliage—appear limited to specific habitats, leading to fewer grid cells occupied [36,37]. This interpretation is supported by a broad trait study, where species with high leaf carbon had narrower climatic niches [38].
These findings are in line with other research linking leaf economics to distribution. For instance, invasive plants—which often attain broad geographic spreads—generally have higher leaf N and P concentrations and lower tissue C:N compared with non-invasives [39]. Such nutrient-rich leaves confer fast growth and competitive advantage, facilitating colonization of new areas. In our study, even within primarily native flora, the more “ruderal” species (high N, P, low C:N) clearly achieved greater occurrence extents. This underscores that the leaf economic spectrum is not just an abstract axis but has real biogeographical consequences: species at the fast end of the spectrum occupy more grid cells globally, whereas slow-investment species are relatively range-restricted.

4.3. Physiological Traits

In the present study, physiological traits related to gas exchange and water use were also strongly correlated with registrability. Species with higher leaf water content (LWC), greater chlorophyll levels (SPAD), and superior photosynthetic capacity (net assimilation rates expressed per area and per mass, Aarea and Amass) and stomatal conductance (gsa) tended to be documented in more grid cells. These traits collectively point to species that are physiologically vigorous and efficient in resource acquisition. For instance, SPAD values (leaf greenness) are well correlated with leaf N content and photosynthetic potential, so high-SPAD species can attain greater carbon gain, supporting fast growth and reproduction [40]. Similarly, high values of Aarea and Amass mean that a leaf can fix more CO2, either due to high enzyme activity or low cost of leaf construction—traits common in widely distributed “weedy” species [41]. High stomatal conductance complements this by allowing greater gas exchange; species capable of opening stomata widely (and having access to sufficient water) can maximize photosynthesis when conditions are favorable.
It is noteworthy that leaf water content (LWC) may serve as a key physiological determinant of a species’ ability to establish across a broader range of environments. High LWC is typically associated with acquisitive plant strategies, characterized by fast growth, high photosynthetic rates, and rapid turnover of leaf tissues [42]. Species with high LWC often possess thin, hydrated leaves with elevated gas exchange capacity and metabolic activity, which can enhance productivity under favorable conditions [43]. Such traits may enable species to capitalize on transient resource availability and colonize a broad array of habitats, particularly in regions with high environmental variability [44]. Rather than reflecting a conservative water-use strategy, high LWC is more likely to indicate ecological flexibility, allowing for rapid response to fluctuating water regimes or resource pulses. Therefore, LWC may serve as a key integrative trait that reflects the coupling of water relations with photosynthetic performance, ultimately supporting higher species registrability.
In summary, our discussion converges on the idea that locally measured functional traits, especially those associated with resource acquisition, can predict global registrability. Herbaceous species that invest in fast, efficient resource use (high nutrients, high photosynthesis, and high water content) are far more likely to be frequently observed. This overarching conclusion underscores a key principle of plant strategy theory: the same traits that confer rapid growth and colonization ability at the local scale translate into greater success across landscapes and regions. From a functional biogeography perspective, this suggests that mapping trait syndromes could help explain and even predict the geographical spread of species [45].
While our findings reveal clear associations between acquisitive traits and species’ registrability, we caution that this does not imply a direct link to actual geographic distributions. Registrability, derived from GBIF occurrence records, is shaped by strong observational and spatial biases [46]. Generalist, conspicuous, or culturally familiar species—especially those in urban or accessible areas—are more likely to be recorded, while cryptic or habitat-specialist species in remote areas may be underrepresented regardless of true abundance [47]. As such, registrability reflects not only ecological traits but also patterns of human observation. Despite these limitations, our results offer new insights into how functional traits—particularly those align with resource acquisition—shape species’ registrability in global biodiversity datasets. These findings underscore the importance of considering both plant functional traits and observation processes when interpreting large-scale patterns of species occurrence. Species with fast growth, high nutrient content, and strong photosynthetic capacity are consistently recorded more widely, suggesting that these traits enhance both ecological performance and detectability. This highlights the dual role of biological strategy and sampling effort in shaping biodiversity patterns and reinforces the need to consider observation bias when interpreting trait–distribution relationships.

Supplementary Materials

The following supporting information can be downloaded at https://www.mdpi.com/article/10.3390/d17060408/s1.

Author Contributions

Conceptualization, R.L.; methodology, C.W., S.L. and Y.C.; software, R.L.; formal analysis, R.L.; investigation, C.W., Y.C., S.L. and X.L.; data curation, R.L. and C.W.; writing—original draft preparation, C.W., R.L., X.L. and S.L.; visualization, C.W. and R.L.; supervision, writing—review and editing, J.Z.; funding acquisition, R.L. All authors have read and agreed to the published version of the manuscript.

Funding

This research was supported by grants from the Guangzhou Basic and Applied Basic Research Foundation (202201010506), Guangdong Forestry Science and Technology Innovation Project (2022KJCX018), and Guangdong Basic and Applied Basic Research Foundation (2022A1515012157).

Institutional Review Board Statement

Not applicable.

Informed Consent Statement

Not applicable.

Data Availability Statement

The data presented in this study are available on request from the corresponding author.

Conflicts of Interest

The authors declare no conflicts of interest. The funders had no role in the design of the study; in the collection, analyses, or interpretation of data; in the writing of the manuscript; or in the decision to publish the results.

References

  1. Shay, J.E.; Pennington, L.K.; Mandussi Montiel-Molina, J.A.; Toews, D.J.; Hendrickson, B.T.; Sexton, J.P. Rules of Plant Species Ranges: Applications for Conservation Strategies. Front. Ecol. Evol. 2021, 9, 2021. [Google Scholar] [CrossRef]
  2. Murray, B.R.; Lepschi, B.J. Are locally rare species abundant elsewhere in their geographical range? Austral Ecol. 2004, 29, 287–293. [Google Scholar] [CrossRef]
  3. Feng, X.; Peterson, A.T.; Aguirre-López, L.J.; Burger, J.R.; Chen, X.; Papeş, M. Rethinking ecological niches and geographic distributions in face of pervasive human influence in the Anthropocene. Biol. Rev. 2024, 99, 1481–1503. [Google Scholar] [CrossRef]
  4. Gaston, K.J.; Fuller, R.A. The sizes of species’ geographic ranges. J. Appl. Ecol. 2009, 46, 1–9. [Google Scholar] [CrossRef]
  5. Ellis, E.C. Ecology in an anthropogenic biosphere. Ecol. Monogr. 2015, 85, 287–331. [Google Scholar] [CrossRef]
  6. Koffel, T.; Umemura, K.; Litchman, E.; Klausmeier, C.A. A general framework for species-abundance distributions: Linking traits and dispersal to explain commonness and rarity. Ecol. Lett. 2022, 25, 2359–2371. [Google Scholar] [CrossRef]
  7. Mokany, K.; Roxburgh, S.H. The importance of spatial scale for trait–abundance relations. Oikos 2010, 119, 1504–1514. [Google Scholar] [CrossRef]
  8. Li, R.; Zhu, S.; Chen, H.Y.; John, R.; Zhou, G.; Zhang, D.; Zhang, Q.; Ye, Q. Are functional traits a good predictor of global change impacts on tree species abundance dynamics in a subtropical forest? Ecol. Lett. 2015, 18, 1181–1189. [Google Scholar] [CrossRef]
  9. Reich, P.B. The world-wide ‘fast–slow’ plant economics spectrum: A traits manifesto. J. Ecol. 2014, 102, 275–301. [Google Scholar] [CrossRef]
  10. Umaña, M.N.; Zhang, C.; Cao, M.; Lin, L.; Swenson, N.G. Commonness, rarity, and intraspecific variation in traits and performance in tropical tree seedlings. Ecol. Lett. 2015, 18, 1329. [Google Scholar] [CrossRef]
  11. Umaã±A, M.N.; Zhang, C.; Cao, M.; Lin, L.; Swenson, N.G. A core-transient framework for trait-based community ecology: An example from a tropical tree seedling community. Ecol. Lett. 2017, 20, 619–628. [Google Scholar] [CrossRef] [PubMed]
  12. Díaz de León Guerrero, S.D.; González-Rebeles Guerrero, G.; Ibarra-Montes, T.M.; Rodríguez Bastarrachea, A.; Santos Cobos, R.; Bullock, S.H.; Sack, L.; Méndez-Alonzo, R. Functional traits indicate faster resource acquisition for alien herbs than native shrubs in an urban Mediterranean shrubland. Biol. Invasions 2020, 22, 2699–2712. [Google Scholar] [CrossRef]
  13. Dyderski, M.K.; Jagodziński, A.M. Functional traits of acquisitive invasive woody species differ from conservative invasive and native species. NeoBiota 2019, 41, 91–113. [Google Scholar] [CrossRef]
  14. Li, R.; Zhu, S.; Lian, J.; Zhang, H.; Liu, H.; Ye, W.; Ye, Q. Functional Traits Are Good Predictors of Tree Species Abundance Across 101 Subtropical Forest Species in China. Front. Plant Sci. 2021, 12, 541577. [Google Scholar] [CrossRef] [PubMed]
  15. Lisner, A.; Partel, M.; Helm, A.; Prangel, E.; Leps, J. Traits as determinants of species abundance in a grassland community. J. Veg. Sci. 2021, 32, e13041. [Google Scholar] [CrossRef]
  16. Maynard, D.S.; Bialic-Murphy, L.; Zohner, C.M.; Averill, C.; van den Hoogen, J.; Ma, H.; Mo, L.; Smith, G.R.; Acosta, A.T.R.; Aubin, I.; et al. Global relationships in tree functional traits. Nat. Commun. 2022, 13, 3185. [Google Scholar] [CrossRef]
  17. Liao, H.X.; Li, D.J.; Zhou, T.; Huang, B.; Zhang, H.J.; Chen, B.M.; Peng, S.L. The role of functional strategies in global plant distribution. Ecography 2021, 44, 493–503. [Google Scholar] [CrossRef]
  18. Guo, K.; Pysek, P.; van Kleunen, M.; Kinlock, N.L.; Lucanova, M.; Leitch, I.J.; Pierce, S.; Dawson, W.; Essl, F.; Kreft, H.; et al. Plant invasion and naturalization are influenced by genome size, ecology and economic use globally. Nat. Commun. 2024, 15, 1330. [Google Scholar] [CrossRef]
  19. Segrestin, J.; Sartori, K.; Navas, M.L.; Kattge, J.; Diaz, S.; Garnier, E. PhenoSpace: A Shiny application to visualize trait data in the phenotypic space of the global spectrum of plant form and function. Ecol. Evol. 2021, 11, 1526–1534. [Google Scholar] [CrossRef]
  20. Sih, A.; Ferrari, M.C.; Harris, D.J. Evolution and behavioural responses to human-induced rapid environmental change. Evol. Appl. 2011, 4, 367–387. [Google Scholar] [CrossRef]
  21. Zenni, R.D.; Bailey, J.K.; Simberloff, D. Rapid evolution and range expansion of an invasive plant are driven by provenance-environment interactions. Ecol. Lett. 2014, 17, 727–735. [Google Scholar] [CrossRef] [PubMed]
  22. Rubio, V.E. Chapter 4—Traits, occurrence, and abundance of plants. In Plant Functional Traits; Kumar, M., Bussmann, R.W., Swenson, N.G., Eds.; Elsevier: Amsterdam, The Netherlands, 2025; pp. 43–55. [Google Scholar]
  23. Loranger, J.; Munoz, F.; Shipley, B.; Violle, C. What makes trait-abundance relationships when both environmental filtering and stochastic neutral dynamics are at play? Oikos 2018, 127, 1735–1745. [Google Scholar] [CrossRef]
  24. Spaak, J.; Schreiber, S. Building modern coexistence theory from the ground up: The role of community assembly. Ecol. Lett. 2023, 26, 1840–1861. [Google Scholar] [CrossRef]
  25. Chen, Y.; Xie, Y.; Wei, C.; Liu, S.; Liang, X.; Zhang, J.; Li, R. Invasive Plant Species Demonstrate Enhanced Resource Acquisition Traits Relative to Native Non-Dominant Species but not Compared with Native Dominant Species. Diversity 2024, 16, 317. [Google Scholar] [CrossRef]
  26. Sporbert, M.; Welk, E.; Seidler, G.; Jandt, U.; Aćić, S.; Biurrun, I.; Campos, J.A.; Čarni, A.; Cerabolini, B.E.L.; Chytrý, M.; et al. Different sets of traits explain abundance and distribution patterns of European plants at different spatial scales. J. Veg. Sci. 2021, 32, e13016. [Google Scholar] [CrossRef]
  27. Sonkoly, J.; Deak, B.; Valko, O.; Molnar, V.A.; Tothmeresz, B.; Torok, P. Do large-seeded herbs have a small range size? The seed mass-distribution range trade-off hypothesis. Ecol. Evol. 2017, 7, 11204–11212. [Google Scholar] [CrossRef] [PubMed]
  28. Westerband, A.C.; Funk, J.L.; Barton, K.E. Intraspecific trait variation in plants: A renewed focus on its role in ecological processes. Ann. Bot. 2021, 127, 397–410. [Google Scholar] [CrossRef]
  29. Barabás, G.; Parent, C.; Kraemer, A.; Van de Perre, F.; De Laender, F. The evolution of trait variance creates a tension between species diversity and functional diversity. Nat. Commun. 2022, 13, 2521. [Google Scholar] [CrossRef]
  30. Yang, J.; Cao, M.; Swenson, N.G. Why Functional Traits Do Not Predict Tree Demographic Rates. Trends Ecol. Evol. 2018, 33, 326–336. [Google Scholar] [CrossRef]
  31. Wright, I.J.; Dong, N.; Maire, V.; Prentice, I.C.; Westoby, M.; Diaz, S.; Gallagher, R.V.; Jacobs, B.F.; Kooyman, R.; Law, E.A.; et al. Global climatic drivers of leaf size. Science 2017, 357, 917–921. [Google Scholar] [CrossRef]
  32. Martin, A.R.; Rapidel, B.; Roupsard, O.; Van den Meersche, K.; de Melo Virginio Filho, E.; Barrios, M.; Isaac, M.E. Intraspecific trait variation across multiple scales: The leaf economics spectrum in coffee. Funct. Ecol. 2017, 31, 604–612. [Google Scholar] [CrossRef]
  33. Craine, J.M.; Dybzinski, R. Mechanisms of plant competition for nutrients, water and light. Funct. Ecol. 2013, 27, 833–840. [Google Scholar] [CrossRef]
  34. Tilman, D. The resource-ratio hypothesis of plant succession. Am. Nat. 1985, 125, 827–852. [Google Scholar] [CrossRef]
  35. Zhu, S.-D.; Li, R.-H.; Song, J.; He, P.-C.; Liu, H.; Berninger, F.; Ye, Q. Different leaf cost–benefit strategies of ferns distributed in contrasting light habitats of sub-tropical forests. Ann. Bot. 2016, 117, 497–506. [Google Scholar] [CrossRef]
  36. Osnas, J.L.D.; Lichstein, J.W.; Reich, P.B.; Pacala, S.W. Global leaf trait relationships: Mass, area, and the leaf economics spectrum. Science 2013, 340, 741–744. [Google Scholar] [CrossRef] [PubMed]
  37. Onoda, Y.; Westoby, M.; Adler, P.B.; Choong, A.M.; Clissold, F.J.; Cornelissen, J.H.; Diaz, S.; Dominy, N.J.; Elgart, A.; Enrico, L.; et al. Global patterns of leaf mechanical properties. Ecol. Lett. 2011, 14, 301–312. [Google Scholar] [CrossRef]
  38. Medeiros, C.D.; Henry, C.; Trueba, S.; Anghel, I.; Guerrero, S.D.D.d.L.; Pivovaroff, A.; Fletcher, L.R.; John, G.P.; Lutz, J.A.; Méndez Alonzo, R.; et al. Predicting plant species climate niches on the basis of mechanistic traits. Funct. Ecol. 2023, 37, 2786–2808. [Google Scholar] [CrossRef]
  39. Leishman, M.R.; Haslehurst, T.; Ares, A.; Baruch, Z. Leaf trait relationships of native and invasive plants: Community- and global-scale comparisons. New Phytol. 2007, 176, 635–643. [Google Scholar] [CrossRef]
  40. Croft, H.; Chen, J.M.; Wang, R.; Mo, G.; Luo, S.; Luo, X.; He, L.; Gonsamo, A.; Arabian, J.; Zhang, Y.; et al. The global distribution of leaf chlorophyll content. Remote Sens. Environ. 2020, 236, 111479. [Google Scholar] [CrossRef]
  41. Zhu, S.-D.; Song, J.-J.; Li, R.-H.; Ye, Q. Plant hydraulics and photosynthesis of 34 woody species from different successional stages of subtropical forests. Plant Cell Environ. 2013, 36, 879–891. [Google Scholar] [CrossRef]
  42. Wang, Z.; Huang, H.; Wang, H.; Peñuelas, J.; Sardans, J.; Niinemets, Ü.; Niklas, K.J.; Li, Y.; Xie, J.; Wright, I.J. Leaf water content contributes to global leaf trait relationships. Nat. Commun. 2022, 13, 5525. [Google Scholar] [CrossRef] [PubMed]
  43. Kursar, T.A.; Engelbrecht, B.M.; Burke, A.; Tyree, M.T.; EI Omari, B.; Giraldo, J.P. Tolerance to low leaf water status of tropical tree seedlings is related to drought performance and distribution. Funct. Ecol. 2009, 23, 93–102. [Google Scholar] [CrossRef]
  44. Smart, S.M.; Glanville, H.C.; Blanes, M.d.C.; Mercado, L.M.; Emmett, B.A.; Jones, D.L.; Cosby, B.J.; Marrs, R.H.; Butler, A.; Marshall, M.R. Leaf dry matter content is better at predicting above-ground net primary production than specific leaf area. Funct. Ecol. 2017, 31, 1336–1344. [Google Scholar] [CrossRef]
  45. Violle, C.; Reich, P.B.; Pacala, S.W.; Enquist, B.J.; Kattge, J. The emergence and promise of functional biogeography. Proc. Natl. Acad. Sci. USA 2014, 111, 13690–13696. [Google Scholar] [CrossRef]
  46. Beck, J.; Böller, M.; Erhardt, A.; Schwanghart, W. Spatial bias in the GBIF database and its effect on modeling species’ geographic distributions. Ecol. Inform. 2014, 19, 10–15. [Google Scholar] [CrossRef]
  47. Hughes, A.C.; Orr, M.C.; Ma, K.; Costello, M.J.; Waller, J.; Provoost, P.; Yang, Q.; Zhu, C.; Qiao, H. Sampling biases shape our view of the natural world. Ecography 2021, 44, 1259–1269. [Google Scholar] [CrossRef]
Figure 1. Relationships between plant morphological traits and species’ registrability (log-transformed REG): (a) log-transformed plant height (H, cm); (b) leaf thickness (LT, mm); (c) log-transformed leaf area (LA, cm2); (d) specific leaf area (SLA, cm2 g−1); (e) log-transformed thousand-seed weight (TSW, g). Each point represents a species; point color represents registrability from low (green) to high (red). Blue line in each panel indicates the fitted linear regression line, and the shading around the fitted line represents the 95% confidence intervals. r represents the Pearson correlation coefficient, and p denotes the statistical significance of the correlation.
Diversity 17 00408 g001
Figure 2. Relationships between leaf nutrient-related traits and species’ registrability (log-transformed REG). (a) Leaf carbon content (LC, %); (b) leaf nitrogen content (N, mg g−1); (c) leaf phosphorus content (P, mg g−1); (d) leaf carbon/nitrogen ratio (C:N); (e) leaf nitrogen/phosphorus ratio (N:P). Each point represents a species; point color represents registrability from low (green) to high (red). Blue line in each panel indicates the fitted linear regression line, and the shading around the fitted line represents the 95% confidence intervals. r represents the Pearson correlation coefficient, and p denotes the statistical significance of the correlation.
Diversity 17 00408 g002
Figure 3. Relationships between physiological traits and species’ registrability (log-transformed REG). (a) Leaf water content (LWC, %); (b) leaf chlorophyll content (SPAD); (c) maximum photosynthetic rate per area (Aarea, μmol m−2 s−1); (d) maximum stomatal conductance per area (gsa, mol m−2 s−1); (e) maximum photosynthetic rate per mass (Amass, μmol g−1 s−1); (f) maximum stomatal conductance per mass (gs, mmol g−1 s−1). Each point represents a species; point color represents registrability from low (green) to high (red). Blue line in each panel indicates the fitted linear regression line, and the shading around the fitted line represents the 95% confidence intervals. r represents the Pearson correlation coefficient, and p denotes the statistical significance of the correlation.
Diversity 17 00408 g003
Figure 4. Principal component analysis (PCA) of 16 functional traits measured across 144 herbaceous plant species. (a) Biplot showing species scores (colored points scaled by log-transformed registrability, REG) and trait loadings on the first two principal components (PC1 and PC2). (b,c) Linear relationships between species scores on PC1 (b) and PC2 (c) and their log-transformed registrability (log(REG)). r and p values represent Pearson correlation coefficients and their significance levels. Each point represents a species; point color represents registrability from low (green) to high (red). Blue line in each panel indicates the fitted linear regression line, and the shading around the fitted line represents the 95% confidence intervals. r represents the Pearson correlation coefficient, and P denotes the statistical significance of the correlation.
Diversity 17 00408 g004
Disclaimer/Publisher’s Note: The statements, opinions and data contained in all publications are solely those of the individual author(s) and contributor(s) and not of MDPI and/or the editor(s). MDPI and/or the editor(s) disclaim responsibility for any injury to people or property resulting from any ideas, methods, instructions or products referred to in the content.

