


Comparative Mitochondrial Features Across Characiformes (Teleostei: Ostariophysi) and Mitogenomic Architecture of Nematobrycon lacortei

Abstract
1. Introduction
2. Materials and Methods
2.1. Sample Collection and DNA Extraction
2.2. Next-Generation Sequencing
2.3. Annotation and Sequence Analysis
2.4. Phylogenetic Analysis
3. Results and Discussion
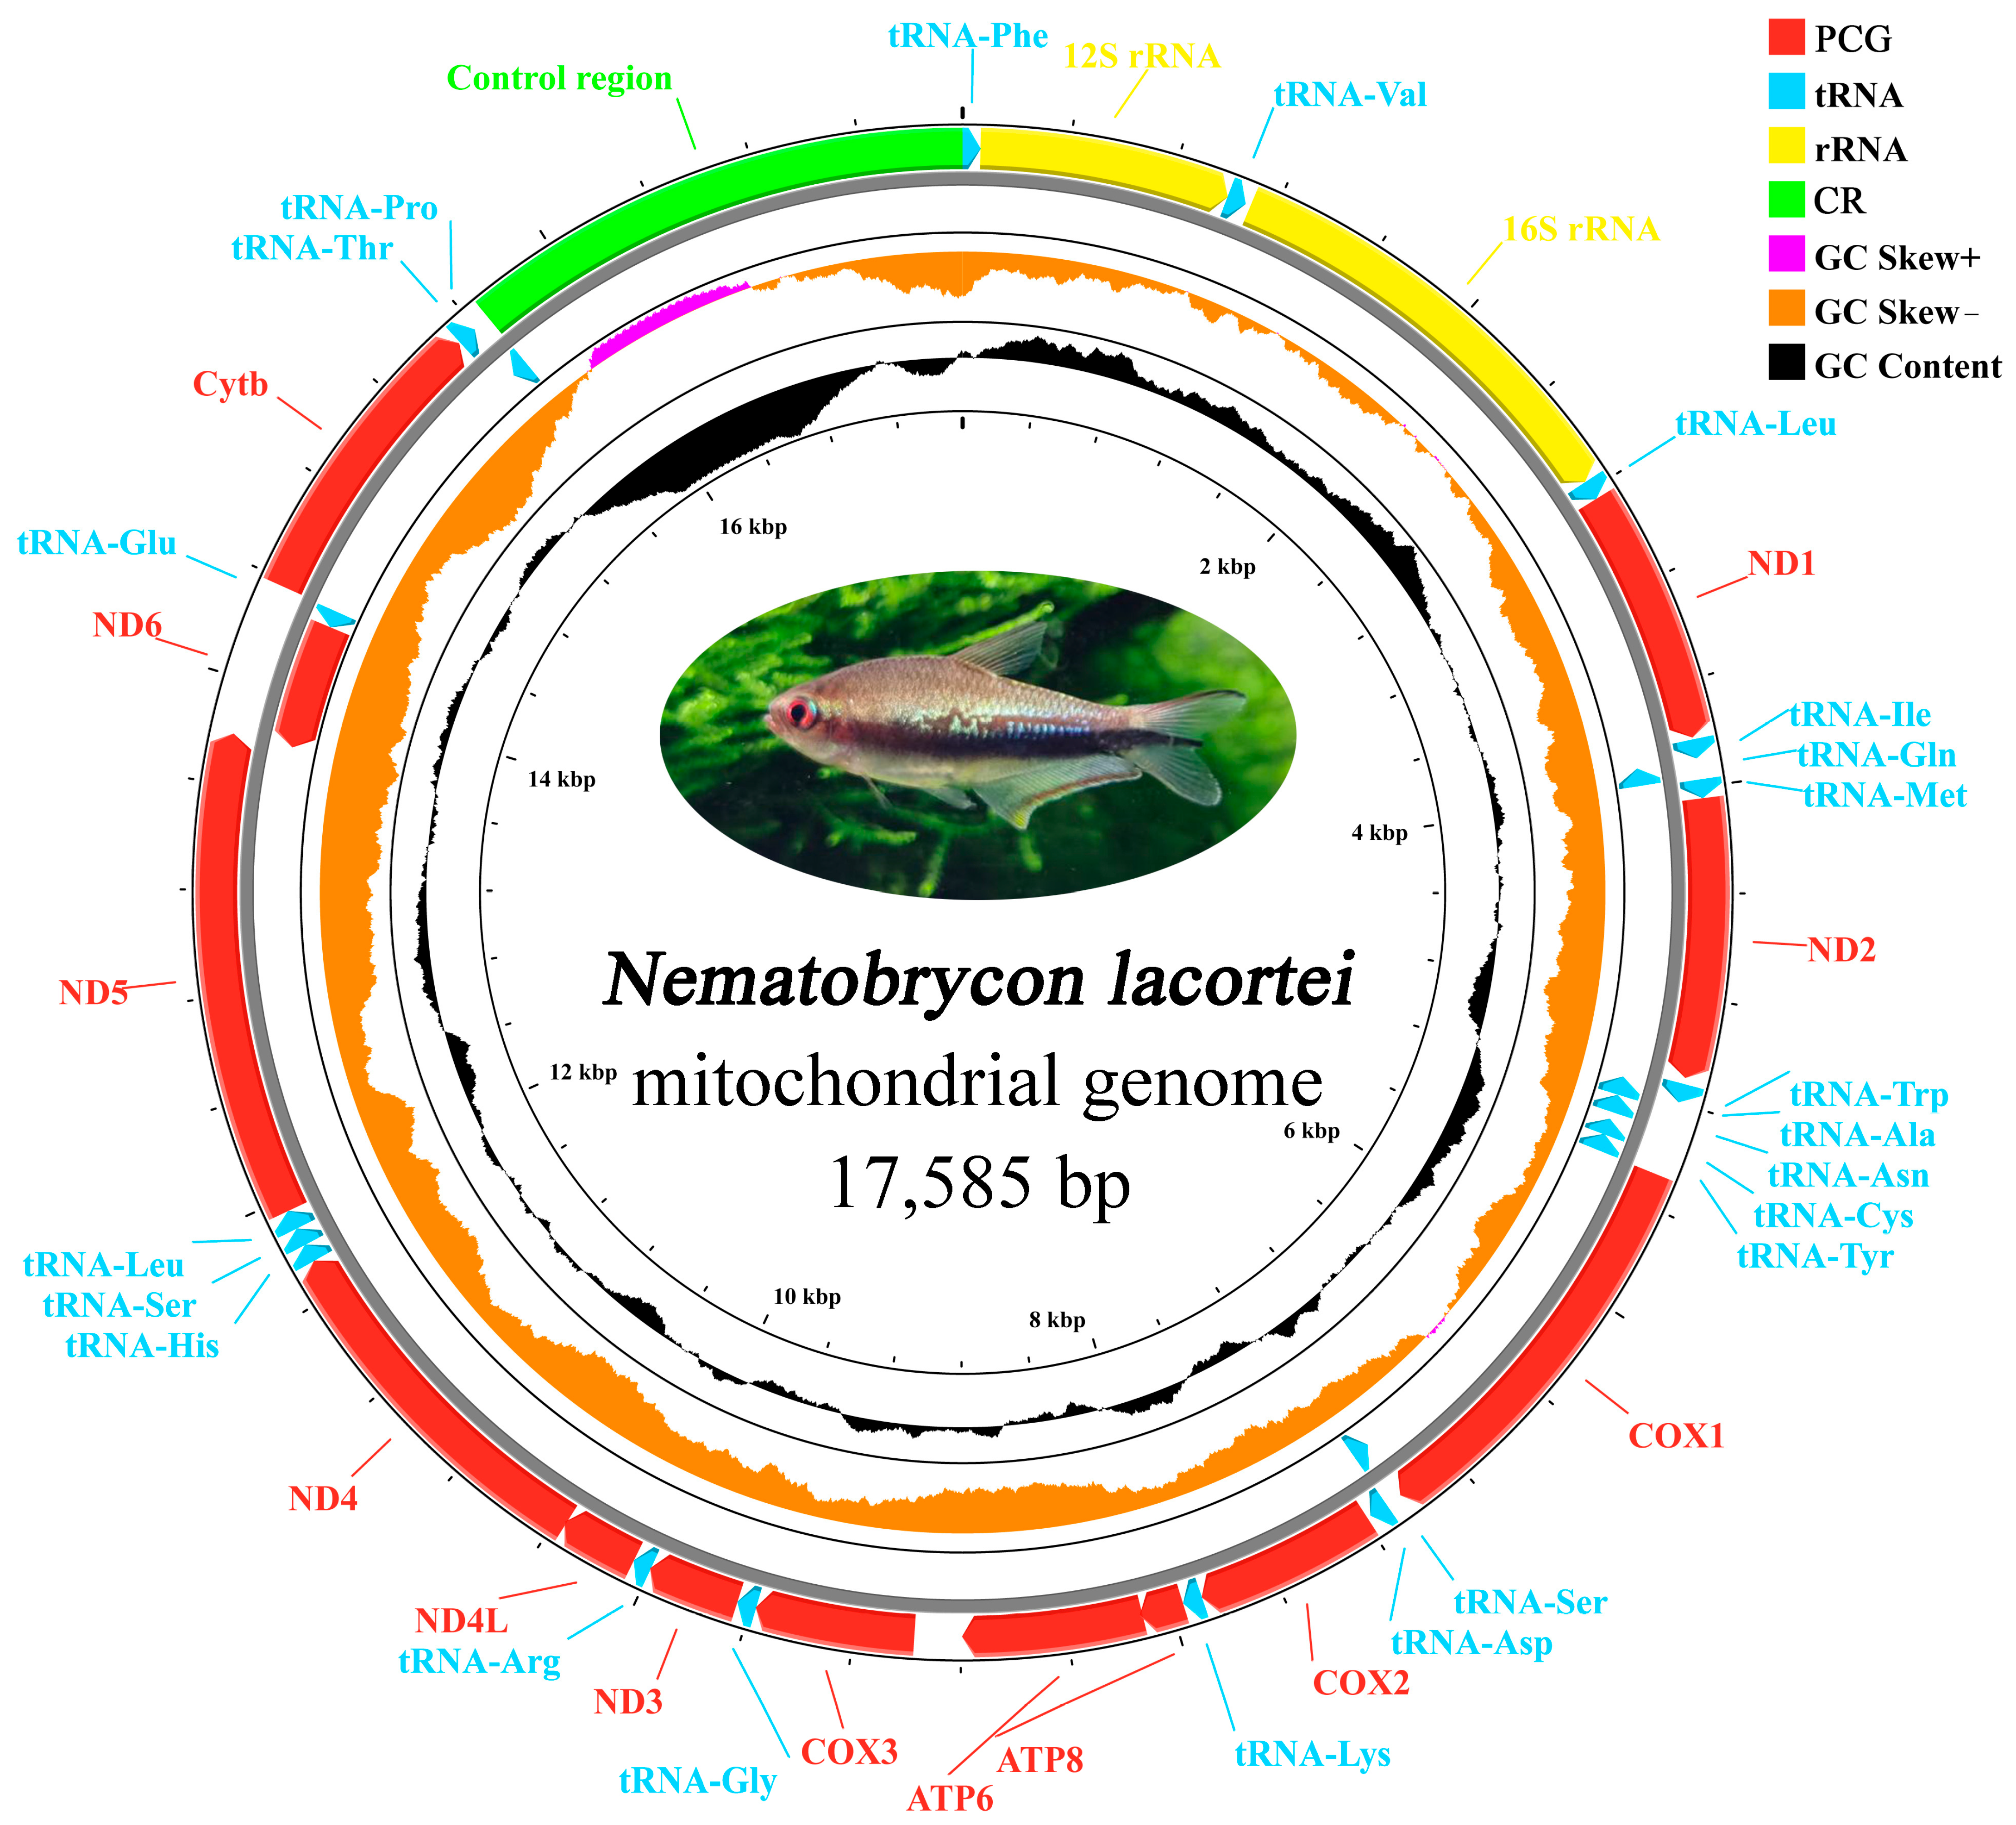
3.1. Mitochondrial Genome Organization
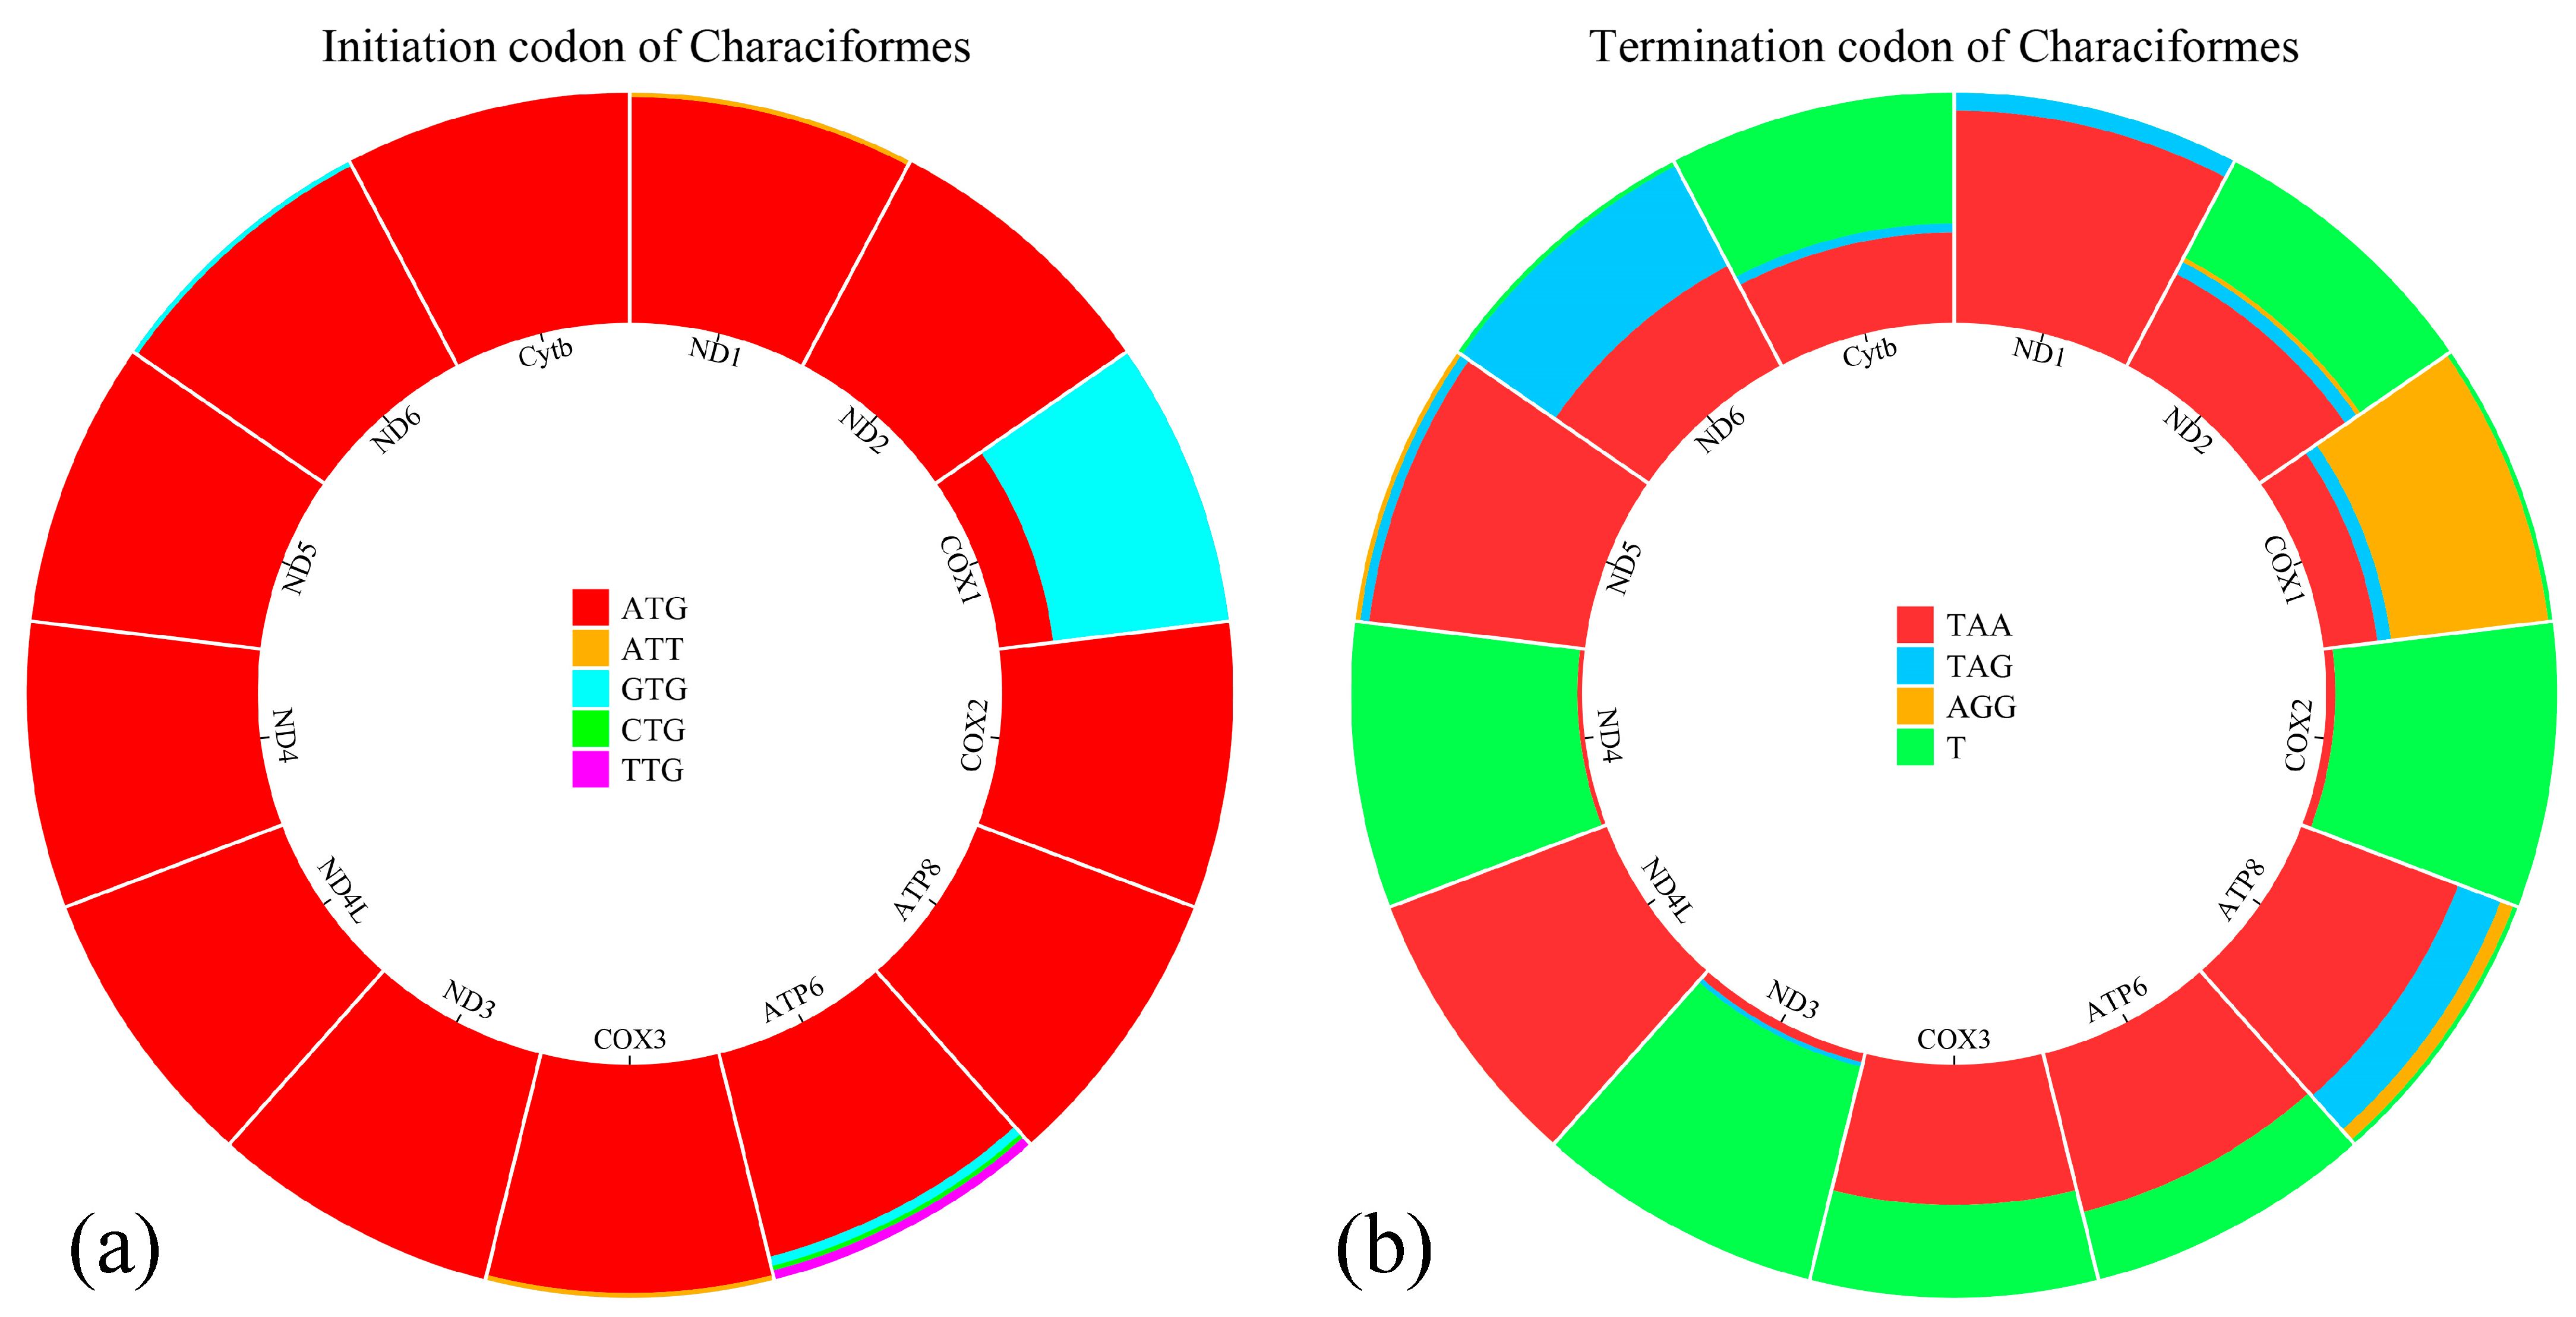
3.2. Protein-Coding Genes and Codon Usage
3.3. Transfer RNA, Ribosomal RNA Genes, and Control Region
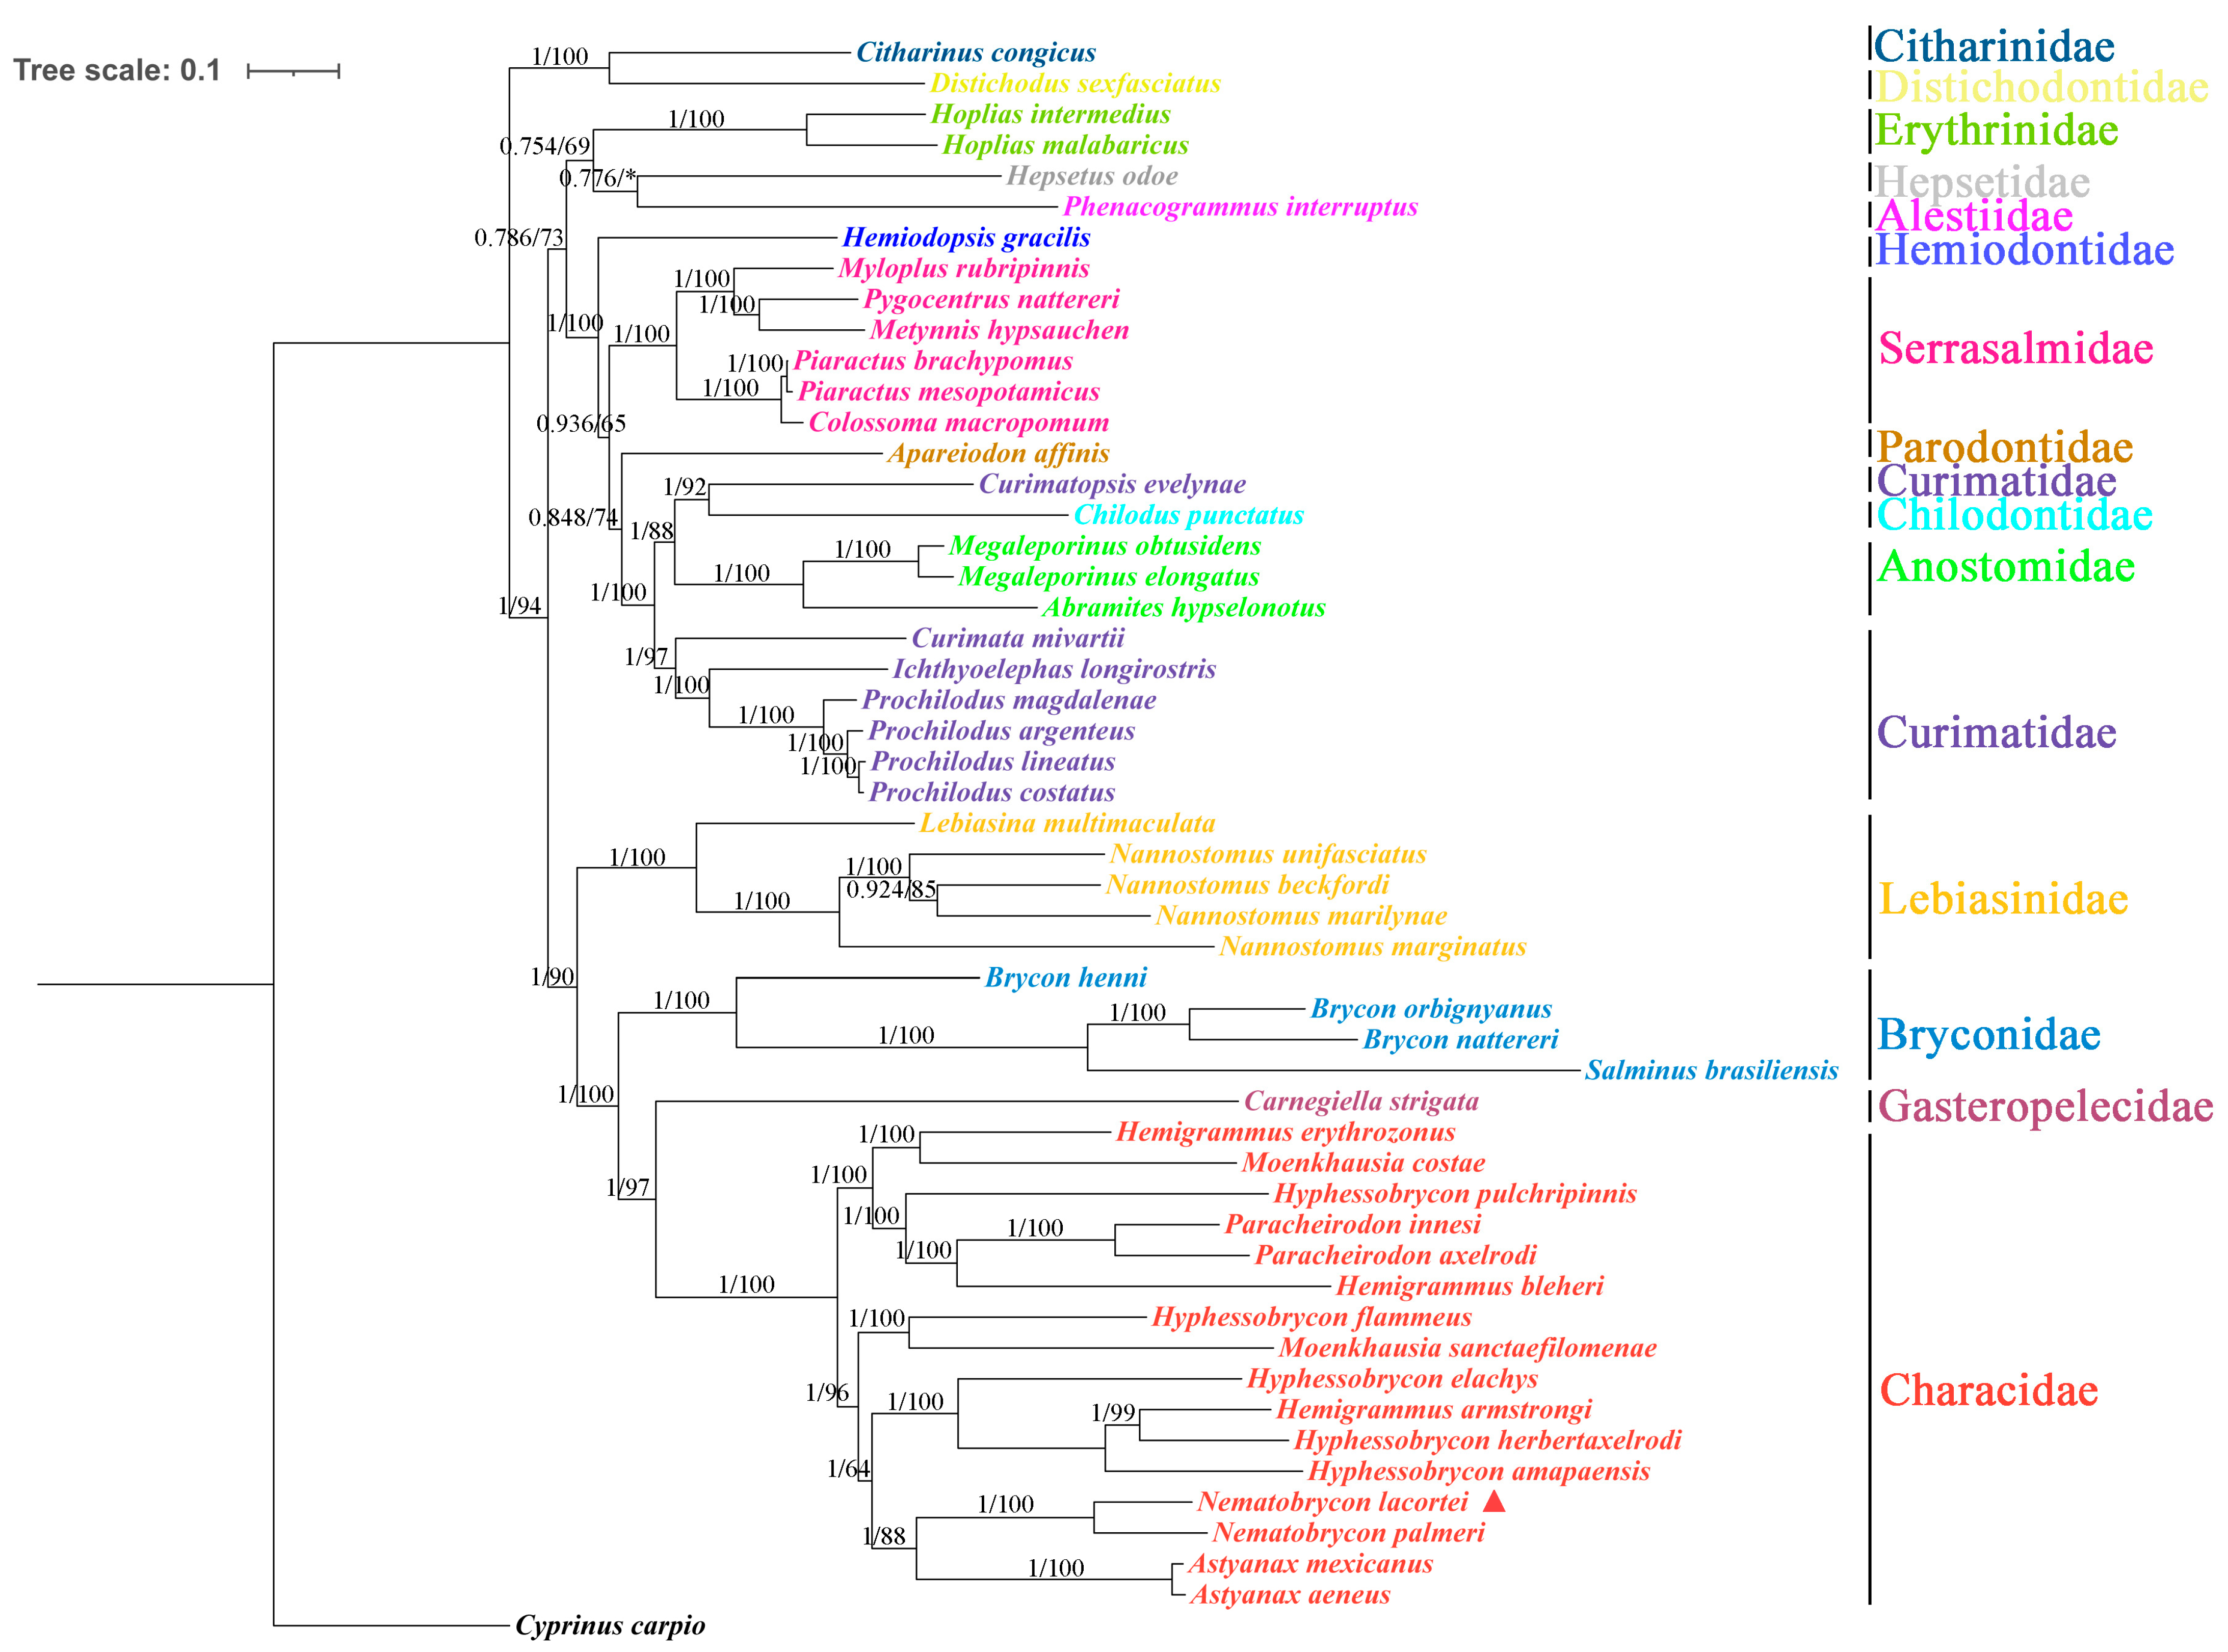
3.4. Phylogenetic Analyses
Author Contributions
Funding
Institutional Review Board Statement
Data Availability Statement
Conflicts of Interest
References
- Dhanda, A.; Hubbard, L.; Goyal, N. Digest: Habitat and competition drive diversification in Gondwanan fish. Evolution 2024, 78, 1020–1021. [Google Scholar] [CrossRef] [PubMed]
- Oliveira, C.; Avelino, G.S.; Abe, K.T.; Mariguela, T.C.; Benine, R.C.; Ortí, G.; Vari, R.P.; Castro, R.M.C. Phylogenetic relationships within the speciose family Characidae (Teleostei: Ostariophysi: Characiformes) based on multilocus analysis and extensive ingroup sampling. BMC Evol. Biol. 2011, 11, 275. [Google Scholar] [CrossRef] [PubMed]
- Calazans, A.M.; Martinez, P.A.; Jacobina, U.P. Lentic and lotic environments affect morphological diversity in characiformes fishes in the Neotropical São Francisco River Basin, Brazil. Environ. Biol. Fishes 2021, 104, 977–987. [Google Scholar] [CrossRef]
- Taylor, B.W.; Flecker, A.S.; Hall, R.O. Loss of a Harvested Fish Species Disrupts Carbon Flow in a Diverse Tropical River. Science 2006, 313, 833–836. [Google Scholar] [CrossRef]
- Mirande, J.M. Morphology, molecules and the phylogeny of Characidae (Teleostei, Characiformes). Cladistics 2019, 35, 282–300. [Google Scholar] [CrossRef]
- Sosale, M.S.; Songsasen, N.; İbiş, O.; Edwards, C.W.; Figueiró, H.V.; Koepfli, K. The complete mitochondrial genome and phylogenetic characterization of two putative subspecies of golden jackal (Canis aureus cruesemanni and Canis aureus moreotica). Gene 2023, 866, 147303. [Google Scholar] [CrossRef]
- Niu, Y.; Shi, F.; Li, X.; Zhang, S.; Xu, Y.; Tao, J.; Li, M.; Zhao, Y.; Zong, S. Comparative Mitochondrial Genomic Analysis of Longhorn Beetles (Coleoptera: Chrysomeloidea) with Phylogenetic Implications. Arthropod Syst. Phylogeny 2024, 82, 133–150. [Google Scholar] [CrossRef]
- Zhang, G.; Gao, M.; Chen, Y.; Wang, Y.; Gan, T.; Zhu, F.; Liu, H. The First Complete Mitochondrial Genome of the Genus Litostrophus: Insights into the Rearrangement and Evolution of Mitochondrial Genomes in Diplopoda. Genes 2024, 15, 254. [Google Scholar] [CrossRef]
- Zhang, G.; Xu, T.; Chen, Y.; Xu, W.; Wang, Y.; Li, Y.; Zhu, F.; Liu, H.; Ruan, H. Complete Mitochondrial Genomes of Nedyopus patrioticus: New Insights into the Color Polymorphism of Millipedes. Curr. Issues Mol. Biol. 2024, 46, 2514–2527. [Google Scholar] [CrossRef]
- Kang, Z.; Xu, Y.; Wang, G.; Yang, D.; Zhang, X. First mitochondrial genomes of the crane fly tribe Elephantomyiini (Diptera, Tipuloidea, Limoniidae): Comparative analysis and phylogenetic implications. Arthropod Syst. Phylogeny 2023, 81, 731–746. [Google Scholar] [CrossRef]
- Schierup, M.H.; Hein, J. Consequences of Recombination on Traditional Phylogenetic Analysis. Genetics 2000, 156, 879–891. [Google Scholar] [CrossRef] [PubMed]
- Hisano, H.; Tsujimura, M.; Yoshida, H.; Terachi, T.; Sato, K. Mitochondrial genome sequences from wild and cultivated barley (Hordeum vulgare). BMC Genom. 2016, 17, 824. [Google Scholar] [CrossRef] [PubMed]
- Sweet, A.D.; Johnson, K.P.; Cao, Y.; Moya, R.S.; Skinner, R.K.; Tan, M.; Herrera, S.V.; Cameron, S.L. Structure, gene order, and nucleotide composition of mitochondrial genomes in parasitic lice from Amblycera. Gene 2021, 768, 145312. [Google Scholar] [CrossRef] [PubMed]
- Powell, A.F.L.A.; Barker, F.K.; Lanyon, S.M. Empirical evaluation of partitioning schemes for phylogenetic analyses of mitogenomic data: An avian case study. Mol. Phylogenet. Evol. 2013, 66, 69–79. [Google Scholar] [CrossRef] [PubMed]
- Wang, Q.; Zhang, T.; Yin, X.L.; Meng, F.; Huang, Y.K.; Liu, B.J.; Liu, Y.F. The complete mitochondrial genome of Nematobrycon palmeri (Characiformes: Nematobrycon) and phylogenetic studies of Characidaes. Mitochondrial DNA Part B 2020, 5, 3492–3493. [Google Scholar] [CrossRef]
- Marchler-Bauer, A.; Bryant, S.H. CD-Search: Protein domain annotations on the fly. Nucleic Acids Res. 2004, 32, W327–W331. [Google Scholar] [CrossRef]
- Bernt, M.; Donath, A.; Jühling, F.; Externbrink, F.; Florentz, C.; Fritzsch, G.; Pütz, J.; Middendorf, M.; Stadler, P.F. MITOS: Improved de novo metazoan mitochondrial genome annotation. Mol. Phylogenetics Evol. 2013, 69, 313–319. [Google Scholar] [CrossRef]
- Grant, J.R.; Stothard, P. The CGView Server: A comparative genomics tool for circular genomes. Nucleic Acids Res. 2008, 36, W181–W184. [Google Scholar] [CrossRef]
- Perna, N.T.; Kocher, T.D. Patterns of nucleotide composition at fourfold degenerate sites of animal mitochondrial genomes. J. Mol. Evol. 1995, 41, 353–358. [Google Scholar] [CrossRef]
- Kumar, S.; Stecher, G.; Suleski, M.; Sanderford, M.; Sharma, S.; Tamura, K. MEGA12: Molecular Evolutionary Genetic Analysis Version 12 for Adaptive and Green Computing. Mol. Biol. Evol. 2024, 41, msae263. [Google Scholar] [CrossRef]
- Zhang, D.; Gao, F.; Jakovlic, I.; Zou, H.; Zhang, J.; Li, W.X.; Wang, G.T. PhyloSuite: An integrated and scalable desktop platform for streamlined molecular sequence data management and evolutionary phylogenetics studies. Mol. Ecol. Resour. 2020, 20, 348–355. [Google Scholar] [CrossRef] [PubMed]
- Lowe, T.M.; Chan, P.P. tRNAscan-SE On-line: Search and Contextual Analysis of Transfer RNA Genes. Nucleic Acids Res. 2016, 44, W54–W57. [Google Scholar] [CrossRef] [PubMed]
- Katoh, K.; Standley, D.M. MAFFT multiple sequence alignment software version 7: Improvements in performance and usability. Mol. Biol. Evol. 2013, 30, 772–780. [Google Scholar] [CrossRef] [PubMed]
- Kalyaanamoorthy, S.; Minh, B.Q.; Wong, T.K.F.; von Haeseler, A.; Jermiin, L.S. ModelFinder: Fast model selection for accurate phylogenetic estimates. Nat. Methods 2017, 14, 587–589. [Google Scholar] [CrossRef]
- Ronquist, F.; Teslenko, M.; Mark, P.; Ayres, D.L.; Darling, A.; Höhna, S.; Larget, B.; Liu, L.; Suchard, M.A.; Huelsenbeck, J.P. MrBayes 3.2: Efficient Bayesian phylogenetic inference and model choice across a large model space. Syst. Biol. 2012, 61, 539–542. [Google Scholar] [CrossRef]
- Nguyen, L.T.; Schmidt, H.A.; von Haeseler, A.; Minh, B.Q. IQ-TREE: A fast and effective stochastic algorithm for estimating maximum-likelihood phylogenies. Mol. Biol. Evol. 2015, 32, 268–274. [Google Scholar] [CrossRef]
- Letunic, I.; Bork, P. Interactive Tree Of Life (iTOL) v5: An online tool for phylogenetic tree display and annotation. Nucleic Acids Res. 2021, 49, W293–W296. [Google Scholar] [CrossRef]
- Meng, F.; Huang, Y.; Liu, B.; Zhu, K.; Zhang, J.; Jing, F.; Xia, L.; Liu, Y. The complete mitochondrial genome of Lebiasina astrigata (Characiformes: Lebiasinida) and phylogenetic studies of Characiformes. Mitochondrial DNA Part B 2019, 4, 579–580. [Google Scholar] [CrossRef]
- Pasa, R.; Menegídio, F.B.; Rodrigues-Oliveira, I.H.; da Silva, I.B.; de Campos, M.L.C.B.; Rocha-Reis, D.A.; Heslop-Harrison, J.S.; Schwarzacher, T.; Kavalco, K.F. Ten Complete Mitochondrial Genomes of Gymnocharacini (Stethaprioninae, Characiformes). Insights Into Evolutionary Relationships and a Repetitive Element in the Control Region (D-loop). Front. Ecol. Evol. 2021, 9, 650783. [Google Scholar] [CrossRef]
- Rodriguez, D.N.; Lucio, N.; Costa, M.A.; Resende, L.; Martins, A.P.V.; Alves, C.B.M.; Carmo, A.O.; Kalapothakis, E. Complete mitochondrial DNA of Hoplias intermedius (Günther, 1864) (Ostariophysi: Characiformes: Erythrinidae). Mitochondrial DNA Part B 2016, 1, 742–743. [Google Scholar] [CrossRef]
- Wang, Q.; Miao, Z.; Chen, J.; Huang, Y.; Meng, F.; Zhu, K.; Liu, B.; Liu, Y. The complete mitochondrial genome of Hemigrammus bleheri (Characiformes: Hemigrammus) and phylogenetic studies of Characiformes. Mitochondrial DNA Part B 2019, 4, 3834–3835. [Google Scholar] [CrossRef] [PubMed]
- Hurst, L.D. The Ka/Ks ratio: Diagnosing the form of sequence evolution. Trends Genet. 2002, 18, 486–487. [Google Scholar] [CrossRef] [PubMed]
- Hassanin, A.; Léger, N.; Deutsch, J. Evidence for multiple reversals of asymmetric mutational constraints during the evolution of the mitochondrial genome of Metazoa, and consequences for phylogenetic inferences. Syst. Biol. 2005, 54, 277–298. [Google Scholar] [CrossRef] [PubMed]
- Xu, W.; Tai, J.; He, K.; Xu, T.; Zhang, G.; Xu, B.; Liu, H. Complete Mitochondrial Genomes of Nannostomus Pencilfish: Genome Characterization and Phylogenetic Analysis. Animals 2024, 14, 1598. [Google Scholar] [CrossRef]
- Melo, B.F.; Ochoa, L.E.; Vari, R.P.; Oliveira, C. Cryptic species in the Neotropical fish genus Curimatopsis (Teleostei, Characiformes). Zool. Scr. 2016, 45, 650–658. [Google Scholar] [CrossRef]
- Javonillo, R.; Malabarba, L.R.; Weitzman, S.H.; Burns, J.R. Relationships among major lineages of characid fishes (Teleostei: Ostariophysi: Characiformes), based on molecular sequence data. Mol. Phylogenet. Evol. 2010, 54, 498–511. [Google Scholar] [CrossRef]


| Order | Family | Species | Size (bp) | Accession No. |
|---|---|---|---|---|
| Characiformes | Alestiidae | Phenacogrammus interruptus | 16,652 | AB054129.1 |
| Anostomidae | Abramites hypselonotus | 16,685 | MW541938.1 | |
| Megaleporinus elongatus | 16,774 | KU980144.1 | ||
| Megaleporinus obtusidens | 16,682 | KY825191.1 | ||
| Bryconidae | Brycon henni | 16,885 | KP027535.1 | |
| Brycon nattereri | 16,837 | MT428073.1 | ||
| Brycon orbignyanus | 16,802 | KY825192.1 | ||
| Salminus brasiliensis | 17,721 | KM245047.1 | ||
| Characidae | Astyanax aeneus | 16,769 | BK013055.1 | |
| Astyanax mexicanus | 16,768 | BK013062.1 | ||
| Hemigrammus armstrongi | 16,789 | MW742324.1 | ||
| Hemigrammus bleheri | 17,021 | LC074360.1 | ||
| Hemigrammus erythrozonus | 16,710 | MT484070.1 | ||
| Hyphessobrycon amapaensis | 17,824 | MW742322.1 | ||
| Hyphessobrycon elachys | 17,224 | MW315747.1 | ||
| Hyphessobrycon flammeus | 16,008 | MW315748.1 | ||
| Hyphessobrycon herbertaxelrodi | 17,417 | MT769327.1 | ||
| Hyphessobrycon pulchripinnis | 17,618 | MW331227.1 | ||
| Moenkhausia costae | 15,811 | MW366831.1 | ||
| Moenkhausia sanctaefilomenae | 18,437 | MW407181.1 | ||
| Nematobrycon lacortei | 17,585 | PP760379 | ||
| Nematobrycon palmeri | 17,340 | MN861079.1 | ||
| Paracheirodon axelrodi | 17,100 | AB898197.1 | ||
| Paracheirodon innesi | 16,962 | KT783482.1 | ||
| Chilodontidae | Chilodus punctatus | 16,869 | AP011984.1 | |
| Citharinidae | Citharinus congicus | 16,453 | AP011985.1 | |
| Curimatidae | Curimata mivartii | 16,705 | KP025764.1 | |
| Curimatopsis evelynae | 16,779 | AP011988.1 | ||
| Ichthyoelephas longirostris | 16,840 | KP025763.1 | ||
| Prochilodus magdalenae | 16,692 | PQ510211.1 | ||
| Prochilodus argenteus | 16,697 | KR014816.1 | ||
| Prochilodus costatus | 16,699 | KR014817.1 | ||
| Prochilodus lineatus | 16,699 | KM245045.1 | ||
| Distichodontidae | Distichodus sexfasciatus | 16,555 | AB070242.1 | |
| Erythrinidae | Hoplias intermedius | 16,629 | KU523584.1 | |
| Hoplias malabaricus | 16,638 | AP011992.1 | ||
| Gasteropelecidae | Carnegiella strigata | 17,852 | AP011983.1 | |
| Hemiodontidae | Hemiodopsis gracilis | 16,731 | AP011990.1 | |
| Hepsetidae | Hepsetus odoe | 16,803 | AP011991.1 | |
| Lebiasinidae | Lebiasina multimaculata | 16,899 | AP006766.1 | |
| Nannostomus beckfordi | 16,690 | OR857846.1 | ||
| Nannostomus marilynae | 16,667 | OR857847.1 | ||
| Nannostomus marginatus | 16,661 | OR857848.1 | ||
| Nannostomus unifasciatus | 16,681 | OR857849.1 | ||
| Parodontidae | Apareiodon affinis | 16,679 | AP011998.1 | |
| Serrasalmidae | Colossoma macropomum | 16,703 | KP188830.1 | |
| Metynnis hypsauchen | 16,737 | MH358334.1 | ||
| Myloplus rubripinnis | 16,662 | MH358336.1 | ||
| Piaractus brachypomus | 16,722 | KJ993871.2 | ||
| Piaractus mesopotamicus | 16,722 | KM245046.1 | ||
| Pygocentrus nattereri | 16,706 | AP012000.1 | ||
| Cypriniformes | Cyprinidae | Cyprinus carpio | 16,592 | OL693871.1 |
| Gene | Position | Size (bp) | Orientation | Codon | Intergenic Nucleotides (bp) | ||
|---|---|---|---|---|---|---|---|
| From | To | Start | Stop | ||||
| tRNA-Phe | 1 | 68 | 68 | + | 0 | ||
| 12S rRNA | 69 | 1017 | 949 | + | 0 | ||
| tRNA-Val | 1018 | 1089 | 72 | + | 0 | ||
| 16S rRNA | 1110 | 2761 | 1652 | + | 20 | ||
| tRNA-Leu | 2764 | 2838 | 75 | + | 2 | ||
| ND1 | 2839 | 3810 | 972 | + | ATG | TAA | 0 |
| tRNA-Ile | 3819 | 3890 | 72 | + | 8 | ||
| tRNA-Gln | 3889 | 3959 | 71 | − | −2 | ||
| tRNA-Met | 3972 | 4041 | 70 | + | 12 | ||
| ND2 | 4043 | 5101 | 1059 | + | ATG | TAA | 1 |
| tRNA-Trp | 5126 | 5196 | 71 | + | 24 | ||
| tRNA-Ala | 5160 | 5235 | 76 | − | −37 | ||
| tRNA-Asn | 5238 | 5310 | 73 | − | 2 | ||
| tRNA-Cys | 5341 | 5407 | 67 | − | 30 | ||
| tRNA-Tyr | 5407 | 5476 | 70 | − | −1 | ||
| COX1 | 5480 | 7039 | 1560 | + | ATG | AGG | 3 |
| tRNA-Ser | 7027 | 7098 | 72 | − | −13 | ||
| tRNA-Asp | 7103 | 7174 | 72 | + | 4 | ||
| COX2 | 7190 | 7880 | 691 | + | ATG | T | 15 |
| tRNA-Lys | 7881 | 7953 | 73 | + | 0 | ||
| ATP8 | 7955 | 8122 | 168 | + | ATG | T | 1 |
| ATP6 | 8113 | 8794 | 682 | + | ATG | T | −10 |
| COX3 | 8975 | 9578 | 604 | + | ATT | T | 180 |
| tRNA-Gly | 9579 | 9651 | 73 | + | 0 | ||
| ND3 | 9652 | 10,002 | 351 | + | ATG | TAA | 0 |
| tRNA-Arg | 10,001 | 10,070 | 70 | + | −2 | ||
| ND4L | 10,071 | 10,367 | 297 | + | ATG | TAA | 0 |
| ND4 | 10,361 | 11,741 | 1381 | + | ATG | T | −7 |
| tRNA-His | 11,742 | 11,810 | 69 | + | 0 | ||
| tRNA-Ser | 11,811 | 11,878 | 68 | + | 0 | ||
| tRNA-Leu | 11,880 | 11,952 | 73 | + | 1 | ||
| ND5 | 11,953 | 13,791 | 1839 | + | ATG | TAA | 0 |
| ND6 | 13,788 | 14,303 | 516 | − | ATG | TAA | −4 |
| tRNA-Glu | 14,304 | 14,371 | 68 | − | 0 | ||
| Cytb | 14,377 | 15,513 | 1137 | + | ATG | TAA | 5 |
| tRNA-Thr | 15,519 | 15,591 | 73 | + | 5 | ||
| tRNA-Pro | 15,590 | 15,659 | 70 | − | −2 | ||
| CR | 15,660 | 17,585 | 1926 | / | 0 | ||
| Region | Size (bp) | A (%) | T (%) | G (%) | C (%) | A + T (%) | G + C (%) | AT Skew | GC Skew |
|---|---|---|---|---|---|---|---|---|---|
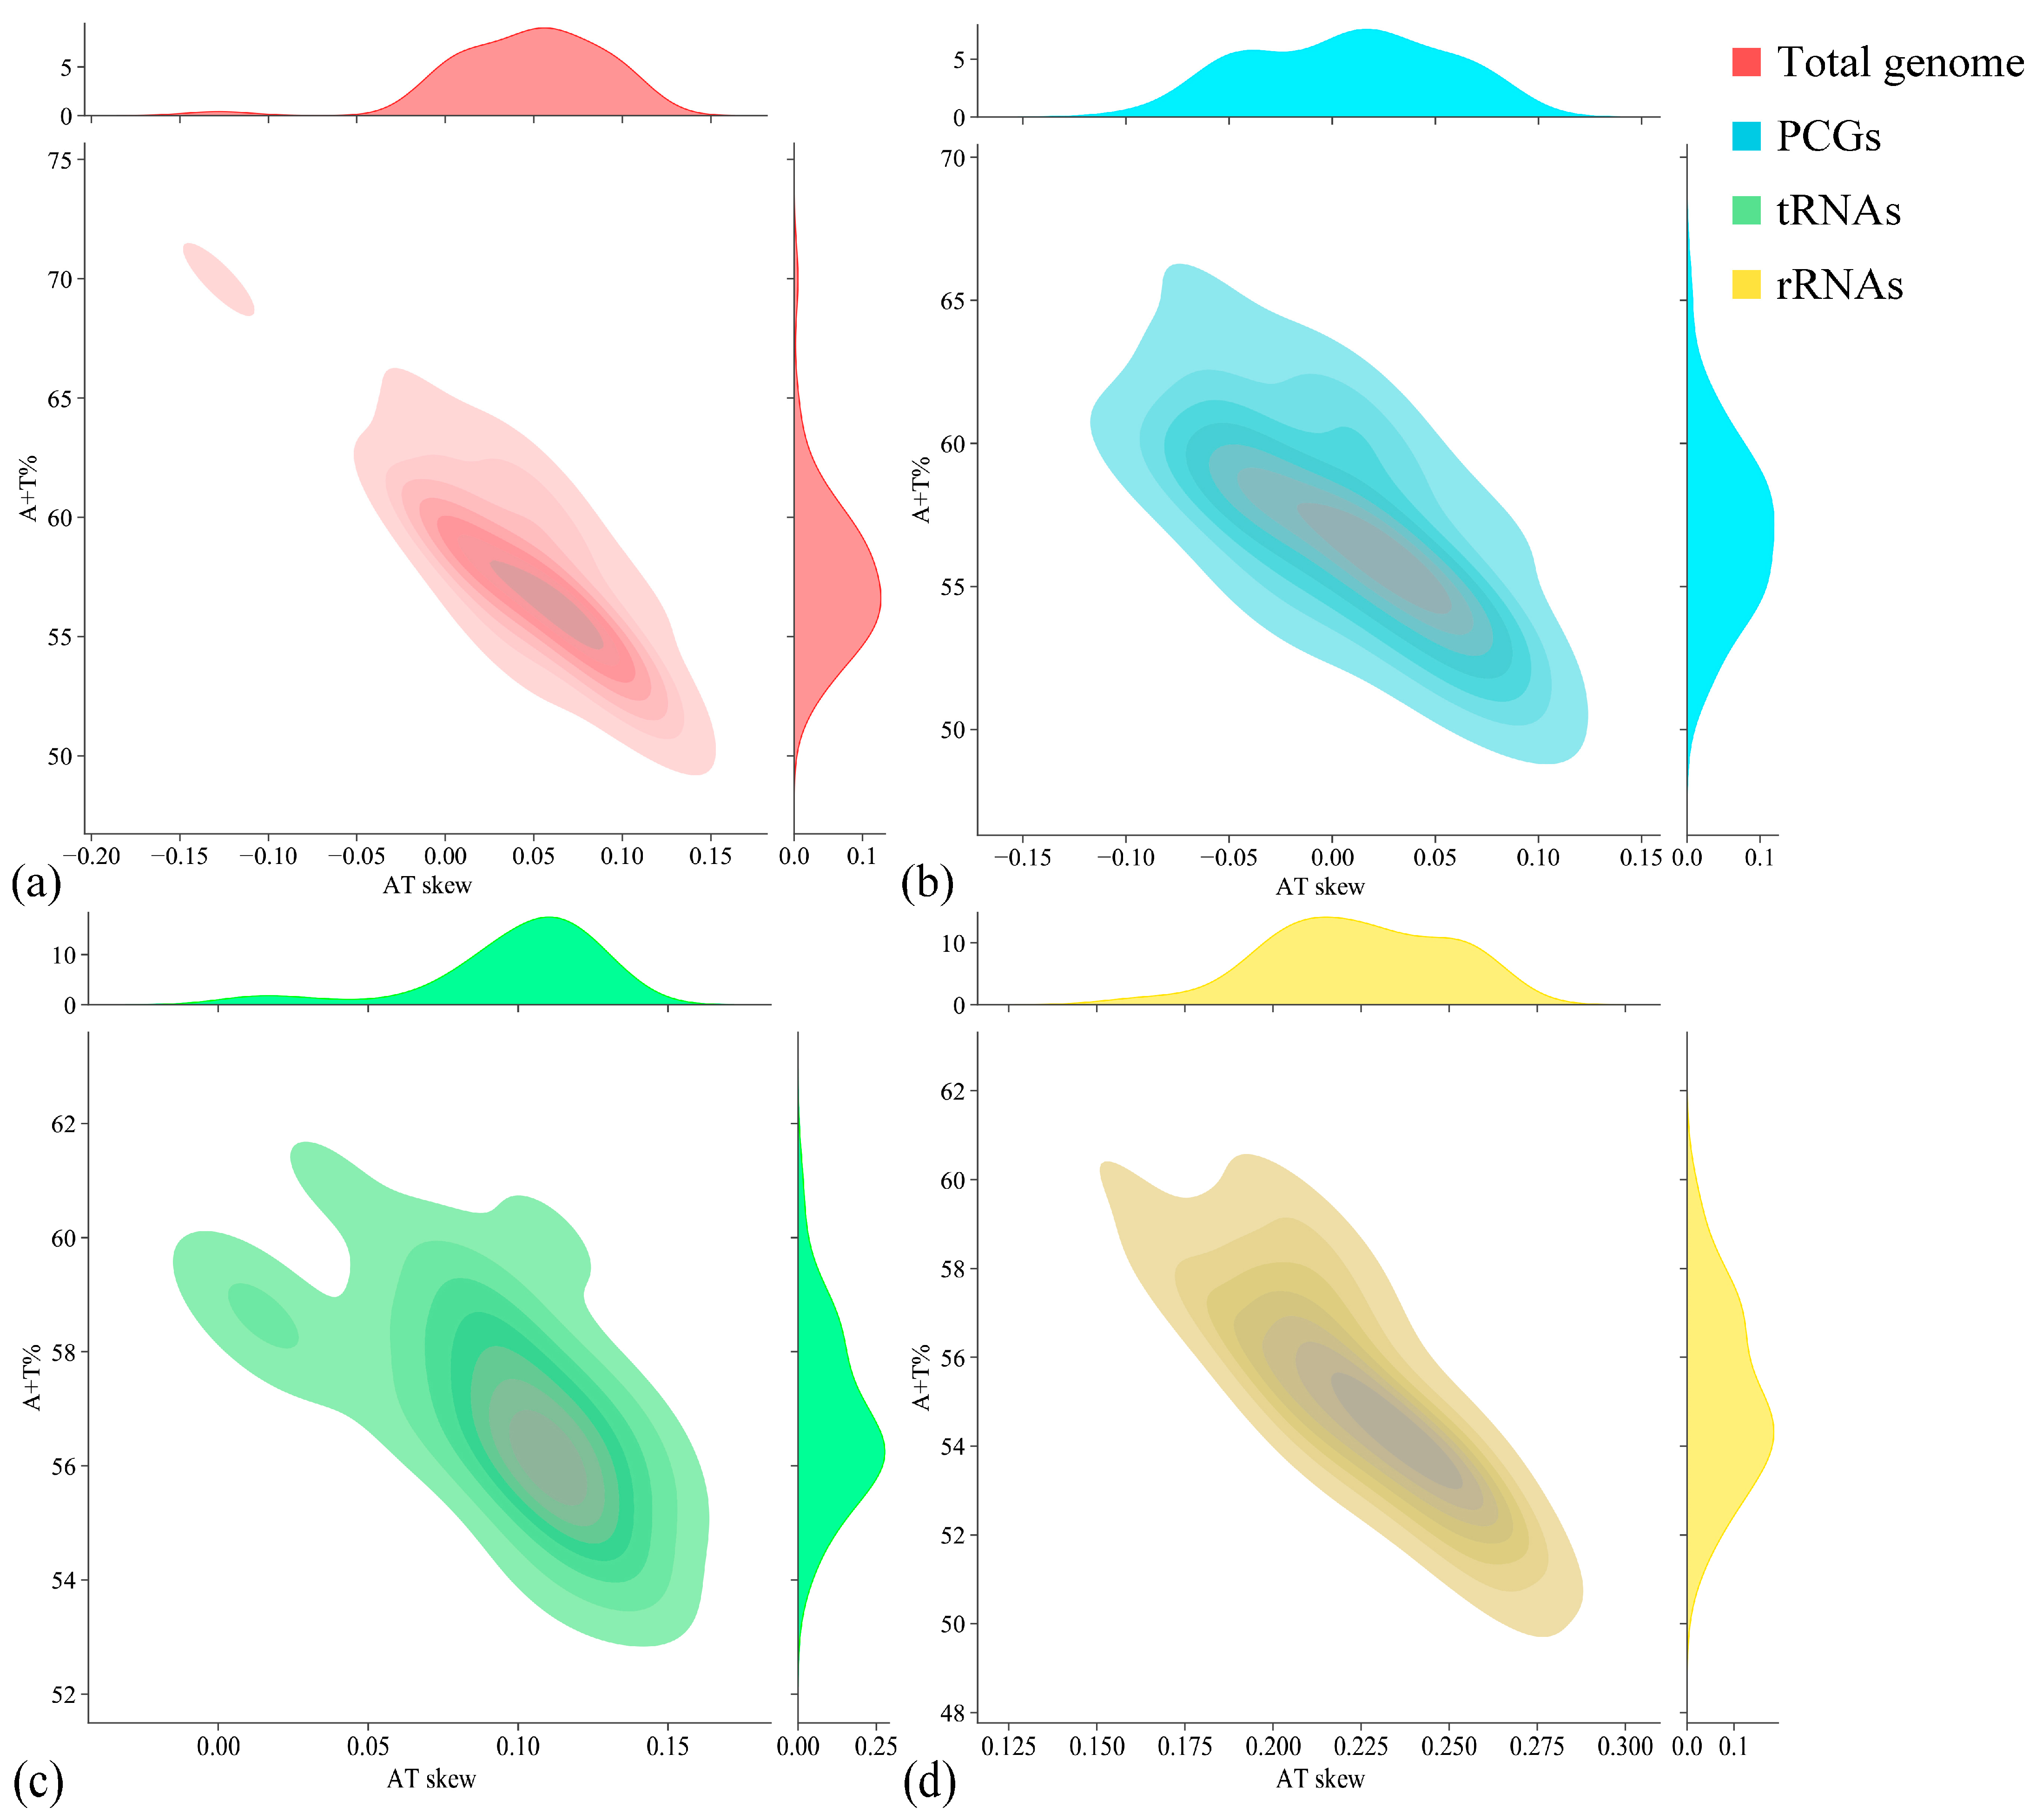
| Total genome | 17,585 | 31.02 | 31.27 | 14.75 | 22.96 | 62.29 | 37.71 | −0.004 | −0.218 |
| PCGs | 11,257 | 29.51 | 32.84 | 13.54 | 24.11 | 62.35 | 37.65 | −0.053 | −0.281 |
| tRNAs | 1566 | 31.80 | 26.56 | 18.14 | 23.50 | 58.36 | 41.64 | 0.090 | −0.129 |
| rRNAs | 2601 | 34.68 | 23.03 | 19.30 | 22.99 | 57.71 | 42.29 | 0.202 | −0.087 |
| CR | 1926 | 34.84 | 37.33 | 13.14 | 14.69 | 72.17 | 27.83 | −0.035 | −0.056 |
Disclaimer/Publisher’s Note: The statements, opinions and data contained in all publications are solely those of the individual author(s) and contributor(s) and not of MDPI and/or the editor(s). MDPI and/or the editor(s) disclaim responsibility for any injury to people or property resulting from any ideas, methods, instructions or products referred to in the content. |
© 2025 by the authors. Licensee MDPI, Basel, Switzerland. This article is an open access article distributed under the terms and conditions of the Creative Commons Attribution (CC BY) license (https://creativecommons.org/licenses/by/4.0/).
Share and Cite
Chen, H.; Xu, W.; Liu, B.; Li, L. Comparative Mitochondrial Features Across Characiformes (Teleostei: Ostariophysi) and Mitogenomic Architecture of Nematobrycon lacortei. Diversity 2025, 17, 373. https://doi.org/10.3390/d17060373
Chen H, Xu W, Liu B, Li L. Comparative Mitochondrial Features Across Characiformes (Teleostei: Ostariophysi) and Mitogenomic Architecture of Nematobrycon lacortei. Diversity. 2025; 17(6):373. https://doi.org/10.3390/d17060373
Chicago/Turabian StyleChen, Hongjian, Wei Xu, Bing Liu, and Lingna Li. 2025. "Comparative Mitochondrial Features Across Characiformes (Teleostei: Ostariophysi) and Mitogenomic Architecture of Nematobrycon lacortei" Diversity 17, no. 6: 373. https://doi.org/10.3390/d17060373
APA StyleChen, H., Xu, W., Liu, B., & Li, L. (2025). Comparative Mitochondrial Features Across Characiformes (Teleostei: Ostariophysi) and Mitogenomic Architecture of Nematobrycon lacortei. Diversity, 17(6), 373. https://doi.org/10.3390/d17060373