Article

Forestry Plans as the Source of Environmental Data for the Analysis of Bird Community Composition

1
Krkonoše National Park Administration, Dobrovského 3, 543 01 Vrchlabí, Czech Republic
2
Department of Zoology, Charles University in Prague, Viničná 7, 128 00 Prague, Czech Republic
3
Department of Ecosystem Biology, Faculty of Science, Branišovská 1760, 370 05 České Budějovice, Czech Republic
4
Department of Zoology, University of South Bohemia in České Budějovice, Branišovská 1645/31a, 370 05 České Budějovice, Czech Republic
*
Author to whom correspondence should be addressed.
Diversity 2025, 17(5), 351; https://doi.org/10.3390/d17050351
Submission received: 23 March 2025 / Revised: 17 April 2025 / Accepted: 6 May 2025 / Published: 16 May 2025
(This article belongs to the Special Issue Birds in Temperate and Tropical Forests—2nd Edition)

Abstract

:
Forest management plans offer valuable data on forest species composition and structure, useful for large-scale bird conservation. We examined the relationship between bird community diversity and five vegetation characteristics from management plans in Krkonoše Mts. National Park. Bird communities were surveyed from 2012 to 2014 using the point method on 285 plots (radius 100 m). We analyzed songbirds, woodpeckers, and pigeons. The vegetation characteristics were divided into composition (tree species proportion, soil-based phytocoenosis, and target vegetation type) and structure (vertical tree layering and remotely sensed heights). Bird species richness was used as a diversity measure. Redundancy analysis (RDA) tested the impact of vegetation characteristics on bird community composition. Higher bird diversity was linked to deciduous forests, particularly beech, in multi-layered stands (20–40 m height) on rich soils. In contrast, lower diversity occurred in spruce-dominated stands with Scots pine, waterlogged soils, and low vegetation (<0.5 m). All vegetation characteristics correlated significantly with bird community diversity and composition. Our findings demonstrate that forest management data can help identify key variability sources in bird communities, aiding in large-scale monitoring and landscape planning. Beyond tree composition and structure, phytocoenological characteristics provide useful insights for conservation.

1. Introduction

Forests are home to the largest number of bird species among the temperate habitats [1]. The qualitative and quantitative structure of forest bird communities is greatly influenced by the diversity of vegetation, which is an important factor allowing for the coexistence of species with different breeding and feeding requirements [2,3]. Vegetation diversity has two components: taxonomical and spatial. The supply of food, nesting opportunities, and shelter from predators for individual bird species is conditioned on the one hand by the species-specific tree characteristics (e.g., structure of the bark, type of fruit, type and density of foliage, and the attached invertebrate communities) and on the other hand by the spatial structure of the forest stand, e.g., the proportion and distribution of multiple tree age and height categories [4,5,6,7]. The influence of both components of vegetation structure on the species diversity of bird communities has been intensively studied since the 1960s [8,9] and vegetation structure is now considered the most important factor in the variability of forest bird communities [10].
Most studies show a positive effect of habitat mosaics with heterogeneous vertical vegetation structures on bird community diversity [8,11,12,13,14]. Most authors also agree that the bird community diversity increases with the age of the forest [15,16] because older stands provide more food sources and breeding opportunities [17,18]. In terms of tree species composition, most studies in temperate forests have focused on the difference between deciduous and coniferous forests [19,20,21,22,23]. It is evident that more bird species inhabit deciduous rather than coniferous forests [11,23,24].
A relatively small number of studies compared the effect of vegetation composition and its spatial structure. One of them showed that the spatial structure of vegetation is not sufficient to predict bird community composition and must also be combined with species composition [25]. Another found that species composition and spatial structure have similar contributions to explaining the variability of the bird community [13]. However, it is difficult to separate the two components and their relationship is confusing [26,27] as the spatial or vertical structure of vegetation is conditioned, among other things, by the species-specific growth of individual tree species. On the other hand, individual preferences for specific tree species have been described for many bird species [28,29,30]. This is probably due to the distinctiveness of some tree species in offering food sources and breeding sites [31,32].
Most of the research mentioned above, studying how the tree species composition and spatial structure of forests influence the composition of bird communities, was performed on smaller model plots, where the authors collected data on bird communities as well as on vegetation. Especially for conservation purposes, large-scale monitoring programmes of bird populations and communities are underway in many countries. To interpret their results, it is necessary to obtain the most detailed information on the environment, including the species and spatial structure of forest habitats.
Promising possibilities to obtain information about vegetation cover over arbitrarily large areas have been brought about by the development of remote sensing technologies. They make it possible to describe vegetation based on multi-spectral imaging. They have been used as a source of environmental information for large-scale studies on bird communities. Remote sensing data were used for the analysis of forest bird communities, combining data sets from airborne imaging (LiDAR), which were used to determine the vertical structure of vegetation with conventional ground surveys to determine the species composition of the vegetation [25].
In countries with advanced forest management, detailed and systematically collected forestry data, which are required by law, provide another source of information for large-scale studies of forest bird communities [33]. Although the collection of such forest data is motivated primarily by capturing the state of the forest as an object of economic activity, their use for explaining and predicting the composition of bird communities in forests was also suggested, particularly because of their area availability for all managed forest stands [33,34].
In the Czech Republic, the acquisition of data on the state of the forest is regulated by legislation. In particular, so-called forest-typological mapping divides forests into segments with similar growth conditions. On this basis, forest management plans and outlines are drawn up, which contain additional data on specific forest stands and serve mainly as a tool for forest owners in their management. These are mainly data showing the species composition of the forest, its age, the volume of wood mass, and the density of trees in the forest stand. No one has yet attempted to use Czech forestry plans as a source of environmental information for zoological research.
The Fauna of the Krkonoše Mountains project carried out an area-wide mapping of the breeding distribution of birds in the park in 2012–2014 [35]. Data from this project allowed us to test whether available forest data can be used to explain the variability in species diversity and species composition of bird communities. If so, the inventories of forest conditions would be an important source of information for large-scale conservation efforts, e.g., selecting the most valuable stand types in terms of the diversity of bird communities and possibly other species groups, as birds often serve as flag or umbrella species [36,37,38].
Our aim was to answer the following questions: (1) To what extent is the description of forest in the Krkonoše Mountains (Krkonoše Mts) able to explain the variability in species diversity and the species composition of bird communities? (2) Whether and how does the variability in species composition explained by various forest characteristics differ, i.e., to what extent do different bird species respond to them?

2. Materials and Methods

2.1. Description of the Study Area

The monitored areas were the forest stands in the territory of the Krkonoše National Park and its buffer zone, which covers the Czech (southern) part of the Krkonoše Mts. The Krkonoše Mts are one of the mountain ranges bordering the territory of the Czech Republic. The monitored area of the national park and its buffer zone is located on the Czech–Polish border (between 50°45′19″ and 50°34′43″ N and 15°21′33″ and 15°54′28″ E) and covers an area 385 km2 (Figure 1).
The Krkonoše Mts reach an altitude of only 1603 m above sea level (a.s.l.), yet their highest parts extend above the natural upper limit of the forest, which runs at approximately 1250 m a.s.l. (1200–1350 m a.s.l.). The climate of the Krkonoše Mts is harsh by Central European standards, as this mountain range is the first barrier to the moist and cold air flowing mainly from the Atlantic. The average annual temperature varies between +8 °C in the lowest and almost 0 °C in the highest altitudes [39].
In terms of the vertical division of the vegetation, there are four altitudinal vegetation belts in the Krkonoše Mountains, namely (1) submontane belt up to 800 m a.s.l., (2) montane belt between 800 and 1250 m a.s.l., (3) subalpine belt between 1250 and 1450 m a.s.l., and (4) alpine belt above 1450 m a.s.l. [39]. However, their vegetation has been influenced to varying degrees by human activity over the past centuries.
Forests cover approximately 60% of the mountain range. Above the upper forest boundary lies the arctic–alpine tundra with a mosaic of stands of scrub and alpine grasslands with isolated groups of dwarf spruce. Particularly at lower elevations, there are towns and villages surrounded by an agricultural landscape consisting mainly of meadows and pastures, and to a lesser extent arable land. The agricultural landscape is interspersed with scattered greenery, i.e., woodland, but also woods and copses with dense scrub [39].
The original deciduous and mixed woodland has been cleared since colonisation in the 14th century and especially since the development of mining in the 16th century. By the beginning of the 17th century, only remnants of this woodland remained. From the beginning of the 18th and 19th centuries, the clearings were systematically reforested with spruce monocultures [40]. At the beginning of the 21st century, the percentage of deciduous trees in the forests of the Krkonoše Mts was 11% [41].
Today, deciduous and mixed stands make up less than a third of all stands. They are dominated by beech (Fagus sylvatica L.) forest, which is the basis of the so-called eutrophic beech forests in the lower altitudes and acidophilous mountain beech forests in the higher altitudes. On specific sites, beech is accompanied by other tree species, which may even dominate locally. On scree-covered slopes, these include the maples (Acer spp.) especially the dominant sycamore maple (Acer pseudoplatanus L.), in clearings around hillside watercourses and forest springs occurs ash (Fraxinus excelsior L.), and grey alder (Alnus incana (L.) Moench). In these deciduous stands, Norway spruce (Picea abies (L.) H. Karst.) and white fir (Abies alba Mill.) or mountain elm (Ulmus glabra Huds.) are often interspersed.
The remaining two-thirds of the forested areas are coniferous forests [39]. Coniferous stands are almost exclusively composed of Norway spruce and are found throughout the area from the foothills to the upper forest boundary. However, these are mostly secondary monoculture stands and only at elevations between 800 and 1200 m a.s.l. has spruce occurred naturally since the end of the last glaciation in central Europe. Today, natural mountainous spruce forests are found only in hard-to-reach places at the heads of mountain valleys, on very steep slopes, in wet areas, and at the upper forest boundary. In spruce stands, silver birch (Betula pendula Roth), rowan tree (Sorbus aucuparia L.), sycamore maple, and silver fir (Abies alba Mill.) are commonly interspersed [39].
In the 1970s and 1980s, the local mountain spruce forests were affected by forest dieback, after which large areas were cleared of dying stands. The resulting groves are gradually being overgrown with young spruce plantations.

2.2. Bird Data

Bird data were collected as part of the atlas mapping of breeding bird distribution in the Krkonoše Mountains [35], which was conducted in 2012–2014. The mapping was carried out on a total of 471 plots on both sides of the state border, of which 321 plots lay on the Czech side. Each of the plots had dimensions of approximately 1.5 × 1.4 km. A total of 120 plots on the Czech side were randomly selected to determine the abundance of breeding birds. In the census plots, 16 points were defined in a regular grid, and from these, 8 census points were randomly selected where birds were counted using the standard point method [41]. In total, the counting took place at 960 points. At each census point, all birds seen and heard within 100 m of the observer in a period of 5 min were recorded. Birds that merely flew over the count point and thus had no connection to the count area were not counted.
In the three breeding seasons of 2012–2014, two checks were made in each count plot in each year, the first approximately in the first half of May and the second in the first half of June. The order of the visited points was reversed on the second check. The counting was carried out in the morning, from dawn to 10:00 CEST and only under suitable weather conditions, i.e., no rain, fog, or strong winds. A total of 39 fieldworkers conducted the counts, with some plots being counted by one person for the entire duration of the project, while in others the fieldworkers changed each year.
From a total of 960 census points, 285 points were selected for our analysis, lying within the area of a circle with a radius of 100 m on forest plot. Of the species surveyed, we included in the analysis those that could be assumed to have a stronger connection to the census point, i.e., songbirds, pigeons, and woodpeckers. Of the two checks made in the same year, the higher abundance was selected for all species recorded at the point, and the arithmetic mean was calculated from the three values thus obtained for years 2012–2014.
We defined a circular area of 100 m radius (31,416 m2) around each point from which birds were counted. For all 285 plots, the percentage of plots in each category for each of the five vegetation characteristics listed in the following section was calculated using GIS tools. These percentages were then entered as predictors into the analyses.

2.3. Environmental Data

In describing the vegetation, we worked with the units of spatial forest distribution defined in the forest management plans for the period 2015–2024, which classify forest stands according to the similarity of natural and economic conditions. The vegetation characteristics we worked with are then listed in the forest plans for these units.
We included four forest stand characteristics from the forest management planning data in our study. The administration of the Krkonoše National Park records, in addition to the data required by the Forest Act, the height structure of vegetation. This is obtained from aerial hyperspectral image data. To describe forest stand variability, a principal component analysis (PCA) was performed using Canoco v5.1 software [42], in which individual study plots were characterised by the percentage of the occurring categories. The resulting biplots can be found in Figure 2.
Figure 2. Vegetation variability of the study plots visualized on the first and second axes of the PCA: (a) percentages of tree species (see Table 1 for tree species names); (b) percentage of target vegetation categories; (c) percentage of forest phytocenology categories; (d) percentage of vertical tree structure categories. Forests are separated into high-elevation, multi-layered and single-layered stands, single-layered stands are further subdivided by age. Last category includes forest-free plots; (e) percentage of the vegetation height categories. The categories are divided according to the maximum height range (m).
Diversity 17 00351 g002
Table 1. Tree species’ names.
AbiAlbAbies alba Mill.Silver Fir
AbiGraAbies grandis (Douglas) Lindl.Grand Fir
AcePlaAcer platanoides L.Norway Maple
AcePseAcer pseudoplatanus L.Sycamore Maple
AesHipAesculus hippocastanum L.Horse Chestnut
AlnGluAlnus glutinosa (L.) GaertnerCommon Alder
AlnIncAlnus incana (L.) MoenchSpeckled Alder
BetPenBetula pendula RothSilver Birch
BetPubBetula pubescens Ehrh.Pubescent Birch
CarBetCarpinus betulus L.Hornbeam
CerAviCerasus avium (L.) MoenchWild Cherry
DusAlnDuschekia alnobetula (Ehr.) PouzarGreen Alder
FagSylFagus sylvatica L.European Beech
FraExcFraxinus excelsior L.Ash
LarDecLarix decidua Mill.Larch
PicAbiPicea abies (L.) KarstenNorway Spruce
PicPunPicea pungens Engelm.Colorado Spruce
PinMugPinus mugo TurraDwarf Mountain Pine
PinSylPinus sylvestris L.Scots Pine
PinusPinus sp.Pine
PopTrePopulus tremula L.Aspen
PseMenPseudotsuga menziesii (Mirbel) FrancoDouglas Fir
QuePetQuercus petraea (Mattyschka) Liebl.Sessile Oak
QueRobQuercus robur (L.)Pedunculate Oak
SalCapSalix caprea L.Goat Willow
SalixSalix alba L.White Willow
Shr Shrubs
SorAucSorbus aucuparia L.Rowan Tree
SorTorSorbus torminalis (L.) CrantzWild Services Tree
TilCorTilia cordata Mill.Small-leaved Lime
UlmMinUlmus minor Mill.Elm Tree
(1) Tree species composition describes the percentage representation of each tree species in the study plots. The first PCA axis explains 40.61% of the tree species composition in the study plots. The analysis classified study plots according to the relative abundance of conifers and broadleaved trees. The positive part of the axis increases the abundance of beech, sycamore maple, and ash (Fraxinus excelsior L.). Other broadleaved species also occur in smaller quantities. In the negative part of the axis, there is an increase in the representation of Norway spruce (Picea abies L.) and other coniferous species, especially dwarf mountain pine (Pinus mugo Turra) (Figure 2a).
(2) Target vegetation-defining habitats with similar potential natural vegetation [43,44]. In forests of specially protected areas, target vegetation is the framework for forest planning. The following categories were present in the study plots in our work: ‘extreme habitat’, ‘knotweed’, ‘highland spruce’, ‘alder and ash’, ‘exposed live fir’, ‘exposed acid fir’, ‘acid fir’, ‘acid spruce’, ‘nutritious fir beech’, ‘nutritious spruce beech’, ‘exposed acid spruce beech’, ‘exposed fresh fir beech’, ‘acid spruce’, ‘fresh spruce’, ‘waterlogged fir spruce’, ‘waterlogged spruce’. The first PCA axis explains 18.92% of the variability and divides the plots in its positive part into those where the category ‘acid spruce beech’ is highly represented. In a natural composition, these stands would be dominated by beech at lower elevations and spruce at higher elevations. At present, coniferous species, mainly Norway spruce, are strongly predominant in these stands at lower to middle altitudes (the proportion of conifers and broadleaves is 85% and 15%, respectively). In the negative part, there are areas with a varied composition of forest types (Figure 2b).
(3) Forest phytosociology (typology), dividing stands into sets of forest types, according to the soil conditions and the forest vegetation stage in the place where they are located [45]. For the purpose of our work, forest vegetation stages were grouped together, thus our categories are defined on the basis of trophic and hydric properties. The following categories were present in our study plots: ‘fertile’, ‘acid’, ‘extreme’, ‘humus-rich’, ‘water-rich’, ‘gleying’, ‘waterlogged’, and ‘peaty’. The first PCA axis explains 9.52% of the variability and divides the areas around the census points in its positive part into areas with a diverse composition of soil types and in the negative part into areas with a predominance of acid or waterlogged and peaty soils (Figure 2c).
(4) Vertical stand structure divides forests into 10 categories based on age and degree of vertical stand heterogeneity. For the purposes of our study, these categories were further paired into (a) hollow and and young forest up to about 20 years of age, (b) pole and pole-trunk thicknesses of 7–19 cm at 1.3 m above the ground and an age of about 20–49 years, (c) log stands with stem thickness of 20 cm or more and an age of 50 years or more, (d) multi-layered stands whose upper tree layer reached the parameters of a log stand, and (e) dwarf and high-mountain spruce stands and stands of slash scrub. The first PCA axis explains 26.48% of the variability. It divides the census points according to the complexity of the vertical structure of the forest cover around the census points. The positive part of the first axis increases the representation of stands with a height-diverse tree canopy, with the uppermost layer consisting of trees with a thickness of at least 20 or 36 cm and an age of at least 51 and 81 years. In the negative part of the first axis, we find areas with variable representation of all the remaining categories, i.e., clearings and young stands up to a maximum age of about 50 years, which are relatively low in height diversity. In this part of the first axis, we also find mountain spruce forests and scrub stands, which are similar in structural characteristics to young stands in some respects (Figure 2d).
(5) Vegetation height classes.
For the purposes of this study, 10 height categories were distinguished as (a) 0, i.e., bare ground, (b) 0.1–0.5 m, (c) 0.6–2 m, (d) 2.1–4 m, (e) 4.1–8 m, (f) 8.1–10 m, (g) 10.1–15 m, (h) 15.1–20 m, (i) 20.1–30 m, (j) 30.1–40 m, and (k) 40.1–50 m. The first axis explains 35.04% of the variability. The plots in the positive part have a high representation of vegetation up to 4 m in height. These are, therefore, young forest stands at lower elevations but also upland stands of slow-growing Norway spruce and dwarf mountain pine. The height composition of the vegetation in the study plots in the negative part of the first axis is variable, with only a low or no proportion of the lowest height categories up to 4 m (Figure 2e).

2.4. Data Analysis

2.4.1. Structure of Forest Stands and Their Bird Communities

The influence of the species composition and spatial structure of forest stands on the composition of the bird communities was analysed separately for each vegetation characteristic using the Canoco v5.15 software [42] with the redundancy analysis (RDA) method, using the categories as explanatory variables. Twenty best-fitting bird species for each set of explanatory variables were then selected from the RDA results based on their cumulative fit (CFit) value.
Similar bird species appear in all RDA analyses, although they include different vegetation characteristics. To compare how much individual descriptions of vegetation capture the same relationships between vegetation and species composition of bird communities, we use variation partitioning analysis in Canoco software ver. 5.15 [42]. We performed variation partitioning between all pairs of vegetation characteristics.
In the RDA analyses, some abundant species inhabiting the entire study area appear as the best-fitting species, in addition to the rarer species associated with a particular forest type. We assume that these are species with greater variability in abundance, which is higher in more preferred and lower in less preferred forest stands. We compared the variability in the abundance of best-fitted and not selected species using the coefficient of variance. We included in the analysis all species with frequency of occurrence higher than 17%.

2.4.2. Species Richness of Bird Communities

The effect of the species composition and spatial structure of forest stands on the diversity of bird communities was tested separately for each vegetation characteristic using R v4.1.2 software [46]. A generalised linear model (GLM) was used with the percentage importance of vegetation categories as explanatory variables. The partial effects in fitted models were then used to select categories whose percentage in the study plots positively or negatively affect species richness. We used partial effects because individual vegetation characteristics are correlated and the causality of their relationships is not clear.

3. Results

3.1. Bird Species Richness

All vegetation characteristics contain categories that have a partially significant effect on diversity (Table 2).
Diversity is most clearly increased by an increasing proportion of (1) beech, the most abundant broadleaf tree species, (2) forest-free habitats, and (3) stands with vegetation height of 20–30 m. Diversity is most significantly reduced by an increasing proportion of (1) Norway spruce, generally the dominant tree species, (2) gley-poor habitats, and (3) the target vegetation categories ‘wet spruce’ and ‘acid spruce’.

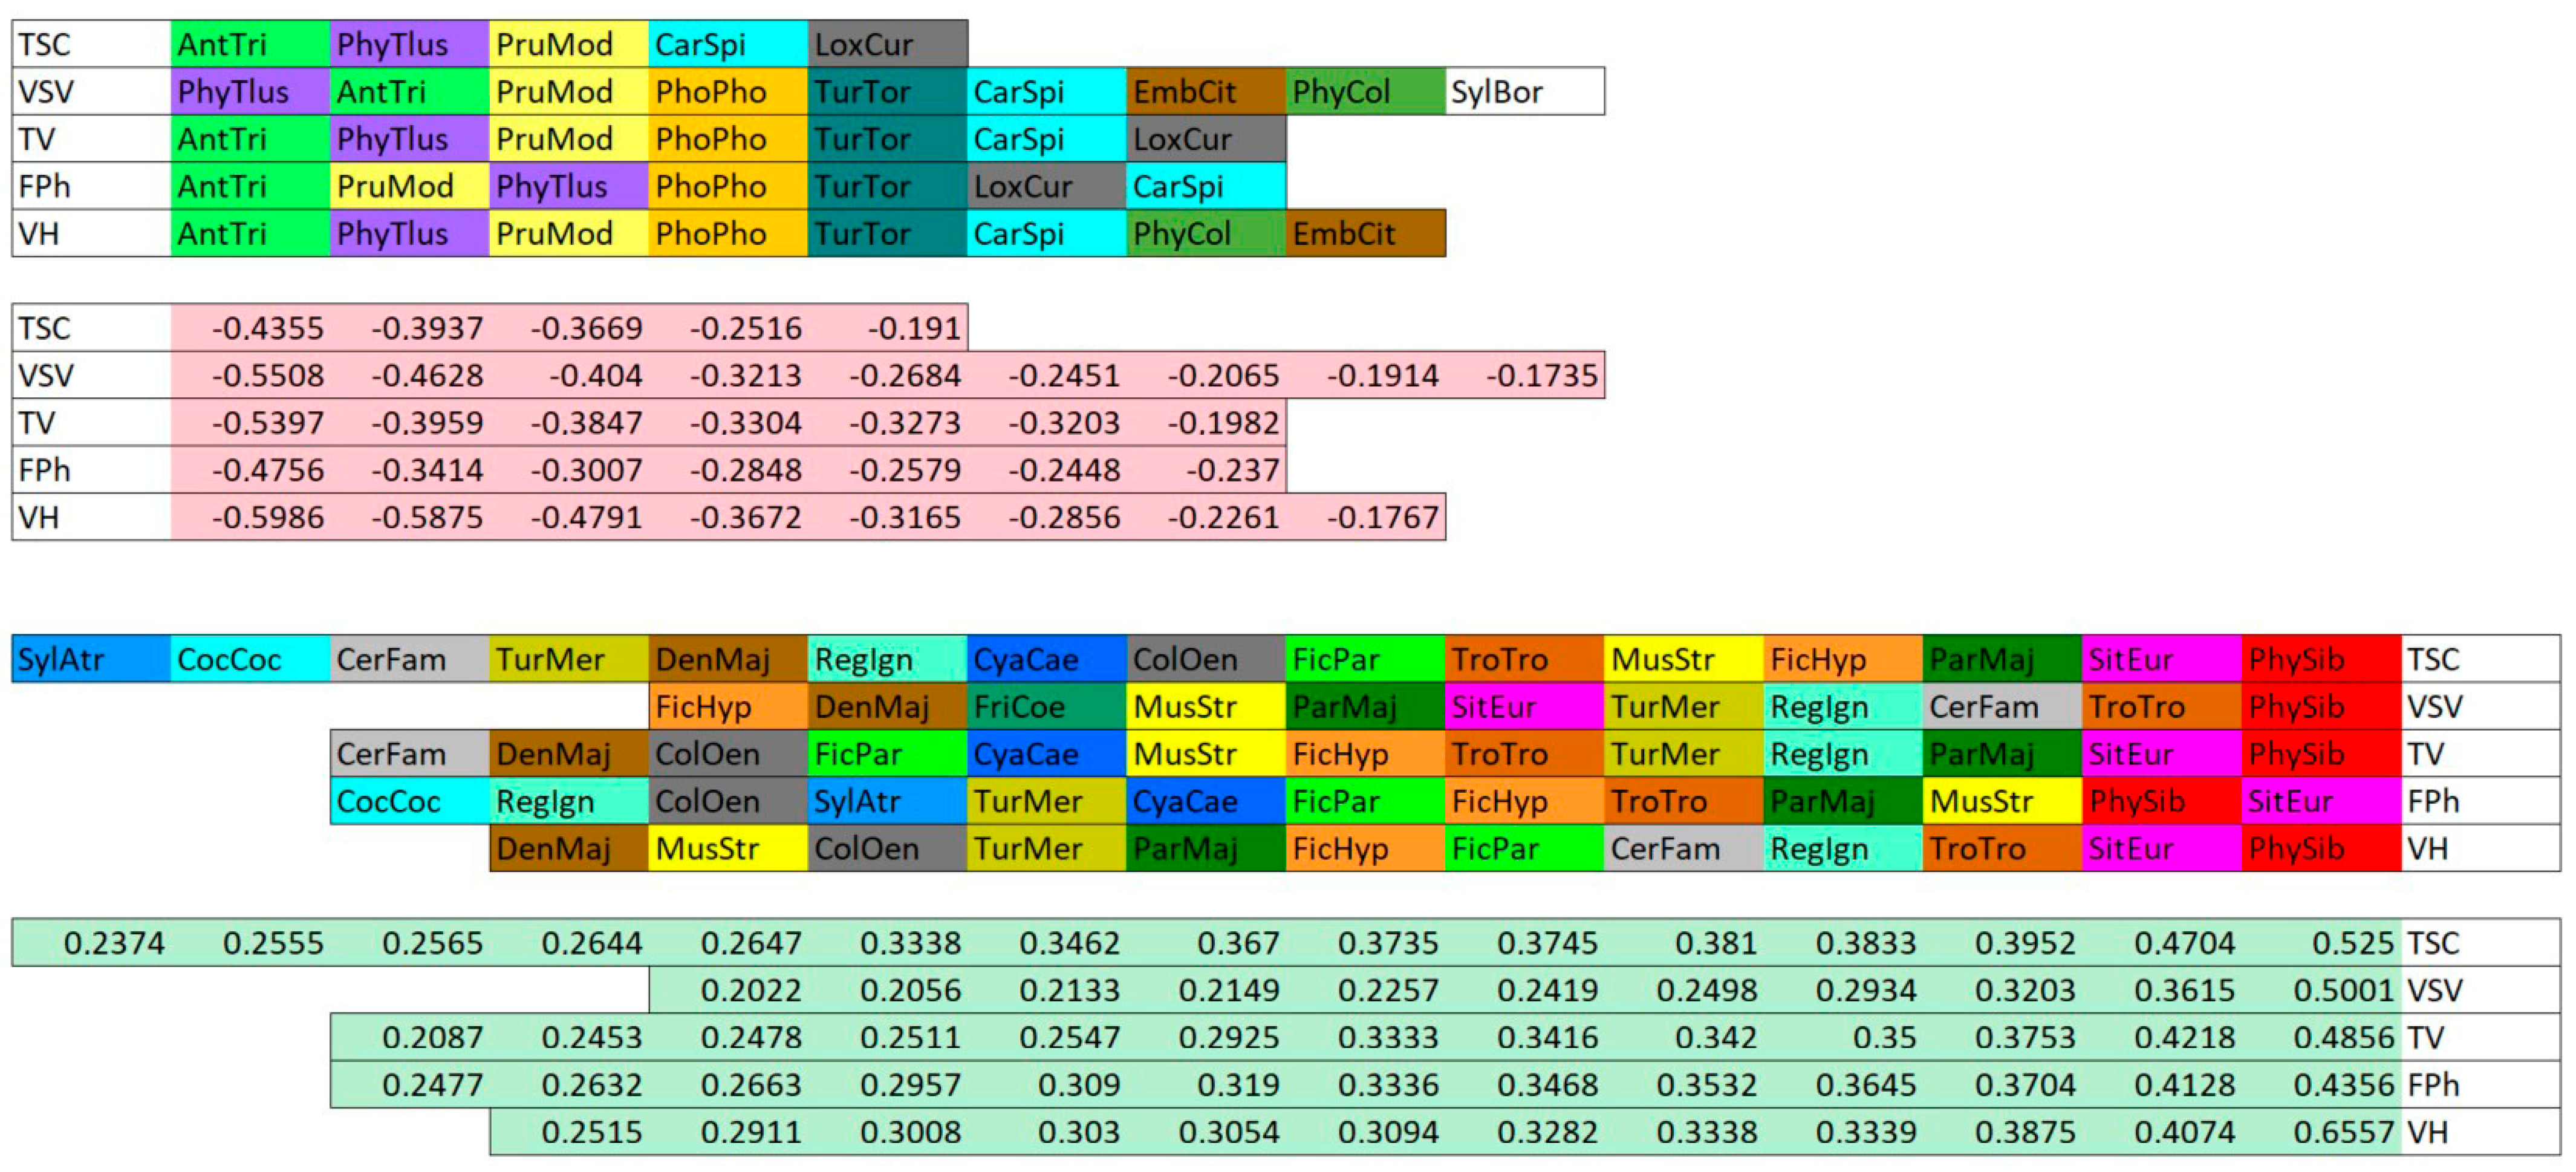
3.2. Bird Communities Composition

Using any of the five vegetation characteristics resulted in a single strong gradient of bird community composition. The first axis of the analysis of the influence of individual vegetation characteristics on bird communities explains 6.01–8.61% of the variability in their species composition, which is over three times more than the variation explained by the second most important axis (Table 3). Therefore, in the following description, we only the first axis. For easier comparisons, we inverted the RDA scores of the first axis in the analysis of the effect of target vegetation characteristics because, in this case, its polarity was reversed relative to the other characteristics.
In all analyses, similar bird species were identified as best-fitted with vegetation characteristics (Figure 3). The majority are found in all five or four of these, but at least in three. On both sides of the first axis we find 17 abundant species inhabiting most of the forests of the Krkonoše Mts National Park (frequency of occurrence in the study area is greater than 17%), and nine species less abundant in the study area with specific requirements for forest type (frequency of occurrence in the study area is less than 12%) (Table 4). Rare species with a frequency of occurrence of less than 3% are never included among the species best-fitted with the vegetation characteristics (Table 4).
Figure 3. Twenty best-fitting species selected on the first axes in RDA analyses of effect of vegetation characteristics on the composition of bird communities. In the upper half of the figure, the species are from the negative part of the first ordination axis, in the lower half from the positive part of the first ordination axis. Upper part contains the names of the bird species, each marked with a unique color for easy comparison of their position in the sub-analyses. Lower part contains the species scores on the first ordination axis. Species are ordered by position on the first ordination axis. The best-fitting species are located in the negative part of the axis on the left (lowest scores), and in the positive part on the right (highest scores). TSC—Tree Species Composition, VSV—Vertical Structure of Vegetation, TV—Target Vegetation, FPh—Forest Phytocenology, VH—Vegetation High. See Table 5 for bird species names.
Diversity 17 00351 g003
Table 4. Frequency of occurrence of all bird species at study plots. n = number of points, f = frequency.
SelectednfNon-Selectednf
Eurasian Chaffinch285100.0European Robin27295.4
Blackcap28298.9Song Thrush26191.6
Common Chiffchaff23883.5Coal Tit26091.2
Winter Wren21776.1Goldcrest22478.6
Eurasian Blackbird20772.6Common Woodpigeon19267.4
Hedge Accentor18866.0Mistle Thrush19167.0
Firecrest16357.2Crested Tit11339.6
Eurasian Siskin15855.4Eurasian Bullfinch10336.1
Eurasian Treecreeper15052.6Eurasian Jay7927.7
Willow Warbler14149.5Black Woodpecker6623.2
Wood Warbler11640.7Common Whitethroat3211.2
Tree Pipit9834.4Common Raven269.1
Great Spotted Woodpecker9533.3Grey Wagtail248.4
Red Crossbill9131.9Marsh Tit176.0
Wood Nuthatch7827.4Eurasian Nutcracker155.3
Great Tit6823.9Lesser Redpoll124.2
Blue Tit5117.9Common Starling113.9
Redstart3411.9Hooded Crow113.9
Pied Flycatcher289.8Magpie82.8
Stock Dove279.5White Wagtail62.1
Ring Ouzel248.4Lesser Whitethroat62.1
Garden Warbler227.7Dipper62.1
Spotted Flycatcher176.0Willow Tit62.1
Yellowhammer165.6Turtle Dove62.1
Hawfinch144.9Fieldfare51.8
Red-breasted Flycatcher113.9Common Rosefinch41.4
Meadow Pipit41.4
Greenish Warbler31.1
Linnet31.1
Long-tailed Tit31.1
Grey-headed Woodpecker31.1
Table 5. Bird species’ names.
AegCauAegithalos caudatusLong-Tailed Tit
AntPraAnthus pratensisMeadow Pipit
AntTriAnthus trivialisTree Pipit
CarCabCarduelis cabaretLesser Redpoll
CarCanCarduelis cannabinaLinnet
CarEryCarpodacus erythrinusCommon Rosefinch
CarSpiCarduelis spinusEurasian Siskin
CerFamCerthia familiarisEurasian Treecreeper
CinCinCinclus cinclusDipper
CocCocCoccothraustes coccothraustesHawfinch
ColOenColumba oenasStock Dove
ColPalColumba palumbusCommon Woodpigeon
CorCorCorvus coraxCommon Raven
CorCorCorvus cornixHooded Crow
CyaCaeCyanistes caeruleusBlue Tit
DenMajDendrocopos majorGreat Spotted Woodpecker
DryMarDryocopus martiusBlack Woodpecker
EmbCitEmberiza citrinellaYellowhammer
EriRubErithacus rubeculaEuropean Robin
FicHypFicedula hypoleucaPied Flycatcher
FicParFicedula parvaRed-breasted Flycatcher
FriCoeFringilla coelebsEurasian Chaffinch
GarGlaGarrulus glandariusEurasian Jay
LopCriLophophanes cristatusCrested Tit
LoxCurLoxia curvirostraRed Crossbill
MotAlbMotacilla albaWhite Wagtail
MotCinMotacilla cinereaGrey Wagtail
MusStrMuscicapa striataSpotted Flycatcher
NucCarNucifraga caryocatactesEurasian Nutcracker
ParMajParus majorGreat Tit
PerAtePeriparus aterCoal Tit
PhoPhoPhoenicurus phoenicurusRedstart
PhyColPhylloscopus collybitaCommon Chiffchaff
PhySibPhylloscopus sibilatrixWood Warbler
PhyTroPhylloscopus trochilusWillow Warbler
PhyTroPhylloscopus trochiloidesGreenish Warbler
PicCanPicus canusGrey-headed Woodpecker
PicPicPica picaMagpie
PoeMonPoecile montanusWillow Tit
PoePalPoecile palustrisMarsh Tit
PruModPrunella modularisDunnock
PyrPyrPyrrhula pyrrhulaEurasian Bullfinch
RegIgnRegulus ignicapillusFirecrest
RegRegRegulus regulusGoldcrest
SitEurSitta europaeaEurasian Nuthatch
StrTurStreptopelia turturTurtle Dove
StuVulSturnus vulgarisCommon Starling
SylAtrSylvia atricapillaBlackcap
SylBorSylvia borinGarden Warbler
SylComSylvia communisWhitethroat
SylCurSylvia currucaLesser Whitethroat
TroTroTroglodytes troglodytesWinter Wren
TurMerTurdus merulaEurasian Blackbird
TurPhiTurdus philomelosSong Thrush
TurPilTurdus pilarisFieldfare
TurTorTurdus torquatusRing Ouzel
TurVisTurdus viscivorusMistle Thrush
The variability in the abundance of rich common species (frequency of occurrence higher than 17%) selected among the best-fitting species is significantly higher than the variability in the abundance of rich common species that were not selected (Figure 4).

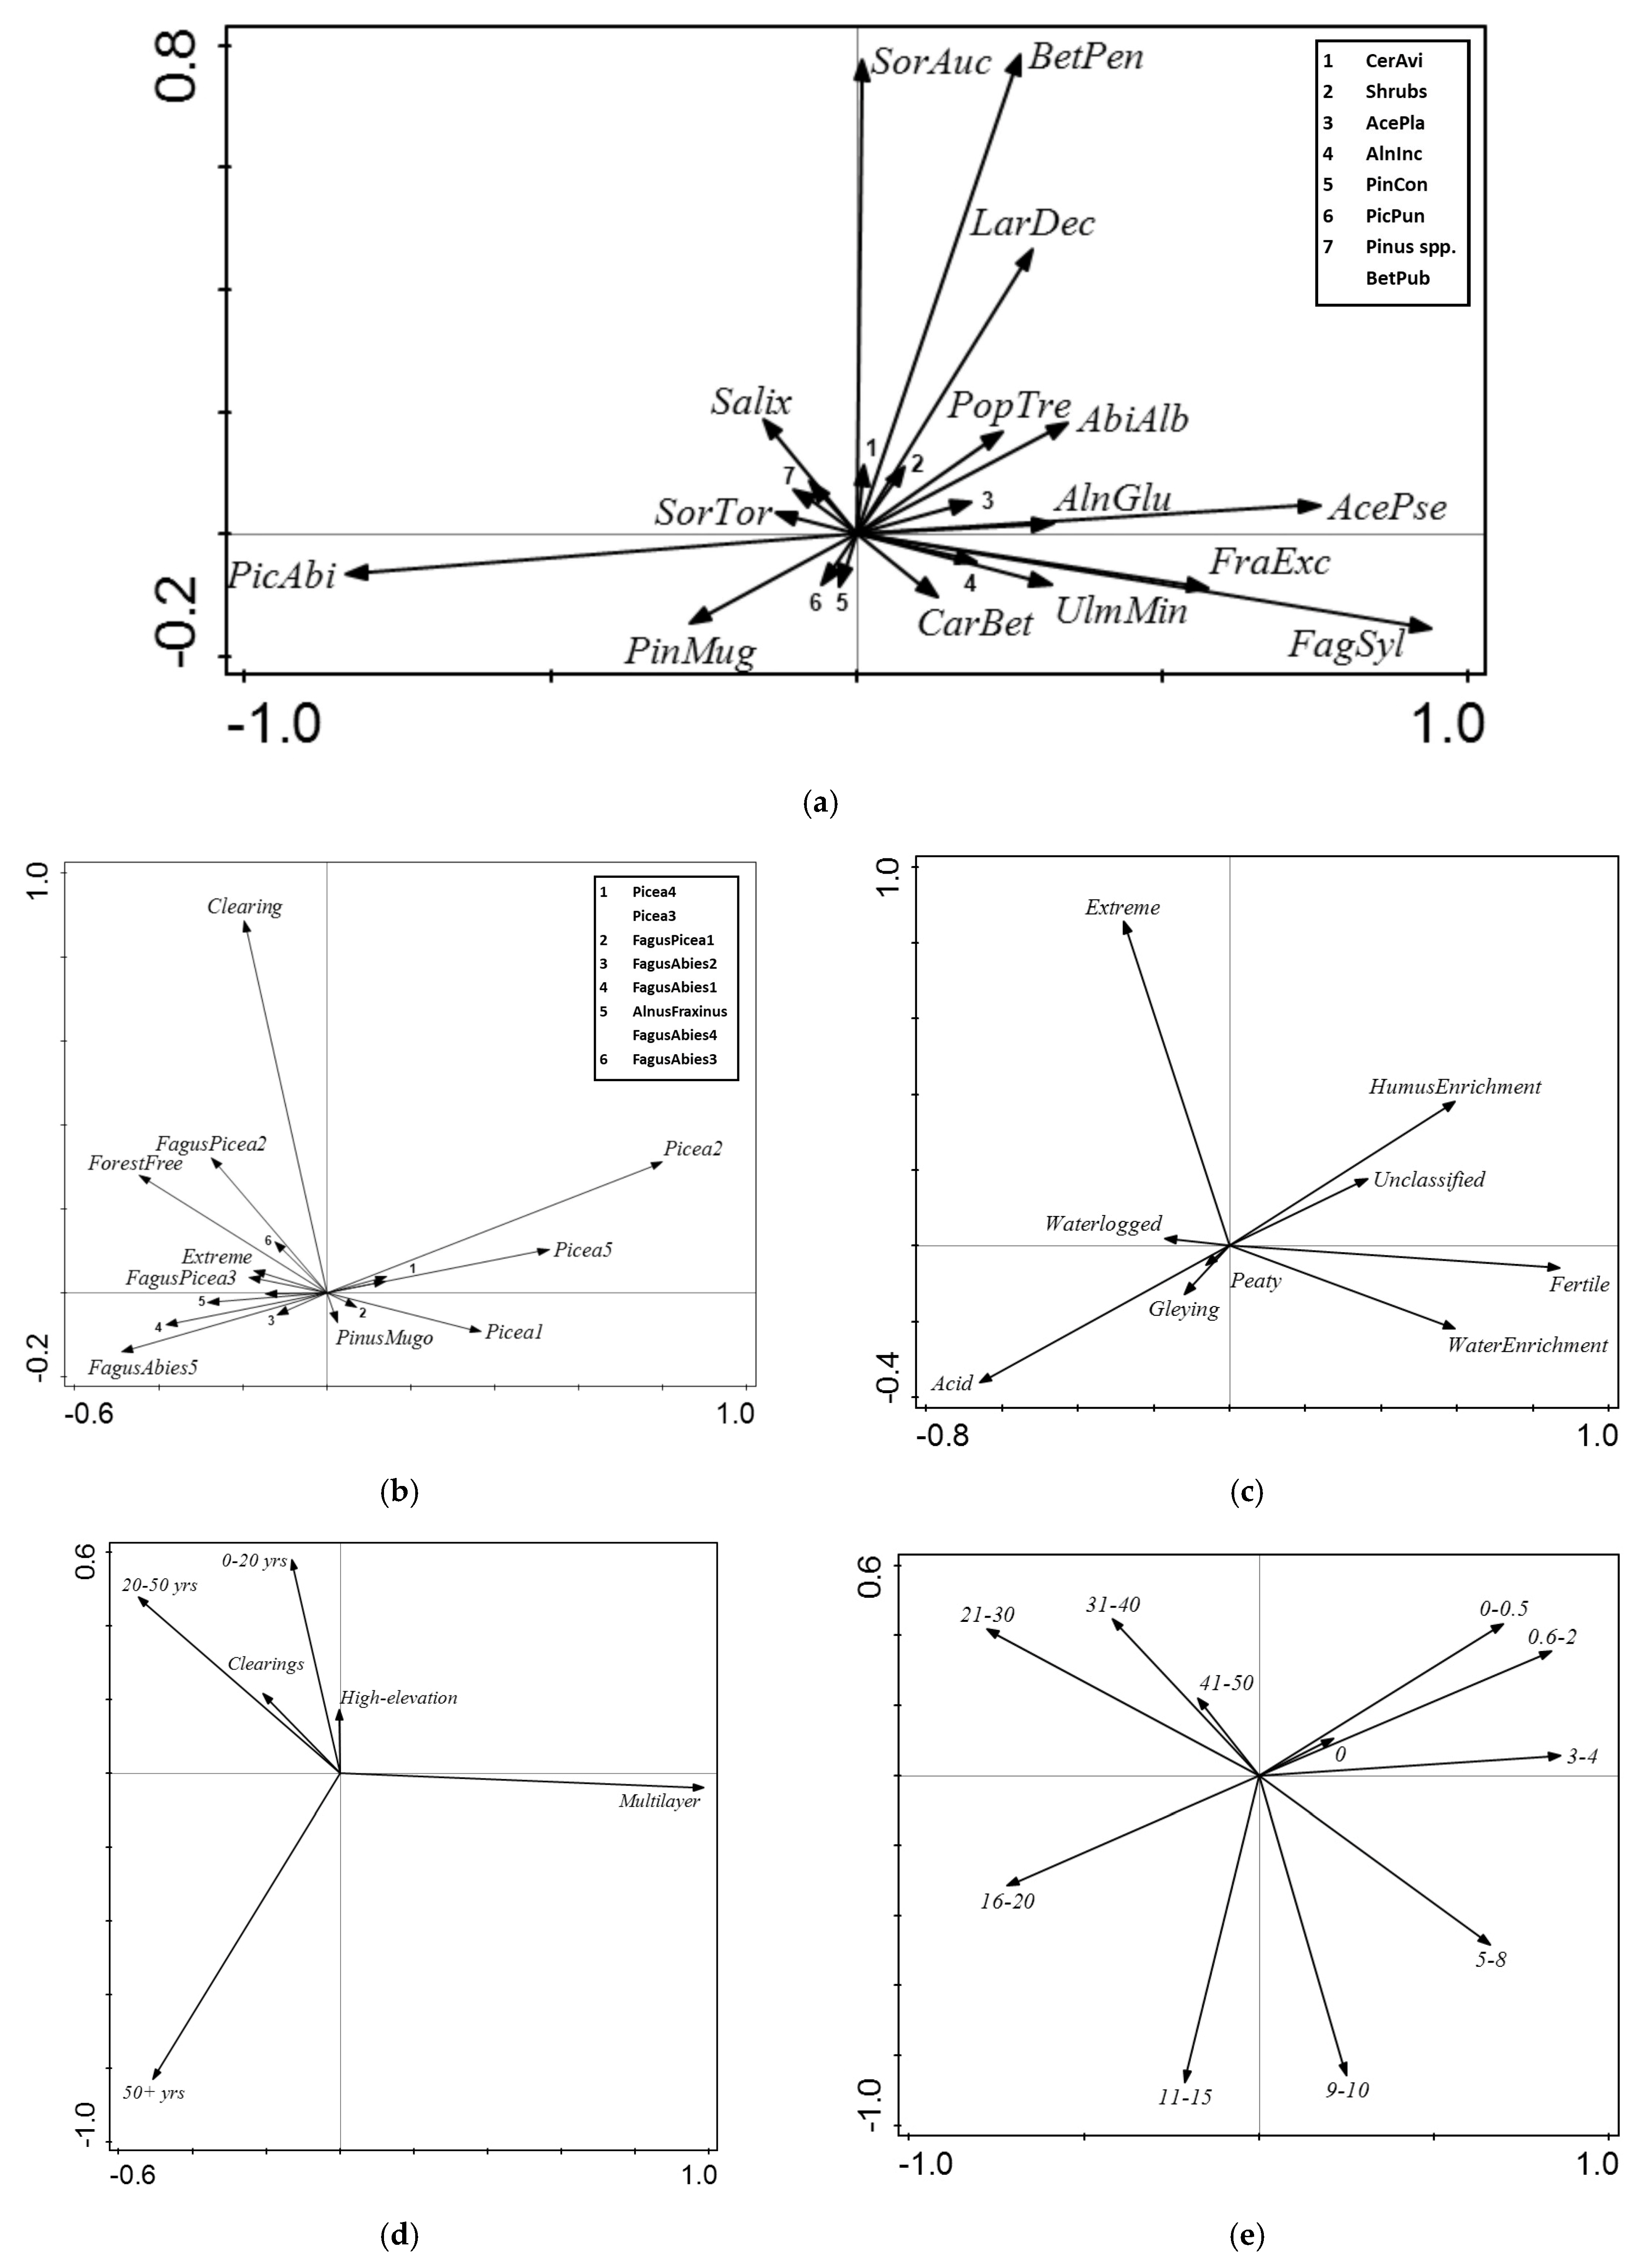
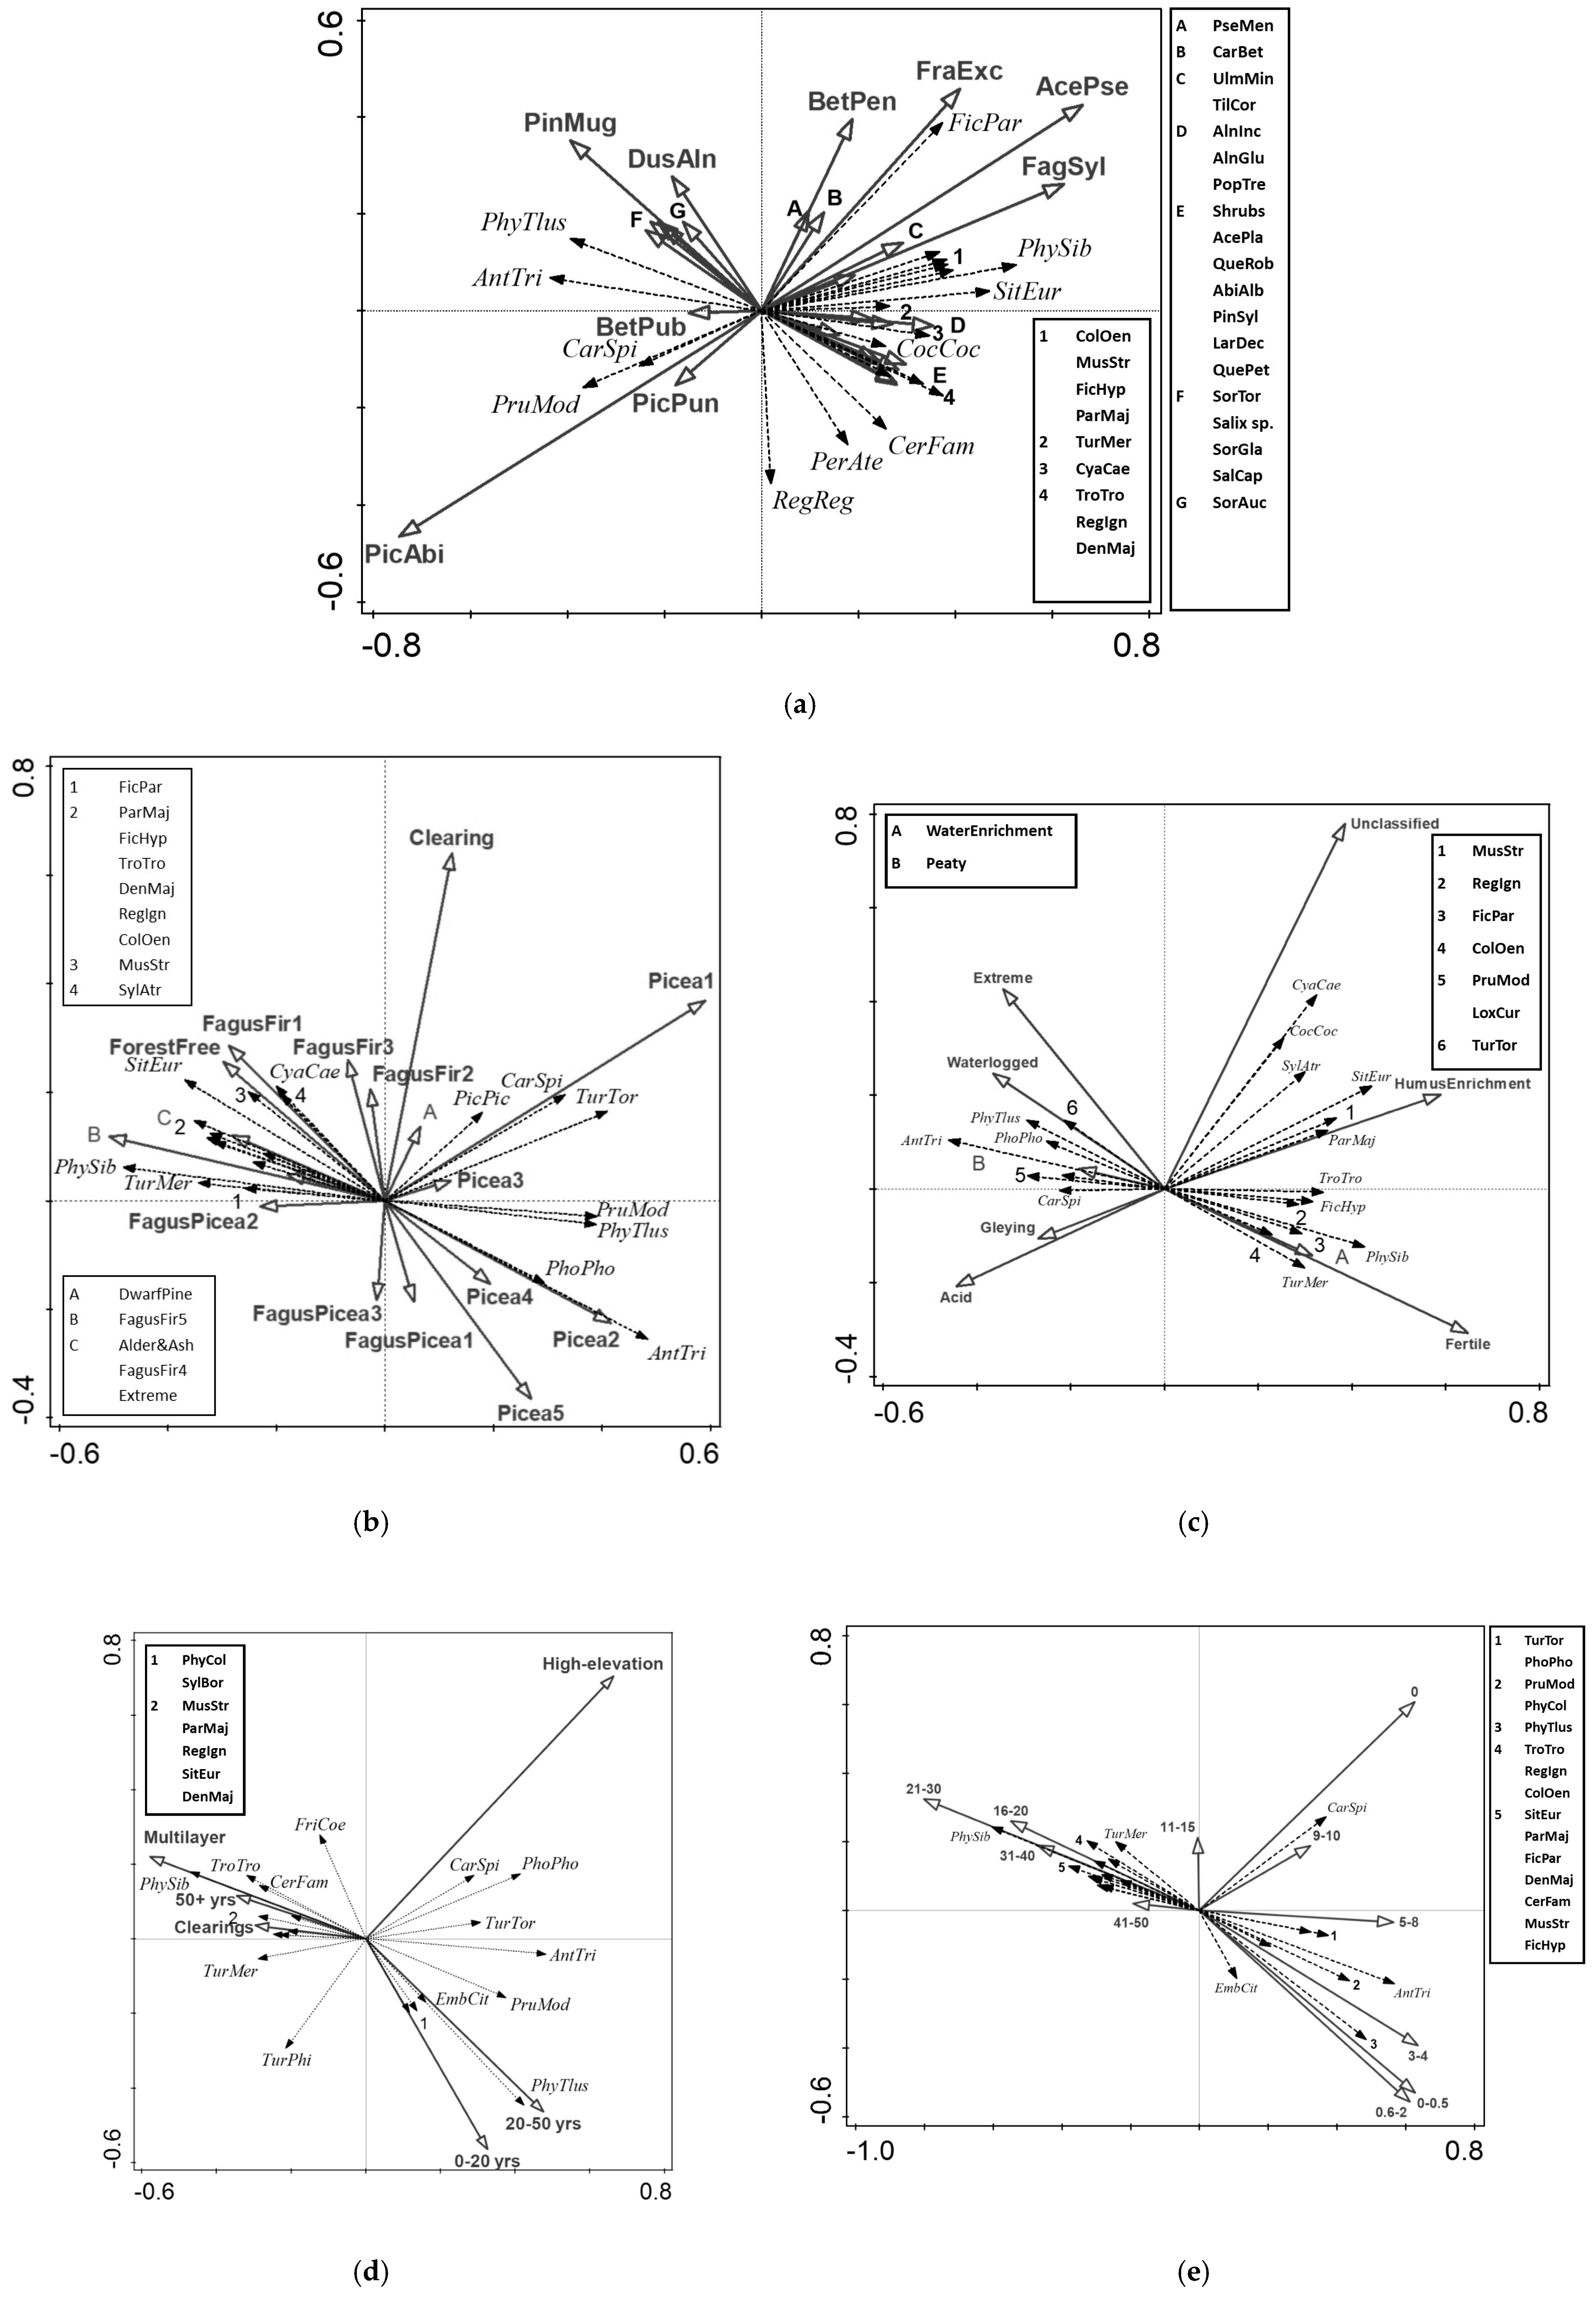
3.3. RDA—Tree Species Composition

The tree species composition predictors separate bird species into those that prefer forests with a diverse composition of broadleaved trees (consisting mainly of sycamore maple, beech, and ash) from birds that prefer forests dominated by spruce and/or scrub (Figure 5a).

3.4. RDA—Target Forest Vegetation

The first axis divides the bird species into those that prefer stands with target vegetation linked to higher altitudes with a predominance (more than 90%) of conifers (‘mainly alpine spruce forests’, ‘acidic spruce forests’, and ‘waterlogged spruce forests’) in its positive part, and species that prefer stands with target vegetation located mainly at lower altitudes, where deciduous trees are strongly represented (more than 20%), i.e., ‘live fir beech’, ‘exposed live fir beech’, and ‘acid fir beech’) in its negative part. The distribution also reflects the diversity of type composition in the individual plots, with the positive part of the first axis being dominated by plots comprising a small number of types, whereas the negative part of the first axis is dominated by plots comprising a more diverse mix of target vegetation types (Figure 5b).

3.5. RDA—Forest Phytosociology

The first axis divides birds into species of rich habitats with a diverse composition of types in the positive part versus species of montane forests and poor habitats in the negative part (Figure 5c).

3.6. RDA—Vertical Structure of Forest Vegetation

In the positive part of the first axis, there are species that prefer a structurally richer forest structure, i.e., a multi-level mature forest stand, where the trees of the upper layer are older than 50 years and their calliper thickness is at least 20 cm. In the negative part of the first axis, we find species favouring young forest stands (less than 50 years old, with a census thickness of less than 20 cm), or montane forests and mesic stands of dwarf mountain pine (Figure 5d).

3.7. RDA—Vegetation Height

The first axis divides the bird species into those species that seek nesting habitats in the stands with the increasing proportion of high vegetation categories from twenty to fifty metres (in the positive part of the axis) and into those that prefer an increasing proportion of low vegetation height categories from zero to two metres (in the negative part of the axis).
The variation partitioning analysis shows that the proportion of explained variability that cannot be explicitly assigned to one of the vegetation descriptions does not fall below 20% when comparing pairs of vegetation descriptions. The variability explained by a single vegetation description does not fall below 19% (Figure 5e).

4. Discussion

4.1. Use of Forest Management Plans in the Research and Management of Forest Bird Communities

Our results show the pronounced relationships between the diversity or species composition of bird communities and the forest stand characteristics available in forest management plans. Vegetation characteristics are commonly used in bird community research (tree species composition, vertical structure of vegetation, tree height), but characteristics seemingly not related to birds (forest typology, target forest vegetation) also affect the diversity and the species composition of forest bird communities. Moreover, in all analyses of community composition, all vegetation characteristics affect the occurrence and the abundance of similar bird species. Therefore, all environmental descriptions used in forestry practice can be used to predict the composition of bird communities and to identify habitats and sites of higher conservation value.
The proportion of explained variability in the analyses of species composition ranges from 6.0% (vertical forest stand structure) to 8.6% (vegetation height). These values may seem low, but this is due to the counting method used. In the point count method, a single sample (point) represents only a small part of the bird community under study. The differences between the samples are, therefore, largely random.
Forestry data have been used for the analysis of bird communities’ composition in temperate forests in only a few studies so far. French study [47] worked with records from the French National Forest Office including tree species composition, the amount of dead trees and the sum of the cross-sectional area of all trees at a height of 1.3 m above the ground as an indication of stand age and density. The study took place in the French Bretagne region, in intensively managed temperate mixed forests composed mainly of sessile oak and pedunculate oak. Data from the national forest inventory in Germany were used in research on bird communities in the forests of western Germany [48]. They identified forest stand age and forest ownership type as key factors influencing bird diversity. The authors conclude that state, federal, and municipal forests have a significantly higher proportion of dead wood and a lower proportion of coniferous trees compared to private forests and these characteristics increase the diversity of bird species.
The influence of the structure and management on forest bird species diversity was studied in forests in the Swiss canton of Zurich [49]. The study took place in the eastern part of the Swiss plateau in predominantly coniferous forests dominated by Norway spruce, beech, and silver fir. They used data from the National Forest Inventory of Switzerland. In agreement with our results, they found a positive effect of higher age, diverse vertical structure, and a high proportion of deciduous tree species on bird diversity. Moreover, they highlight the positive effect of small fluctuations in tree volume and tree species diversity, which they find to be associated with the multi-functional silvicultural management in stands.
Data from the national forest inventory for species composition analysis of bird communities were also used in the eastern USA [50]. The dominant forest types in the study area included oak-hickory and mixed hardwoods with typical dominant tree species beech (Fagus spp.), birch (Betula spp.), hickory (Carya spp.), maple (Acer spp.), oak (Quercus spp.), tulip poplar (Liriodendron tulipifera L.), and pine (Pinus spp.) genera. They used some detailed characteristics (stand age, stand size, site productivity class code, trees per hectare, average diameter of all trees, average height of all trees, and detailed landscape metrics) that gave a good indication of bird community composition. They believe that such characteristics reflect other vegetation parameters. For example, the larger proportion of dead stems brings more light into the stand and allows the development of an important shrub understory for many species.
In contrast to these studies, our study compares the effect of vegetation characteristics provided by different types of forestry plans and inventories and we show that they reflect similar relationships between vegetation and the species composition of bird communities.

4.2. Bird Community Diversity and Vegetation Characteristics from Forest Management Plans

The analysis of the species richness of bird communities in the forests in Krkonoše Mts National Park showed that species richness increases with the increasing representation of deciduous species but also of less widespread coniferous species (pine, larch), in forests where tree species are arranged in multi-layered stands with an upper height category of 20–40 m, which are found on soil-rich habitats and whose target forest vegetation are various types of fir beech. In contrast, diversity is reduced by the high proportion of spruce and mountain dwarf pine in waterlogged habitats and with a higher proportion of stands in the 0–0.5 m height category.
Studies describing the effect of tree diversity on bird communities in temperate forests have focused mainly on the influence of the percentage of coniferous and deciduous species. The shared presence of coniferous and deciduous trees significantly increases the diversity of bird communities, as adaptations resulting from different leaf morphologies often lead to birds specializing in one of the two tree groups [11,23,24]. The increase in diversity in mountainous mixed forests compared to pure spruce forests was found in Slovakia [51]. The effect of differences in the representation of deciduous and coniferous trees in natural as well as cultivated forests probably exceeds even the effect of the spatial structure of the vegetation and seems to be a key factor influencing the structure and diversity of bird communities in the temperate zone of the northern hemisphere [13,22,23,52,53,54].
Our results moreover show that even the characteristics that should not directly affect the species richness of bird communities are potential sources of information about it. Bird diversity is positively correlated with the presence of wetter and more nutrient-rich soil types but negatively affected by the presence of poor soil types.
The relationship between the pedological characteristics of the habitat and the species composition of the avifauna could be best explained by the association of mixed stands with more productive and nutrient-rich habitats [55,56]. Moreover, pedological characteristics are largely linked to elevation, which determines the predominant soil types and consequently potential forest communities [55,56]. Declines in bird community diversity with elevation have been repeatedly demonstrated in temperate forests [11,23,24].
Surprisingly, higher diversity is also associated with a higher proportion of certain target vegetation, namely exposed acid fir beech, exposed nutrient fir beech, and acid fir beech. However, this is not the actual vegetation present but a long-term goal of forest management. The vegetation of the existing predominantly cultivated forests, therefore, seems to reflect to some extent the condition of the habitats that define the target vegetation.
In terms of vertical vegetation structure characteristics, diversity is positively correlated with the presence of multi-level stands with a higher tree height. The highest trees in these stands are also among the oldest. In contrast, bird diversity decreases in the youngest stands and also in dwarf stands at high elevations. The higher species richness of bird communities in older stands is well known [15,16]. Stands with old trees provide more resources [17,18], mainly due to the abundance of dead wood, tree cavities and/or the more complex vertical structure of these stands [57,58,59]. Old trees also increase bird diversity indirectly through the food supply provided by resident invertebrates, which find suitable microhabitats in the dead wood of old trees [17,18]. The coexistence of a wider spectrum of bird species is limited in younger forest stands because food resources are less abundant there and the vertical structure of the vegetation is simpler [60].
At first sight, the positive effect of non-forest areas in our results is surprising. However, in study in Indian forest stands that there was a higher species richness in moderately disturbed sites, where there was greater vegetation heterogeneity than in undisturbed stands [61], and this seems to be true for the forests of the Krkonoše Mts National Park as well. The significant positive effect of the presence of non-forest habitats is probably the result of an edge effect, which is also well known from forest bird communities [62,63,64].

4.3. Species Composition of Bird Communities and Vegetation Characteristics from Forest Management Plans

In all five RDA analyses of Krkonoše Mts bird communities, similar groups of best-fitting bird species respond to first axis compositional gradients, although the vegetation is characterised in these analyses in different ways, ranging from tree species composition over phytosociological classification and target forest vegetation to descriptions of vertical forest stand structure and forest height obtained by remote sensing. Thus, different vegetation cover characteristics, both species-based and structural-based, are reflected in the composition of the bird community in a similar way, and each of the vegetation descriptions is, itself, useful for explaining but also predicting the composition of bird communities. This conclusion is confirmed by the variance partitioning analysis, in which we compared the variability explained by all possible pairs of vegetation descriptions. In none of them, the proportion of variability explained by the two descriptions does not fall below 20%.
The tree composition and spatial structure of forest stands and consequently the composition of their bird communities is likely ultimately influenced by the most variable abiotic parameter of the study area—elevation. It is reflected in all vegetation characteristics. In the negative part of the first axis of all ordination analyses, we find forests of higher altitudes with no or minimal proportion of deciduous trees, on poor soils, with a simpler vertical structure and lower overall height; in the positive part, forests of lower to middle altitudes, which have mixed species composition, on more fertile soils and with a more complex vertical structure.
On both sides of the axis, we find two groups of species. The first can be described as specialists of a certain forest type, whose frequency of occurrence in the study area is less than 12%. In the forests of the higher altitudes, these include only the ring ouzel (8.42%) and the redstart (11.93%), while in the forests of the lower altitudes they are the stock dove (9.47%), spotted flycatcher (5.96%), pied flycatcher (9.82%), red-breasted flycatcher (4.00%), and hawfinch (4.91%). The ring ouzel, the first of the specialists in higher altitude forests, breeds in the study area at altitudes mostly above 900 m a.s.l. in the environment of mountain spruce forests, namely at the edges of meadow enclaves and at the upper forest boundary. Eventually, it may also inhabit continuous scrub stands [35]. As a habitat specialist of forests at higher elevations, the redstart may be a somewhat surprising element. In fact, the redstart inhabits almost the entire territory of the Krkonoše from the foothills to the upper forest boundary [35]. However, its occurrence is abundant in the study area, only in dilute mountain spruce forests, which meet its requirements for a park landscape with an open tree canopy [35]. Lower to middle-altitude forest specialists mainly inhabit structurally rich deciduous (beech) and mixed (beech, spruce) forests, less frequently spruce stands with an admixture of beech and only rarely pure spruce stands [35].
The stock dove and red-breasted flycatcher are different from other specialists of lower altitudes. Throughout the study area, these species are specialists in forests with a high proportion of beech [35]. Other specialists of lower altitudes are not rare species either in the Krkonoše Mountains or in the Czech Republic. In the studied area, however, they are bound only to forests with a more prominent representation of deciduous trees.
The second group of bird species consists of generalists, whose frequency of occurrence in the study area is higher than 17%. In the higher-elevation forests, these include the Eurasian siskin (55.44%), the tree pipit (34.39%), the willow warbler (49.47%) and the dunnock (65.96%). In lower elevation forests, these species include the firecrest (57.19%), Eurasian treecreeper (52.63%), wren (76.14%), Eurasian nuthatch (27.37%), wood warbler (40.70%), great tit (23.86%), blackbird (72.63%), blue tit (17.89%) and great spotted woodpecker (33.33%). The selected abundant species are characterized by greater variability in abundance than the others and are, therefore, more sensitive to the environmental parameters captured in the individual vegetation descriptions.
No species with a frequency lower than 3% entered the groups of best-fitting species. Of the more numerous specialists, i.e., species with a frequency higher than 3% and lower than 17%, some woodland species with low breeding density were not selected: the common raven (9%), Eurasian nutcracker (5%), marsh tit (6%) and species that avoid continuous woodland: common starling (4%), hooded crow (4%), and lesser redpoll (4%). Also, some of the abundant forest species with a frequency higher than 17% did not penetrate the best-fitting species: the robin (95.44%), European song thrush (91.58%), common wood pigeon (67.37%), coal tit (91.23%), goldcrest (78.60%), mistle thrush (67.02%), crested tit (39.65%), Eurasian bullfinch (36.14%), Eurasian jay (27.72%), and black woodpecker (23.16%).
Why some generalists respond to vegetation descriptions and others do not is not clear at first glance. However, better-fitting species are characterised by higher variability in abundance as compared to less-fitting species. This suggests that, although all abundant species are found in the forests of the Krkonoše Mountains over a wide area, the better fitting ones respond to the species composition and spatial structure of the vegetation with more pronounced differences in their abundance. The abundance of such common species may indicate the presence of more valuable forest stands.
In addition to species that are well fitted for three or more vegetation descriptions, we also find species that fit only one: the garden warbler (7.7%), yellowhammer (5.6%), common chiffchaff (83.5%), red crossbill (31.9%), Eurasian chaffinch (100.0%), and blackcap (98.9%). With the exception of the red crossbill, these species respond more strongly to the characteristics of the vertical structure of the vegetation. This is probably due to their specific habitat requirements, which these characteristics capture well. The garden warbler and the yellowhammer are low-abundance species, which are tied to the youngest stages of stands or to the edges of bare areas. In contrast, the chiffchaff, common chaffinch, and blackcap are very abundant species that reach higher abundances in mixed, richly vertically structured multi-level forests. At first glance, the response of the red crossbill to the forest phytocoenology and target forest vegetation, which are based on edaphic categories, is the strangest. The red crossbill is one of the songbirds with very weak territoriality. Thus, its immediate occurrence may not be associated with a particular stand type. However, it seems to prefer higher elevation forests, which both vegetation descriptions reflect.
A number of large-scale monitoring programmes for birds and other animal groups are currently underway worldwide [65]. The value of their results is enhanced when changes in biota are linked to specific environmental changes. However, the problem is to obtain adequate environmental data. The collection of such data is inadequate in many studies, and although it is essential to know not only about species but also about their habitat to understand ecological trends, only about half of monitoring schemes collect data on habitat conditions. This shortfall severely limits the potential for ecological interpretations and conservation applications [65]. However, other resources are offered. In all more developed countries, forest management relies on detailed plans depicting both the species composition of tree species and the spatial structure of stands. In our study, we used forestry plans as a predictor of species richness and species composition of forest bird communities in the Krkonoše National Park.
A detailed analysis of the relationships between the vegetation characteristics of the forests in the Krkonoše Mts National Park and the species composition of their bird communities provide surprisingly robust results. At first glance, various information contained in the forestry documentation paints a similar picture of the environmental factors influencing the composition of bird communities and it also predicts the occurrence of forest biotopes of conservation value.

Supplementary Materials

The following supporting information can be downloaded at: https://www.mdpi.com/article/10.3390/d17050351/s1.

Author Contributions

J.Š.—writing—original draft preparation; P.Š.—methodology of statistics; R.F.—methodology, writing—review and editing. All authors have read and agreed to the published version of the manuscript.

Funding

This research was funded by Czech–Poland Cross-Border Cooperation Programme within the Fauna of the Krkonoše Mts project number CZ 3.22/1.2.00/12.03299.

Institutional Review Board Statement

Not applicable.

Data Availability Statement

The original contributions presented in this study are included in the article/Supplementary Materials. Further inquiries can be directed to the corresponding author.

Acknowledgments

We would like to thank the Administration of the Krkonoše Mts National Park for providing data and for making this study possible. We would like to thank Petr Veselý, Martin Konvička (Faculty of Science, University of South Bohemia in České Budějovice) for their valuable advice and consultation and Jan Pačák (Administration of the Krkonoše Mts National Park in Vrchlabí) for their help in processing the data using GIS tools.

Conflicts of Interest

The authors declare no conflict of interest.

References

  1. Stratfod, J.A.; Sekercioglu, C.H. Birds in forests ecosystems. In Handbook of Forest Ecology, 1st ed.; Peh, K.S.H., Corlett, R.T., Bergeron, Y., Eds.; Routledge: London, UK, 2015. [Google Scholar] [CrossRef]
  2. Block, W.M.; Brennan, L.A. The habitat concept in ornithology. In Current Ornithology; Power, D.M., Ed.; Plenum Press: London, UK, 1993; pp. 35–91. [Google Scholar]
  3. Muiruri, E.W.; Rainio, K.; Koricheva, J. Do birds see the forest for the trees? Scale-dependent effects of tree diversity on avian predation of artificial larvae. Oecologia 2016, 180, 619–630. [Google Scholar] [CrossRef] [PubMed]
  4. Robinson, S.K.; Holmes, R.T. Foraging behavior of forest birds: The relationship among search tactics, diet and habitat structure. Ecology 1982, 63, 1918–1931. [Google Scholar] [CrossRef]
  5. Whelan, C.J. Foliage structure influences foraging of insectivorous forest birds: An experimental study. Ecology 2001, 82, 219–231. [Google Scholar] [CrossRef]
  6. Quine, C.P.; Fuller, R.J.; Smith, K.W.; Grice, P.V. Stand management: A threat or opportunity for birds in British woodland? Ibis 2007, 149, 161–174. [Google Scholar] [CrossRef]
  7. Wood, E.M.; Pidgeon, A.M.; Liu, F.; Mladenoff, D.J. Birds see the trees inside the forest: The potential impacts of changes in forest composition on songbirds during spring migration. For. Ecol. Manag. 2012, 280, 176–186. [Google Scholar] [CrossRef]
  8. MacArthur, R.H.; MacArthur, J.W. On bird species diversity. Ecology 1961, 42, 594–598. [Google Scholar] [CrossRef]
  9. MacArthur, R.H.; MacArthur, J.W.; Preer, J. On bird species diversity II. Prediction of bird censuses from habitat measurements. Am. Nat. 1962, 96, 167–174. [Google Scholar] [CrossRef]
  10. Jones, J. Habitat selection studies in avian ecology: A critical review. Auk 2001, 118, 557–562. [Google Scholar] [CrossRef]
  11. James, F.C.; Wamer, N.O. Relationships between temperate forest bird communities and vegetation structure. Ecology 1982, 63, 159–171. [Google Scholar] [CrossRef]
  12. Canterbury, G.E.; Martin, T.E.; Petit, D.R.; Petit, L.J.; Bradford, D.F. Bird communities and habitat as ecological indicators of forest condition in regional monitoring. Conserv. Biol. 2000, 14, 544–558. [Google Scholar] [CrossRef]
  13. Lemaitre, J.; Darveau, M.; Zhao, Q.; Fortin, D. Multiscale assessment of the influence of habitat structure and composition on bird assemblages in boreal forest. Biodivers. Conserv. 2012, 21, 3355–3368. [Google Scholar] [CrossRef]
  14. Moudrý, V.; Moudrá, L.; Barták, V.; Bejček, V.; Gdulová, K.; Hendrychová, M.; Moravec, D.; Musil, P.; Rocchini, D.; Šťastný, K.; et al. The role of the vegetation structure, primary productivity and senescence derived from airborne LiDAR and hyperspectral data for birds diversity and rarity on a restored site. Landsc. Urban Plan. 2021, 210, 104064. [Google Scholar] [CrossRef]
  15. Laiolo, P. Effects of habitat structure, floral composition and diversity on a forest bird community in north-western Italy. Folia Zool. 2002, 51, 121–128. [Google Scholar]
  16. Moning, C.; Müller, J. Critical forest age thresholds for the diversity of lichens, molluscs and birds in beech (Fagus sylvatica L.) dominated forests. Ecol. Indic. 2009, 9, 922–932. [Google Scholar] [CrossRef]
  17. Honkanen, M.; Roberge, J.M.; Rajasärkkä, A.; Mönkkönen, M. Disentangling the effects of area, energy and habitat heterogeneity on boreal forest bird species richness in protected areas. Glob. Ecol. Biogeogr. 2010, 19, 61–71. [Google Scholar] [CrossRef]
  18. Elo, M.; Roberge, J.M.; Rajasarkka, A.; Mönkkonen, M. Energy density and its variation in space limit species richness of boreal forest birds. J. Biogeogr. 2012, 39, 1462–1472. [Google Scholar] [CrossRef]
  19. Wiens, J.A. Ecology of Bird Communities. Vol I; Cambridge University Press: Cambridge, UK, 1989; 539p. [Google Scholar]
  20. Easton, W.E.; Martin, K. The effect of vegetation management on breeding bird communities in British Columbia. Ecol. Appl. 1998, 8, 1092–1103. [Google Scholar] [CrossRef]
  21. Díaz, L. Influences of forest type and forest structure on bird communities in oak and pine woodlands in Spain. For. Ecol. Manag. 2006, 223, 54–65. [Google Scholar] [CrossRef]
  22. Donald, P.F.; Fuller, R.J.; Evans, A.D.; Gough, S.J. Effects of forest management and grazing on breeding bird communities in plantations of broadleaved and coniferous trees in western England. Biol. Conserv. 1998, 85, 183–197. [Google Scholar] [CrossRef]
  23. Reif, J.; Storch, D.; Voříšek, P.; Šťastný, K.; Bejček, V. Bird-habitat associations predict population trends in central European forest and farmland birds. Biodivers. Conserv. 2008, 17, 3307–3319. [Google Scholar] [CrossRef]
  24. Willson, M.F.; Comet, T.A. Bird Communities of Northern Forests: Ecological Correlates of Diversity and Abundance in the Understory. Condor 1996, 98, 350–362. [Google Scholar] [CrossRef]
  25. Adams, B.T.; Matthews, S.N. Diverse temperate forest bird assemblages demonstrate closer correspondence to plant species composition than vegetation structure. Ecography 2019, 42, 1752–1764. [Google Scholar] [CrossRef]
  26. MacArthur, R.H. Population Ecology of Some Warblers of Northeastern Coniferous Forests. Ecology 1958, 39, 599–619. [Google Scholar] [CrossRef]
  27. MacNally, R.; Parkinson, A.; Horrocks, G.; Young, M. Current Loads of Coarse Woody Debris on Southeastern Australian Floodplains: Evaluation of Change and Implications for Restoration. Restor. Ecol. 2002, 10, 627–635. [Google Scholar] [CrossRef]
  28. Holmes, R.T.; Robinson, S.K. Tree species preferences of foraging insectivorous birds in a northem hardwoods forest. Oecologia 1981, 48, 31–35. [Google Scholar] [CrossRef]
  29. Gabbe, A.P.; Robinson, S.K.; Brawn, J.D. Tree-Species Preferences of Foraging Insectivorous Birds: Implications for Floodplain Forest Restoration. Conserv. Biol. 2002, 16, 462–470. [Google Scholar] [CrossRef]
  30. Hartung, S.C.; Brawn, J.D. Effects of Savanna Restoration on the Foraging Ecology of Insectivorous Songbirds. Condor 2005, 107, 879–888. [Google Scholar] [CrossRef]
  31. Holmes, R.T.; Schultz, J.C. Food availability for forest birds: Effects of prey distribution and abundance on bird foraging. Can. J. Zool. 1988, 66, 720–728. [Google Scholar] [CrossRef]
  32. Shutt, J.D.; Bolton, M.; Benedicto Cabello, I.; Burgess, M.D.; Phillimore, A.B. The effects of woodland habitat and biogeography on blue tit Cyanistes caeruleus territory occupancy and productivity along a 220 km transect. Ecography 2018, 41, 1967–1978. [Google Scholar] [CrossRef]
  33. Tomppo, E.O.; Schadauer, K. Harmonization of National Forest Inventories in Europe: Advances under COSTAction E43. For. Sci. 2012, 56, 191–200. [Google Scholar] [CrossRef]
  34. Kučera, M.; Adolt, R. (Eds.) Národní Inventarizace Lesů v České Republice—Výsledky Druhého Cyklu 2011–2015, 1st ed.; Ústav pro Hospodářskou Úpravu Lesů Brandýs nad Labem: Brandýs nad Labem-Stará Boleslav, Czech Republic, 2019. [Google Scholar]
  35. Flousek, J.; Gramsz, B.; Telenský, T. Ptáci Krkonoš—Atlas Hnízdního Rozšíření 2012–2014; Správa KRNAP: Vrchlabí, Czech Republic, 2015; 480p. [Google Scholar]
  36. Branton, M.; Richardson, J.S. Assessing the value of the umbrella-species concept for conservation planning with meta-analysis. Conserv. Biol. 2011, 25, 9–20. [Google Scholar] [CrossRef] [PubMed]
  37. Roberge, J.M.; Angelstam, P.E.R. Usefulness of the umbrella species concept as a conservation tool. Conserv. Biol. 2004, 18, 76–85. [Google Scholar] [CrossRef]
  38. Suter, W.; Graf, R.F.; Hess, R. Capercaillie (Tetrao urogallus) and avian biodiversity: Testing the umbrella-species concept. Conserv. Biol. 2002, 16, 778–788. [Google Scholar] [CrossRef]
  39. Flousek, J.; Hartmanová, O.; Štursa, J.; Potocki, J. (Eds.) Krkonoše: Příroda, Historie, Život; Baset: Praha, Czech Republic, 2007; 863p. [Google Scholar]
  40. Lokvenc, T. Toulky Krkonošskou Minulostí; Kruh: Hradec Králové, Czech Republic, 1978; 264p. [Google Scholar]
  41. Bibby, C.J.; Burgess, N.D.; Hill, D.A.; Mustoe, S.H. Bird Census Techniques; Elsevier Science: Amsterdam, The Netherlands, 2000; 302p. [Google Scholar]
  42. Ter Braak, C.J.; Šmilauer, P.; Dray, S. Algorithmus and biplots for double constrained correspondence analysis. Environ. Ecol. Stat. 2018, 25, 171–197. [Google Scholar] [CrossRef]
  43. Černý, M.; Zahradníček, J.; Pařez, J.; Moravčík, P. Hospodářská úprava lesů na bázi statistické provozní inventarizace. Lesn. Práce 2000, 79, 60–62. [Google Scholar]
  44. Černý, M.; Zahradníček, J.; Pařez, J. Metoda integrované hospodářské úpravy lesů v lesích s bohatou strukturou. Lesn. Práce 2001, 80, 24–27. [Google Scholar]
  45. Plíva, K. Typologický Systém ÚHÚL; Brandýs nad Labem, ÚHÚL: Brandýs nad Labem-Stará Boleslav, Czech Republic, 1971. [Google Scholar]
  46. R Core Team. R: A Language and Environment for Statistical Computing; R Foundation for Statistical Computing: Vienna, Austria, 2021; Available online: https://www.R-project.org/ (accessed on 16 April 2025).
  47. Barbe, L.; Morel, R.; Rantier, Y.; Lebas, J.F.; Butet, A. Bird communities of a temperate forest: Spatio-temporal partitioning between resident and migratory species. J. Ornithol. 2018, 159, 457–469. [Google Scholar] [CrossRef]
  48. Reise, J.; Kukulka, F.; Flade, M.; Winter, S. Characterising the richness and diversity of forest bird species using National Forest Inventory data in Germany. For. Ecol. Manag. 2019, 432, 799–811. [Google Scholar] [CrossRef]
  49. Leitão, P.J.; Toraño Caicoya, A.; Dahlkamp, A.; Guderjan, L.; Griesser, M.; Haverkamp, P.J.; Norden, J.; Snäll, T.; Schröder, B. Impacts of forest management on forest bird occurrence patterns—A case study in Central Europe. Front. For. Glob. Change 2022, 5, 786556. [Google Scholar] [CrossRef]
  50. Fearer, T.M.; Prisley, S.P.; Stauffer, D.F.; Keyser, P.D. A method for integrating the Breeding Bird Survey and Forest Inventory and Analysis databases to evaluate forest bird–habitat relationships at multiple spatial scales. For. Ecol. Manag. 2007, 243, 128–143. [Google Scholar] [CrossRef]
  51. Birčák, T.; Reif, J. The effects of tree age and tree species composition on bird species richness in a Central European montane forest. Biologia 2015, 70, 1528–1536. [Google Scholar] [CrossRef]
  52. du Bus de Warnaffe, G.; Deconchat, M. Impact of four silvicultural systems on birds in the Belgian Ardenne: Implications for biodiversity in plantation forests. Biodivers. Conserv. 2008, 17, 1041–1055. [Google Scholar] [CrossRef]
  53. Hewson, C.M.; Austin, G.E.; Gough, S.J.; Fuller, R.J. Species-specific responses of woodland birds to stand-level habitat characteristics: The dual importance of forest structure and floristics. For. Ecol. Manag. 2011, 261, 1224–1240. [Google Scholar] [CrossRef]
  54. Bergner, A.; Avcı, M.; Eryiğit, H.; Jansson, N.; Niklasson, M.; Westerberg, L.; Milberg, P. Influences of forest type and habitat structure on bird assemblages of oak (Quercus spp.) and pine (Pinus spp.) stands in southwestern Turkey. For. Ecol. Manag. 2015, 336, 137–147. [Google Scholar] [CrossRef]
  55. Jobbagy, E.J.; Jackson, R.B. The vertical distribution of soil organic carbon and its relation to climate and vegetation. Ecol. Appl. 2000, 10, 423–436. [Google Scholar] [CrossRef]
  56. Pokorný, P. Neklidné Časy. Kapitoly ze Společných Dějin Přírody a Lidí; Dokořán: Praha, Czech Republic, 2011; 370p. [Google Scholar]
  57. Šebková, B.; Šamonil, P.; Janík, D.; Adam, D.; Král, K.; Vrška, T.; Hort, L.; Unar, P. Spatial and volume patterns of an unmanaged submontane mixed forest in Central Europe: 160 years of spontaneous dynamics. For. Ecol. Manag. 2011, 262, 873–885. [Google Scholar] [CrossRef]
  58. Wesołowski, T. “Lifespan” of woodpecker-made holes in a primeval temperate forest: A thirty year study. For. Ecol. Manag. 2011, 262, 1846–1852. [Google Scholar] [CrossRef]
  59. Seidling, W.; Travaglini, D.; Meyer, P.; Waldner, P.; Fischer, R.; Granke, O.; Chirici, G.; Corona, P. Dead wood and stand structure-relationships for forest plots across Europe. iFor.-Biogeosci. For. 2014, 7, 269. [Google Scholar] [CrossRef]
  60. Hurlbert, A.H. Species-energy relationships and habitat complexity in bird communities. Ecol. Lett. 2004, 7, 714–720. [Google Scholar] [CrossRef]
  61. Chettri, N.; Deb, D.C.; Sharma, E.; Jackson, R. The relationship between bird communities and habitat: A study along a trekking corridor in the Sikkim Himalaya. Mt. Res. Dev. 2005, 25, 235–243. [Google Scholar] [CrossRef]
  62. Kroodsma, R.L. Effect of edge on breeding forest bird species. Wilson Bull. 1984, 96, 426–436. [Google Scholar] [CrossRef]
  63. Yahner, R.H. Changes in wildlife communities near edges. Conserv. Biol. 1988, 2, 333–339. [Google Scholar] [CrossRef]
  64. Paquet, J.Y.; Vandevyvre, X.; Delahaye, L.; Rondeux, J. Bird assemblages in a mixed woodland–farmland landscape: The conservation value of silviculture-dependant open areas in plantation forest. For. Ecol. Manag. 2006, 227, 59–70. [Google Scholar] [CrossRef]
  65. Moussy, C.; Burfield, I.J.; Stephenson, P.J.; Newton, A.F.E.; Butchart, S.H.M.; Sutherland, W.J.; Gregory, R.D.; McRae, L.; Bubb, P.; Roesler, I.; et al. A quantitative global review of species population monitoring. Conserv. Biol. 2021, 36, e13721. [Google Scholar] [CrossRef]
Figure 1. Map of the study area.
Diversity 17 00351 g001
Figure 4. Variability in abundance (coefficient of variation) of individual bird species on study plots. Selected = best-fitting species selected by RDA, non-selected = other species.
Diversity 17 00351 g004
Figure 5. Effect of study plot vegetation on the composition of bird communities visualized on the first and second axes of the RDA: (a) tree species composition (see Table 1 for tree species names); (b) target vegetation categories; (c) forest phytocenology categories; (d) vertical tree structure categories. Forests are separated into high-elevation, multi-layered and single-layered stands, single-layered stands are further subdivided by age; (e) vegetation height categories. The categories are divided according to the maximum height range in meters.
Diversity 17 00351 g005
Table 2. Effect of vegetation characteristics on species diversity of bird communities (GLM). A separate model is built for each vegetation characteristic.
Species Composition of Vegetation CoverSpatial Structure of Vegetation
EffectpTree SpeciesForest PhytocenologyTarget Forest VegetationVertical Structure of VegetationVegetation Height
increases diversity<0.001European Beech non-forest habitatnon-forest habitat20–30 m
<0.01Pedunculate Oak, European Larch, Scots Pine, Aspennon-forest habitat multi-layered stand30–40 m
<0.05Wild Cherry, Alder, Goat Willow, Sycamore Maple, Sessile Oak, Rowan Treeenriched rocky habitat, fertile lush habitatexposed acid fir, exposed live fir, acid fir
reduces diversity<0.001Norway Sprucegley-poor habitatwatterlogged spruce, sour spruce
<0.01 0–0.5 m
<0.05Dwarf Mountain Pinegley habitat dwarf and alpine spruce forests, scrub pine forests
Table 3. Effect of individual vegetation characteristics of study plots on the composition of bird communities analyzed by RDA. Variability explained by first four axes.
Analysis 1st Axis2nd Axis3rd Axis4th Axis
RDAVegetation high8.611.861.250.58
RDATarget vegetation7.141.741.410.91
RDATree species composition6.882.11.441.36
RDAForest phytocenology6.051.861.51.09
RDAVertical stand structure6.011.621.050.64
Disclaimer/Publisher’s Note: The statements, opinions and data contained in all publications are solely those of the individual author(s) and contributor(s) and not of MDPI and/or the editor(s). MDPI and/or the editor(s) disclaim responsibility for any injury to people or property resulting from any ideas, methods, instructions or products referred to in the content.

