Article

Phylogeographic Analyses of the Viviparous Multiocellated Racerunner (Eremias multiocellata) in the Tarim Basin of China

1
School of Life Sciences and Engineering, Northwest Minzu University, Lanzhou 730030, China
2
Gansu Key Laboratory of Biomonitoring and Bioremediation for Environmental Pollution, School of Life Sciences, Lanzhou University, Lanzhou 730030, China
3
Engineering Research Center of Key Technology and Industrialization of Cell-Based Vaccine, Ministry of Education, Northwest Minzu University, Lanzhou 730030, China
*
Authors to whom correspondence should be addressed.
These authors contributed equally to this study and share first authorship.
Diversity 2025, 17(5), 313; https://doi.org/10.3390/d17050313
Submission received: 20 December 2024 / Revised: 21 April 2025 / Accepted: 23 April 2025 / Published: 25 April 2025

Abstract

:
The genealogical and geographical distribution of a species offers insights into its evolutionary narrative, encompassing its population dispersion, migration, adaptation, and speciation—key aspects for comprehending the genesis and sustenance of biodiversity. Using three mitochondrial genes on 115 samples, this study examined the phylogeographic structure, phylogenetic divergence, and environmental evolution of the viviparous multiocellated racerunner (Eremias multiocellata) in the Tarim Basin of China. Our analyses revealed a significant phylogenetic structure and suggested that the distributed populations began to diverge approximately 6.63 million years ago (Ma), influenced by the uplift of surrounding mountain ranges and glacial cycles, and further differentiated into distinct groups around 3.72 Ma–1.50 Ma, exhibiting genetic distinctions. These results supplement the foundational genetic data to the Tarim Basin and provide insights on how historical geological events affect the species distribution and genetic differentiation and species formation in this region.

1. Introduction

The Tarim Basin, situated at the heart of the Asian continent, is China’s largest inland basin. It extends from the eastern slopes of the Pamir Plateau in the west to Lop Nur and the Hexi Corridor in the east, and from the southern foothills of the Tianshan Mountains in the north to the northern foothills of the Kunlun Mountains in the south. Characterized by an extremely arid climate, the basin is home to the largest desert in Central Asia and the world’s second-largest shifting desert, the Taklamakan Desert [1].
The aridification of the Taklamakan Desert and its associated climate changes have significantly impacted the distribution and genetic structure of species within this desert environment [2,3]. Studies indicate that the desert was primarily shaped by two aridification processes: a minor event between 7 and 5.3 million years ago (Ma) and a more extensive one at 5.3 Ma [4,5,6,7]. The Pleistocene epoch experienced intense climate fluctuations, and the establishment of the modern Central Asian monsoon system—particularly the impact of the winter monsoon around 2.6 Ma—further exacerbated the expansion and aridification of the Taklamakan Desert [8,9,10,11,12]. Climate change has subjected the Tarim Basin to glacial and interglacial cycles during the Quaternary period. These cycles have led to alterations in the size of sand dunes and oases within the desert and have caused the habitats of flora and fauna near rivers to recede [12,13,14]. Moreover, the geographical distribution of desert species has also been altered in response to the oscillating glacial and interglacial periods [15]. Consequently, assessing genetic variation at a fine spatial scale in the region is crucial for understanding how environmental changes influence genetic variation patterns and evolutionary processes. Such assessments can inform targeted conservation strategies for the various species inhabiting the Taklamakan Desert.
Studying the phylogeography of a species is crucial for understanding and predicting its past and future distributions, serving as an essential tool in analyzing and researching the evolutionary processes of organisms. It can aid in uncovering the origins of species lineages, pathways of dispersal, and divergence of ancestral traits [16]. The phylogeographic and molecular phylogenetic studies in and around the Tarim Basin and the Taklamakan Desert have primarily focused on rare and endangered plants (e.g., [17,18,19,20,21,22,23,24]) and mammals, with scant attention given to other fauna groups. For example, studies on the endangered Yarkand hare (Lepus yarkandensis) have revealed limited gene flow due to habitat fragmentation and have elucidated the phylogenetic relationships between L. yarkandensis and its relatives [25,26,27]. In an effort to re-evaluate the taxonomic status of subspecies within the endangered Parian gazelle (Gazella subgutturosa), Abduriyim (2015) assessed the genetic distinctiveness between geographical populations through a mitochondrial gene analysis [28]. Pengfei Hu (2019) utilized simplified genomic sequencing techniques to conduct genetic diversity and phylogenetic analyses on the Tarim deer and four other deer species [29]. The results revealed that the Tarim deer and the wapiti (Cervus canadensis) have similar divergence times, dating back to approximately 0.8–2.2 million years ago, and that the two species have a close phylogenetic relationship [29]. Additional phylogeographic studies of the red deer (C. elaphus) have investigated genetic variation among Asian, European, and North American lineages, shedding light on the evolutionary patterns within the genus Cervus [30,31]. The findings from such studies provide valuable information for the conservation of species in this region.
Reptiles, particularly due to their high adaptability to desert and Gobi environments, are the dominant vertebrate species in the Tarim Basin [32]. The recorded reptiles in this area include species from families of the Agamidae, Lacertidae, Colubridae, and Gekkonidae, with Agamidae and Lacertidae exhibiting particularly remarkable species diversity [33]. However, despite their rich diversity, lizard species are facing a variety of threats. According to relevant research, reptiles in China face numerous threats and are experiencing rapid population declines and species extinctions, making them the most severely threatened group among vertebrates [34]. A comparison of species distribution ranges from 1950 to 2000 found that on average the number of key protected amphibian and reptile species at the county level in China declined by 28.8% [35]. The latest assessment of reptiles in China indicates that 30.5% of reptile species are threatened [36]. With increases in human activities, especially agricultural expansion, urban development, and deforestation, many natural habitats of reptiles have been destroyed or fragmented, increasing their risk of extinction [37]. In addition, global climate change and environmental pollution also pose potential threats to the survival of lizards [38,39].
Phrynocephalus axillaris, P. forsythii, and Eremias multiocellata are common reptile species in the Taklamakan Desert. These lizards play an important role in the ecosystem. They are not only predators of many small invertebrates but also food sources for birds and small mammals. In addition, the existence of lizards also reflects the health and stability of the ecosystem in this area [40,41]. P. axillaris has adapted to extreme arid environments [42], with a distribution range stretching from the Taklamakan Desert eastward to the Dunhuang and Turpan depressions [43]. P. forsythii, endemic to the Tarim Basin, is commonly found in alpine desert areas above 1000 m in elevation, showing a preference for arid desert or Gobi fringe habitats with low shrubbery [44,45]. E. multiocellata is a small, omnivorous, viviparous lizard, primarily distributed across semi-desert and desert regions in Mongolia, Kyrgyzstan, Kazakhstan, and northern China, such as the Tarim Basin, Yanqi Basin, Turpan Basin, and Hami Basin [46]. These species are not only crucial for maintaining the balance of desert ecosystems but also reflect the richness of biodiversity in the region. Studies have shown that the closely related P. axillaris and P. forsythii exhibited distinct evolutionary histories in the distribution range within the Tarim Basin [47]. The formation of the Yanqi Basin around 2.26 Ma may have led to the divergence of P. forsythii between the Tarim and Yanqi groups [47]. As for P. axillaris, its current populations were likely to have been established separately through population expansion following the formation of desert habitats since the Middle Pleistocene, with distinct groups being generated from subsequent dispersal events (from the Tarim to the Yanqi, Turpan, and Hami Basins) [47]. A genetic structure study of P. forsythii showed a certain degree of genetic differentiation in the Tarim Basin, with low levels of gene flow between groups and individual dispersal and migration being mainly confined within groups, overall exhibiting a clear genetic structure [48]. The results also suggested that geographic distance and environmental temperature changes may have a relatively significant impact on the observed genetic variation [48]. On the other hand, there are few reports on the phylogeography of E. multiocellata in the region. The previous research on species E. multiocellata has primarily focused on species identification, classification, and ecological adaptability [39,49,50,51]. These studies have contributed to elucidating the taxonomic status and adaptive strategies of E. multiocellata in its ecological niche. However, a comprehensive evaluation of the phylogeny of E. multiocellata at finer spatial scales remains uncharted territory.
In this study, utilizing three mitochondrial DNA (mtDNA) gene sequences from nine populations of E. multiocellata in the Tarim Basin, we specifically aimed (1) to uncover the phylogeographic patterns of these populations, potentially identifying genetically distinct lineages, and (2) to elucidate the relationship between historical environmental changes and fine-scale genetic variations. By doing so, we aimed to supplement and enrich the foundational genetic data to the Taklamakan Desert region, thereby providing insights on how historical geological events affect the species distribution and genetic differentiation and species formation in this region.

2. Materials and Methods

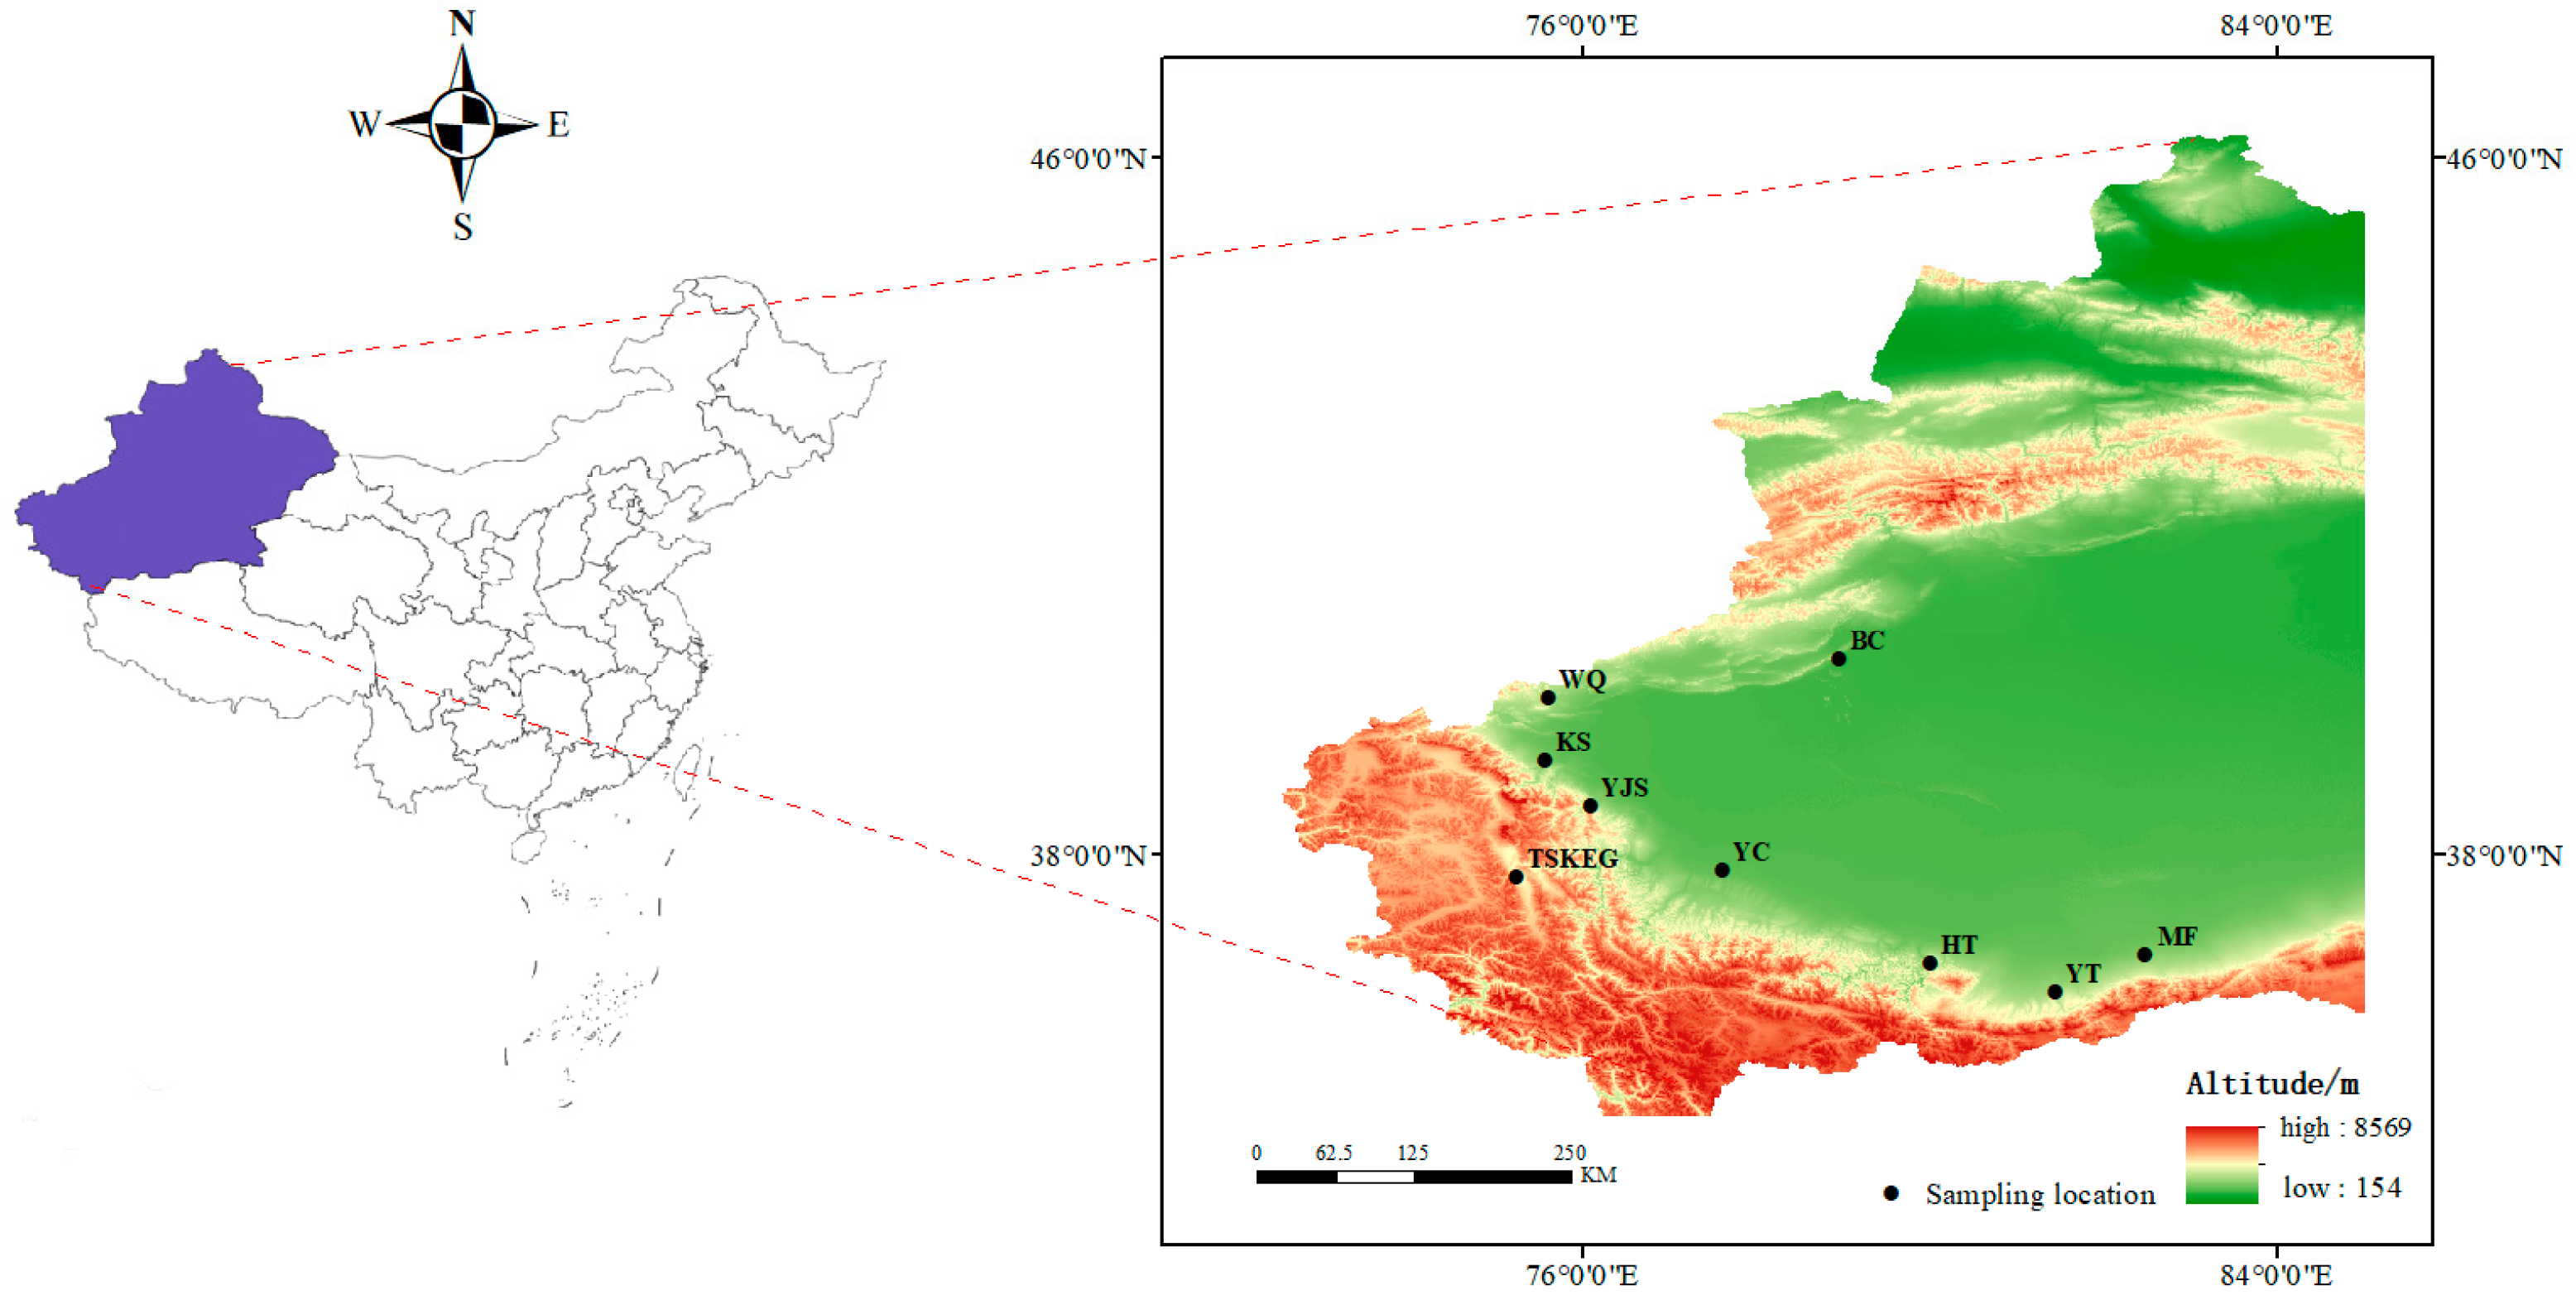
2.1. Sample Collection

Based on the reported distribution area of E. multiocellata in the Xinjiang region [52,53,54,55] and our own field observations, we selected nine sampling sites around the Tarim Basin, from which a total of 115 samples were collected (Wuqia, Minfeng, Yutian, Hetian, Yecheng, Yingjisha, Kashi, Tashikuergan, and Bachu; see Figure 1 and Table 1). The lizards were captured by hand, and a small piece of tissue (~5 mm2) was clipped from the posterior end of the tail. After removing one toe for identification purposes, the lizards were released at the site of capture. The tissue samples were stored in a 1:1 solution of saline and ethanol. Genomic DNA was extracted from the preserved tissue using an extraction kit following the manufacturer’s instructions (Accurate Biology, Changsha, Hunan, China).

2.2. mtDNA Gene Sequencing

Segments of three mtDNA genes were amplified: the NADH dehydrogenase subunit 2 (ND2), the cytochrome b (Cytb), and the mitochondrially encoded ATP synthase membrane subunit 6 (ATP6). The primers used for amplification were designed with the software Geneious Prime v2022.1.1 (www.geneious.com, accessed on 5 May 2024) based on the complete mitochondrial genome sequence of E. multiocellata (GenBank accession number KM257724.1) (see Table 2 for primer information). PCR amplifications were performed in a 25 μL volume containing 12.5 μL of 2× Pro Taq Master Mix, 0.1 μM to 0.6 μM of each primer, and approximately 100 ng of DNA. The PCR was carried out using the following conditions: an initial denaturation at 94 °C for 3 min; 35 cycles of denaturation at 94 °C for 45 s, annealing at 58 °C for 45 s, and extension at 72 °C for 1 min; and a final extension at 72 °C for 10 min. After visualization on a 0.8% agarose gel, the PCR products were sent for Sanger sequencing (TqGene Biotechnology Co., Ltd., Lanzhou, Gansu, China).
The sequences were edited and aligned using Geneious Prime v2022.1.1 (www.geneious.com, accessed on 26 May 2024). The sequences of the three genes were then concatenated (ND2 + Cytb + ATP6). Arlequin v3.5 [56] was employed to calculate the number of haplotypes (Nh), nucleotide diversity (π), and haplotype diversity (h) for the concatenated dataset and the three gene regions separately.

2.3. Phylogenetic Analyses

The phylogenetic trees were constructed via a maximum likelihood (ML) analysis and Bayesian Inference (BI) using RAxML v8.0.0 [57] and MrBayes 3.2.7 [58], respectively. Considering the potential difference in the mutation rates of the three genes, the concatenated sequence was partitioned using PartitionFinder 2 [59] prior to the tree construction with the optimal nucleotide substitution model determined under the Bayesian information criterion (BIC). Nine partitions were considered for ND2, Cytb, and ATP6: the first (pos1), second (pos2), and third (pos3) positions. The preferable partition scheme ultimately detected in PartitionFinder was as follows: (ATP6_pos1), (ATP6_pos2), (Cytb_pos2, ATP6_pos3), (Cytb_pos1, ND2_pos1), (ND2_pos2), and (ND2_pos3, Cytb_pos3). The ML analysis was conducted using the GTRGAMMA model with 1000 bootstrap replicates to determine the robustness of the tree branches. The Bayesian inference was run using 50,000,000 generations sampled at every 2,000 generations. The related Darevskia daghestanica and Lacerta agilis were used as outgroups for both ML and BI tree construction. Gene sequences of other related Eremias species, including E. argus, E. brenchleyi, E. dzungarica, E. vermiculata, E. yarkandensis, and E. przewalskii, were also incorporated into the tree construction process. The genetic p-distances between branches identified in phylogenetic trees were calculated using MEGA 12 [60]. FigTree v1.4.4 (http://tree.bio.ed.ac.uk/software/figtree/, accessed on 13 July 2024) was then used for image visualization of the outputs. In addition, a median-joining network representing the relationships among haplotypes was obtained using the software PopART v1.7.

2.4. Divergence Time Estimation

Approximate divergence times of the E. multiocellata groups were implemented using BEAST 2.6.6 [61]. As no fossil records of E. multiocellata have been found to date, the method for estimating divergence times proposed by Hedges et al. (2015) [62] was first consulted, and the divergence time between E. multiocellata and the outgroup was estimated using the TIMETREE database (http://www.timetree.org/, accessed on 17 February 2025) (Table 3). In addition, the mutation rate of the concatenated sequence, used as the fixed mean substitution rate, was estimated using the following formulas [63]:
d = (tv + tvR)/m,
where d is the number of nucleotide substitutions at each site, tv is the number of inversions of the concatenated sequence, R is the transition/transversion ratio, and m is the length of the sequence;
λ = d/2T,
where λ is the nucleotide substitution rate of each site per generation per year and T is the divergence time of the inner and outer group;
μ = λg,
where μ is the mutation rate per generation of each nucleotide site and g is the generation time.
Using the estimated optimal substitution model in BEAUti v2.4.4, the analysis was run with an uncorrelated relaxed clock as the molecular clock model and a constant population size model as the coalescent tree prior. The MCMC analysis was run for 50,000,000 generations, with sampling every 1000 generations, ensuring that the values of the effective sample size (ESS) were over 1000. TreeAnnotator v2.4.4 [61] was then used to summarize the output tree files with a burn-in of 10%. Tracer v1.7.1 [64] was utilized to check the convergence and ESS values of the tree files.

3. Results

3.1. mtDNA Gene Sequencing Results

A total of 2,310 base pairs (bp) of mitochondrial sequences were obtained (ATP6-483 bp, GenBank accession numbers ON016187–ON016301; ND2-837 bp, GenBank accession numbers ON016399–ON016513; Cytb-990 bp, GenBank accession numbers MZ516442–MZ516459 and ON016302–ON016398). The base composition analysis using MEGA revealed the following proportions: T = 29.3%, C = 30.1%, A = 28.6%, and G = 12.0%. The alignment defined 96 haplotypes with 261 mutation sites and no insertion or deletion sites. The overall haplotype and nucleotide diversities of the concatenated sequence were 0.996 and 0.019, respectively, with the highest haplotype diversity in BC and YT (h = 1.000) and the highest nucleotide diversity in KS (π = 0.017) (Table 1).

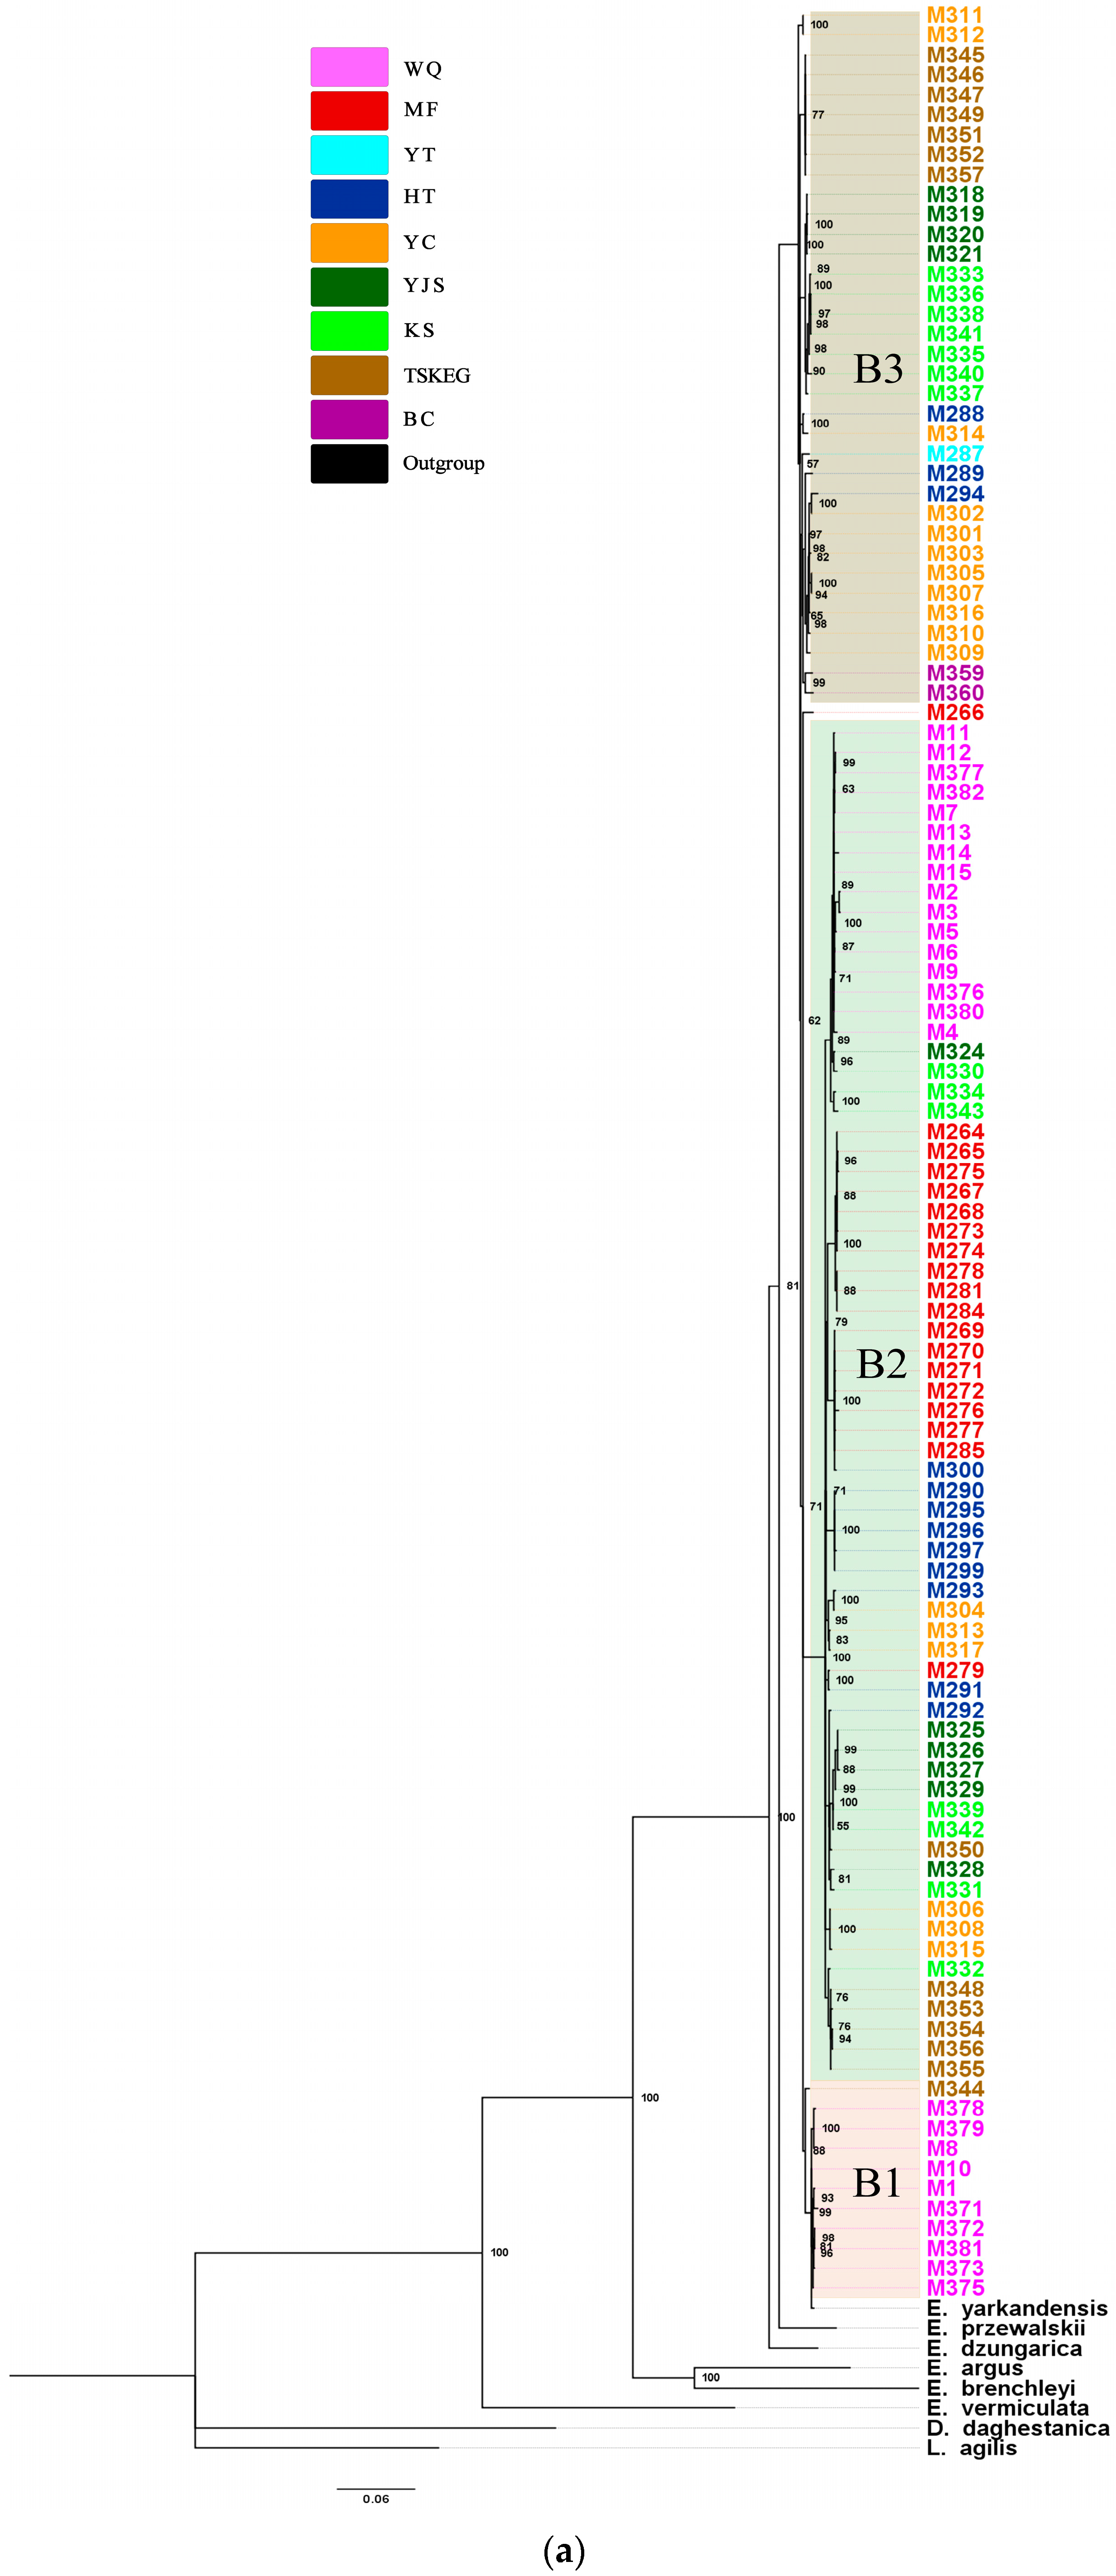
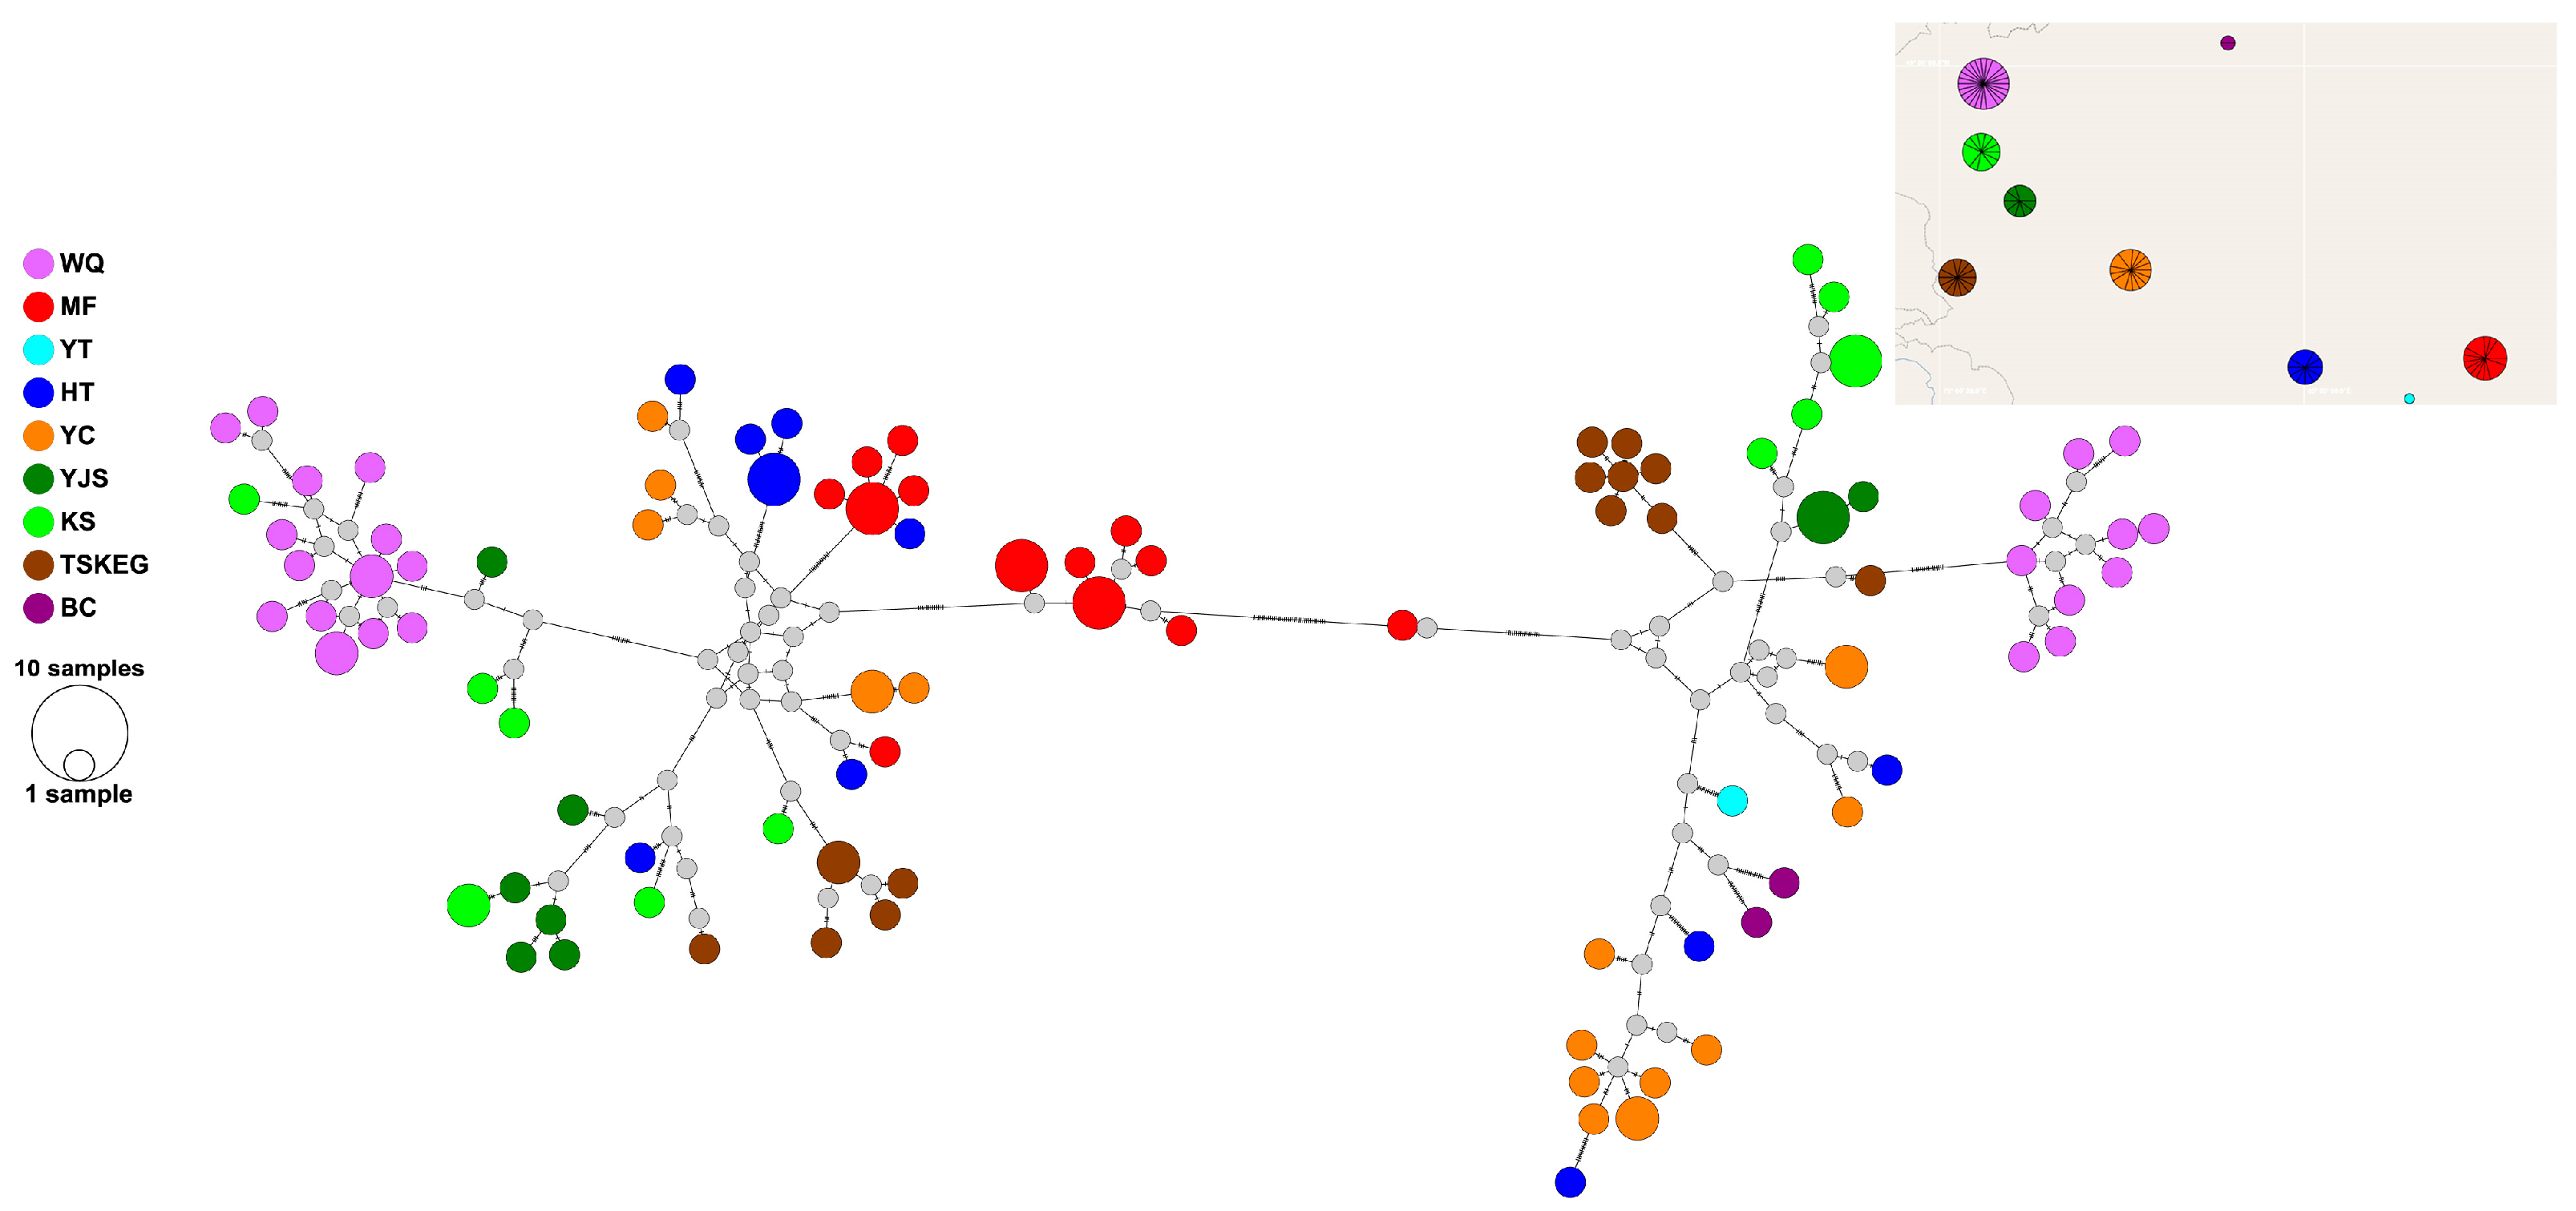
3.2. Phylogenetic Analysis Results

Based on the concatenated mtDNA dataset, the BI tree revealed three major, well-supported clades (posterior probability of 100%), with one single sample (M266) grouped separately, and the posterior probability values of all branches were above 50% (Figure 2a). Among the three clades, one (hereafter referred to as the “B1” clade) consisted of ten samples of WQ and one sample of TSKEG, which formed a reciprocally monophyletic group with the WQ samples. A second clade (“B2” clade) consisted of the remaining 16 samples of WQ; all but one sample from MF; and partial samples from YJS, KS, HT, YC, and TSKEG. The remaining samples from YT, HT, YC, YJS, KS, TSKEG, and BC formed a third group (“B3” clade). RAxML v8.0.0 produced a roughly similar result to the BI tree, with 100% bootstrap support for three major groups (Figure 2b). The second group “M2” was almost identical to the “B2” clade. In the BI tree, the calculated genetic p-distances ranged from 0.0144 to 0.0278, with the minimum value found between lineages “B1” and “B3” and the maximum between “B2” and “B3” (Table 4). In the ML tree, the minimum genetic p-distance was between “M1” and “M3” (0.0130, Table 4), and the maximum was between “M2” and “M3” (0.0280, Table 4).
DnaSP v5.7 identified 96 haplotypes from 115 sequences, and the haplotype network constructed using PopART v1.7 revealed two distinct groups (Figure 3). Among these, the MF haplotypes were predominantly found in one group (the left half of the network diagram), while the YT and BC haplotypes were found in the other group (the right half of the network diagram). The haplotypes from HT, YC, YJS, KS, TSKEG, and WQ were scattered across both groups, with the WQ haplotypes showing the highest degree of differentiation. None of the 96 haplotypes were shared between any two groups.

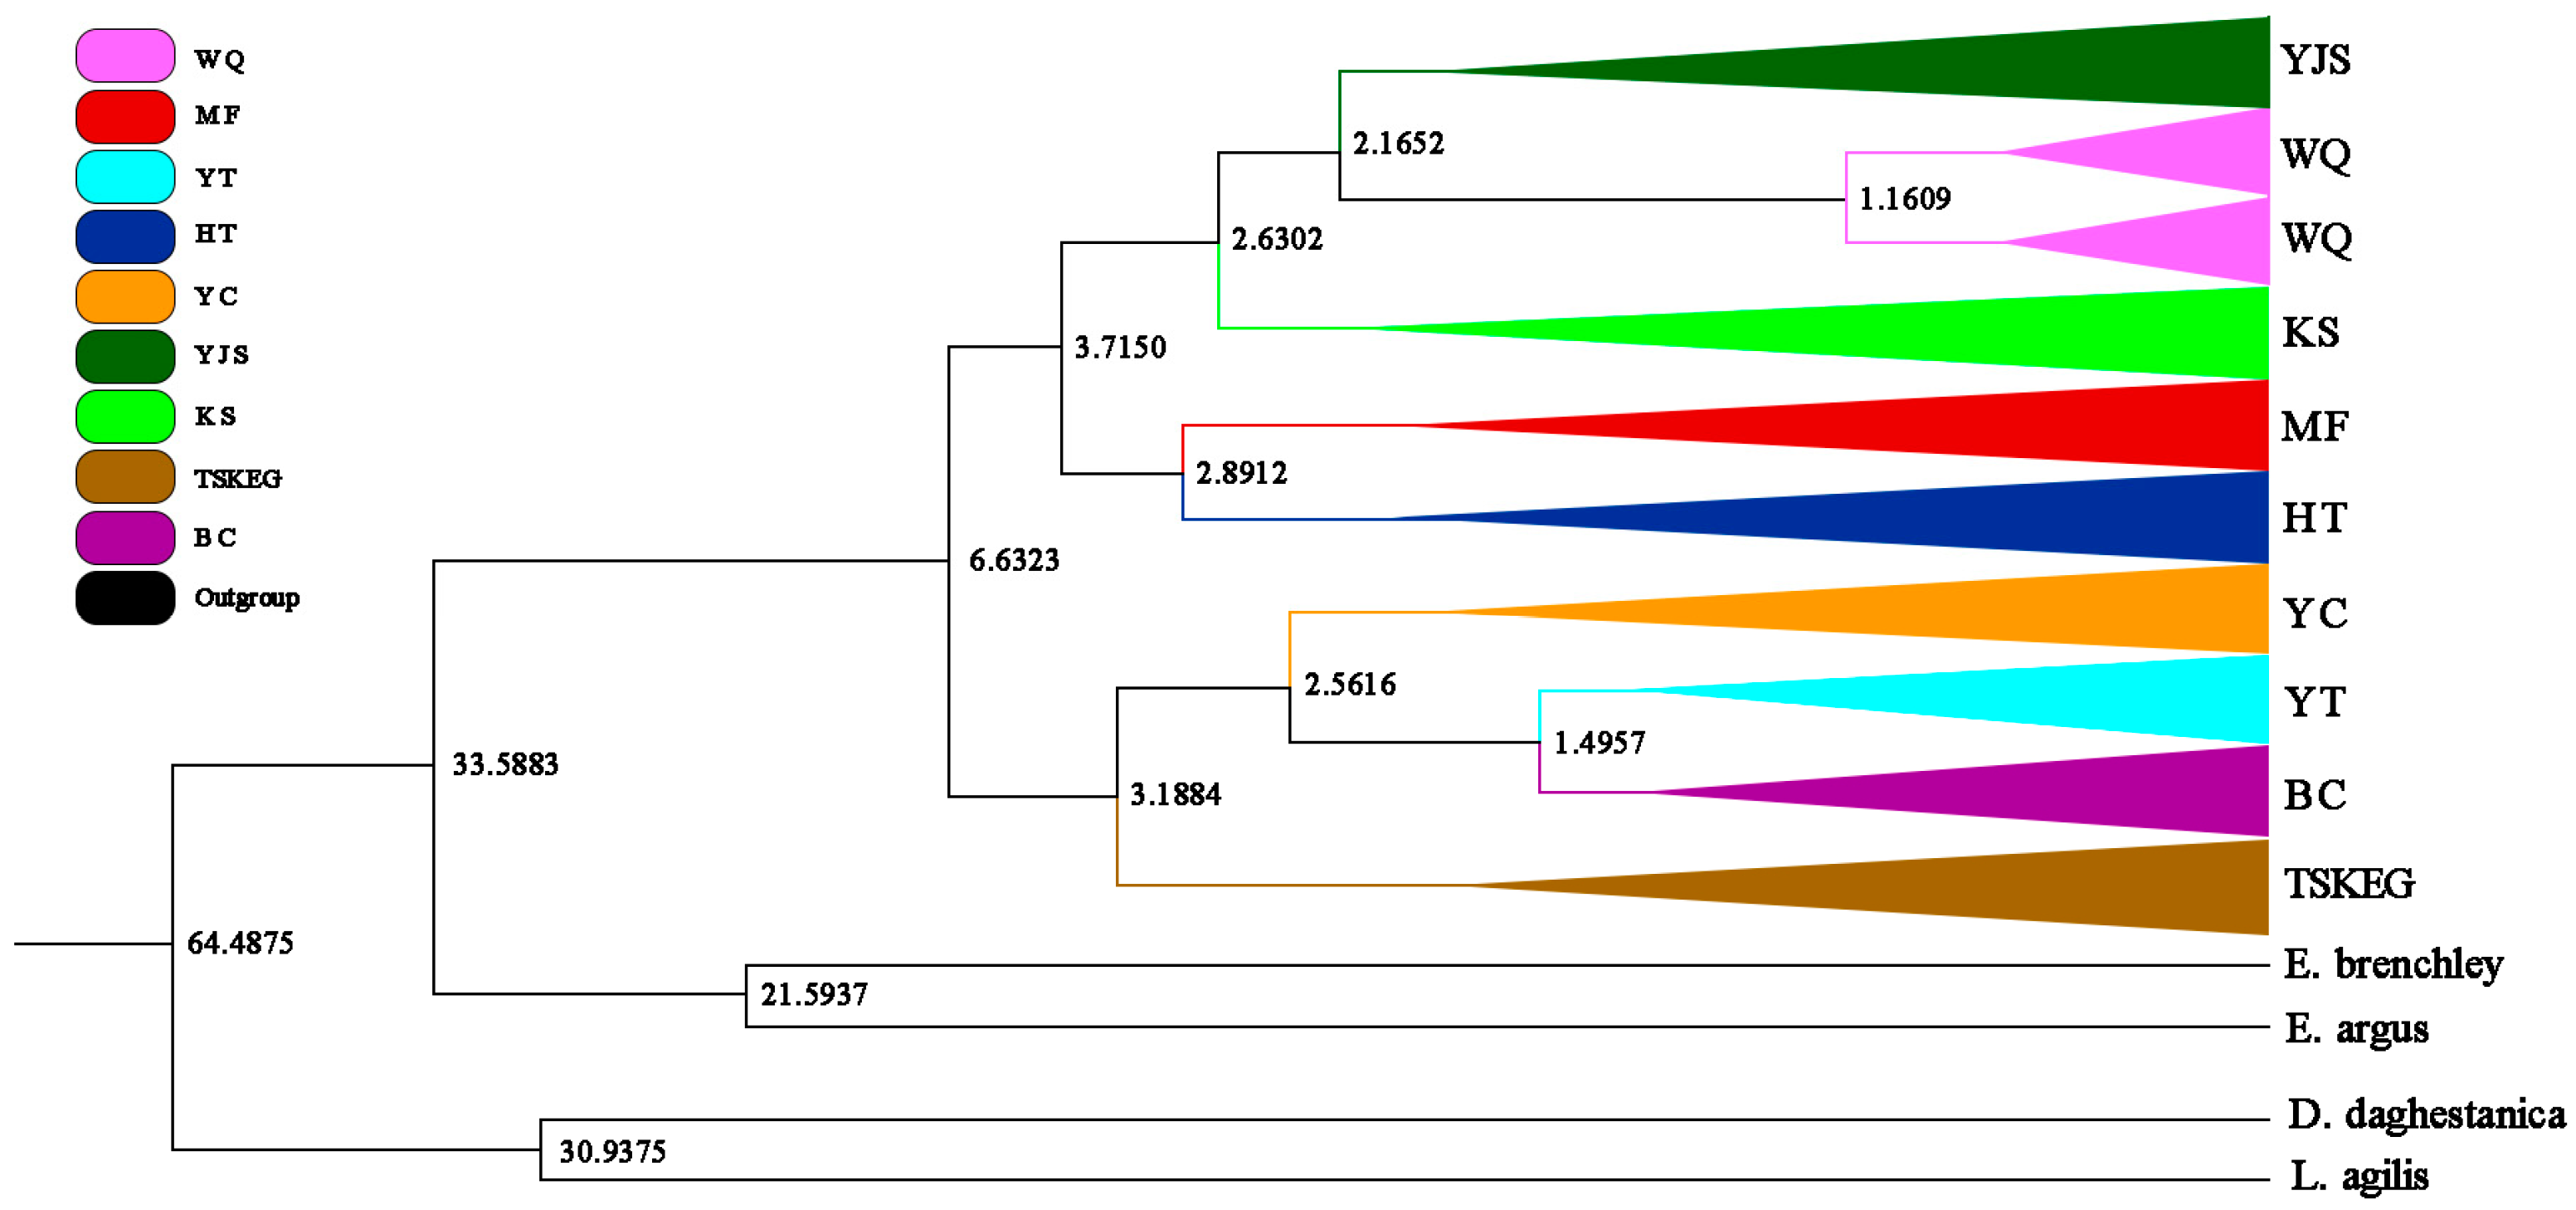
3.3. Divergence Time Estimation Results

Based on the methods of Hedges et al. (2015) for estimating the divergence times of species evolution [62], TIMETREE estimated that the divergence time of E. multiocellata from the outgroups L. agilis and D. daghestanica was approximately 64.49 Ma, and from E. argus and E. Brenchleyi was approximately 33.6 Ma. The nucleotide mutation rate was ultimately determined to be μ = 0.0006. Utilizing this mutation rate to construct a divergence time evolution tree, as depicted in Figure 4, the results indicate that the E. multiocellata population began to differentiate into two clades around 6.63 Ma. One of the clades further diverged around 3.72 Ma, forming five groups (YJS, WQ, KS, MF and HT). The second clade diverged since 3.19 Ma and then differentiated into four major groups (YC, YT, BC and TSKEG) within the same time range as the five groups in the first clade (ranging from 3.72 and 1.50 Ma).

4. Discussion

Based on the concatenated sequences of three mitochondrial genes (ATP6, ND2, and Cytb), the contents of (A + T) and (C + G) are 57.9% and 42.1%, respectively, indicating a pronounced bias towards A and T nucleotides. This bias aligns with the coding patterns observed in the majority of vertebrate mitochondrial genes [65]. The ratio of transition to transversion rates in the spliced sequences of the three genes is 7.9:1, with transitions significantly outnumbering transversions. The result is consistent with Hochachka’s (1993) conclusion that the frequency of transitions in mitochondrial gene evolution is much higher than that of transversions [66].
The haplotype diversity (h) and nucleotide diversity (π) of mitochondrial genes are two important indicators of the degree of variability within a species or population, and are crucial for assessing genetic diversity and differentiation within a population [67,68]. In this study, a total of 96 haplotypes were identified, with an average haplotype diversity of 0.996 and an average nucleotide diversity of 0.019. Due to the limited genetic research and the absence of reports on these indices for this species in the literature, the level of genetic diversity obtained in this study cannot be directly compared. However, the low level of nucleotide diversity we found in the current study was closer to those of the related E. argus (average 0.010) and E. brenchleyi (average 0.007) [69]. Additionally, the high level of haplotype diversity was also found in the P. forsythii (average 0.863) in the same region [70]. These results implied that E. multiocellata in the Tarim Basin may exhibit a genetic pattern characterized by high haplotype diversity and low nucleotide diversity, suggesting that the gene flow was restricted within populations.
The genus Eremias in the family Lacertidae has many taxonomic complexities and disputes [71]. Among them, E. multiocellata Günther, 1872 is the most widely distributed species [72]. In China, it originally comprised two subspecies: E. m. multiocellata and E. m. yarkandensis [72]. An early study based on hybridization experiments suggested that E. m. yarkandensis should be recognized as a distinct biological species [73]. Dai et al. (2006) also supported the status of E. yarkandensis as a separate species based on differences in the numbers of subocular, supralabial, and ventral scale rows [74]. In 2015, E. yarkandensis is formally designated as an independent species in the Corrected Catalogue of Chinese Reptiles [75]. To avoid introducing bias into the experimental results due to the taxonomy complexity of E. multiocellata and to obtain a wider picture of the phylogenetic relationship between E. multiocellata and its closely related relatives, we incorporated mitochondrial gene sequences of several other Eremias species (E. argus, E. brenchleyi, E. dzungarica, E. vermiculata, E. yarkandensis, and E. przewalskii) into the phylogenetic analyses. The results showed that these species formed distinct clades, consistent with previous studies [76]. The collected E. multiocellata also forms a monophyletic group and constitutes a well-supported sister group with its closely related species (E. argus and E. brenchleyi), a result that is in line with the findings of Orlova et al. (2017) [71]. When examining the genetic relationship between E. multiocellata and E. yarkandensis, some E. multiocellata samples exhibited high genetic similarity to E. yarkandensis and clustered into a small branch (the “B1” branch in Figure 2a). This phenomenon is likely caused by multiple factors. From an evolutionary perspective, the two species may share a recent common ancestor, resulting in high genetic similarity. The existence of multiple alleles in their common ancestor could have been randomly retained during speciation [77]. Additionally, the selection of partial mitochondrial gene sequences in this study may have contributed to the observed high similarity between some E. multiocellata samples and E. yarkandensis. E. multiocellata and E. yarkandensis may have experienced gene exchange in the past. In fact, E. multiocellata and E. yarkandensis were demonstrated to be capable of hybridization [73]. The temporal evolutionary tree suggests this gene exchange might have occurred around 1.16 Ma. Furthermore, if their ancestors underwent rapid speciation in a short time, polymorphic alleles in the ancestral population might not have been fully sorted in the descendant species, leading to inconsistencies between gene trees and the species tree, known as incomplete lineage sorting [77]. Although gene flow and hybridization could also explain this, incomplete lineage sorting is more plausible here. To better understand their evolutionary history, comprehensive studies integrating multi-gene data, phylogenetic methods, and multi-species coalescent models are needed, along with analyses of morphology, ecology, and behavior.
By exploring the evolution of different groups within the same species or among closely related species, as well as the connections between contemporary distribution patterns and historical climatic, geological, and ecological events, phylogenetics primarily investigates the principles and historical processes that shape the geographical distribution of gene lineages [78]. Based on the phylogenetic tree, our divergence analysis indicated that E. multiocellata, E. argus, and E. brenchleyi diverged and formed the three distinct species around 33.59 Ma. Two distinctive clades of E. multiocellata began to differentiate at 6.63 Ma, subsequently forming the observed geographical groups. The current phylogeographical structure of E. multiocellata populations may be closely related to their exposure to significant geological events, such as mountain range uplift and glaciation, as well as geographical barriers such as distances, roads, and rivers.
Since the Middle Pleistocene, large geological events (such as the violent uplift of the Qinghai–Tibet Plateau, Tianshan Mountains, and Kunlun Mountains) [1,79,80,81] and severe climate change (such as the cycle of glacial and interglacial cycles in the Quaternary period) have profoundly influenced the evolutionary processes and geographical distribution patterns of species in the Tarim Basin [82]. This study indicated that the E. multiocellata populations diverged from E. argus and E. brenchleyi around 33.59 Ma, a phase within the Miocene period. During this period, the Qinghai–Tibet Plateau and the Kunlun Mountains rapidly uplifted, due to the north–south graben in central and southern Tibet, the rapid activity of the Kunlun Mountains left-lateral fault, volcanic activity, and the backflush fold belt developing towards the basin. This rapid uplift blocked the water vapor from the Indian Ocean. Additionally, the northward movement and rapid uplift of the Pamir Plateau also blocked the water vapor carried by the westerly wind from entering the Tarim Basin. Consequently, the Tarim Basin, lacking water vapor sources, gradually became a drought-prone region [1,83,84]. The rapid uplift of the surrounding mountains and internal aridification of the basin may be pivotal factors in the differentiation of the desert-inhabited E. multiocellata, setting them apart from other Eremias species.
After 5.3 Ma, the Pamir Plateau continued to move northward, leading to the succeeding collision with the Tianshan Mountains and the blocking of water vapor from the Mediterranean Sea. This intensified the aridification in the Tarim Basin. Concurrently, the Qinghai–Tibet Plateau began to rise significantly, altering the direction of atmospheric circulation. The northeast low-altitude westerly wind, entering the Tarim Basin from the Turpan wind outlet, accumulated on the windward slope of the West Kunlun Mountains and gradually formed a desert. The Tarim Basin continued to experience drought consequently, with the desert within the basin gradually expanding and moving to the northeast [70]. The expansion and movement of the desert and the severe climate during this period may have forced the E. multiocellata to disperse towards the desert’s edge. Although the Qinghai–Tibet Plateau was uplifting, its elevation fluctuated between 1,000 and 2,000 m, insufficient to impede its spreading to the west [85]. In this study, it is inferred that E. multiocellata diverged into distinct geographical populations between 6.63 Ma and 1.50 Ma. This result aligns with Wan Lixia’s (2006) report that E. multiocellata began to expand outward around 5–5.5 Ma. During the late Neogene, the strong uplift of the Tibetan Plateau and the northwestern high mountains promoted this divergence [85].
During the Quaternary period, the Tarim Basin experienced cyclical glacial and interglacial periods due to climate change, and its species’ geographical distribution changed accordingly [86]. Our results indicate that the major geographical populations of E. multiocellata diverged around 3.72 Ma–1.50 Ma. This period coincides with the terminal Late Pliocene of the Neogene and the Pleistocene of the Quaternary, when the plate activity around the Tarim Basin was extremely strong and the Tianshan and Kunlun Mountains rose violently, leaving a huge mountain massif and an elevation gap of several kilometers between the mountain and the basin, accompanied with the drastically changed climate in the basin [81,87]. During the Middle Pleistocene, the height of the surrounding mountains continued to increase and the Karakoram Mountains and the West Kunlun Mountains experienced significant glaciation. Later, the low-level airflow and its circulation system strengthened at the north of the Kunlun Mountains during the Late Pleistocene, which played a decisive role in the formation of the contemporary climate and arid environment of the Tarim Basin and the Xinjiang region. These factors contributed to the climatic characteristics of the Tarim Basin, including its high temperatures and low precipitation in summer and cold and dry environment in winter [87]. Influenced by these factors, the expansion and aridification of the Taklamakan Desert have been exacerbated [9]. Owing to the continued uplifting of the surrounding mountains and the effects of the glacial period (1.21–4.43 Ma) [86], E. multiocellata had to seek refuge, which may have prevented it from dispersing during that time, leading to limited gene flow and the resulting genetic differences between geographical groups.

5. Conclusions

Our study revealed that the E. multiocellata populations exhibited a significant phylogeographical structure. Affected by the uplift of the surrounding mountains and the glacial and interglacial periods, E. multiocellata began differentiating at about 6.63 Ma. It gradually differentiated into various groups at about 3.72 Ma–1.50 Ma, exhibiting a high degree of differentiation and significant genetic differences among populations. Building on the preliminary studies of the geographic population system of E. multiocellata in the Tarim Basin, this study elucidated the phylogeographical structure of E. multiocellata in the region, the historical processes of phylogeographical differentiation, and their relationship to the evolution of the geo-historical environment.

Author Contributions

Conceptualization, Y.L. and W.Z. (Wei Zhao); methodology, Y.L., W.Z. (Wei Zhao) and Y.Q.; validation, Y.L.; formal analysis, J.Z., H.Y. and T.C.; investigation, W.C., Y.C., Y.Q. and W.Z. (Wen Zhong); resources, Y.L. and W.Z. (Wei Zhao); writing—original draft preparation, J.Z.; writing—review and editing, J.Z., H.Y., T.C. and Y.L.; data curation, Y.Q. and W.Z. (Wei Zhao); supervision, Y.L. and W.Z. (Wei Zhao); funding acquisition, Y.L. All authors have read and agreed to the published version of the manuscript.

Funding

This research was funded by the National Natural Science Foundation of China (32060311); the Provincial Talent Program of Gansu Provincial Party Committee Organization Department (51202506); the Science and Technology Talent Innovation and Entrepreneurship Project of Lanzhou City Chengguan District Science and Technology Bureau (2023-rc-6); and the Fundamental Research Funds for the Central Universities of Northwest Minzu University (31920240109).

Institutional Review Board Statement

The animal study protocol was approved by the Experimental Animal Ethics Committee of Northwest Minzu University (Approval No. xbmu-sm-2018050). It was approved on 12 November 2018 and the term of validity is from 1 September 2018 to 31 December 2024.

Data Availability Statement

The data presented in this study are available in GenBank (accession numbers ON016187–ON016301, ON016399–ON016513, MZ516442–MZ516459, and ON016302–ON016398).

Acknowledgments

We thank Wan Lixia and Song Jiangping for their significant contributions to the sample collection of this study.

Conflicts of Interest

The authors declare no conflicts of interest.

References

  1. Zhang, Z.; Han, W.; Zhang, H.; Lou, Y.; Liu, X. Late Miocene-Pleistocene aridification of Asian inland revealed by sediments at Boguzihe section from western Tarim Basin, NW China. J. Arid. Land Resour. Environ. 2017, 31, 144–151. [Google Scholar]
  2. Meng, H.-H.; Gao, X.-Y.; Huang, J.-F.; Zhang, M.-L. Plant phylogeography in arid Northwest China: Retrospectives and perspectives. J. Syst. Evol. 2015, 53, 33–46. [Google Scholar] [CrossRef]
  3. Xu, Z.; Zhang, M.-L. Phylogeography of the Arid Shrub Atraphaxis frutescens (Polygonaceae) in Northwestern China: Evidence From cpDNA Sequences. J. Hered. 2015, 106, 184–195. [Google Scholar] [CrossRef]
  4. Guo, Z.T.; Ruddiman, W.F.; Hao, Q.Z.; Wu, H.B.; Qiao, Y.S.; Zhu, R.X.; Peng, S.Z.; Wei, J.J.; Yuan, B.Y.; Liu, T.S. Onset of Asian desertification by 22 Myr ago inferred from loess deposits in China. Nature 2002, 416, 159–163. [Google Scholar] [CrossRef]
  5. Sun, J.; Zhang, L.; Deng, C.; Zhu, R. Evidence for enhanced aridity in the Tarim Basin of China since 5.3 Ma. Quat. Sci. Rev. 2008, 27, 1012–1023. [Google Scholar] [CrossRef]
  6. Sun, J.; Zhang, Z.; Zhang, L. New evidence on the age of the Taklimakan Desert. Geology 2009, 37, 159–162. [Google Scholar] [CrossRef]
  7. Sun, J.M.; Liu, T.S. The age of the Taklimakan Desert. Science 2006, 312, 1621. [Google Scholar] [CrossRef]
  8. An, Z.S.; Kutzbach, J.E.; Prell, W.L.; Porter, S.C. Evolution of Asian monsoons and phased uplift of the Himalayan Tibetan plateau since Late Miocene times. Nature 2001, 411, 62–66. [Google Scholar] [CrossRef]
  9. Lu, H.; Yi, S.; Liu, Z.; Mason, J.A.; Jiang, D.; Cheng, J.; Stevens, T.; Xu, Z.; Zhang, E.; Jin, L.; et al. Variation of East Asian monsoon precipitation during the past 21 k.y. and potential CO2 forcing. Geology 2013, 41, 1023–1026. [Google Scholar] [CrossRef]
  10. Miao, Y.; Herrmann, M.; Wu, F.; Yan, X.; Yang, S. What controlled Mid-Late Miocene long-term aridification in Central Asia?—Global cooling or Tibetan Plateau uplift: A review. Earth-Sci. Rev. 2012, 112, 155–172. [Google Scholar] [CrossRef]
  11. Yang, X.P.; Rost, K.T.; Lehmkuhl, F.; Zhenda, Z.; Dodson, J. The evolution of dry lands in northern China and in the Republic of Mongolia since the Last Glacial Maximum. Quat. Int. 2004, 118, 69–85. [Google Scholar] [CrossRef]
  12. Yang, X.P.; Zhu, Z.D.; Jaekel, D.; Owen, L.A.; Han, J.M. Late Quaternary palaeoenvironment change and landscape evolution along the Keriya River, Xinjiang, China: The relationship between high mountain glaciation and landscape evolution in foreland desert regions. Quat. Int. 2002, 97–98, 155–166. [Google Scholar] [CrossRef]
  13. Feng, Q.; Su, Z.Z.; Jin, H.J. Desert evolution and climatic changes in the Tarim River basin since 12 ka BP. Sci. China Ser. D-Earth Sci. 1999, 42, 101–112. [Google Scholar] [CrossRef]
  14. Zhang, H.; Wu, H.W.; Zheng, Q.H.; Yu, Y.H. A preliminary study of oasis evolution in the Tarim Basin, Xinjiang, China. J. Arid. Environ. 2003, 55, 545–553. [Google Scholar] [CrossRef]
  15. Wang, W.; Lu, A.-M.; Ren, Y.; Endress, M.E.; Chen, Z.-D. Phylogeny and classification of Ranunculales: Evidence from four molecular loci and morphological data. Perspect. Plant Ecol. Evol. Syst. 2009, 11, 81–110. [Google Scholar] [CrossRef]
  16. Cho, Y.H.; Seo, C.W.; Jung, P.E.; Lim, Y.W. Global phylogeographical distribution of Gloeoporus dichrous. PLoS ONE 2023, 18, e0288498. [Google Scholar] [CrossRef]
  17. Li, W.Q.; Li, Y.; Wang, X.W.; Zhao, G.Q.; Zhu, G.R.; Cao, K.; Fang, W.C.; Wu, J.L.; Ma, K.; Chen, C.W.; et al. Genomic analysis provides insights into the westward expansion of domesticated peaches in China. Hortic. Plant J. 2024, 10, 367–375. [Google Scholar] [CrossRef]
  18. Su, Z.; Richardson, B.A.; Zhuo, L.; Jiang, X.; Li, W.; Kang, X. Genetic diversity and structure of an endangered desert shrub and the implications for conservation. AoB PLANTS 2017, 9, plx016. [Google Scholar] [CrossRef]
  19. Su, Z.; Wang, L.; Zhuo, L.; Jiang, X.; Li, W. Genetic diversity patterns in an endangered desert shrub from north-western China: Implications for conservation. Aust. J. Bot. 2019, 67, 571–584. [Google Scholar] [CrossRef]
  20. Zhang, H.-X.; Wang, Q.; Jia, S.-W. Genomic Phylogeography of Gymnocarpos przewalskii (Caryophyllaceae): Insights into Habitat Fragmentation in Arid Northwestern China. Diversity 2020, 12, 335. [Google Scholar] [CrossRef]
  21. Jia, S.-W.; Zhang, M.-L. Introgression of phylogeography lineages of Convolvulus gortschakovii (Convolvulaceae) in the northwest China. Plant Syst. Evol. 2021, 307, 19. [Google Scholar] [CrossRef]
  22. Yisilam, G.; Wang, C.-X.; Xia, M.-Q.; Comes, H.P.; Li, P.; Li, J.; Tian, X.-M. Phylogeography and Population Genetics Analyses Reveal Evolutionary History of the Desert Resource Plant Lycium ruthenicum (Solanaceae). Front. Plant Sci. 2022, 13, 915526. [Google Scholar] [CrossRef] [PubMed]
  23. Wang, C.; Ma, S.; Sun, F.; Wei, B.; Nie, Y. Spatial genetic patterns of the medicinal and edible shrub Lycium ruthenicum (Solanaceae) in arid Xinjiang, China. Tree Genet. Genomes 2021, 17, 22. [Google Scholar] [CrossRef]
  24. Shi, X.; Jiang, X.; Zhang, H.; Qiu, J. Phylogeography and Genetic Structure of Sand Dune Specialist Stilpnolepis centiflora (Asteraceae) in Northwest China Revealed by Molecular Data. Diversity 2022, 14, 104. [Google Scholar] [CrossRef]
  25. Ababaikeri, B.; Zhang, Y.; Dai, H.; Shan, W. Revealing the coexistence of differentiation and communication in an endemic hare, Lepus yarkandensis (Mammalia, Leporidae) using specific-length amplified fragment sequencing. Front. Zool. 2021, 18, 50. [Google Scholar] [CrossRef] [PubMed]
  26. Wu, Y.H.; Xia, L.; Zhang, Q.; Yang, Q.S. Habitat fragmentation affects genetic diversity and differentiation of the Yarkand hare. Conserv. Genet. 2010, 11, 183–194. [Google Scholar] [CrossRef]
  27. Shan, W.J.; Tursun, M.; Zhou, S.Y.; Zhang, Y.C.; Dai, H.Y. Complete mitochondrial genome sequence of Gunther, 1875 (Lagomorpha, Leporidae): Characterization and phylogenetic analysis. Zookeys 2021, 1012, 135–149. [Google Scholar] [CrossRef]
  28. Abduriyim, S. Population Genetics of Gazella Subgotturosa in Xinjiang Based on the Mitochondrial DNA Cytochrome b Gene. Master’s Thesis, Xinjiang University, Ürümqi, China, 2015. (In Chinese). [Google Scholar]
  29. Hu, P.; Shao, Y.; Xu, J.; Wang, T.; Li, Y.; Liu, H.; Rong, M.; Su, W.; Chen, B.; Cui, S.; et al. Genome-wide study on genetic diversity and phylogeny of five species in the genus Cervus. BMC Genom. 2019, 20, 384. [Google Scholar] [CrossRef]
  30. Lorenzini, R.; Garofalo, L. Insights into the evolutionary history of Cervus (Cervidae, tribe Cervini) based on Bayesian analysis of mitochondrial marker sequences, with first indications for a new species. J. Zool. Syst. Evol. Res. 2015, 53, 340–349. [Google Scholar] [CrossRef]
  31. Mahmut, H.; Masuda, R.; Onuma, M.; Takahashi, M.; Nagata, J.; Suzuki, M.; Ohtaishi, N. Molecular phylogeography of the red deer (Cervus elaphus) populations in Xinjiang of China: Comparison with other Asian, European, and North American populations. Zool. Sci. 2002, 19, 485–495. [Google Scholar] [CrossRef]
  32. Araya-Donoso, R.; San Juan, E.; Tamburrino, I.; Lamborot, M.; Veloso, C.; Véliz, D. Integrating genetics, physiology and morphology to study desert adaptation in a lizard species. J. Anim. Ecol. 2022, 91, 1148–1162. [Google Scholar] [CrossRef]
  33. Yuan, X. Species diversity, threat factors and protection countermeasures of amphibians and reptiles in Tarim Populus euphratica National Nature Reserve. For. Xinjiang 2023, 3, 42–44+48. (In Chinese) [Google Scholar]
  34. Jiang, Z.G.; Wang, Y.Z.; Zhang, E.; Zhang, Y.Y.; Li, L.L.; Xie, F.; Cai, B.; Cao, L.; Zheng, G.M.; Dong, L.; et al. Red List of China’s Vertebrates. Biodivers. Sci. 2016, 24, 500–551. [Google Scholar]
  35. He, J.X.; Yan, C.; Holyoak, M.; Wan, X.R.; Ren, G.Y.; Hou, Y.F.; Xie, Y.; Zhang, Z.B. Quantifying the effects of climate and anthropogenic change on regional species loss in China. PLoS ONE 2018, 13, e0199735. [Google Scholar] [CrossRef]
  36. Wang, Y.Z.; Cai, B.; Li, J.T. China’s Red List of Biodiversity·Vertebrates (Vol. 3): Reptilies; Science Press: Beijing, China, 2021; pp. 43–49. [Google Scholar]
  37. Cox, N.; Young, B.E.; Bowles, P.; Fernandez, M.; Marin, J.; Rapacciuolo, G.; Böhm, M.; Brooks, T.M.; Hedges, S.B.; Hilton-Taylor, C.; et al. A global reptile assessment highlights shared conservation needs of tetrapods. Nature 2022, 605, 285–290. [Google Scholar] [CrossRef] [PubMed]
  38. Li, Q.; Shao, W.; Jiang, Y.; Yan, C.; Liao, W. Assessing Reptile Conservation Status under Global Climate Change. Biology 2024, 13, 436. [Google Scholar] [CrossRef] [PubMed]
  39. Ding, Z.H.; Wang, X.F.; Hao, X.; Zhang, Q.; Sun, B.J.; Du, W.G. Climate warming has divergent physiological impacts on sympatric lizards. Sci. Total Environ. 2024, 912, 168992. [Google Scholar] [CrossRef]
  40. Wei, J.; Zeng, Z.; Zhang, X.; Shuai, L.; Teng, L.; Yan, W.; Liu, Z. Effects of habitat desertification on the community composition of lizards. Acta Ecol. Sin. 2019, 39, 1680. [Google Scholar]
  41. Sun, B.; Williams, C.M.; Li, T.; Speakman, J.R.; Jin, Z.; Lu, H.; Luo, L.; Du, W. Higher Metabolic Plasticity in Temperate Compared to Tropical Lizards Suggests Increased Resilience to Climate Change. Ecol. Monogr. 2022, 92, e1512. [Google Scholar] [CrossRef]
  42. Wang, Z.; Chen, S.; Zheng, Y.; Wu, R.; Yang, Y. Digestive tract morphology and argyrophil cell distribution of three sympatric lizard species. Eur. Zool. J. 2024, 91, 649–661. [Google Scholar] [CrossRef]
  43. Chen, D.L.; Li, J.; Guo, X.G. Next-generation sequencing yields a nearly complete mitochondrial genome of The Yarkand toad-headed agama (Phrynocephalus axillaris) from the Turpan Depression. Mitochondrial DNA B 2019, 4, 1198–1199. [Google Scholar] [CrossRef]
  44. Liang, Q.; Shi, L. Species divergence in valleys: The phylogeny of Phrynocephalus forsythii complex and description of a new species. PeerJ 2024, 12, e17175. [Google Scholar] [CrossRef] [PubMed]
  45. Qi, Y.; Ding, L.; Zhao, Y.Y.; Niu, C.K.; Wang, X.N.; Zhao, W. Toad-headed Lizard (Squamata, Agamidae) as a Potential Ring Species Inferred from Population Genetic Differentiation. Asian Herpetol. Res. 2020, 11, 312. [Google Scholar] [CrossRef]
  46. Zhong, Q.M.; Wang, J.L. Seasonal flexibility of kidney structure and factors regulating water and salt in Eremias multiocellata. Comp. Biochem. Physiol. Part A Mol. Integr. Physiol. 2022, 274, 111301. [Google Scholar] [CrossRef]
  47. Zhang, Q.; Xia, L.; He, J.; Wu, Y.; Fu, J.; Yang, Q. Comparison of phylogeographic structure and population history of two Phrynocephalus species in the Tarim Basin and adjacent areas. Mol. Phylogenet. Evol. 2010, 57, 1091–1104. [Google Scholar] [CrossRef]
  48. Duan, J.; Nong, J.; Jiang, L.; Chen, T.; Zhong, W.; Zhao, W.; Qi, Y.; Guo, P.; Li, Y. Population Genetic Structure of a Viviparous Sand Lizard, the Phrynocephalus forsythii in the Tarim Basin, Xinjiang of China. Diversity 2023, 15, 1182. [Google Scholar] [CrossRef]
  49. Orlova, V.F.; Solovyeva, E.N.; Ananjeva, N.B. Taxonomic status of var. Bedriaga 1912 (Sauria, Lacertidae): Molecular evidence from historical DNA. Zootaxa 2023, 5405, 296–300. [Google Scholar] [CrossRef]
  50. Zhong, Q.-M.; Zheng, Y.-H.; Wang, J.-L. Seasonal flexibility of the gut structure and physiology in Eremias multiocellata. J. Comp. Physiol. B 2023, 193, 281–291. [Google Scholar] [CrossRef]
  51. Liu, J.-L.; Dujsebayeva, T.N.; Chirikova, M.A.; Gong, X.; Li, D.-J.; Guo, X.-G. Does the Dzungarian racerunner (Eremias dzungarica, Orlova, Poyarkov, Chirikova, Nazarov, Munkhbaatar, Munkhbayar & Terbish, 2017) occur in China? Species delimitation and identification with DNA barcoding and morphometric analyses. Zool. Res. 2021, 42, 287–293. [Google Scholar] [CrossRef]
  52. Ma, L.J.; Lin, C.; Zhu, L.J.; Mahmut, P.T.G.L.; Pu, H.W. Comparison of the amino acid and extract about different subspecies of Eremias multiocellata from Xinjiang region. J. Xinjiang Med. Univ. 2011, 34, 375–378. (In Chinese) [Google Scholar]
  53. Ma, L.J.; Mahmut, P.T.G.L. Determination and comparison of 14 elements in body and tail of different subspecies of Eremias multiocellata from Xinjiang. Food Sci. 2006, 27, 645–648. (In Chinese) [Google Scholar]
  54. Ma, L.J.; Mahmut, P.T.G.L. Comparison of total phosphatide contents in different subspecies and different parts of Eremias multiocellata from Xinjiang. Food Sci. 2008, 29, 95–97. (In Chinese) [Google Scholar]
  55. Shi, L.; Yang, J.; Hou, M.Z.; Zhao, H.; Dong, B.J.; Xiong, J.L.; Wang, X.J.; Wang, X.H.; Zhang, X.W.; Wang, X.L.; et al. Herpe to logical surveys of Xinjiang Uygur Autonomous Region. Sichuan J. Zool. 2007, 26, 812–818+981–984. (In Chinese) [Google Scholar]
  56. Excoffier, L.; Lischer, H.E. Arlequin suite ver 3.5: A new series of programs to perform population genetics analyses under Linux and Windows. Mol. Ecol. Resour. 2010, 10, 564–567. [Google Scholar] [CrossRef]
  57. Stamatakis, A. RAxML version 8: A tool for phylogenetic analysis and post-analysis of large phylogenies. Bioinformatics 2014, 30, 1312–1313. [Google Scholar] [CrossRef]
  58. Ronquist, F.; Teslenko, M.; van der Mark, P.; Ayres, D.L.; Darling, A.; Hohna, S.; Larget, B.; Liu, L.; Suchard, M.A.; Huelsenbeck, J.P. MrBayes 3.2: Efficient Bayesian phylogenetic inference and model choice across a large model space. Syst. Biol. 2012, 61, 539–542. [Google Scholar] [CrossRef]
  59. Lanfear, R.; Frandsen, P.B.; Wright, A.M.; Senfeld, T.; Calcott, B. PartitionFinder 2: New Methods for Selecting Partitioned Models of Evolution for Molecular and Morphological Phylogenetic Analyses. Mol. Biol. Evol. 2017, 34, 772–773. [Google Scholar] [CrossRef] [PubMed]
  60. Kumar, S.; Stecher, G.; Li, M.; Knyaz, C.; Tamura, K. MEGA X: Molecular Evolutionary Genetics Analysis across Computing Platforms. Mol. Biol. Evol. 2018, 35, 1547–1549. [Google Scholar] [CrossRef]
  61. Bouckaert, R.; Heled, J.; Kuhnert, D.; Vaughan, T.; Wu, C.H.; Xie, D.; Suchard, M.A.; Rambaut, A.; Drummond, A.J. BEAST 2: A software platform for Bayesian evolutionary analysis. PLoS Comput. Biol. 2014, 10, e1003537. [Google Scholar] [CrossRef]
  62. Hedges, S.B.; Marin, J.; Suleski, M.; Paymer, M.; Kumar, S. Tree of life reveals clock-like speciation and diversification. Mol. Biol. Evol. 2015, 32, 835–845. [Google Scholar] [CrossRef]
  63. Rooney, A.P.; Honeycutt, R.L.; Derr, J.N. Historical population size change of bowhead whales inferred from DNA sequence polymorphism data. Evolution 2001, 55, 1678–1685. [Google Scholar] [PubMed]
  64. Rambaut, A.; Drummond, A.J.; Xie, D.; Baele, G.; Suchard, M.A. Posterior Summarization in Bayesian Phylogenetics Using Tracer 1.7. Syst. Biol. 2018, 67, 901–904. [Google Scholar] [CrossRef]
  65. Mayfield, J.E.; McKenna, J.F. A-T rich sequences in vertebrate DNA. A possible explanation of q-banding in metaphase chromosomes. Chromosoma 1978, 67, 157–163. [Google Scholar] [CrossRef]
  66. Hochachka, P.W.; Mommsen, T.P. (Eds.) Biochemistry and Molecular Biology of Fishes; Elsevier Press: Amsterdam, The Netherlands, 1993; pp. 1–38. [Google Scholar]
  67. Zhao, W.-H.; Yi, S.-K.; Su, J.-X.; Zhou, Q.; Shen, J.-Z.; Li, D.-P.; Zhao, X.-Y. Genetic diversity of Triplophysa yarkandensis populations in Tarim River basin in Xinjiang. Acta Hydrobiol. Sin. 2022, 46, 364–374. [Google Scholar]
  68. Xiao, C.; Yang, S.-y.; Cong, P. Genetic polymorphism of mitochondrial control region in Chiloscyllium plagiosum from coastal waters of southern China. Haiyang Xuebao 2008, 30, 115–121. [Google Scholar]
  69. Qun, Z. Origins, Population Genetics and Comparative Phyiogeography of Two Lacertid Lizards (Eremias argus and E. brenchleyi) from China. Master’s Thesis, Nanjing Normal University, Nanjing, China, 2011. [Google Scholar]
  70. Yue, Q. Molecular Phylogeography of the Phrynocephalus forsythia. Master’s Thesis, Lanzhou University, Lanzhou, China, 2019. [Google Scholar]
  71. Orlova, V.F.; Poyarkov, N.A.; Chirikova, M.A.; Nazarov, R.A.; Munkhbaatar, M.; Munkhbayar, K.; Terbish, K. MtDNA differentiation and taxonomy of Central Asian racerunners of Eremias multiocellata-E. przewalskii species complex (Squamata, Lacertidae). Zootaxa 2017, 4282, 1–42. [Google Scholar] [CrossRef]
  72. Zhao, E.M.; Zhao, K.T.; Zhou, K.Y. Fauna Sinica Reptile Vol. 2 Squamata Lacertilia; Science Press: Beijing, China, 1999; pp. 220–243. [Google Scholar]
  73. Eremchenko, V.K.; Panfilov, A.M. Taxonomic situation of multiocellated racerunner of the “multiocellata”-complex of Kyrghyzstan and neighbour China (Sauria: Lacertidae: Eremias). Sci. New Technol. 1999, 4, 112–124, (In Russian with English Abstract). [Google Scholar]
  74. Dai, X.; Chen, B.; Zhang, Z.W.; Wang, Y.Z. The morpholgical reseaerch of eight species of eremias distributed in China (Lacertidae eremias). Zool. Syst. 2006, 31, 697–708. [Google Scholar]
  75. Cai, B.; Wang, Y.; Chen, Y.; Li, J. A revised taxonomy for Chinese reptiles. Biodivers. Sci. 2015, 23, 365–382. [Google Scholar] [CrossRef]
  76. Wang, S.; Liu, J.L.; Chirikova, M.A.; Zhang, B.; Guo, X.G. The complete mitochondrial genome of (Reptilia, Squamata, Lacertidae) from Kyrgyzstan. Mitochondrial DNA B 2022, 7, 443–445. [Google Scholar] [CrossRef]
  77. Feng, S.H.; Bai, M.; Rivas-González, I.; Li, C.; Liu, S.P.; Tong, Y.J.; Yang, H.D.; Chen, G.J.; Xie, D.; Sears, K.E.; et al. Incomplete lineage sorting and phenotypic evolution in marsupials. Cell 2022, 185, 1646–1660.e18. [Google Scholar] [CrossRef] [PubMed]
  78. Xu, X.-R.; Liu, X.-Y.; He, X.-T.; Wang, Y.-Y. Analysis of factors affecting animal phylogeographic patterns in China. Chin. Bull. Life Sci. 2019, 31, 968–974. [Google Scholar]
  79. Yan, S.; Mu, G. The Environmental Evolution of The Tarim Basin in Late Cenozoic Era. Arid. Land Geogr. 1990, 13, 1–9. [Google Scholar]
  80. Zhang, B.; Li, L.; Liu, X.; He, N.; Du, B.; Song, Y.; Chang, H. Link between development of the northeast Pamir Plateau and climate changes in the Tarim Basin. J. Earth Environ. 2016, 7, 346–356. [Google Scholar]
  81. Zhang, Q.; Tao, J.; Huang, C.; Gu, C. Discovery of Late Cenozoic Plant Fossils from the Central Kunlun Mountains. Chin. Sci. Bull. 1990, 1, 51–53. (In Chinese) [Google Scholar]
  82. Ren, J. Intergating Phylogegraphy and Landscape Genetics Reveals Formation Mechanisms of Genetic Variation and Its Spatial Distribution Pattern for Stipa Breviflora. Master’s Thesis, Mongolia University (Inner Mongolia Autonomous Region), Ulan Bator, Mongolia, 2019. [Google Scholar]
  83. Fu, B.; Awata, Y. Displacement and timing of left-lateral faulting in the Kunlun Fault Zone, northern Tibet, inferred from geologic and geomorphic features. J. Asian Earth Sci. 2007, 29, 253–265. [Google Scholar] [CrossRef]
  84. Burtman, V.S. Cenozoic crustal shortening between the Pamir and Tien Shanand a reconstruction of the Pamir–Tien Shan transition zonefor the Cretaceous and Palaeogene. Tectonophysics 2000, 319, 69–92. [Google Scholar] [CrossRef]
  85. Wan, L. Molecular Phylogeography of Chinese Eremias. Master’s Thesis, Lanzhou University, Lanzhou, China, 2006. [Google Scholar]
  86. Yang, S.-J.; Yin, Z.-H.; Ma, X.-M.; Lei, F.-M. Phylogeography of ground tit (Pseudopodoces humilis) based on mtDNA: Evidence of past fragmentation on the Tibetan Plateau. Mol. Phylogenet. Evol. 2006, 41, 257–265. [Google Scholar] [CrossRef]
  87. Wang, S.; Gao, C. The formation and evolution of the arid environment of theinland Tarim Inland Basin Cenozoic ERA. Quat. Sci. 1990, 10, 372–380. [Google Scholar]
Figure 1. Map of the sampling sites for E. multiocellata.
Diversity 17 00313 g001
Figure 2. Bayesian (a) and maximum likelihood (b) phylogenetic trees based on concatenated mtDNA. Posterior probabilities of BI and bootstrap values of ML analyses are indicated on branches, respectively, and the values less than 50% were removed.
Diversity 17 00313 g002aDiversity 17 00313 g002b
Figure 3. Haplotype network constructed based on combined mitochondrial DNA. Median vectors are represented in gray circles. A map view plot placing the haplotypes of the nine populations is shown in the upper-right corner of the figure.
Diversity 17 00313 g003
Figure 4. Divergent temporal evolutionary tree constructed based on mitochondrial DNA from E. multiocellata.
Diversity 17 00313 g004
Table 1. Sampling information and diversity estimates for the mtDNA dataset.
Sampling SitesNCombined mtDNAND2CytbATP6
h ± s.d. (Nh)π ± s.d.h ± s.d. (Nh)π ± s.d.h ± s.d. (Nh)π ± s.d.h ± s.d. (Nh)π ± s.d.
WuqiaWQ260.994 ± 0.013 (24)0.011 ± 0.0060.775 ± 0.078 (10)0.024 ± 0.0120.754 ± 0.072 (7)0.002 ± 0.0010.932 ± 0.028 (14)0.007 ± 0.004
MinfengMF190.947 ± 0.033 (13)0.008 ± 0.0040.731 ± 0.086 (7)0.007 ± 0.0040.819 ± 0.069 (9)0.010 ± 0.0050.731 ± 0.066 (5)0.009 ± 0.005
YutianYT11.000 ± 0.000 (1)0.000 ± 0.0001.000 ± 0.000 (1)0.000 ± 0.0001.000 ± 0.000 (1)0.000 ± 0.0001.000 ± 0.000 (1)0.000 ± 0.000
HetianHT120.955 ± 0.057 (10)0.014 ± 0.0080.894 ± 0.078 (8)0.023 ± 0.0120.894 ± 0.078 (8)0.013 ± 0.0070.530 ± 0.136 (3)0.006 ± 0.004
YechengYC170.978 ± 0.027 (14)0.015 ± 0.0080.956 ± 0.033 (12)0.029 ± 0.0150.956 ± 0.033 (12)0.007 ± 0.0040.853 ± 0.053 (7)0.006 ± 0.003
YinjishaYJS100.933 ± 0.077 (8)0.013 ± 0.0070.800 ± 0.100 (5)0.027 ± 0.0150.533 ± 0.180 (4)0.003 ± 0.0020.533 ± 0.180 (4)0.008 ± 0.005
KashiKS140.956 ± 0.045 (11)0.017 ± 0.0090.868 ± 0.068 (8)0.029 ± 0.0150.824 ± 0.098 (8)0.010 ± 0.0060.890 ± 0.081 (10)0.010 ± 0.006
Tashiku-erganTSKEG140.989 ± 0.031 (13)0.011 ± 0.0060.934 ± 0.051 (10)0.026 ± 0.0140.506 ± 0.158 (5)0.003 ± 0.0020.396 ± 0.159 (4)0.001 ± 0.001
BachuBC21.000 ± 0.500 (2)0.012 ± 0.0121.000 ± 0.500 (2)0.012 ± 0.0121.000 ± 0.500 (2)0.010 ± 0.0111.000 ± 0.500 (2)0.014 ± 0.015
Total1150.996 ± 0.002 (96)0.019 ± 0.0090.974 ± 0.006 (61)0.029 ± 0.0140.965 ± 0.007 (50)0.014 ± 0.0070.961 ± 0.006 (39)0.013 ± 0.007
N = sample size; h = haplotype diversity; Nh = number of haplotypes; π = nucleotide diversity; s.d. = standard deviation.
Table 2. Information on primers for three mitochondrial genes used in the current study.
PrimersPrimer SequenceTm
1F-ATP65′-CCGCTATCTCTAAGCATGAAAGT-3′58 °C
1R-ATP65′-TGTTACCCTGGGAGTTCCAC-3′
48F-ND2A5′-TGTAATCATCACCGCCACCA-3′58 °C
557R-ND2A5′-TGTGCGATTGATGAGTAGGCT-3′
28F-ND2B5′-TCGCCCTCACCTCTACCTTA-3′58 °C
537R-ND2B5′-CGGTTGTGTTGAGGGGTTTT-3′
11F-Cytb5′-ACATACGAAAACAACATCCAATCT-3′58 °C
1127R-Cytb5′-TTATTTTCTAGGGTGGCGGCT-3′
Table 3. Estimated differentiation schedules of E. multiocellata from outgroups using the TIMETREE database.
PairwiseDivergence TimeMedian Time
E. multiocellata and D. daghestanica36.1–79.0 MYA66 MYA
E. multiocellata and L. agilis36.1–79.0 MYA66 MYA
E. multiocellata and E. brenchleyi28.5–47.3 MYA34 MYA
E. multiocellata and E. argus28.5–47.3 MYA34 MYA
Table 4. BI tree and the genetic distances between the three branches of the ML tree.
B1B2B3M1M2M3
B1------
B20.0266 ----
B30.01440.0278----
M1------
M2- -0.0268--
M3---0.01300.0280-
Disclaimer/Publisher’s Note: The statements, opinions and data contained in all publications are solely those of the individual author(s) and contributor(s) and not of MDPI and/or the editor(s). MDPI and/or the editor(s) disclaim responsibility for any injury to people or property resulting from any ideas, methods, instructions or products referred to in the content.

