Article

Response of Bird Communities to Human-Dominated Habitats in Southern Anhui Mountainous Area, China

1
School of Resources and Environmental Engineering, Anhui University, Hefei 230601, China
2
Jiangsu Academy of Forestry, Nanjing 211153, China
3
Jiangsu Yangzhou Urban Forest Ecosystem National Observation and Research Station, Yangzhou 225000, China
*
Author to whom correspondence should be addressed.
These authors contributed equally to this work.
Diversity 2025, 17(4), 261; https://doi.org/10.3390/d17040261
Submission received: 3 March 2025 / Revised: 3 April 2025 / Accepted: 4 April 2025 / Published: 7 April 2025
(This article belongs to the Section Animal Diversity)

Abstract

:
Given that many species are threatened by human activities, understanding wildlife responses to land use changes is crucial for effective biodiversity conservation. Quantifying species diversity from multiple dimensions provides a more comprehensive understanding of community dynamics, such as insights into functional and phylogenetic diversity, which are crucial for capturing the full complexity of bird communities. In this study, we surveyed bird communities in the Southern Anhui Mountainous Area across four seasons, including two human-dominated land use types (farmland and village) and one natural landscape (forest). Variations in the taxonomic, functional, and phylogenetic diversity across land uses and seasons were analyzed, with a focus on community assembly processes. Our results showed that, during spring and summer, human-dominated land use types supported a higher richness in all dimensions (taxonomic, functional, and phylogenetic) compared to natural landscapes (H2,168 > 25, p < 0.001). However, due to the influence of migratory birds, villages exhibited the lowest taxonomic evenness (H2,168 = 8.31, p = 0.016), while natural landscapes had a lower phylogenetic evenness (H2,168 = 31.27, p < 0.001). In autumn and winter, no significant differences in richness or evenness were observed between land uses (H2,42 < 5.72, p > 0.05). Functional traits were not fully phylogenetically conserved, as phylogenetic structures tended to cluster, while functional structures were more random. Larger birds were more likely to inhabit human-dominated land use types, while smaller birds favored natural landscapes (H2,168 = 23.06, p < 0.001). These findings suggest that conservation plans should consider human-dominated land use types with an intermediate disturbance, which play crucial roles in maintaining bird diversity. However, natural landscapes harbor species that are absent from human-dominated environments and therefore also require continued protection.

1. Introduction

Biodiversity plays a pivotal role in ensuring food security, supporting livelihoods, maintaining ecosystem health, fostering economic development, and reducing the risk of future pandemics [1]. Over the past few decades, population growth and economic development have fueled continuous urban expansion, a trend that is expected to further intensify in the future as the urban population continues to rise [2,3]. This rapid urbanization significantly alters natural landscapes, transforming them into human-dominated environments, such as agricultural and residential areas. While excessive modifications of land use may lead to species declines and extinctions, intermediate levels of disturbance can, in some cases, reduce competitive exclusion, prevent dominance by a few species, and promote species coexistence [4,5].
The Intermediate Disturbance Hypothesis (IDH) posits that moderate disturbance levels enhance biodiversity by balancing competitive exclusion and habitat heterogeneity [6,7]. At low disturbance levels, competitive dominance by a few species can suppress others, resulting in reduced species diversity. Conversely, a high disturbance intensity may lead to habitat destruction and local species extinctions, limiting community stability and species richness [8,9]. Intermediate disturbance levels, however, generate a mosaic of habitat patches in different successional stages, promoting species coexistence by reducing competition and increasing niche availability [10]. This pattern supports a higher diversity of species with varying ecological strategies, thereby enhancing the overall community structure. Understanding how disturbances shape biodiversity is essential for conservation planning, as appropriate disturbance regimes can help maintain ecosystem resilience and function.
To better understand and address the biodiversity challenges posed by human disturbances, researchers have focused on various dimensions, including taxonomic, functional, and phylogenetic diversity, to quantify community diversity [11]. Despite this, most previous studies have primarily focused on taxonomic metrics, which alone fail to fully capture the complexity of ecological communities [12]. In contrast, functional traits and phylogenetic lineages provide valuable insights into the ecological roles and evolutionary histories of species, providing a more comprehensive understanding of community characteristics [13]. Additionally, combining the functional and phylogenetic dimensions of the community structure helps scientists understand processes shaping ecological communities, such as environmental filtering and limiting similarity hypotheses [14,15]. Integrating taxonomic diversity, functional traits, and phylogenetic lineages can provide a more nuanced analysis of community responses to environmental changes. This multidimensional approach strengthens the foundation for developing more effective conservation strategies that support the sustained protection of biodiversity and ecosystem functions [16].
Birds, with approximately 11,000 species worldwide, are an important component of vertebrate biodiversity, forming an unparalleled global dataset. Their diverse feeding behaviors, foraging strategies, and complex phylogenetic relationships make them ideal subjects for analyzing functional and phylogenetic diversity, offering valuable insights on community changes in the context of land use changes [17]. Due to their short life cycles and wide distribution, birds can quickly respond to environmental changes, making them valuable bioindicators in ecological studies [18]. They also contribute to essential ecological functions, including seed dispersal, pollination, pest control, and nutrient cycling, making them invaluable for ecosystem functioning and biodiversity conservation [19,20]. A decline in the bird community diversity, particularly among species with key ecological functions, can significantly impair the ecosystem services they provide [19,21]. For example, in agricultural habitats with reduced populations of insectivorous birds, pest control services are compromised, often resulting in increased crop predation and significant yield losses [20]. Similarly, the loss of bird diversity, especially among seed dispersers, can diminish the seed dispersal efficiency, threatening the survival of plant species that depend exclusively on birds for seed dispersal [19]. Overall, understanding how bird communities respond to environmental changes is crucial for evaluating ecosystem health and guiding effective bird conservation plans.
Mountain ecosystems play an essential role in global terrestrial systems and serve as critical hubs for biodiversity conservation [22]. Focusing conservation efforts on high-priority species and regions is an effective strategy to mitigate the impacts on biodiversity, especially with limited funding and resources [3]. The Southern Anhui Mountainous Area, recognized for its rich diversity of flora and fauna, is a key biodiversity hotspot in China [12]. Its diverse altitudinal gradients and vegetation types provide numerous ecological niches that support a wide range of vertebrate and invertebrate species, with birds being one of the most abundant taxa. However, in recent years, the intensification of human activities has accelerated the transformation of natural forests into human-modified land uses. In these human-dominated environments, the bird community diversity may change across multiple dimensions due to land-cover modifications [23]. Given the increasingly significant impact of human activities on mountain landscapes, the lack of research on multidimensional diversity limits a comprehensive understanding of bird conservation.
This study investigates how the taxonomic, functional, and phylogenetic diversity of bird communities respond to different land use types in the Southern Anhui Mountainous Area. We further explore community assembly processes by examining the body mass distribution and phylogenetic signals of functional traits, providing insights into the ecological mechanisms shaping bird communities. We predicted that (1) intermediate-disturbed land uses, i.e., farmlands and villages, would support higher community diversity [24]; (2) the assembly mechanisms of bird communities may differ across different land uses due to potentially distinct ecological processes of community assembly [25]; and (3) larger birds, which require more food, may be more prevalent in land uses with abundant food sources, such as human-dominated land uses [26]. Through these analyses, our study elucidated how the multidimensional diversity and assembly processes of bird communities in the Southern Anhui Mountainous Area respond to varying degrees of human disturbance, providing valuable ecological insights to inform and strengthen conservation and management strategies in this region.

2. Materials and Methods
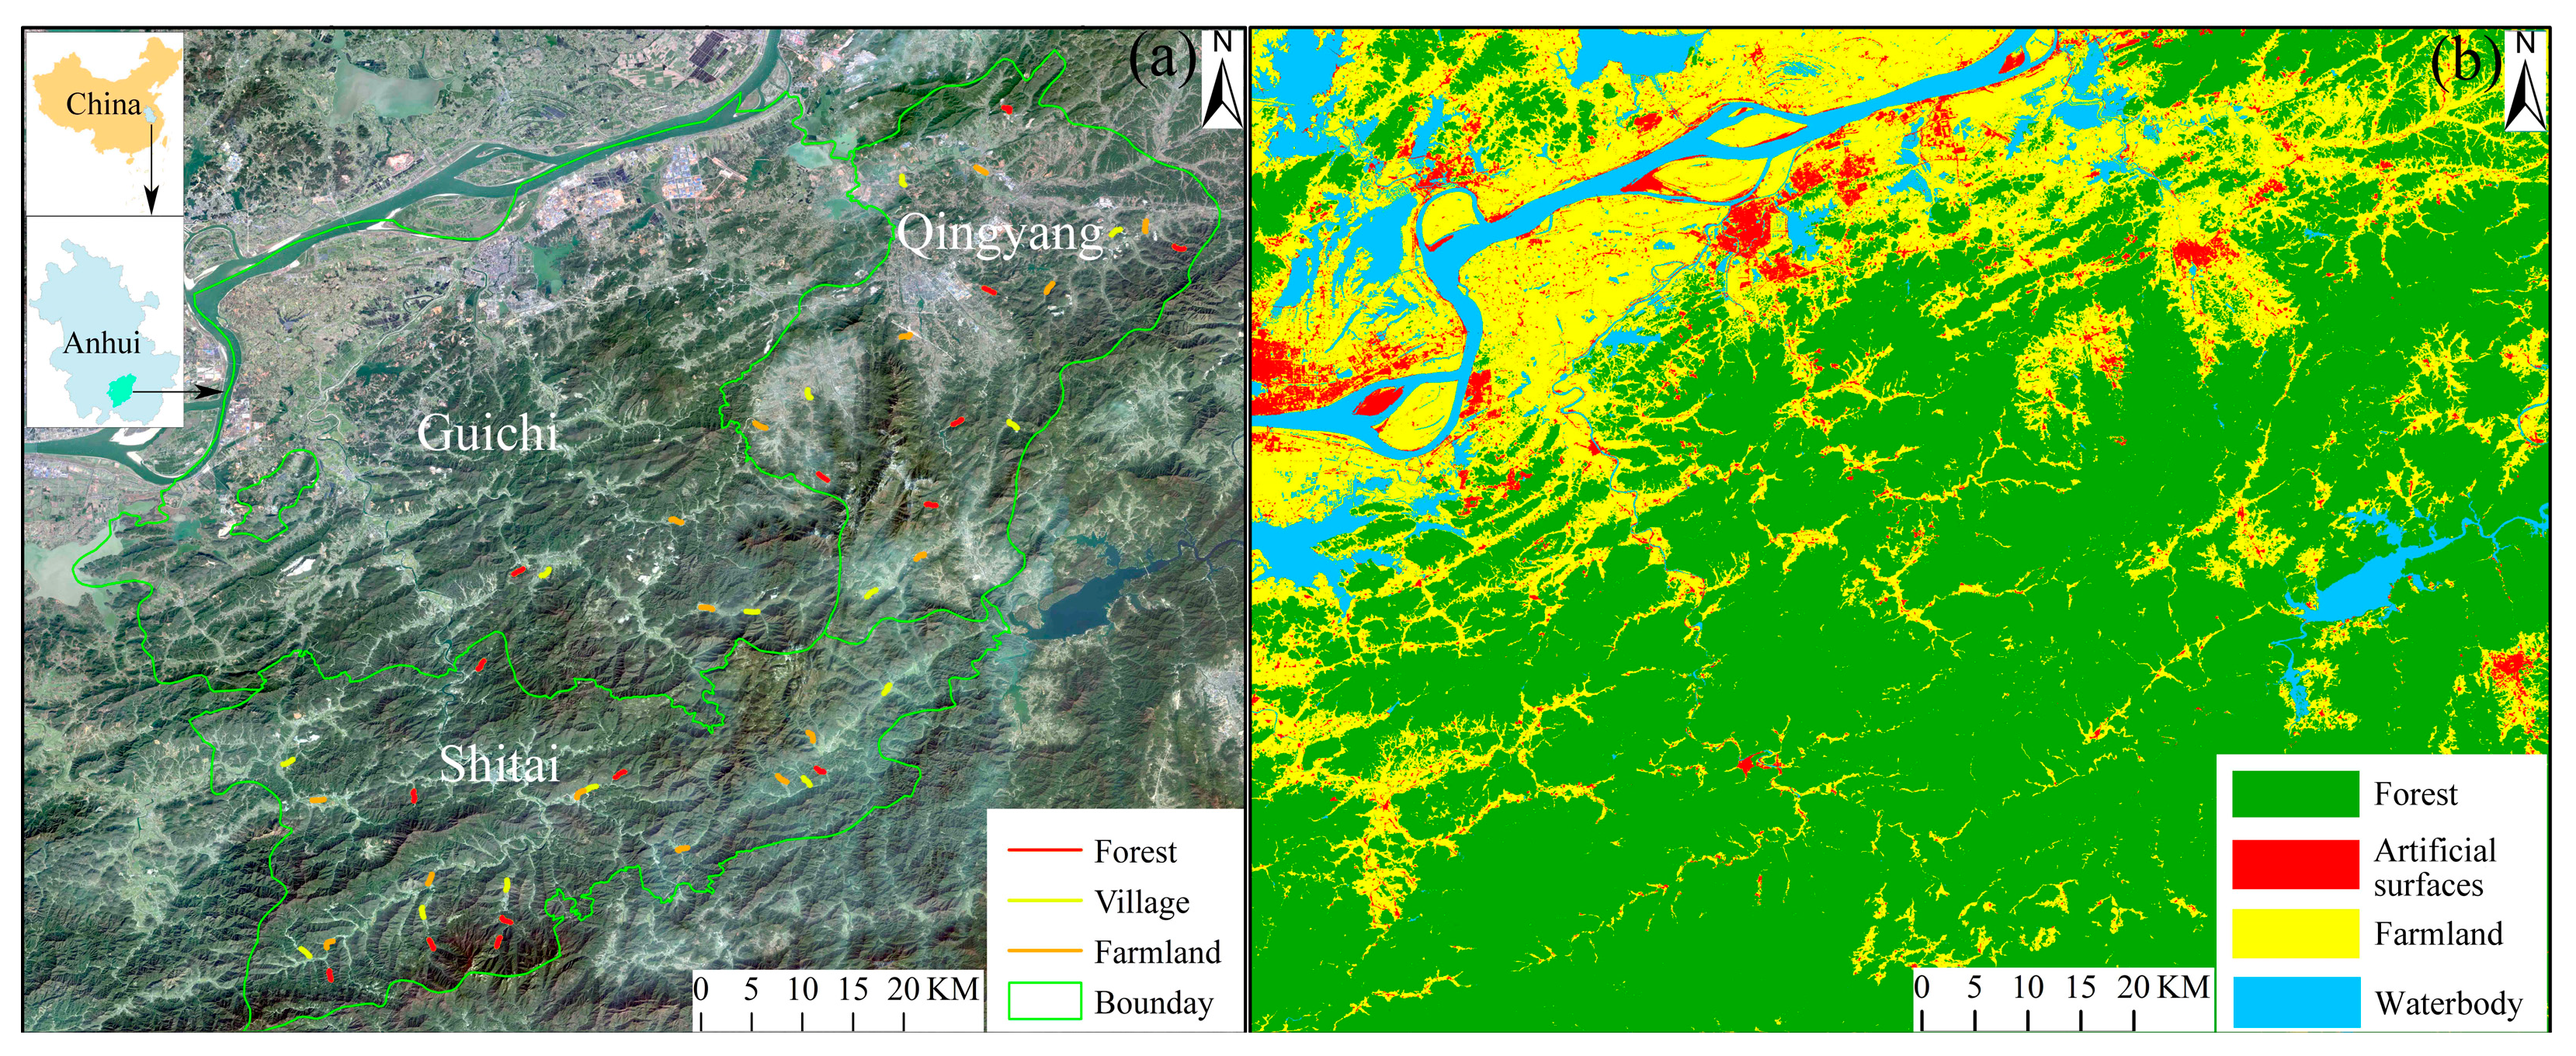
2.1. Study Area

This study was conducted in Shitai County, Qingyang County and parts of Guichi District (29°59′ N–30°50′ N, 117°06′ E–118°07′ E) in Chizhou City, Anhui Province, all of which are located within the Southern Anhui Mountainous Area. The region has a subtropical monsoon climate, with an average annual temperature of 15.5–16.0 °C, a minimum temperature of 2 °C, and a maximum temperature of 33 °C [27]. The annual precipitation ranges from 1400 to 2200 mm, and the vegetation type is classified as subtropical evergreen broad-leaved forest [27]. Characterized by diverse and complex topography, the landscape consists of approximately 55% mountains and 35% hills. Forests and cultivated lands (croplands and plantations) are the dominant land use types, covering 52.84% and 30.27% of the total area, respectively. Other land use categories include grasslands, water bodies, and built-up areas [28]. This area is a critical part of southern China’s hilly and mountainous terrain, renowned for its rich biodiversity and recognized as one of the most biologically diverse regions in Anhui Province [12].
In recent decades, continuous population growth and rapid economic development have driven the transformation of the Southern Anhui Mountainous Area converting natural landscapes into artificial and semi-artificial ones. The proportion of human-dominated areas, such as farmlands and villages, has steadily increased, and they are scattered in the natural forest landscape (Table S1). In villages, vegetation is primarily composed of shrub and grass thickets, bamboo forests, and vegetable garden crops. The farmlands are scattered within the mountainous forest landscape, surrounded by shrub thickets or woodlands, and mainly cultivate crops such as rice, rapeseed, and tea plants. The farming practices remain traditional, without large-scale or mechanized monoculture farming. The dominant tree species in forests include Quercus glauca and Liquidambar formosana, with high vegetation canopy closure [27]. Due to the relatively small patches, farmlands and villages experienced intermediate disturbance levels, primarily from agricultural and residential activities, respectively, while forests, with dense vegetation, had minimal human interference [12].

2.2. Bird Surveys

We randomly selected 45 line transects (1 km each) across three land use types (village, farmland, and forest), with 15 transects distributed per land use (Figure 1) [29]. Bird surveys were conducted seasonally across all transects in summer (June–August 2019), autumn (September–November 2019), winter (December 2020–February 2021), and spring (March–May 2021). Surveys were conducted on clear, calm days, from sunrise to four hours later and three hours before sunset, with two experienced observers walking at a steady pace (1–2 km/h). Using binoculars (10 × 42 WB Swarovski), birds were identified by visual observation and vocalization, with all individuals within a 50 m radius recorded [30]. Each transect was surveyed once per season by different teams to ensure even coverage. Bird taxonomy followed MacKinnon [31], and a bird community was defined as all birds observed along each transect in each season.

2.3. Function Traits and Phylogenies Data

For functional diversity analysis, we considered one continuous trait and two categorical traits (Table 1). Body mass, a key trait linked to resource use and extinction risk [32], was analyzed using the community-weighted mean (CWM.Mass) across land uses and seasons. The two categorical traits, i.e., diet (six categories) and foraging stratum (six categories), were treated as binary variables (0/1). Phylogenetic signals for functional traits were calculated using Blomberg’s K [33] to assess their phylogenetic conservatism (Table 1). Body mass data were sourced from Wang [34], while diet and foraging stratum data were obtained from Wilman [35].
To construct the functional dendrogram, we began by calculating the functional dissimilarity among all species pairs using the Gower metric, which is particularly suited for analyses involving both categorical and continuous traits [36]. Subsequently, we constructed a dendrogram using the Unweighted Pair Group Method with Arithmetic Mean (UPGMA) [37].
For phylogenetic diversity, we built a phylogenetic tree incorporating all bird species in our study area through tree pruning. We sampled 1000 trees from the Global Ornithological Phylogeny System (http://birdtree.org, accessed on 15 January 2025) based on the “Erison All Species: a set of 10,000 trees with 9993 OTUs each” option [38]. These trees were used to generate a maximum clade credibility tree [39], built using mean node heights in Tree Annotator (version 2.6.3) within the BEAST2 software (version 2.7.7) [40]. This tree was used for the following phylogenetic analyses.

2.4. Diversity Metrics

For each transect in different seasons, we calculated species richness (SR, Equation (1)) and Pielou’s evenness (TE, taxonomic evenness, Equation (2)) to assess taxonomic diversity. The formulas are as follows:
S R = S
T E = i = 1 S P i l n P i l n S
where S is the total number of species observed, and Pi is the proportion of individuals of the ith species relative to the total number of individuals in the transect.
Functional richness (FRic) and functional evenness (FEve) were used as indices of functional diversity [41]. FRic quantifies the functional diversity within the ecological space by measuring the extent of the space occupied by the community; a higher FRic indicates greater functional diversity. FEve measures how evenly the functional traits are distributed within the community’s ecological space; a higher FEve suggests more efficient resource utilization [42].
To assess phylogenetic diversity, we used phylogenetic species richness (PSR) and phylogenetic species evenness (PSE). PSR quantifies the species richness weighted by their phylogenetic relatedness, with higher values indicating greater diversity. PSE ranges from 0 to 1 and reflects the evenness of phylogenetic distribution; values closer to 1 indicate a more even distribution, while values closer to 0 show an uneven distribution among closely related species [43,44].

2.5. Assembly Process and Null Models

To assess species clustering or overdispersion along the functional and phylogenetic dimensions, we calculated the observed values of mean pairwise distance (MPD) and mean nearest taxon distance (MNTD). MPD measures the average functional or phylogenetic distance between species, indicating overall divergence, while MNTD focuses on the average distance between the nearest neighbors, reflecting terminal clustering in the community [45].
The observed MPD and MNTD values were compared with means from null models generated by shuffling the terminal labels of the trees [37]. This involved creating 999 simulated communities with the same species richness and abundance as the observed ones using an independent swap algorithm. The species pool for the simulation was defined as all species recorded during the study period. The standardized effect sizes (SES, Equation (3)) for both MPD and MNTD were calculated as:
S E S = ( M o b s M n u l l ) S D n u l l
where Mobs is the observed value of MPD or MNTD, Mnull is the mean value of 999 randomly generated null model simulated values of MPD or MNTD, and SDnull is the standard deviation of the simulated values. The standardized MPD and MNTD values, multiplied by −1, correspond to the nearest relative index (NRI) and nearest taxon index (NTI), respectively. These indices measure overall and terminal clustering along the functional or phylogenetic tree. Values greater than 0 indicate functional or phylogenetic clustering, while values less than 0 indicate overdispersion [46].

2.6. Data Analyses

The Shapiro–Wilk and Levene’s tests indicated that the diversity indices did not meet normality (p < 0.05) or homogeneity of variance assumptions (p < 0.05), so non-parametric methods were performed. The Scheirer–Ray–Hare test was used for indices, followed by Dunn’s test with Bonferroni correction. NRI and NTI deviations from 0 were tested with a one-sample t-test, and the Wilcoxon signed-rank test was applied for non-normal data. Taxonomic diversity indices were measured using R package vegan (version 2.6-10), while functional diversity indices, including the CWM index, were calculated using package FD (version 1.0-12.3) [47]. Phylogenetic diversity indices, including metrics such as NRI and NTI for evaluating community assembly processes, were analyzed in package picante (version 1.8.2) [48]. All analyses were performed in R version 4.3.3 [49], with statistical significance set at p < 0.05.

3. Results

3.1. Birds Communities

A total of 169 species and 15,715 individual birds were recorded, including 31 threatened species with 587 individuals. The three species with the highest abundance recorded were the Red-rumped Swallow (Cecropis daurica), Light-vented Bulbul (Pycnonotus sinensis), and Eurasian Tree Sparrow (Passer montanus), each with more than 1000 individuals. Additionally, the Critically Endangered species the Yellow-breasted Bunting (Emberiza aureola), listed on the IUCN Red List, was also recorded (Table S2). The highest bird abundance was recorded in the villages, while the highest species richness was observed in the farmlands. In contrast, the forests supported the lowest values for both bird abundance and species richness (abundance: H2,168 = 24.89, p < 0.001; species richness: H2,168 = 25.01, p < 0.001). Farmlands supported the highest species richness of unique and threatened species, as well as the abundance of unique bird species, while the highest abundance of threatened species was recorded in the forests. The villages maintained the lowest number and abundance of unique and threatened bird species (Table 2).

3.2. Phylogenetic Signal of Bird Functional Traits

Blomberg’s K tests revealed that eight functional traits exhibited significant phylogenetic signals (p < 0.05). The remaining five functional traits showed no significant phylogenetic signal in the tests (p > 0.05). The foraging stratum (“Water”) and body mass exhibited stronger phylogenetic signals (Table 1).

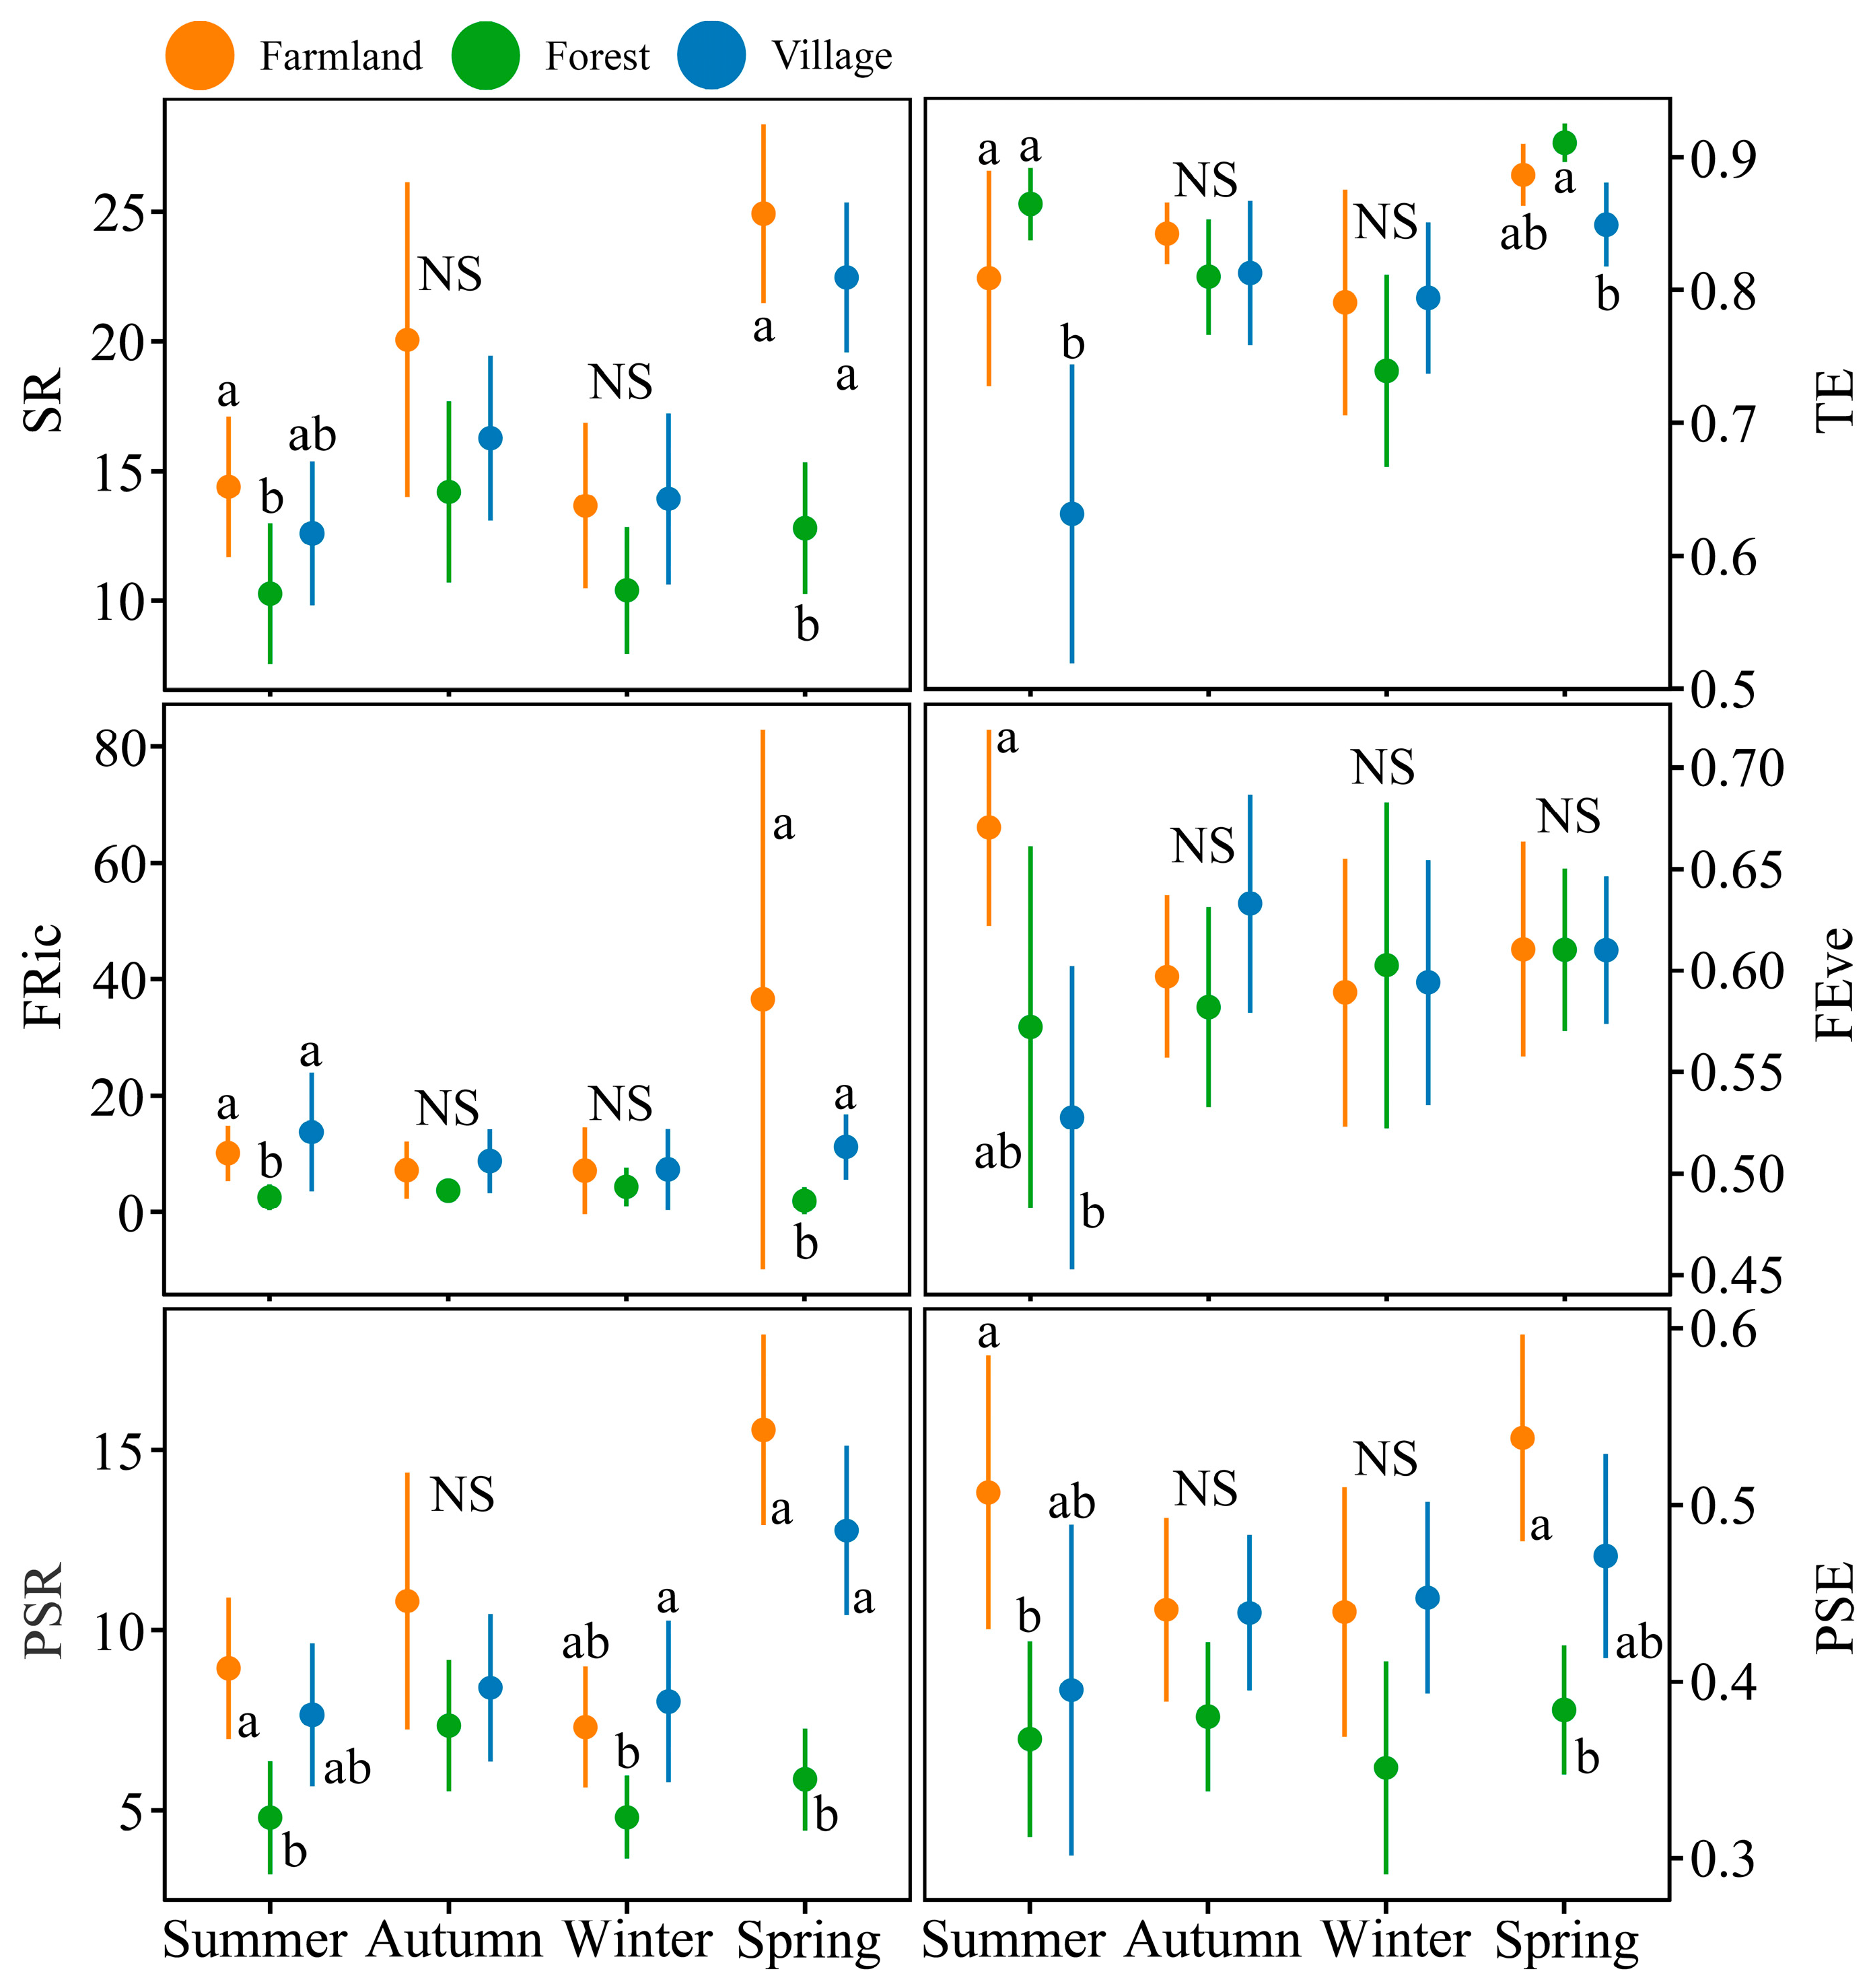
3.3. Multidimensional Diversity Analysis of Bird Communities

For the richness indices of bird communities, human-dominated land uses exhibited higher values than natural landscapes across all three dimensions (taxonomic: H2,168 = 25.01, p < 0.001; functional: H2,168 = 32.15, p < 0.001; phylogenetic: H2,168 = 38.07, p < 0.001). The richness in the taxonomic and phylogenetic dimensions was higher in spring than in summer and winter (taxonomic: H3,168 = 33.00, p < 0.001; functional: H3,168 = 2.66, p = 0.447; phylogenetic: H3,168 = 22.15, p < 0.001). Regarding the evenness indices, TE was influenced by both land use type and season, as well as their interaction effects (land use types: H2,168 = 8.31, p = 0.016; seasons: H3,168 = 30.82, p < 0.001; interaction effects: H6,168 = 16.33, p = 0.012). In contrast, the FEve showed no significant response to the land use type, season, or their interaction (land use types: H2,168 = 1.65, p = 0.438; seasons: H3,168 = 0.47, p < 0.926; interaction effects: H6,168 = 10.59, p = 0.102). TE was lower in villages compared to the other two land uses and was higher in spring than in other seasons. Unlike TE, the PSE was lower in forests than in the other two habitats (H2,168 = 31.27, p < 0.001; Figure 2).
Overall, significant differences in the multidimensional diversity indices of bird communities across different land uses were more frequently observed in spring and summer, while such differences were less common in autumn and winter (Figure 2). For richness, the human-dominated land use types exhibited higher values than natural landscapes across all dimensions in spring and summer, including the PSR in autumn. Regarding evenness, variations were observed across different dimensions. In spring and summer, the TE of bird communities in forests was significantly higher than in villages, with no significant differences between forests and farmlands (spring: H2,42 = 10.82, p = 0.004; summer: H2,42 = 14.03, p < 0.001). The PSE indicated that bird communities in farmlands had higher values than those in forests, with no significant differences between villages and the other two land uses (spring: H2,42 = 15.69, p < 0.001; summer: H2,42 = 14.03, p = 0.022). In summer, the FEve showed significantly higher values for farmlands compared to villages (H2,42 = 8.71, p = 0.013; Figure 2).

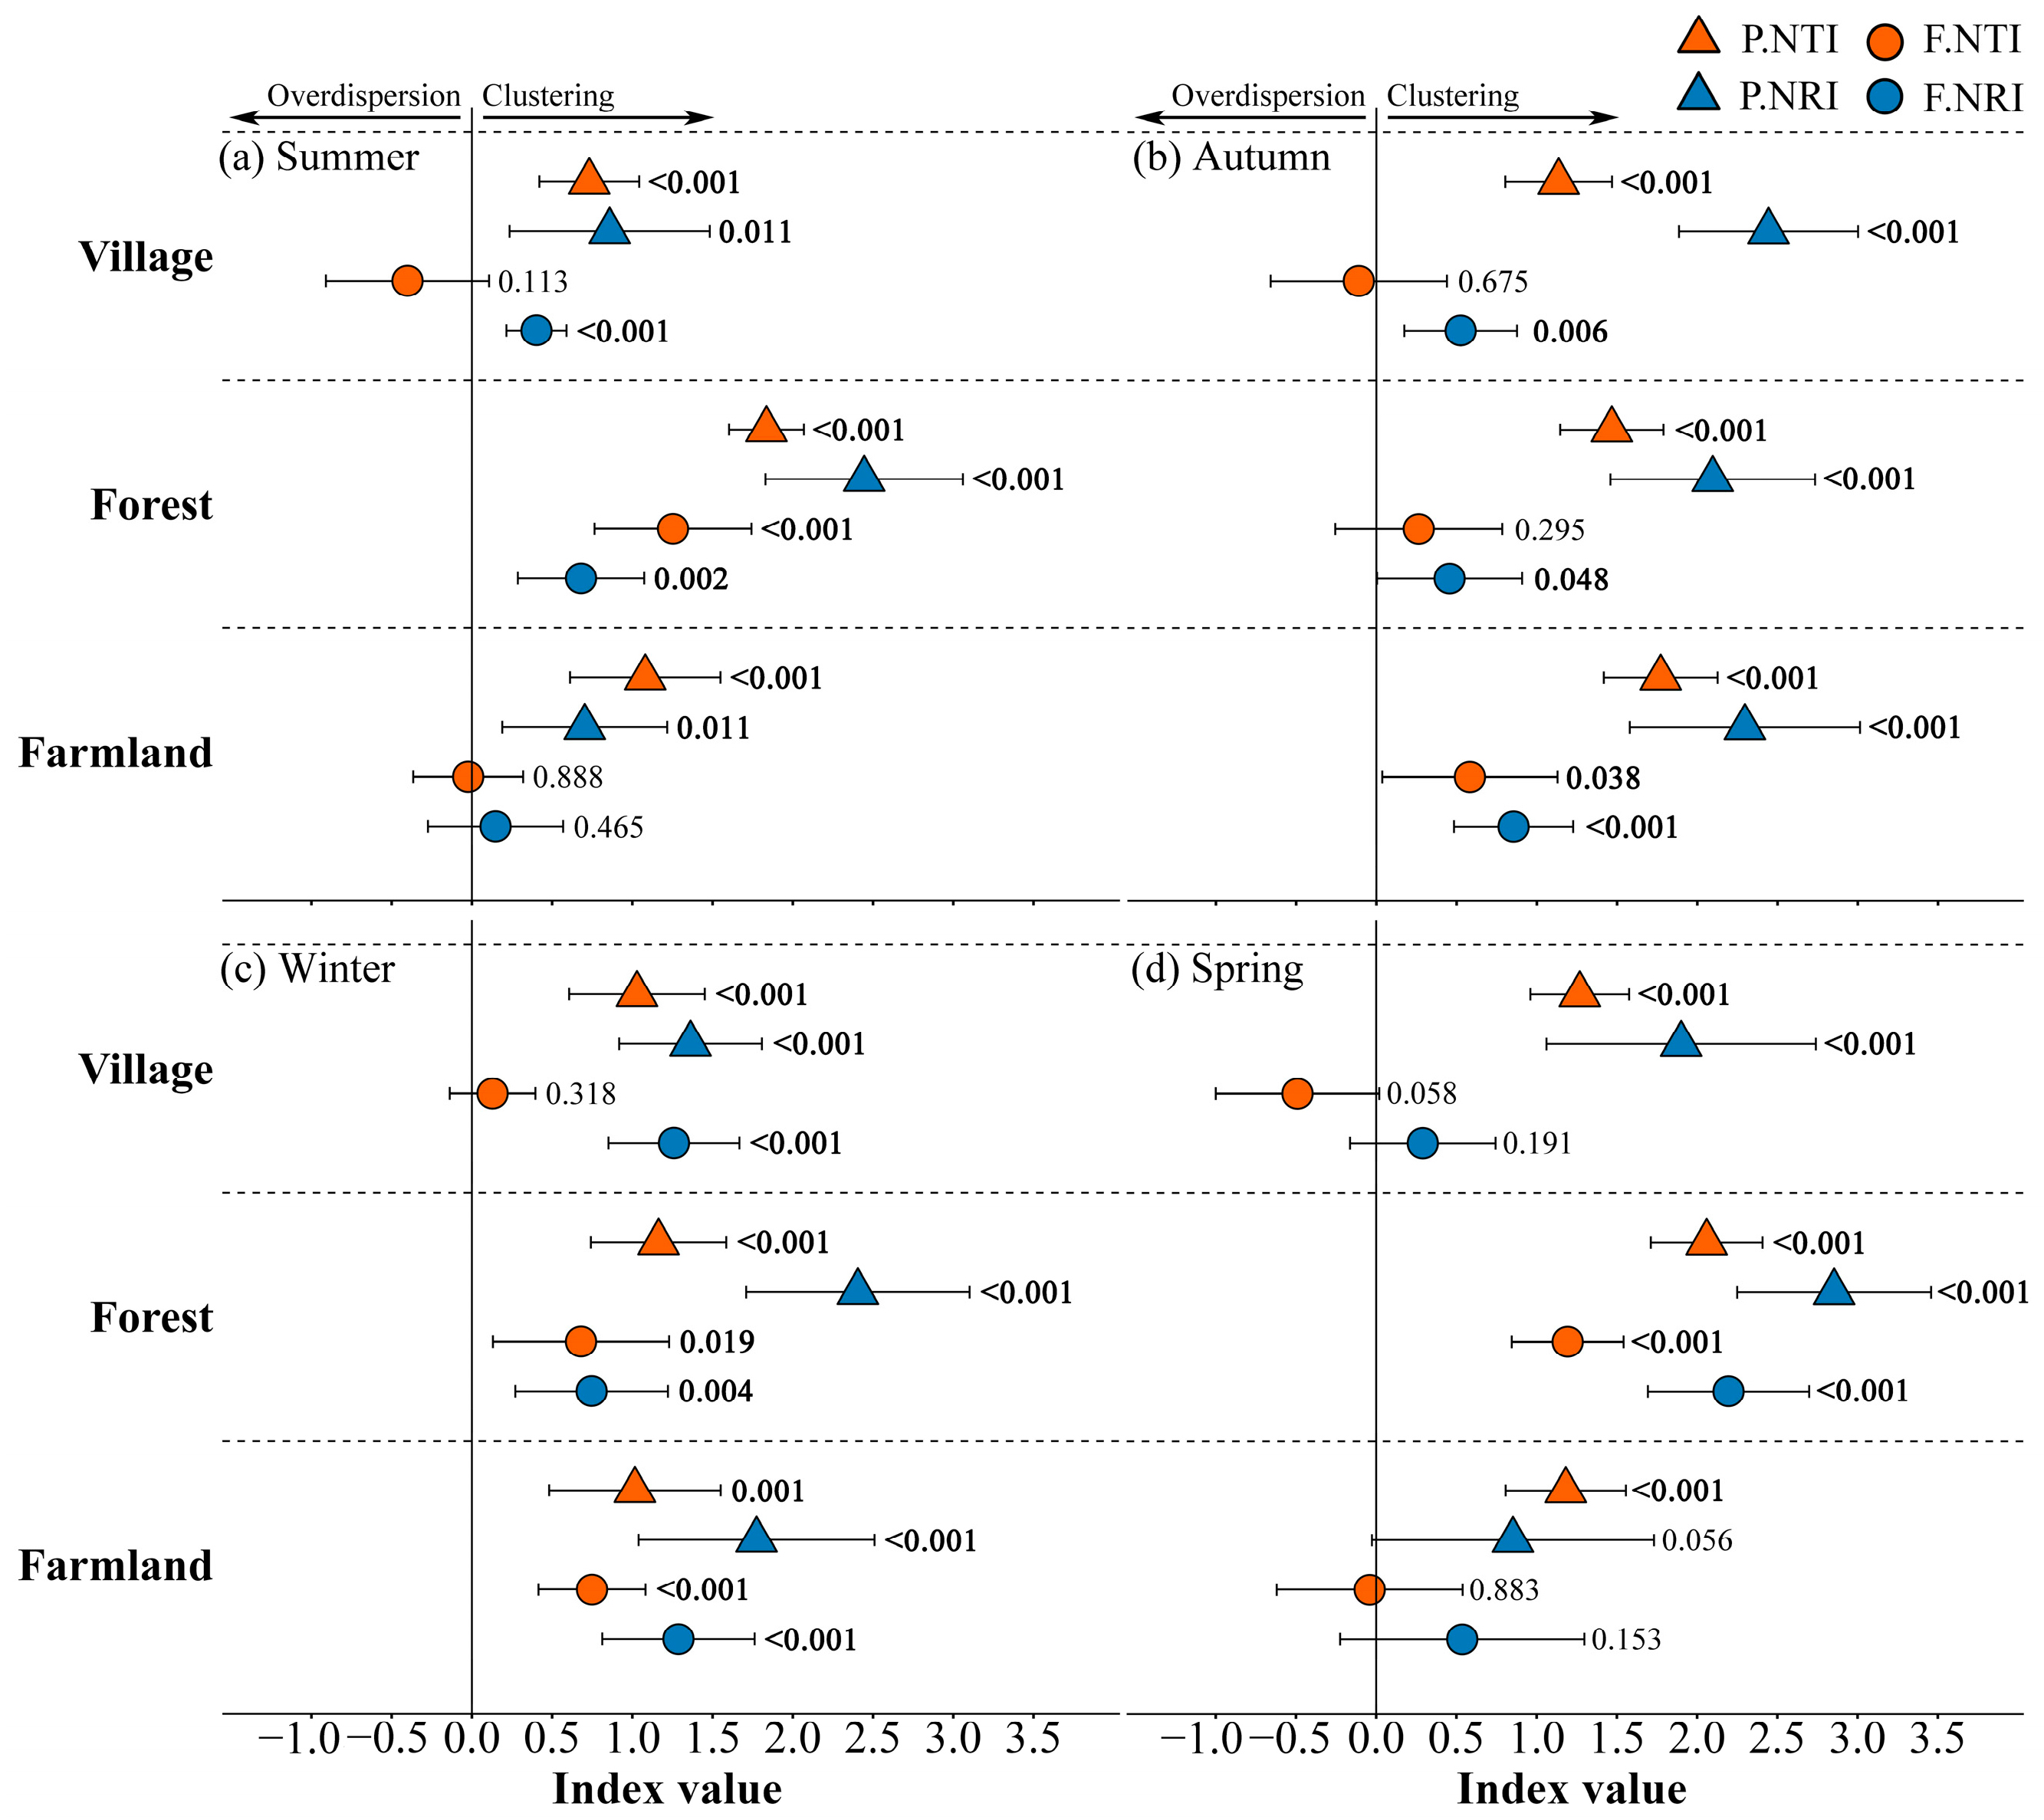
3.4. Standardized Functional and Phylogenetic Diversity

In the forests, the functional indices were greater than 0 in all seasons except autumn, while functionally the NTI (F.NTI) showed no significant difference from 0. In the villages, functionally the NRI (F.NRI) was greater than 0 in summer, autumn, and winter, while the other functional indices were not significantly different from 0 in the remaining seasons. In the farmlands, both the F.NRI and F.NTI were greater than 0 in autumn and winter, and not significantly different from 0 in spring and summer (Figure 3).
The phylogenetically NTI (P.NTI) and phylogenetically NRI (P.NRI) values across different land use types and seasons were generally greater than 0, indicating a tendency for phylogenetic clustering, except for the P.NRI in the farmlands during spring, which showed no difference from 0 (p = 0.056). However, a decoupling between functional and phylogenetic assembly processes was observed.

3.5. Effects of Land Use Type and Season on Bird Body Mass

The bird community CWM.Mass was influenced solely by land use types (land use types: H2,168 = 23.61, p < 0.001; seasons: H3,168 = 4.26, p = 0.235; interaction effects: H6,168 = 10.04, p = 0.123). The CWM.Mass was highest in the farmlands, followed by the villages, and was lowest in the forests. Significant differences in bird community CWM.Mass indices across land use types were observed in all seasons except autumn, with the indices for farmlands being consistently higher than those for forests (summer: H2,42 = 9.63, p = 0.008; autumn: H2,42 = 0.34, p = 0.843; winter: H2,42 = 8.04, p = 0.018; spring: H2,42 = 14.63, p < 0.001) (Figure 4).

4. Discussion

In this study, 15,715 individuals from 169 bird species were recorded in the Southern Anhui Mountainous Area, reaffirming the region as one of the most biodiverse spots in Anhui Province and an important part of southern China’s hilly and mountainous landscapes [50]. In recent decades, human activities have rapidly transformed natural landscapes into artificial and semi-artificial environments, known as substitution habitats. Although these habitats are not equivalent to natural ones, they can support biodiversity by providing ecological niches for species adapted to human disturbances [51]. This study highlights the role of human-dominated habitats as substitution habitats, offering refuge for many bird species and maintaining high diversity levels, thereby providing scientific guidance for conservation and management strategies for bird species in these mountainous forests.
Consistent with our expectations, human-dominated landscapes exhibited higher taxonomic diversity indices (such as abundance and species richness) compared to natural landscapes. This is likely due to the increased environmental heterogeneity caused by human activities and land use changes [52]. This heterogeneity creates new ecological niches and provides more abundant and accessible food resources, supporting a greater diversity of bird species [53,54,55]. Forests supported the highest number of threatened species, underscoring the critical importance of sustained conservation efforts in natural landscapes [56]. Notably, farmlands hosted the highest number of unique and threatened bird species, likely due to the ample food resources and open environment created by agricultural activities, which provide abundant food sources and suitable foraging grounds, particularly for birds that feed on seeds, small rodents, and insects [52]. This finding is consistent with previous studies [24,57], further supporting the importance of agricultural lands in maintaining bird diversity.
Consistent with the findings of previous studies [52], our research also found a higher functional and phylogenetic richness for bird communities within human-dominated land uses, likely due to increased ecological niches and food resources in these habitats, which in turn lead to greater bird species richness. However, this contrasts with some prior studies in nearby areas [58,59], which primarily emphasize how land use changes lead to multidimensional biotic homogenization and a decline in bird diversity. This discrepancy may arise from a stronger human disturbance and more significant land use changes in the areas examined. Evenness indices showed varied responses across dimensions. In villages, the influx of Red-rumped Swallows (Cecropis daurica) during spring and summer likely increased the abundance of village but reduced taxonomic evenness due to their high population density [60,61]. In contrast, forests exhibited a lower phylogenetic evenness, as strong environmental filtering favored closely related species [24,62]. The bird diversity peaked during migration periods (spring and autumn), likely due to favorable climates, dense vegetation, and ripening fruits attracting migratory birds [60,61]. Seasonal differences in bird communities were more pronounced in spring and summer, likely driven by fluctuations in resource availability. Although the taxonomic evenness did not significantly differ between farmlands and forests, farmlands exhibited a higher functional and phylogenetic evenness (Figure 3). This may be due to strong environmental filtering in forests reducing evenness, whereas human-dominated land uses introduced new species adapted to diverse conditions, thereby increasing the functional and phylogenetic evenness [51].
Our study found that environmental filtering primarily shapes the community assembly in homogeneous environments, while interspecies competition plays a greater role in heterogeneous environments, with potential interactions between these processes [58]. In the Southern Anhui Mountainous Area, the functional assembly in forests shows a localized randomness in autumn, likely due to increased food resources from maturing fruits and seeds, which attract birds with diverse functional traits. In contrast, villages in autumn and winter exhibit functional trait clustering, likely driven by lower temperatures and reduced resources, favoring species with similar diets and foraging strategies [63]. Despite the abundant food in autumn, farmlands show environmental filtering due to their monotonous landscape [64]. In human-dominated land uses during spring and summer, the community assembly remains largely random, except for clustering in villages in summer, possibly due to competition from Red-rumped Swallows [65]. The phylogenetic community assembly generally exhibits clustering, indicating strong environmental filtering, particularly in this mountainous region where related species tend to cluster [66,67]. However, functional traits did not always show strong phylogenetic signals, suggesting that competition exerts a greater influence on the functional structure than phylogenetic relationships [68]. Additionally, the NTI responds more to recent interspecies competition shaped by seasonal and land use variations, while the NRI likely reflects historical processes [69]. Our findings, consistent with previous research [11], suggest that the functional structure is more sensitive to competition, as functional traits are closely linked to species interactions [68].
As expected, bird species in human-dominated land uses exhibited a higher body mass compared to those in natural landscapes. This trend may be attributed to the fact that, in our study area, human settlements with a low population density and agricultural lands with traditional farming practices are interspersed within natural landscapes. These human-modified areas cause moderate disturbances to bird species while providing additional food sources [12]. For instance, villages offer birds easier access to small vegetable plots, food scraps, and planted fruit trees, compared to natural landscapes. This creates opportunities for species adapted to these environments to forage safely. Furthermore, larger, more exposed bird species can more easily obtain food resources to meet their energy needs. In contrast, birds with a lower body mass, due to their lower energy requirements and higher adaptability, are able to utilize the diverse resources available in forests with dense canopies and complex environments, which provide them with sheltered habitats and the food they need [26].
Our study covered the major land use types in the Southern Anhui Mountainous Area, with 15 transects established for each type, ensuring a good spatial representativeness. However, as the data were collected over four seasons within a single year, this study has limitations in temporal representativeness. Future research should incorporate multi-year data to better understand the temporal dynamics of bird communities.

5. Conclusions

In human-dominated land use types in the Southern Anhui Mountainous Area, we recorded a wide variety of bird species, confirming that these land uses serve as important complementary habitats for birds. They provide additional food resources and create more ecological niches, supporting species adapted to human-modified environments as well as larger species. Seasonal variations and habitat-specific factors play crucial roles in community assembly, with forests showing stronger environmental filtering effects, while bird communities in farmlands and villages are more influenced by resource fluctuations. Our study also highlighted the decoupling between the phylogenetic and functional community structure, with the functional structure being more influenced by interspecies competition. We suggest that bird conservation plans should not only focus on natural landscapes but also pay attention to human-dominated land uses with intermediate disturbances, considering multidimensional diversity and community assembly processes to better sustain bird diversity. Overall, our study highlights the role of human-dominated land uses with intermediate disturbances as substitute habitats in maintaining bird diversity in the Southern Anhui Mountainous Area.

Supplementary Materials

The following supporting information can be downloaded at https://www.mdpi.com/article/10.3390/d17040261/s1: Table S1: The area of different habitat types in each transect of the Southern Anhui Mountainous Area; Table S2: Bird species recorded in different land use types in the Southern Anhui Mountainous Area.

Author Contributions

Conceptualization, S.D., X.W. and C.L.; methodology, S.D., Y.H. and C.L.; formal analysis, S.D., Y.H., X.W., G.W. and C.L.; investigation, S.D., X.W. and Y.Z.; data curation, S.D. and X.W.; writing—original draft preparation, S.D. and Y.H.; writing—review and editing, S.D., Y.H., X.W., G.W., Y.Z. and C.L.; visualization, S.D. and G.W.; supervision, C.L.; funding acquisition, C.L. All authors have read and agreed to the published version of the manuscript.

Funding

This research was funded by the Monitoring Project of Biodiversity in the Shengjin Lake National Nature Reserve (2022BFAFN02495) and the Young Elite Scientists Sponsorship Program by CAST (PhD Student Special Program, 2024).

Data Availability Statement

The data presented in this study are available on request from the corresponding author.

Conflicts of Interest

The authors declare no conflicts of interest.

References

  1. Yang, C.; Li, Q.; Wang, X.; Cui, A.; Chen, J.; Liu, H.; Ma, W.; Dong, X.; Shi, T.; Meng, F. Human expansion-induced biodiversity crisis over Asia from 2000 to 2020. Research 2023, 6, 0226. [Google Scholar] [PubMed]
  2. Crist, E.; Mora, C.; Engelman, R. The interaction of human population, food production, and biodiversity protection. Science 2017, 356, 260–264. [Google Scholar] [PubMed]
  3. Simkin, R.D.; Seto, K.C.; McDonald, R.I.; Jetz, W. Biodiversity impacts and conservation implications of urban land expansion projected to 2050. Proc. Natl. Acad. Sci. USA 2022, 119, e2117297119. [Google Scholar] [PubMed]
  4. Venter, O.; Sanderson, E.W.; Magrach, A.; Allan, J.R.; Beher, J.; Jones, K.R.; Possingham, H.P.; Laurance, W.F.; Wood, P.; Fekete, B.M. Sixteen years of change in the global terrestrial human footprint and implications for biodiversity conservation. Nat. Commun. 2016, 7, 12558. [Google Scholar]
  5. Mayor, S.; Cahill, J., Jr.; He, F.; Sólymos, P.; Boutin, S. Regional boreal biodiversity peaks at intermediate human disturbance. Nat. Commun. 2012, 3, 1142. [Google Scholar]
  6. Connell, J.H. Diversity in tropical rain forests and coral reefs: High diversity of trees and corals is maintained only in a nonequilibrium state. Science 1978, 199, 1302–1310. [Google Scholar]
  7. Wilkinson, D.M. The disturbing history of intermediate disturbance. Oikos 1999, 84, 145–147. [Google Scholar]
  8. Cadotte, M.W. Competition–colonization trade-offs and disturbance effects at multiple scales. Ecology 2007, 88, 823–829. [Google Scholar]
  9. Sousa, W.P. The role of disturbance in natural communities. Annu. Rev. Ecol. Syst. 1984, 15, 353–391. [Google Scholar]
  10. Huston, M.A. Disturbance, productivity, and species diversity: Empiricism vs. logic in ecological theory. Ecology 2014, 95, 2382–2396. [Google Scholar]
  11. Zhao, Y.; Dunn, R.R.; Zhou, H.; Si, X.; Ding, P. Island area, not isolation, drives taxonomic, phylogenetic and functional diversity of ants on land-bridge islands. J. Biogeogr. 2020, 47, 1627–1637. [Google Scholar]
  12. Wang, X.; Zhu, G.; Ma, H.; Wu, Y.; Zhang, W.; Zhang, Y.; Li, C.; de Boer, W.F. Bird communities’ responses to human-modified landscapes in the southern Anhui Mountainous Area. Avian Res. 2022, 13, 100006. [Google Scholar]
  13. Li, C.; Zhang, Y.; Zha, D.; Yang, S.; Huang, Z.Y.X.; de Boer, W.F. Assembly processes of waterbird communities across subsidence wetlands in China: A functional and phylogenetic approach. Divers. Distrib. 2019, 25, 1118–1129. [Google Scholar]
  14. MacArthur, R.; Levins, R. The limiting similarity, convergence, and divergence of coexisting species. Am. Nat. 1967, 101, 377–385. [Google Scholar]
  15. Keddy, P.A. Assembly and response rules: Two goals for predictive community ecology. J. Veg. Sci. 1992, 3, 157–164. [Google Scholar]
  16. Tscharntke, T.; Tylianakis, J.M.; Rand, T.A.; Didham, R.K.; Fahrig, L.; Batáry, P.; Bengtsson, J.; Clough, Y.; Crist, T.O.; Dormann, C.F. Landscape moderation of biodiversity patterns and processes-eight hypotheses. Biol. Rev. 2012, 87, 661–685. [Google Scholar]
  17. Tobias, J.A.; Ottenburghs, J.; Pigot, A.L. Avian diversity: Speciation, macroevolution, and ecological function. Annu. Rev. Ecol. Evol. Syst. 2020, 51, 533–560. [Google Scholar]
  18. Gregory, R.D.; Noble, D.; Field, R.; Marchant, J.; Raven, M.; Gibbons, D. Using birds as indicators of biodiversity. Ornis Hung. 2003, 12, 11–24. [Google Scholar]
  19. Şekercioğlu, Ç.H.; Daily, G.C.; Ehrlich, P.R. Ecosystem consequences of bird declines. Proc. Natl. Acad. Sci. USA 2004, 101, 18042–18047. [Google Scholar]
  20. García, D.; Miñarro, M.; Martínez-Sastre, R. Birds as suppliers of pest control in cider apple orchards: Avian biodiversity drivers and insectivory effect. Agric. Ecosyst. Environ. 2018, 254, 233–243. [Google Scholar]
  21. Pimm, S.L.; Jenkins, C.N.; Abell, R.; Brooks, T.M.; Gittleman, J.L.; Joppa, L.N.; Raven, P.H.; Roberts, C.M.; Sexton, J.O. The biodiversity of species and their rates of extinction, distribution, and protection. Science 2014, 344, 1246752. [Google Scholar] [CrossRef] [PubMed]
  22. Chen, Z.; Li, X.; Song, W.; Li, Q.; Onditi, K.; Khanal, L.; Jiang, X. Small mammal species richness and turnover along elevational gradient in Yulong Mountain, Yunnan, Southwest China. Ecol. Evol. 2020, 10, 2545–2558. [Google Scholar] [CrossRef] [PubMed]
  23. Matthews, T.J.; Triantis, K.A.; Wayman, J.P.; Martin, T.E.; Hume, J.P.; Cardoso, P.; Faurby, S.; Mendenhall, C.D.; Dufour, P.; Rigal, F. The global loss of avian functional and phylogenetic diversity from anthropogenic extinctions. Science 2024, 386, 55–60. [Google Scholar] [CrossRef]
  24. Penjor, U.; Jamtsho, R.; Sherub, S. Anthropogenic land-use change shapes bird diversity along the eastern Himalayan altitudinal gradient. J. Appl. Ecol. 2022, 59, 847–859. [Google Scholar] [CrossRef]
  25. Lin, S.; Qiao, X.; Geng, Y.; Fan, C.; Zhang, C.; Zhao, X.; von Gadow, K. Environmental filtering drives biodiversity–spatial stability relationships in a large temperate forest region. Funct. Ecol. 2023, 37, 1688–1702. [Google Scholar] [CrossRef]
  26. Li, Z.; Zhang, H.; Xu, Y.; Wang, S. Composition of ‘fast–slow’ traits drives avian community stability over North America. Funct. Ecol. 2021, 35, 2831–2840. [Google Scholar] [CrossRef]
  27. Wang, H.; Hu, J.; Mei, H. Present situation and promotion strategy of agricultural mechanization in hilly areas of Anhui Province. Mod. Agric. Sci. Technol. (In Chinese). 2021, 11, 159–162. (In Chinese) [Google Scholar]
  28. Zhang, L.; Wang, Z.; Du, P. Construction of Mountain Ecological Security Pattern Coupled with Service and Safety Evaluation: A Case Study of the Mountainous Area of Southern Anhui Province. J. China West Norm. Univ. 2025. Available online: https://link.cnki.net/urlid/51.1699.N.20250313.1702.002 (accessed on 23 March 2025). (In Chinese).
  29. Buckland, S.T.; Anderson, D.R.; Burnham, K.P.; Laake, J.L.; Borchers, D.L.; Thomas, L. Introduction to Distance Sampling: Estimating Abundance of Biological Populations; Oxford University Press: Oxford, UK, 2001. [Google Scholar]
  30. Sutherland, W.J.; Newton, I.; Green, R. Bird Ecology and Conservation: A Handbook of Techniques; OUP Oxford: Oxford, UK, 2004. [Google Scholar]
  31. MacKinnon, J. Guide to the Birds of China; Oxford University Press: Oxford, UK, 2021. [Google Scholar]
  32. Ding, Z.; Feeley, K.J.; Wang, Y.; Pakeman, R.J.; Ding, P. Patterns of bird functional diversity on land-bridge island fragments. J. Anim. Ecol. 2013, 82, 781–790. [Google Scholar] [CrossRef]
  33. Blomberg, S.P.; Garland, T., Jr.; Ives, A.R. Testing for phylogenetic signal in comparative data: Behavioral traits are more labile. Evolution 2003, 57, 717–745. [Google Scholar]
  34. Wang, Y.; Song, Y.; Zhong, Y.; Chen, C.; Zhao, Y.; Zeng, D.; Wu, Y.; Ding, P. A Dataset on the Life-history and Ecological Traits of Chinese Birds. Biodivers. Sci. 2021, 29, 1149–1153. [Google Scholar] [CrossRef]
  35. Wilman, H.; Belmaker, J.; Simpson, J.; de la Rosa, C.; Rivadeneira, M.M.; Jetz, W. EltonTraits 1.0: Species-level foraging attributes of the world’s birds and mammals. Ecology 2014, 95, 2027. [Google Scholar] [CrossRef]
  36. Botta-Dukát, Z. Rao’s quadratic entropy as a measure of functional diversity based on multiple traits. J. Veg. Sci. 2005, 16, 533–540. [Google Scholar] [CrossRef]
  37. Swenson, N.G. Functional and Phylogenetic Ecology in R; Springer: Berlin/Heidelberg, Germany, 2014. [Google Scholar]
  38. Jetz, W.; Thomas, G.H.; Joy, J.B.; Hartmann, K.; Mooers, A.O. The global diversity of birds in space and time. Nature 2012, 491, 444–448. [Google Scholar] [CrossRef]
  39. Rubolini, D.; Liker, A.; Garamszegi, L.Z.; Møller, A.P.; Saino, N. Using the BirdTree. org website to obtain robust phylogenies for avian comparative studies: A primer. Curr. Zool. 2015, 61, 959–965. [Google Scholar] [CrossRef]
  40. Bouckaert, R.; Heled, J.; Kühnert, D.; Vaughan, T.; Wu, C.-H.; Xie, D.; Suchard, M.A.; Rambaut, A.; Drummond, A.J. BEAST 2: A Software Platform for Bayesian Evolutionary Analysis. PLOS Comput. Biol. 2014, 10, e1003537. [Google Scholar] [CrossRef]
  41. Mammola, S.; Carmona, C.P.; Guillerme, T.; Cardoso, P. Concepts and applications in functional diversity. Funct. Ecol. 2021, 35, 1869–1885. [Google Scholar] [CrossRef]
  42. Villéger, S.; Mason, N.W.; Mouillot, D. New multidimensional functional diversity indices for a multifaceted framework in functional ecology. Ecology 2008, 89, 2290–2301. [Google Scholar] [CrossRef]
  43. Helmus, M.R.; Bland, T.J.; Williams, C.K.; Ives, A.R. Phylogenetic Measures of Biodiversity. Am. Nat. 2007, 169, E68–E83. [Google Scholar] [CrossRef]
  44. Ali, A.; Yan, E.-R. Consequences of phylogenetic conservativeness and functional trait similarity on aboveground biomass vary across subtropical forest strata. For. Ecol. Manag. 2018, 429, 28–35. [Google Scholar] [CrossRef]
  45. Webb, C.O. Exploring the phylogenetic structure of ecological communities: An example for rain forest trees. Am. Nat. 2000, 156, 145–155. [Google Scholar] [CrossRef] [PubMed]
  46. Gómez, J.P.; Bravo, G.A.; Brumfield, R.T.; Tello, J.G.; Cadena, C.D. A phylogenetic approach to disentangling the role of competition and habitat filtering in community assembly of Neotropical forest birds. J. Anim. Ecol. 2010, 79, 1181–1192. [Google Scholar] [PubMed]
  47. Laliberté, E.; Legendre, P.; Shipley, B. Package ‘FD’. Measuring Functional Diversity from Multiple Traits, and Other Tools for Functional Ecology. 2014. Available online: https://www.scirp.org/reference/ReferencesPapers?ReferenceID=1820451 (accessed on 2 March 2025).
  48. Kembel, S.W.; Cowan, P.D.; Helmus, M.R.; Cornwell, W.K.; Morlon, H.; Ackerly, D.D.; Blomberg, S.P.; Webb, C.O. Picante: R tools for integrating phylogenies and ecology. Bioinformatics 2010, 26, 1463–1464. [Google Scholar] [CrossRef]
  49. Team, R.C. R Version 4.3.3; R Core Team: Vienna, Austria, 2024. [Google Scholar]
  50. Dong, K. β-diversity Patterns of Bird Communities in Natural Protected Areas in Anhui by Separating the Turnover and Nestedness Components. Pak. J. Zool. 2023. [Google Scholar]
  51. Martínez-Abraín, A.; Jiménez, J. Anthropogenic areas as incidental substitutes for original habitat. Conserv. Biol. 2016, 30, 593–598. [Google Scholar]
  52. Salaverri, L.; Guitián, J.; Munilla, I.; Sobral, M. Bird richness decreases with the abandonment of agriculture in a rural region of SW Europe. Reg. Environ. Chang. 2019, 19, 245–250. [Google Scholar] [CrossRef]
  53. Padilla, B.J.; Sutherland, C. Drivers of avian diversity and abundance across gradients of human influence. Landsc. Ecol. 2022, 37, 969–981. [Google Scholar]
  54. Sullivan, M.J.; Davies, R.G.; Mossman, H.L.; Franco, A.M. An anthropogenic habitat facilitates the establishment of non-native birds by providing underexploited resources. PLoS ONE 2015, 10, e0135833. [Google Scholar]
  55. Sol, D.; Griffin, A.S.; Bartomeus, I.; Boyce, H. Exploring or avoiding novel food resources? The novelty conflict in an invasive bird. PLoS ONE 2011, 6, e19535. [Google Scholar] [CrossRef]
  56. Alroy, J. Effects of habitat disturbance on tropical forest biodiversity. Proc. Natl. Acad. Sci. USA 2017, 114, 6056–6061. [Google Scholar]
  57. Pérez, G.; Mills, S.C.; Socolar, J.B.; Martínez-Revelo, D.E.; Haugaasen, T.; Gilroy, J.J.; Edwards, D.P. Avian phylogenetic and functional diversity are better conserved by land-sparing than land-sharing farming in lowland tropical forests. J. Appl. Ecol. 2024, 61, 2497–2509. [Google Scholar] [CrossRef]
  58. Htay, T.; Røskaft, E.; Ringsby, T.H.; Ranke, P.S. Spatio-temporal variation in avian taxonomic, functional, and phylogenetic diversity and its relevance for conservation in a wetland ecosystem in Myanmar. Biodivers. Conserv. 2023, 32, 2841–2867. [Google Scholar] [CrossRef]
  59. Liang, C.; Yang, G.; Wang, N.; Feng, G.; Yang, F.; Svenning, J.-C.; Yang, J. Taxonomic, phylogenetic and functional homogenization of bird communities due to land use change. Biol. Conserv. 2019, 236, 37–43. [Google Scholar] [CrossRef]
  60. Somveille, M.; Manica, A.; Butchart, S.H.M.; Rodrigues, A.S.L. Mapping Global Diversity Patterns for Migratory Birds. PLoS ONE 2013, 8, e70907. [Google Scholar]
  61. Xie, S.; Ouyang, Z.; Gong, C.; Meng, N.; Lu, F. Seasonal fluctuations of urban birds and their responses to immigration: An example from Macau, China. Urban For. Urban Green. 2021, 59, 126936. [Google Scholar]
  62. Sreekar, R.; Si, X.; Sam, K.; Liu, J.; Dayananda, S.; Goodale, U.; Kotagama, S.; Goodale, E. Land use and elevation interact to shape bird functional and phylogenetic diversity and structure: Implications for designing optimal agriculture landscapes. J. Appl. Ecol. 2021, 58, 1738–1748. [Google Scholar] [CrossRef]
  63. Kraft, N.J.B.; Ackerly, D.D. Functional trait and phylogenetic tests of community assembly across spatial scales in an Amazonian forest. Ecol. Monogr. 2010, 80, 401–422. [Google Scholar]
  64. Zhao, Y.; Mendenhall, C.D.; Matthews, T.J.; Wang, D.; Li, W.; Liu, X.; Tang, S.; Han, P.; Wei, G.; Kang, Y. Land-use change interacts with island biogeography to alter bird community assembly. Proc. R. Soc. B 2024, 291, 20232245. [Google Scholar]
  65. Tilman, D. Niche tradeoffs, neutrality, and community structure: A stochastic theory of resource competition, invasion, and community assembly. Proc. Natl. Acad. Sci. USA 2004, 101, 10854–10861. [Google Scholar]
  66. Diamond, J.M. The island dilemma: Lessons of modern biogeographic studies for the design of natural reserves. Biol. Conserv. 1975, 7, 129–146. [Google Scholar] [CrossRef]
  67. Si, X.; Cadotte, M.W.; Zeng, D.; Baselga, A.; Zhao, Y.; Li, J.; Wu, Y.; Wang, S.; Ding, P. Functional and phylogenetic structure of island bird communities. J. Anim. Ecol. 2017, 86, 532–542. [Google Scholar] [CrossRef] [PubMed]
  68. Cadotte, M.W.; Carboni, M.; Si, X.; Tatsumi, S. Do traits and phylogeny support congruent community diversity patterns and assembly inferences? J. Ecol. 2019, 107, 2065–2077. [Google Scholar] [CrossRef]
  69. Che, X.; Chen, D.; Zhang, M.; Quan, Q.; Møller, A.P.; Zou, F. Seasonal dynamics of waterbird assembly mechanisms revealed by patterns in phylogenetic and functional diversity in a subtropical wetland. Biotropica 2019, 51, 421–431. [Google Scholar] [CrossRef]
Figure 1. Study area and distribution of line transects across different land use types, with (a) spatial distribution of transects and (b) corresponding land use classification in Southern Anhui Mountainous Area.
Diversity 17 00261 g001
Figure 2. The taxonomic, functional, and phylogenetic diversity indices of bird communities across three land use types (farmland, forest, and village) were compared across different seasons in the Southern Anhui Mountainous Area. Error bars represent 95% confidence intervals. The same letters next to the plots indicate no significant differences between land uses within each season. ‘NS’ (Not Significant) denotes the absence of statistically significant differences in the diversity index among the three land uses within a given season. SR: species richness; TE: pielou’s evenness; FRic: functional richness; FEve: functional evenness; PSR: phylogenetic species richness; and PSE: phylogenetic species evenness.
Diversity 17 00261 g002
Figure 3. The standardized effect sizes of the functional and phylogenetic MPD and MNTD indices (i.e., F.NTI, F.NRI, P.NTI, and P.NRI) and their 95% confidence intervals, calculated for various land use types across different seasons. p values from one-sample t-tests (testing against 0) are also shown, with bold significance values indicating significant differences from 0. P.NTI: phylogenetically nearest taxon index; F.NTI: functionally nearest taxon index; P.NRI: phylogenetically nearest relative index; and F.NRI: functionally nearest relative index.
Diversity 17 00261 g003
Figure 4. Distribution patterns of the bird community CWM.Mass across different seasons and land use types in the Southern Anhui Mountain Area. Pairwise comparisons between land use types within each season were conducted using the Scheirer–Ray–Hare test, followed by Dunn’s test with Bonferroni correction. Boxplots sharing the same letter indicate no significant difference according to these tests.
Diversity 17 00261 g004
Table 1. The functional traits used to calculate the functional diversity of bird assemblages and their phylogenetic signals (Blomberg’s K).
Functional TraitsTrait TypesValue TypeKp
Body massBody mass in gramsContinuous0.469<0.001
DietInvertebratesBinary0.3630.007
VertebratesBinary0.0410.547
ScavengerBinary0.2590.042
Nectar and fruitBinary0.285<0.001
SeedBinary0.272<0.001
Plant materialBinary0.1890.128
Foraging stratumWaterBinary2.405<0.001
GroundBinary0.2430.003
UnderstoryBinary0.1690.578
Mid to highBinary0.2360.279
CanopyBinary0.4610.071
AerialBinary0.2570.041
A higher K index value indicates a stronger phylogenetic signal. p values indicate the significance of the phylogenetic signal for the functional trait, with values below 0.05 considered significant and shown in bold.
Table 2. Bird abundance, species richness, and counts of unique and threatened species in different land uses of Southern Anhui Mountain Area.
Land Use TypesAbundanceSpecies RichnessUnique SpeciesThreated Species
Villages64681115 (8)14 (94)
Farmlands554414730 (161)24 (196)
Forests370310411 (30)16 (297)
All habitats15,715169/31 (587)
The ‘unique species’ and ‘threatened species’ columns display the number of species outside the parentheses, with their abundance indicated inside the parentheses. Unique species refer to those recorded exclusively in specific habitats. All threatened species listed are either classified under the IUCN Red List (categories VU, EN, and CR) or recognized as Key Protected Wild Animal Species in China.
Disclaimer/Publisher’s Note: The statements, opinions and data contained in all publications are solely those of the individual author(s) and contributor(s) and not of MDPI and/or the editor(s). MDPI and/or the editor(s) disclaim responsibility for any injury to people or property resulting from any ideas, methods, instructions or products referred to in the content.

