
Genome Skimming of Thysanoptera (Arthropoda, Insecta) and Its Taxonomic and Systematic Applications


Abstract
1. Introduction
2. Material and Methods
2.1. Sampling, DNA Extraction, and COI Amplification
2.2. Library Preparation and Sequencing
2.3. Bioinformatics and Alignments
2.4. Species Delimitation Tests
2.5. Phylogeny from Supermatrix
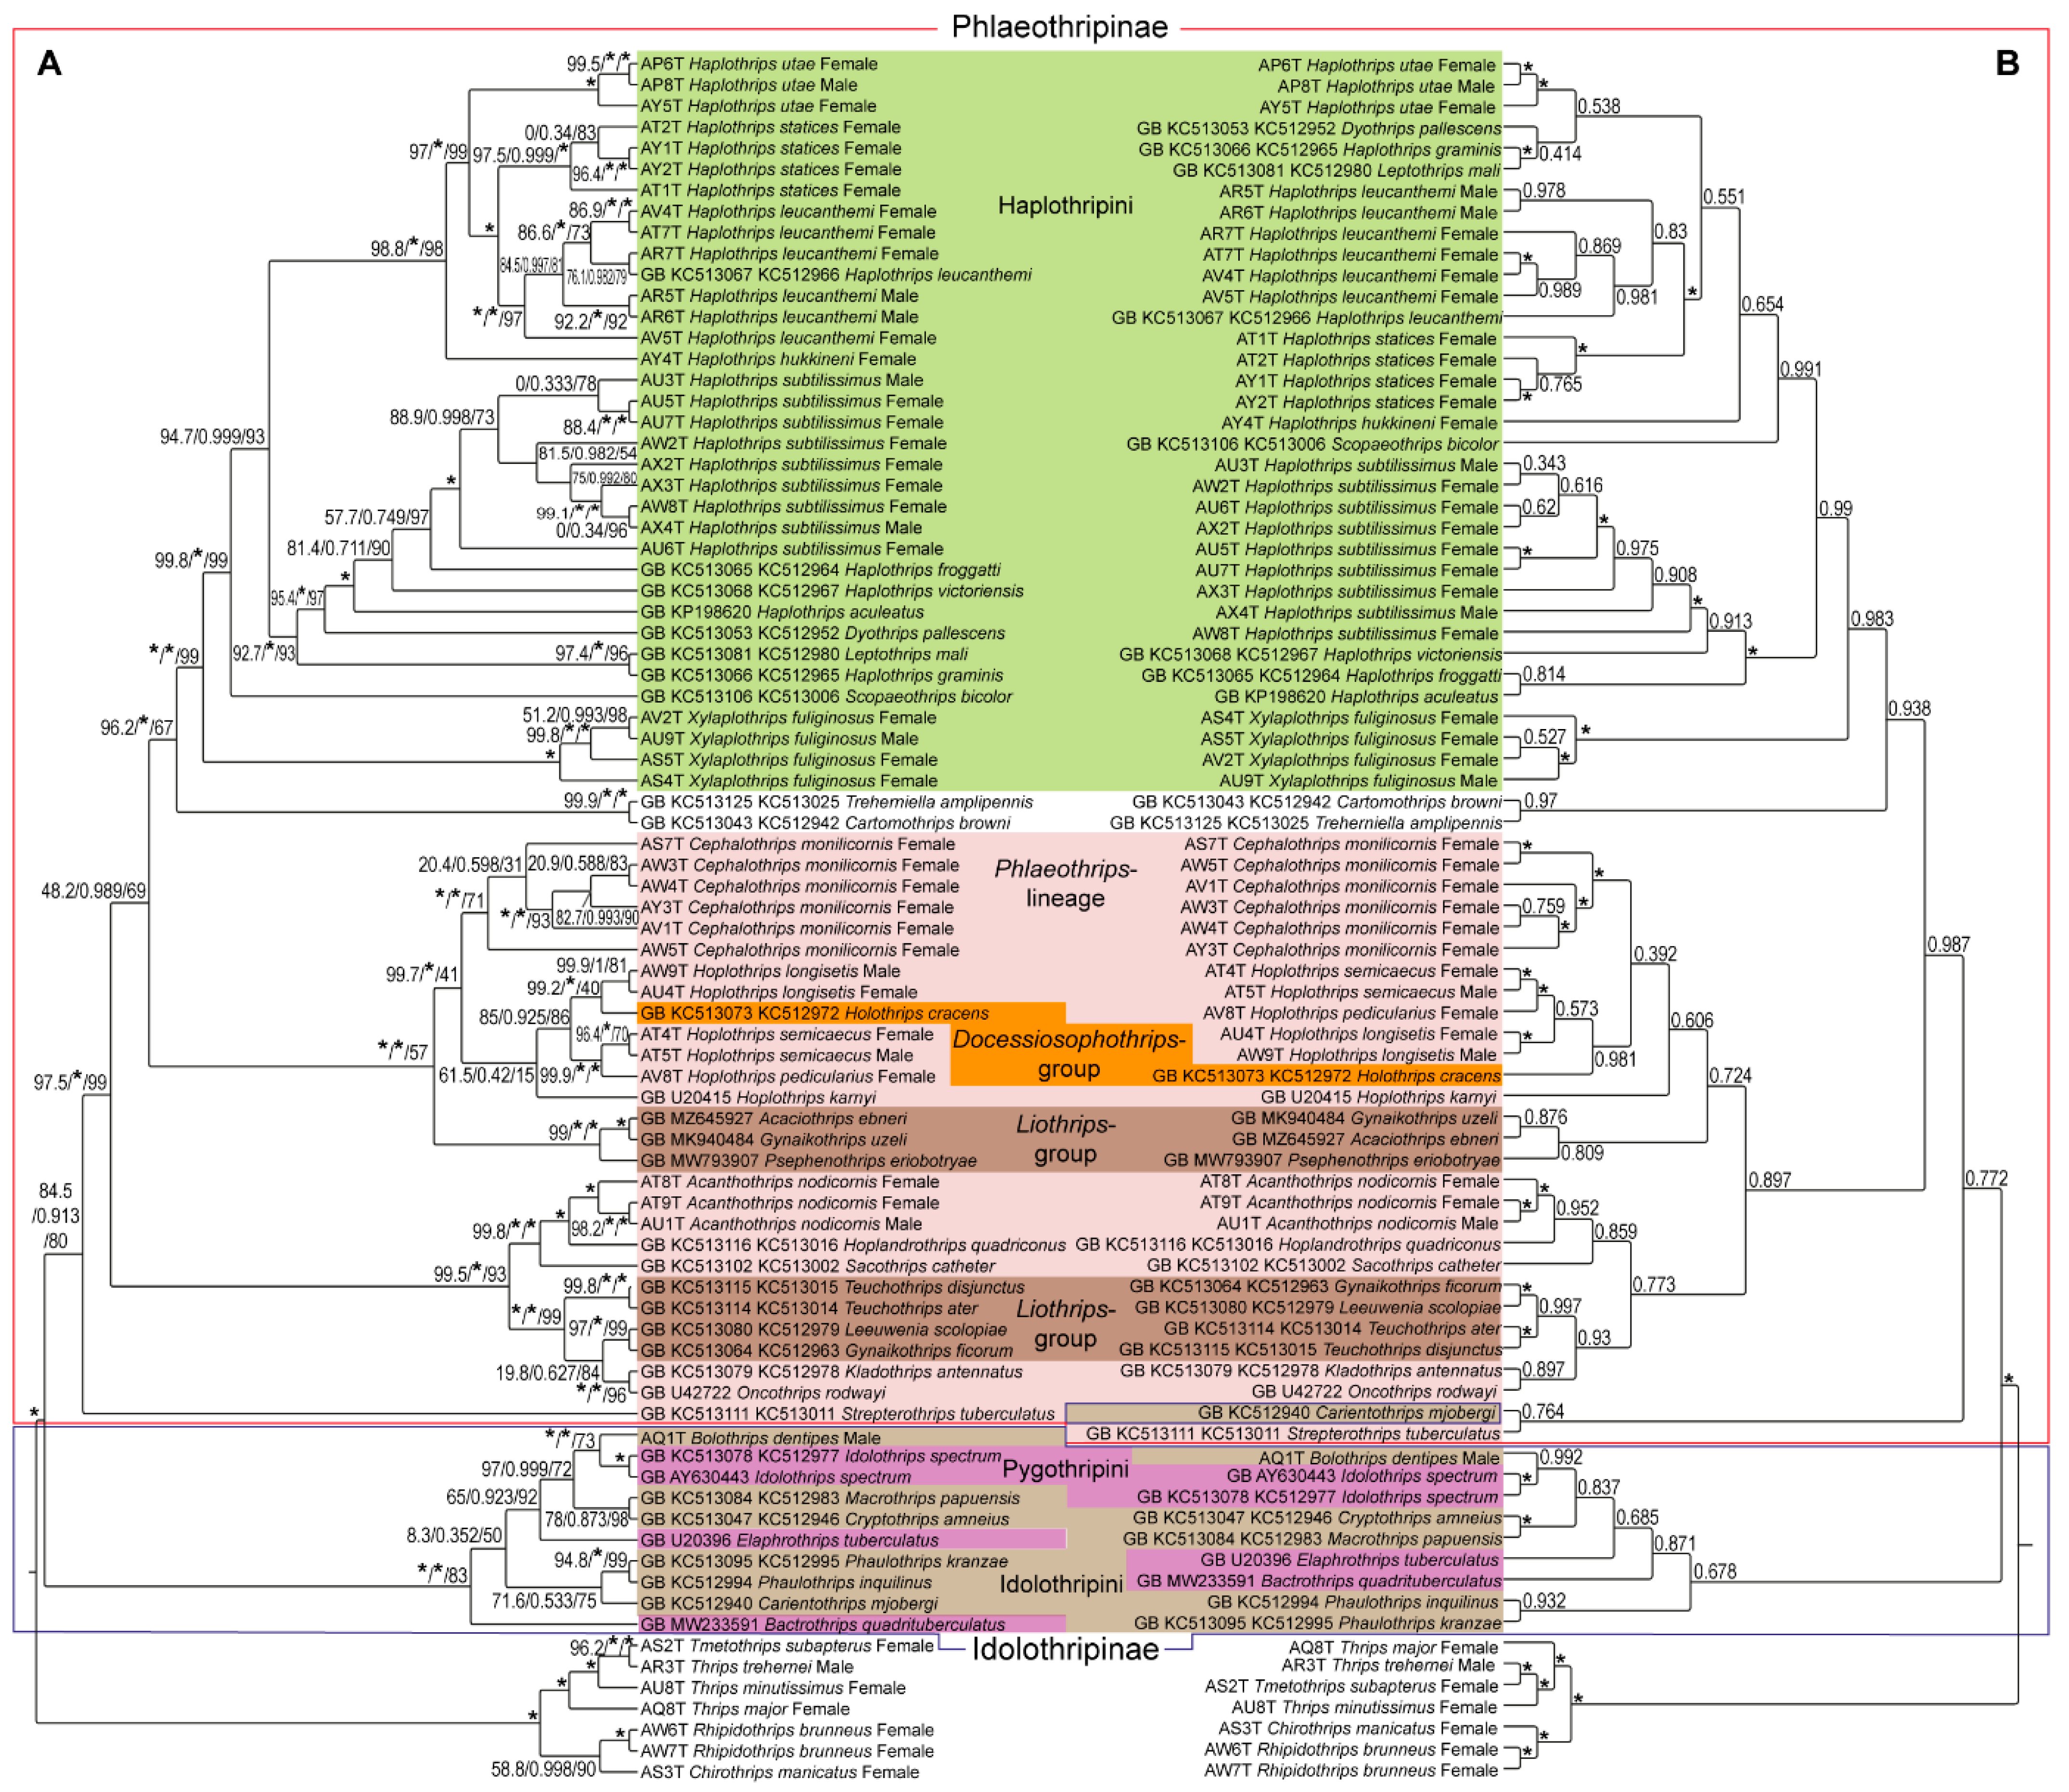
3. Results
4. Discussion and Conclusions
Supplementary Materials
Funding
Institutional Review Board Statement
Data Availability Statement
Acknowledgments
Conflicts of Interest
References
- Mound, L.A.; Teulon, D.A. Thysanoptera as Phytophagous Opportunists. Thrips Biol. Manag. 1995, 3, 3–19. [Google Scholar]
- Reynaud, P. Thrips (Thysanoptera). BioRisk 2010, 4, 767–791. [Google Scholar] [CrossRef]
- Folmer, O.; Hoeh, W.R.; Black, M.B.; Vrijenhoek, R.C. DNA Primers for Amplification of Mitochondrial Cytochrome c Oxidase Subunit I from Diverse Metazoan Invertebrates. Mol. Mar. Biol. Biotechnol. 1994, 3, 294–299. [Google Scholar] [PubMed]
- Hebert, P.D.N.; Cywinska, A.; Ball, S.L.; deWaard, J.R. Biological Identifications through DNA Barcodes. Proc. R. Soc. Lond. Ser. B 2003, 270, 313–321. [Google Scholar] [CrossRef]
- Sweeney, B.W.; Battle, J.M.; Jackson, J.K.; Dapkey, T. Can DNA Barcodes of Stream Macroinvertebrates Improve Descriptions of Community Structure and Water Quality? J. N. Am. Benthol. Soc. 2011, 30, 195–216. [Google Scholar] [CrossRef]
- Jaramillo, J.; Chapman, E.G.; Vega, F.E.; Harwood, J.D. Molecular Diagnosis of a Previously Unreported Predator–Prey Association in Coffee: Karnyothrips flavipes Jones (Thysanoptera: Phlaeothripidae) Predation on the Coffee Berry Borer. Naturwissenschaften 2010, 97, 291–298. [Google Scholar] [CrossRef]
- Marquina, D.; Andersson, A.F.; Ronquist, F. New Mitochondrial Primers for Metabarcoding of Insects, Designed and Evaluated Using In Silico Methods. Mol. Ecol. Resour. 2019, 19, 90–104. [Google Scholar] [CrossRef]
- Pons, J.; Barraclough, T.G.; Gomez-Zurita, J.; Cardoso, A.; Duran, D.P.; Hazell, S.; Kamoun, S.; Sumlin, W.D.; Vogler, A.P. Sequence-Based Species Delimitation for the DNA Taxonomy of Undescribed Insects. Syst. Biol. 2006, 55, 595–609. [Google Scholar] [CrossRef]
- Xie, Y.L.; Mound, L.A.; Lima, É.F.B.; He, S.Q.; Zhang, H.R.; Li, Y.J. Molecular Studies of Relationships and Identifications among Insects of the Subfamily Panchaetothripinae (Thysanoptera, Thripidae). J. Insect Sci. 2022, 22, 6. [Google Scholar] [CrossRef]
- Huang, J.-P. What Have Been and What Can Be Delimited as Species Using Molecular Data under the Multi-Species Coalescent Model? A Case Study Using Hercules Beetles (Dynastes; Dynastidae). Insect Syst. Divers. 2018, 2, 3. [Google Scholar] [CrossRef]
- Leaché, A.D.; Zhu, T.; Rannala, B.; Yang, Z. The Spectre of Too Many Species. Syst. Biol. 2019, 68, 168–181. [Google Scholar] [CrossRef] [PubMed]
- Mound, L.A.; Palmer, J.M. The Generic and Tribal Classification of Spore-Feeding Thysanoptera (Phlaeothripidae: Idolothripinae). Bull. Br. Mus. Nat. Hist. Entomol. 1983, 46, 1–174. [Google Scholar]
- Buckman, R.S.; Mound, L.A.; Whiting, M.F. Phylogeny of Thrips (Insecta: Thysanoptera) Based on Five Molecular Loci. Syst. Entomol. 2013, 38, 123–133. [Google Scholar] [CrossRef]
- Tyagi, K.; Chakraborty, R.; Cameron, S.L.; Sweet, A.D.; Chandra, K.; Kumar, V. Rearrangement and Evolution of Mitochondrial Genomes in Thysanoptera (Insecta). Sci. Rep. 2020, 10, 695. [Google Scholar] [CrossRef]
- Botero-Castro, F.; Tilak, M.K.; Justy, F.; Catzeflis, F.; Delsuc, F.; Douzery, E.J. Next-Generation Sequencing and Phylogenetic Signal of Complete Mitochondrial Genomes for Resolving the Evolutionary History of Leaf-Nosed Bats (Phyllostomidae). Mol. Phylogenet. Evol. 2013, 69, 728–739. [Google Scholar] [CrossRef]
- Magnussen, T.; Johnsen, A.; Kjærandsen, J.; Struck, T.H.; Søli, G.E. Molecular Phylogeny of Allodia (Diptera: Mycetophilidae) Constructed Using Genome Skimming. Syst. Entomol. 2022, 47, 267–281. [Google Scholar] [CrossRef]
- Trevisan, B.; Alcantara, D.M.; Machado, D.J.; Marques, F.P.; Lahr, D.J. Genome Skimming Is a Low-Cost and Robust Strategy to Assemble Complete Mitochondrial Genomes from Ethanol Preserved Specimens in Biodiversity Studies. PeerJ 2019, 7, e7543. [Google Scholar] [CrossRef]
- Ren, Z.; Harris, A.J.; Dikow, R.B.; Ma, E.; Zhong, Y.; Wen, J. Another Look at the Phylogenetic Relationships and Intercontinental Biogeography of Eastern Asian–North American Rhus Gall Aphids (Hemiptera: Aphididae: Eriosomatinae): Evidence from Mitogenome Sequences via Genome Skimming. Mol. Phylogenet. Evol. 2017, 117, 102–110. [Google Scholar] [CrossRef]
- Zhang, X.; Kang, Z.; Ding, S.; Wang, Y.; Borkent, C.; Saigusa, T.; Yang, D. Mitochondrial Genomes Provide Insights into the Phylogeny of Culicomorpha (Insecta: Diptera). Int. J. Mol. Sci. 2019, 20, 747. [Google Scholar] [CrossRef]
- Zhang, C.; Zhang, D.-X.; Zhu, T.; Yang, Z. Evaluation of a Bayesian Coalescent Method of Species Delimitation. Syst. Biol. 2011, 60, 747–761. [Google Scholar] [CrossRef]
- Wahlberg, E. A Modern Workflow for Non-Destructive DNA Extraction and Slide Preparation of Thrips (Insecta, Thysanoptera) for Taxonomic Studies and Collection Deposition. Norw. J. Entomol. 2023, 70, 1–5. [Google Scholar]
- Mound, L.A.; Morison, G.D.; Pitkin, B.R.; Palmer, J.M. Part 11—Thysanoptera. In Handbooks for the Identification of British Insects; Royal Entomological Society: London, UK, 1976; Volume 1, p. 79. [Google Scholar]
- Mound, L.A.; Collins, D.W.; Hastings, A. Thysanoptera Britannica et Hibernica–Thrips of the British Isles; Lucidcentral.org, Identic Pty Ltd.: Brisbane, QLD, Australia, 2018. [Google Scholar]
- zur Strassen, R. Die Terebranten Thysanopteren Europas und des Mittelmeer-Gebietes; Die Tierwelt Deutschlands; Verlag Goecke & Evers: Keltern, Germany, 2003; Volume 74, pp. 1–271. [Google Scholar]
- Wahlberg, E.; Gertsson, C.-A. Identification Key to and Checklist of the Swedish Phlaeothripidae (Thysanoptera). ZooKeys 2022, 1096, 161–187. [Google Scholar] [CrossRef]
- Wahlberg, E. The Swedish Aeolothripidae and Melanthripidae (Thysanoptera) with a Redescription of Rhipidothrips niveipennis Reuter, 1899. Taxonomy 2024, 4, 163–183. [Google Scholar] [CrossRef]
- Meyer, M.; Kircher, M. Illumina Sequencing Library Preparation for Highly Multiplexed Target Capture and Sequencing. Cold Spring Harb. Protoc. 2010, 2010, pdb.prot5448. [Google Scholar] [CrossRef] [PubMed]
- Irestedt, M.; Thörn, F.; Müller, I.A.; Jønsson, K.A.; Ericson PG, P.; Blom, M.P.K. A Guide to Avian Museomics: Insights Gained from Resequencing Hundreds of Avian Study Skins. Mol. Ecol. Resour. 2022, 22, 2672–2684. [Google Scholar] [CrossRef]
- Afgan, E.; Nekrutenko, A.; Grüning, B.A.; Blankenberg, D.; Goecks, J.; Schatz, M.C.; Briggs, P.J. The Galaxy Platform for Accessible, Reproducible, and Collaborative Biomedical Analyses: 2022 Update. Nucleic Acids Res. 2022, 50, W345–W351. [Google Scholar] [CrossRef]
- Dierckxsens, N.; Mardulyn, P.; Smits, G. NOVOPlasty: De Novo Assembly of Organelle Genomes from Whole Genome Data. Nucleic Acids Res. 2016, 44, e18. [Google Scholar] [CrossRef]
- Donath, A.; Jühling, F.; Al-Arab, M.; Bernhart, S.H.; Reinhardt, F.; Stadler, P.F.; Middendorf, M.; Bernt, M. Improved Annotation of Protein-Coding Gene Boundaries in Metazoan Mitochondrial Genomes. Nucleic Acids Res. 2019, 47, 10543–10552. [Google Scholar] [CrossRef]
- Wheeler, D.L.; Barrett, T.; Benson, D.A.; Bryant, S.H.; Canese, K.; Chetvernin, V.; Yaschenko, E. Database Resources of the National Center for Biotechnology Information. Nucleic Acids Res. 2007, 35 (Suppl. S1), D5–D12. [Google Scholar] [CrossRef]
- Bolger, A.M.; Lohse, M.; Usadel, B. Trimmomatic: A Flexible Trimmer for Illumina Sequence Data. Bioinformatics 2014, 30, 2114–2120. [Google Scholar] [CrossRef]
- Langmead, B.; Salzberg, S.L. Fast Gapped-Read Alignment with Bowtie 2. Nat. Methods 2012, 9, 357–359. [Google Scholar] [CrossRef] [PubMed]
- Li, H.; Handsaker, B.; Wysoker, A.; Fennell, T.; Ruan, J.; Homer, N.; Marth, G.; Abecasis, G.; Durbin, R. The Sequence Alignment/Map Format and SAMtools. Bioinformatics 2009, 25, 2078–2079. [Google Scholar] [CrossRef] [PubMed]
- Criscuolo, A.; Gribaldo, S. BMGE (Block Mapping and Gathering with Entropy): A New Software for Selection of Phylogenetic Informative Regions from Multiple Sequence Alignments. BMC Evol. Biol. 2010, 10, 210. [Google Scholar] [CrossRef]
- Kearse, M.; Moir, R.; Wilson, A.; Stones-Havas, S.; Cheung, M.; Sturrock, S.; Buxton, S.; Cooper, A.; Markowitz, S.; Duran, C.; et al. Geneious Basic: An Integrated and Extendable Desktop Software Platform for the Organization and Analysis of Sequence Data. Bioinformatics 2012, 28, 1647–1649. [Google Scholar] [CrossRef]
- Ratnasingham, S.; Hebert, P.D.N. BOLD: The Barcode of Life Data System (http://www.barcodinglife.org). Mol. Ecol. Notes 2007, 7, 355–364. [Google Scholar] [CrossRef]
- Elbrecht, V.; Leese, F. Validation and Development of COI Metabarcoding Primers for Freshwater Macroinvertebrate Bioassessment. Front. Environ. Sci. 2017, 5, 11. [Google Scholar] [CrossRef]
- Trifinopoulos, J.; Nguyen, L.T.; von Haeseler, A.; Minh, B.Q. W-IQ-TREE: A Fast Online Phylogenetic Tool for Maximum Likelihood Analysis. Nucleic Acids Res. 2016, 44, W232–W235. [Google Scholar] [CrossRef]
- Kalyaanamoorthy, S.; Minh, B.Q.; Wong, T.K.; von Haeseler, A.; Jermiin, L.S. ModelFinder: Fast Model Selection for Accurate Phylogenetic Estimates. Nat. Methods 2017, 14, 587–589. [Google Scholar] [CrossRef]
- Guindon, S.; Dufayard, J.F.; Lefort, V.; Anisimova, M.; Hordijk, W.; Gascuel, O. New Algorithms and Methods to Estimate Maximum-Likelihood Phylogenies: Assessing the Performance of PhyML 3.0. Syst. Biol. 2010, 59, 307–321. [Google Scholar] [CrossRef]
- Zhang, J.; Kapli, P.; Pavlidis, P.; Stamatakis, A. A General Species Delimitation Method with Applications to Phylogenetic Placements. Bioinformatics 2013, 29, 2869–2876. [Google Scholar] [CrossRef]
- Bouckaert, R.; Drummond, A. bModelTest: Bayesian Phylogenetic Site Model Averaging and Model Comparison. BMC Evol. Biol. 2017, 17, 42. [Google Scholar] [CrossRef]
- Bouckaert, R.; Vaughan, T.G.; Barido-Sottani, J.; Duchêne, S.; Fourment, M. BEAST 2.5: An Advanced Software Platform for Bayesian Evolutionary Analysis. PLoS Comput. Biol. 2019, 15, e1006650. [Google Scholar] [CrossRef]
- Rambaut, A.; Drummond, A.J.; Xie, D.; Baele, G.; Suchard, M.A. Posterior Summarisation in Bayesian Phylogenetics Using Tracer 1.7. Syst. Biol. 2018, 67, 901–904. [Google Scholar] [CrossRef] [PubMed]
- Rambaut, A. FigTree, version 1.4.4; Institute of Evolutionary Biology, University of Edinburgh: Edinburgh, UK, 2018. Available online: https://github.com/rambaut/figtree (accessed on 1 January 2024).
- Pakrashi, A.; Kumar, V.; Stanford-Beale, D.A.; Cameron, S.L.; Tyagi, K. Gene Arrangement, Phylogeny and Divergence Time Estimation of Mitogenomes in Thrips. Mol. Biol. Rep. 2022, 49, 6269–6283. [Google Scholar] [CrossRef]
- Ghosh, A.; Jangra, S.; Dietzgen, R.G.; Yeh, W.B. Frontiers Approaches to the Diagnosis of Thrips (Thysanoptera): How Effective Are the Molecular and Electronic Detection Platforms? Insects 2021, 12, 920. [Google Scholar] [CrossRef]
- Sukumaran, J.; Knowles, L.L. Multispecies Coalescent Delimits Structure, Not Species. Proc. Natl. Acad. Sci. USA 2017, 114, 1607–1612. [Google Scholar] [CrossRef]
- Dang, L.H.; Mound, L.A.; Qiao, G.X. Conspectus of the Phlaeothripinae Genera from China and Southeast Asia (Thysanoptera, Phlaeothripidae). Zootaxa 2014, 3807, 1–82. [Google Scholar] [CrossRef]
- Mound, L.A.; Minaei, K. Australian Thrips of the Haplothrips Lineage (Insecta: Thysanoptera). J. Nat. Hist. 2007, 41, 2919–2978. [Google Scholar] [CrossRef]


| Code | Species | Mreads | >=Q30(%) | Family | Sex | Seed Sequence | 28S Reference | 18S Reference | NOVOPlasty | MITOS2 | 28S | 18S |
|---|---|---|---|---|---|---|---|---|---|---|---|---|
| AW7T | Rhipidothrips brunneus | 53.81 | 90.90 | Ae. | Female | SETHY150-22 | KC513027 | KC512922 | OK | Inc. | OK | OK |
| AW6T | Rhipidothrips brunneus | 44.62 | 91.70 | Ae. | Female | SETHY149-22 | KC513027 | KC512922 | OK | Inc. | OK | OK |
| AT9T | Acanthothrips nodicornis | 63.01 | 90.79 | Ph. | Female | SETHY125-22 | KC5131161 | KC513016 | OK | Inc. | OK | OK |
| AU1T | Acanthothrips nodicornis | 96.05 | 91.61 | Ph. | Male | SETHY126-22 | KC5131161 | KC513016 | - | - | OK | OK |
| AT8T | Acanthothrips nodicornis | 61.06 | 90.87 | Ph. | Female | SETHY124-22 | KC5131161 | KC513016 | OK | Inc. | OK | OK |
| AQ1T | Bolothrips dentipes | 377.04 | 88.94 | Ph. | Male | BIOUG13498-F12 | KC513078 | KC512977 | OK | Inc. | OK | OK |
| AW3T | Cephalothrips monilicornis | 56.83 | 91.57 | Ph. | Female | SETHY146-22 | KC513067 | KC512966 | OK | Inc. | OK | OK |
| AW4T | Cephalothrips monilicornis | 50.83 | 91.65 | Ph. | Female | SETHY147-22 | KC513067 | KC512966 | OK | Inc. | OK | OK |
| AW5T | Cephalothrips monilicornis | 51.00 | 91.98 | Ph. | Female | SETHY148-22 | KC513073 | KC512973 | OK | Inc. | OK | OK |
| AY3T | Cephalothrips monilicornis | 18.29 | 91.52 | Ph. | Female | SETHY161-22 | KC513067 | KC512966 | OK | Inc. | OK | OK |
| AV1T | Cephalothrips monilicornis | 52.28 | 92.08 | Ph. | Female | SETHY135-22 | KC513067 | KC512966 | - | - | OK | OK |
| AS7T | Cephalothrips monilicornis | 103.85 | 89.33 | Ph. | Female | SETHY114-22 | KC513073 | KC512973 | OK | Inc. | OK | Ok |
| AY4T | Haplothrips hukkineni | 14.25 | 92.53 | Ph. | Female | SETHY162-22 | KC513067 | KC512966 | OK | Inc. | Ok | OK |
| AV5T | Haplothrips leucanthemi | 14.85 | 93.22 | Ph. | Female | SETHY139-22 | KC513067 | KC512966 | OK | OK | Ok | OK |
| AR5T | Haplothrips leucanthemi | 71.80 | 90.41 | Ph. | Male | SETHY107-22 | KC513067 | KC512966 | - | - | OK | OK |
| AR6T | Haplothrips leucanthemi | 108.21 | 90.21 | Ph. | Male | SETHY108-22 | KC513067 | KC512966 | - | - | OK | OK |
| AR7T | Haplothrips leucanthemi | 187.55 | 90.37 | Ph. | Female | SETHY109-22 | KC513067 | KC512966 | - | - | OK | OK |
| AT7T | Haplothrips leucanthemi | 108.15 | 89.09 | Ph. | Female | SETHY123-22 | KC513067 | KC512966 | - | - | OK | OK |
| AV4T | Haplothrips leucanthemi | 59.96 | 92.55 | Ph. | Female | SETHY138-22 | KC513067 | KC512966 | OK | OK | OK | OK |
| AY1T | Haplothrips statices | 7.38 | 91.92 | Ph. | Female | SETHY159-22 | KC513067 | KC512966 | OK | Inc. | Ok | OK |
| AY2T | Haplothrips statices | 10.71 | 92.22 | Ph. | Female | SETHY160-22 | KC513067 | KC512966 | OK | Inc. | OK | OK |
| AT1T | Haplothrips statices | 107.64 | 89.43 | Ph. | Female | SETHY117-22 | KC513067 | KC512966 | - | - | OK | OK |
| AT2T | Haplothrips statices | 120.22 | 89.71 | Ph. | Female | SETHY118-22 | KC513067 | KC512966 | OK | Inc. | OK | OK |
| AU5T | Haplothrips subtilissimus | 20.25 | 92.35 | Ph. | Female | SETHY130-22 | KC513067 | KC512966 | OK | Inc. | OK | OK |
| AU7T | Haplothrips subtilissimus | 36.14 | 92.56 | Ph. | Female | SETHY132-22 | KC513067 | KC512966 | OK | Inc. | OK | OK |
| AW2T | Haplothrips subtilissimus | 56.51 | 92.16 | Ph. | Female | SETHY145-22 | KC513067 | KC512966 | OK | Inc. | OK | OK |
| AX2T | Haplothrips subtilissimus | 45.36 | 91.92 | Ph. | Female | SETHY153-22 | KC513067 | KC512966 | OK | Inc. | Ok | OK |
| AX3T | Haplothrips subtilissimus | 53.14 | 91.28 | Ph. | Female | SETHY154-22 | KC513067 | KC512966 | OK | Inc. | OK | OK |
| AX4T | Haplothrips subtilissimus | 46.23 | 91.67 | Ph. | Male | SETHY155-22 | KC513067 | KC512966 | Ok | Inc. | OK | OK |
| AU6T | Haplothrips subtilissimus | 18.35 | 92.70 | Ph. | Female | SETHY131-22 | KC513067 | KC512966 | OK | Inc. | OK | - |
| AW8T | Haplothrips subtilissimus | 59.33 | 91.47 | Ph. | Female | SETHY151-22 | KC513067 | KC512966 | - | - | OK | Ok |
| AU3T | Haplothrips subtilissimus | 50.24 | 92.55 | Ph. | Male | SETHY128-22 | KC513067 | KC512966 | Ok | Inc. | OK | OK |
| AP8T | Haplothrips utae | 184.89 | 88.84 | Ph. | Male | SETHY094-22 | KC513067 | KC512966 | OK | OK | OK | OK |
| AY5T | Haplothrips utae | 27.51 | 91.54 | Ph. | Female | SETHY163-22 | KC513067 | KC512966 | - | - | OK | OK |
| AP6T | Haplothrips utae | 139.02 | 88.30 | Ph. | Female | SETHY092-22 | KC513067 | KC512966 | OK | OK | OK | OK |
| AU2T | Hoplothrips corticis | 79.79 | 92.79 | Ph. | Female | SETHY127-22 | KC513073 | KC512973 | - | - | OK | OK |
| AW9T | Hoplothrips longisetis | 60.81 | 92.50 | Ph. | Male | SETHY152-22 | KC513073 | KC512973 | OK | Inc. | OK | OK |
| AU4T | Hoplothrips longisetis | 44.53 | 93.27 | Ph. | Female | SETHY129-22 | KC513073 | KC512973 | - | - | Ok | OK |
| AV8T | Hoplothrips pedicularius | 1008.12 | 92.67 | Ph. | Female | SETHY142-22 | KC513073 | KC512973 | - | - | OK | OK |
| AT5T | Hoplothrips semicaecus | 135.53 | 90.10 | Ph. | Male | SETHY121-22 | KC513073 | KC512973 | - | - | OK | OK |
| AT4T | Hoplothrips semicaecus | 117.02 | 89.60 | Ph. | Female | SETHY120-22 | KC513073 | KC512973 | - | - | OK | OK |
| AS4T | Xylaplothrips fuliginosus | 223.99 | 89.77 | Ph. | Female | SETHY111-22 | KC513067 | KC512966 | - | - | OK | OK |
| AS5T | Xylaplothrips fuliginosus | 114.24 | 89.34 | Ph. | Female | SETHY112-22 | KC513067 | KC512966 | - | - | OK | OK |
| AU9T | Xylaplothrips fuliginosus | 43.20 | 92.02 | Ph. | Male | SETHY134-22 | KC513067 | KC512966 | - | - | OK | OK |
| AV2T | Xylaplothrips fuliginosus | 54.67 | 92.63 | Ph. | Female | SETHY136-22 | KC513067 | KC512966 | OK | OK | OK | OK |
| AS3T | Chirothrips manicatus | 70.73 | 92.45 | Th. | Female | SETHY110-22 | KC513044 | KC512943 | - | - | OK | OK |
| AQ8T | Thrips major | 51.89 | 92.89 | Th. | Female | SETHY101-22 | KC513123 | KC513023 | - | - | OK | OK |
| AU8T | Thrips minutissimus | 4.26 | 92.45 | Th. | Female | SETHY133-22 | KC513123 | KC513023 | - | - | OK | OK |
| AR3T | Thrips trehernei | 47.42 | 92.34 | Th. | Male | SETHY105-22 | KC513123 | KC513023 | - | - | Ok | OK |
| AS2T | Tmetothrips subapterus | 71.90 | 91.01 | Th. | Female | SETHY101-22 | KC513123 | KC513023 | OK | Inc. | OK | OK |
| Code | Species | 28S | ATP6 | COB | COX1 | COX1 658 | COX1 313 | COX2 | NAD4 | NAD5 | Mit. Conc. | All. Concat. |
|---|---|---|---|---|---|---|---|---|---|---|---|---|
| MZ645927 | Acaciothrips ebneri | - | + (13) | + (8) | + (14) | + (1) | + (11) | + (1) | + (5) | + (13) | + (10) | + (9) |
| AT8T | Acanthothrips nodicornis | + (20) | + (16) | + (18) | + (1) | + (1) | + (24) | + (1) | + (20) | + (27) | + (8) | + (27) |
| AT9T | Acanthothrips nodicornis | + (20) | + (16) | + (19) | + (1) | + (1) | + (25) | + (1) | + (21) | + (28) | + (8) | + (27) |
| AU1T | Acanthothrips nodicornis | + (20) | - | - | - | - | - | - | - | - | - | + (27) |
| MW233591 | Bactrothrips quadrituberculatus | - | + (19) | + (4) | + (12) | + (1) | + (2) | + (1) | + (7) | + (26) | + (4) | + (3) |
| AQ1T | Bolothrips dentipes | + (15) | + (18) | + (3) | + (11) | + (1) | + (2) | + (1) | + (6) | + (26) | + (3) | + (29) |
| KC513043 | Cartomothrips browni | + (10) | - | - | - | - | - | - | - | - | - | + (10) |
| AS7T | Cephalothrips monilicornis | + (7) | + (25) | + (6) | + (7) | + (1) | + (12) | + (1) | + (18) | + (24) | + (6) | + (41) |
| AV1T | Cephalothrips monilicornis | + (6) | - | - | - | - | - | - | - | - | - | + (42) |
| AW3T | Cephalothrips monilicornis | + (6) | + (15) | + (6) | + (7) | + (1) | + (27) | + (1) | + (14) | + (14) | + (6) | + (42) |
| AW4T | Cephalothrips monilicornis | + (6) | + (25) | + (6) | + (7) | + (1) | + (14) | + (1) | + (19) | + (25) | + (6) | + (44) |
| AW5T | Cephalothrips monilicornis | + (7) | + (26) | + (6) | + (7) | + (1) | + (26) | + (1) | + (18) | + (18) | + (6) | + (41) |
| AY3T | Cephalothrips monilicornis | + (6) | + (14) | + (6) | + (7) | + (1) | + (28) | + (1) | + (15) | + (15) | + (6) | + (43) |
| AS3T | Chirothrips manicatus | + (1) | - | - | - | - | - | - | - | - | - | + (4) |
| KC513047 | Cryptothrips amneiu | + (16) | - | - | - | - | - | - | - | - | - | + (22) |
| KC513053 | Dyothrips pallescens | + (6) | - | - | - | - | - | - | - | - | - | + (16) |
| KC513064 | Gynaikothrips ficorum | + (12) | - | - | - | - | - | - | - | - | - | + (17) |
| MK940484 | Gynaikothrips uzeli | - | + (12) | + (7) | + (13) | + (1) | + (19) | + (1) | + (4) | + (12) | + (9) | + (8) |
| KP198620 | Haplothrips aculeatus | - | + (5) | + (13) | + (4) | + (1) | + (4) | + (1) | + (13) | + (5) | + (14) | + (15) |
| KC513065 | Haplothrips froggatti | + (6) | - | - | - | - | - | - | - | - | - | + (25) |
| KC513066 | Haplothrips graminis | + (6) | - | - | - | - | - | - | - | - | - | + (37) |
| AY4T | Haplothrips hukkineni | + (6) | + (2) | + (11) | + (10) | + (1) | + (9) | + (1) | + (1) | + (22) | + (12) | + (13) |
| AR5T | Haplothrips leucanthemi | + (6) | - | - | - | - | - | - | - | - | - | + (21) |
| AR6T | Haplothrips leucanthemi | + (6) | - | - | - | - | - | - | - | - | - | + (21) |
| AR7T | Haplothrips leucanthemi | + (6) | - | - | - | - | - | - | - | - | - | + (21) |
| AT7T | Haplothrips leucanthemi | + (6) | - | - | - | - | - | - | - | - | - | + (21) |
| AV4T | Haplothrips leucanthemi | + (6) | + (22) | + (15) | + (16) | + (1) | + (15) | + (1) | + (3) | + (4) | + (17) | + (21) |
| AV5T | Haplothrips leucanthemi | + (6) | + (23) | + (15) | + (17) | + (1) | + (16) | + (1) | + (3) | + (4) | + (18) | + (21) |
| KC513067 | Haplothrips leucanthemi | + (6) | - | - | - | - | - | - | - | - | - | + (21) |
| AT1T | Haplothrips statices | + (6) | - | - | - | - | - | - | - | - | - | + (21) |
| AT2T | Haplothrips statices | + (6) | + (26) | + (14) | + (18) | + (1) | + (22) | + (1) | + (3) | + (20) | + (16) | + (21) |
| AY1T | Haplothrips statices | + (6) | + (27) | + (14) | + (15) | + (1) | + (23) | + (1) | + (3) | + (19) | + (16) | + (21) |
| AY2T | Haplothrips statices | + (6) | + (26) | + (14) | + (19) | + (1) | + (22) | + (1) | + (3) | + (21) | + (16) | + (21) |
| AU3T | Haplothrips subtilissimus | + (6) | + (20) | + (12) | + (3) | + (1) | + (17) | + (1) | + (12) | + (16) | + (13) | + (24) |
| AU5T | Haplothrips subtilissimus | + (6) | + (6) | + (12) | + (3) | + (1) | + (5) | + (1) | + (12) | + (7) | + (13) | + (24) |
| AU6T | Haplothrips subtilissimus | + (6) | + (21) | + (12) | + (3) | + (1) | + (7) | + (1) | + (12) | + (8) | + (13) | + (24) |
| AU7T | Haplothrips subtilissimus | + (6) | + (7) | + (12) | + (3) | + (1) | + (18) | + (1) | + (12) | + (10) | + (13) | + (24) |
| AW2T | Haplothrips subtilissimus | + (6) | + (9) | + (12) | + (3) | + (1) | + (8) | + (1) | + (12) | + (17) | + (13) | + (24) |
| AW8T | Haplothrips subtilissimus | + (6) | - | - | - | - | - | - | - | - | - | + (24) |
| AX2T | Haplothrips subtilissimus | + (6) | + (8) | + (12) | + (3) | + (1) | + (6) | + (1) | + (12) | + (11) | + (13) | + (24) |
| AX3T | Haplothrips subtilissimus | + (6) | + (20) | + (12) | + (3) | + (1) | + (13) | + (1) | + (12) | + (6) | + (13) | + (24) |
| AX4T | Haplothrips subtilissimus | + (6) | - | - | - | - | - | - | - | - | - | + (24) |
| AP6T | Haplothrips utae | + (6) | + (10) | + (16) | + (20) | + (1) | + (10) | + (1) | + (16) | + (23) | + (15) | + (46) |
| AP8T | Haplothrips utae | + (6) | + (11) | + (17) | + (21) | + (1) | + (10) | + (1) | + (17) | + (23) | + (15) | + (46) |
| AY5T | Haplothrips utae | + (6) | - | - | - | - | - | - | - | - | - | + (45) |
| KC513068 | Haplothrips victoriensis | + (6) | - | - | - | - | - | - | - | - | - | + (26) |
| KC513073 | Holothrips cracens | + (7) | - | - | - | - | - | - | - | - | - | + (34) |
| KC513116 | Hoplandrothrips quadriconus | + (21) | - | - | - | - | - | - | - | - | - | + (28) |
| AU4T | Hoplothrips longisetis | + (7) | - | - | - | - | - | - | - | - | - | + (35) |
| AW9T | Hoplothrips longisetis | + (7) | + (17) | + (10) | + (5) | + (1) | + (21) | + (1) | + (8) | + (2) | + (7) | + (36) |
| AV8T | Hoplothrips pedicularius | + (7) | - | - | - | - | - | - | - | - | - | + (32) |
| AT4T | Hoplothrips semicaecus | + (7) | - | - | - | - | - | - | - | - | - | + (33) |
| AT5T | Hoplothrips semicaecus | + (7) | - | - | - | - | - | - | - | - | - | + (31) |
| KC513078 | Idolothrips spectrum | + (15) | - | - | - | - | - | - | - | - | - | + (30) |
| KC513079 | Kladothrips antennatus | + (9) | - | - | - | - | - | - | - | - | - | + (12) |
| KC513080 | Leeuwenia scolopiae | + (13) | - | - | - | - | - | - | - | - | - | + (18) |
| KC513081 | Leptothrips mali | + (6) | - | - | - | - | - | - | - | - | - | + (38) |
| KC513045 | Liothrips reuteri | + (3) | - | - | - | - | - | - | - | - | - | + (1) |
| KC513084 | Macrothrips papuensis | + (17) | - | - | - | - | - | - | - | - | - | + (23) |
| KC513095 | Phaulothrips kranzae | + (4) | - | - | - | - | - | - | - | - | - | + (2) |
| MW793907 | Psephenothrips eriobotryae | - | + (4) | + (5) | + (6) | + (1) | + (20) | + (1) | + (9) | + (9) | + (5) | + (7) |
| AW6T | Rhipidothrips brunneus | + (2) | + (1) | + (2) | + (9) | + (4) | + (1) | + (3) | + (11) | + (1) | + (2) | + (5) |
| AW7T | Rhipidothrips brunneus | + (2) | + (1) | + (2) | + (9) | + (2) | + (1) | + (3) | + (11) | + (1) | + (2) | + (5) |
| KC513102 | Sacothrips catheter | + (14) | - | - | - | - | - | - | - | - | - | + (19 |
| KC513106 | Scopaeothrips bicolor | + (6) | - | - | - | - | - | - | - | - | - | + (14) |
| KC513111 | Strepterothrips tuberculatus | + (5) | - | - | - | - | - | - | - | - | - | + (6) |
| KC513114 | Teuchothrips ater | + (8) | - | - | - | - | - | - | - | - | - | + (39) |
| KC513115 | Teuchothrips disjunctus | + (8) | - | - | - | - | - | - | - | - | - | + (40) |
| AQ8T | Thrips major | + (18) | - | - | - | - | - | - | - | - | - | + (20) |
| AU8T | Thrips minutissimus | + (19) | - | - | - | - | - | - | - | - | - | + (47) |
| AR3T | Thrips trehernei | + (19) | - | - | - | - | - | - | - | - | - | + (49) |
| AS2T | Tmetothrips subapterus | + (19) | + (1) | + (1) | + (8) | + (3) | + (1) | + (2) | + (10) | + (1) | + (1) | + (50) |
| KC513125 | Treherniella amplipennis | + (11) | - | - | - | - | - | - | - | - | - | + (11) |
| AS4T | Xylaplothrips fuliginosus | + (6) | - | - | - | - | - | - | - | - | - | + (48) |
| AS5T | Xylaplothrips fuliginosus | + (6) | - | - | - | - | - | - | - | - | - | + (52) |
| AU9T | Xylaplothrips fuliginosus | + (6) | - | - | - | - | - | - | - | - | - | + (51) |
| AV2T | Xylaplothrips fuliginosus | + (6) | + (3) | + (9) | + (2) | + (1) | + (3) | + (1) | + (1) | + (3) | + (11) | + (53) |
| Species total: | 20 | 27 | 19 | 21 | 4 | 28 | 3 | 21 | 28 | 18 | 53 |
| Gene | Specimens | Length | GC% | Pairwise Identity | Length After BMGE |
|---|---|---|---|---|---|
| 28S | 72 | 3120 | 60.5% | 80.8% | 2296 |
| ATP6 | 33 | 705 | 19.3% | 75.7% | 674 |
| COB | 33 | 1224 | 22.5% | 79.2% | 1140 |
| COX1 | 33 | 1647 | 25.5% | 82.2% | 1500 |
| COX1 (HCO+LCO) | 33 | 658 | 26.8% | 83.8% | 658 |
| COX1 (BF1+BR2) | 33 | 313 | 27.2% | 82.1% | 313 |
| COX2 | 33 | 771 | 20.8% | 79.2% | 630 |
| NAD4 | 33 | 1429 | 17.9% | 75.9% | 1315 |
| NAD5 | 33 | 1836 | 17.7% | 75.5% | 1644 |
| Concatenated excl. 28S | 33 | 7612 | 20.8% | 33.9% | 7059 |
| Concatenated incl. 28S | 77 | 10,732 | 37.0% | 43.9% | 9355 |
| 18S | 77 | 2113 | 52.8% | 93.9% | 1915 |
| ATP8 | 32 | 257 | 15.4% | 61.9% | 86 |
| COX3 | 31 | 792 | 23.5% | 84.0% | 777 |
| NAD1 | 32 | 987 | 20.6% | 78.7% | 885 |
| NAD2 | 30 | 1150 | 15.0% | 73.9% | 881 |
| NAD3 | 31 | 417 | 16.9% | 80.5% | 330 |
| NAD4L | 32 | 299 | 15.4% | 79.4% | 255 |
| NAD6 | 32 | 657 | 13.8% | 70.1% | 446 |
| rrnL | 29 | 1380 | 21.3% | 77.5% | 595 |
| rrnS | 25 | 833 | 17.1% | 76.4% | 645 |
| trnA | 31 | 79 | 19.7% | 80.8% | 54 |
| trnC | 28 | 76 | 14.2% | 79.3% | 58 |
| trnD | 30 | 77 | 16.8% | 84.6% | 53 |
| trnE | 30 | 72 | 8.9% | 86.4% | 66 |
| trnF | 29 | 71 | 11.4% | 82.2% | 68 |
| trnG | 30 | 83 | 10.3% | 86.1% | 64 |
| trnH | 29 | 87 | 12.1% | 83.1% | 60 |
| trnI | 28 | 76 | 22.5% | 78.9% | 57 |
| trnK | 28 | 78 | 15.7% | 85.2% | 59 |
| trnL1 | 27 | 72 | 16.9% | 75.2% | 68 |
| trnL2 | 28 | 69 | 16.8% | 83.7% | 67 |
| trnM | 30 | 72 | 26.4% | 82.7% | 62 |
| trnN | 30 | 78 | 18.0% | 87.6% | 64 |
| trnP | 24 | 78 | 16.9% | 82.0% | 55 |
| trnQ | 25 | 76 | 16.0% | 78.7% | 61 |
| trnR | 30 | 81 | 22.4% | 77.2% | 60 |
| trnS1 | 29 | 69 | 19.1% | 74.9% | 46 |
| trnS2 | 28 | 81 | 10.4% | 85.4% | 66 |
| trnT | 29 | 71 | 9.0% | 84.4% | 62 |
| trnV | 29 | 85 | 13.2% | 82.2% | 49 |
| trnW | 29 | 85 | 14.0% | 82.6% | 62 |
| trnY | 30 | 74 | 19.4% | 79.4% | 64 |
| Supermatrix | 82 | 40,622 | 35.3% | 52.8% | 17,339 |
Disclaimer/Publisher’s Note: The statements, opinions and data contained in all publications are solely those of the individual author(s) and contributor(s) and not of MDPI and/or the editor(s). MDPI and/or the editor(s) disclaim responsibility for any injury to people or property resulting from any ideas, methods, instructions or products referred to in the content. |
© 2025 by the author. Licensee MDPI, Basel, Switzerland. This article is an open access article distributed under the terms and conditions of the Creative Commons Attribution (CC BY) license (https://creativecommons.org/licenses/by/4.0/).
Share and Cite
Wahlberg, E. Genome Skimming of Thysanoptera (Arthropoda, Insecta) and Its Taxonomic and Systematic Applications. Diversity 2025, 17, 226. https://doi.org/10.3390/d17040226
Wahlberg E. Genome Skimming of Thysanoptera (Arthropoda, Insecta) and Its Taxonomic and Systematic Applications. Diversity. 2025; 17(4):226. https://doi.org/10.3390/d17040226
Chicago/Turabian StyleWahlberg, Emma. 2025. "Genome Skimming of Thysanoptera (Arthropoda, Insecta) and Its Taxonomic and Systematic Applications" Diversity 17, no. 4: 226. https://doi.org/10.3390/d17040226
APA StyleWahlberg, E. (2025). Genome Skimming of Thysanoptera (Arthropoda, Insecta) and Its Taxonomic and Systematic Applications. Diversity, 17(4), 226. https://doi.org/10.3390/d17040226