Article

Carbon Stock Estimation and Human Disturbance in Selected Urban Un-Conserved Forests in Entoto Mountain Forest, Addis Ababa, Ethiopia

by
Lemlem Wondwossen Solomon
1,
Noppol Arunrat
1,*,
Thamarat Phutthai
1,
Worachart Wisawapipat
2,
Sukanya Sereenonchai
1 and
Ryusuke Hatano
3
1
Faculty of Environment and Resource Studies, Mahidol University, Nakhon Pathom 73170, Thailand
2
Soil Chemistry and Biogeochemistry Group, Department of Soil Science, Faculty of Agriculture, Kasetsart University, Bangkok 10900, Thailand
3
Laboratory of Soil Science, Research Faculty of Agriculture, Hokkaido University, Sapporo 060-8589, Japan
*
Author to whom correspondence should be addressed.
Diversity 2025, 17(4), 225; https://doi.org/10.3390/d17040225
Submission received: 15 February 2025 / Revised: 15 March 2025 / Accepted: 20 March 2025 / Published: 24 March 2025

Abstract

:
Urban forests are crucial for biodiversity and climate resilience. This study investigated the impact of human disturbances on carbon (C) stocks in un-conserved forests of Entoto Mountain, Addis Ababa, Ethiopia, focusing on forest structure: important value index (IVI), species diversity (H’), regeneration pattern status, and C storage in aboveground biomass (AGB), belowground biomass (BGB), litter biomass (LB), and soil. Field data were collected from 35 quadrats across two altitudes, and human disturbances were observed, including firewood collection, tree cutting, soil excavation, and road and infrastructure inside the sample plot. Results indicate low species diversity dominated by Eucalyptus globulus Labill and Juniperus procera Hoechst. Ex Endl., with fair regeneration. Higher altitudes showed greater measured C stock (572.62 tC ha−1) than lower altitudes (495.03 tC ha−1), attributed to larger trees. C values in the upper altitude for AGB, BGB, LB, and soil (0–30 cm) were higher than at lower altitudes. The IVI showed a significant positive correlation with C in aboveground biomass, C in belowground biomass, and total C stock, whereas H’ also showed a significant (p < 0.05) positive correlation with the total number of trees. It is concluded that forest structures contribute to the C stock of this area. Given the importance of the un-conserved Entoto Mountain forest, it is recommended to prioritize the conservation of old-growth forest species in the area, as they demonstrate the highest capacity for C accumulation.

1. Introduction

Forests provide critical ecological, economic, and sociological benefits, serving as major reservoirs of carbon (C) and playing a pivotal role in climate change mitigation [1,2]. Globally, forests cover approximately 30% of Earth’s land area and contain 19% of global biomass C [3], with an estimated total forest C stock of 861 ± 66 Pg C. This is distributed across soil organic carbon (44%), above- and belowground biomass (42%), deadwood (8%), and litter (5%). Tropical forests contribute 55% of this C stock, followed by boreal (32%) and temperate forests (13%), highlighting their significant role in the global carbon cycle [4].
Anthropogenic activities, including deforestation, grazing, and urbanization, significantly impact forest carbon dynamics, as highlighted by recent studies on land-use change and its contribution to global carbon emissions [5,6]. For example, in the Indian Himalayan Region (IHR), forests store an estimated 2.6 megatons of C, yet 30% of the forest area is degraded due to fuelwood collection, grazing, and developmental activities [7]. Similar trends are observed in Ethiopia, where urban expansion and agricultural conversion have resulted in substantial deforestation and degradation. In Addis Ababa, deforestation has led to a 16.66% reduction in forest cover between 1986 and 2019, impacting carbon sequestration potential and exacerbating climate change challenges [8].
Forest soil acts as a key carbon sink, with soil organic carbon constituting a significant proportion of total ecosystem C stocks [9]. Studies in African tropical forests reveal that up to 70% of total C stocks are stored in soil, emphasizing the importance of soil conservation for maintaining ecosystem function [10]. In the Ethiopian Highlands, sustainable forest management practices, such as community-managed natural forests, have shown promise in enhancing C stocks and biodiversity [11].
Urban forests, while often overlooked, provide significant C sequestration benefits, with recent studies emphasizing their role in mitigating urban heat islands and improving air quality [12,13]. Urbanization, however, poses a threat to these ecosystems. For instance, urban forests in Ethiopia face degradation due to firewood collection and urban expansion, leading to increased C emissions and loss of biodiversity [14]. Effective management strategies, including afforestation and agroforestry systems, are essential for enhancing carbon sequestration in these landscapes.
The Entoto Mountain forest, a key urban forest in Addis Ababa, represents a critical ecosystem for studying the interplay between urbanization, biodiversity, and C storage. However, there is limited data on how human activities influence its C stock potential. Most existing studies in Ethiopia have focused on protected urban forest areas [15], leaving a gap in understanding the dynamics of urban forests.
Three hypotheses were proposed as follows: (1) the variety, structure, and regeneration patterns of woody species in the Entoto Mountain forest are negatively affected by human activities, leading to reduced species diversity, simplified structural complexity, and poor regeneration patterns. These characteristics are expected to vary with environmental conditions across different altitudes and the intensity of human disturbance; (2) the forest’s C stock potential is higher at higher altitudes due to denser forest cover and reduced human interference, which are expected to enhance the forest’s capacity for carbon sequestration; and (3) human activities, such as deforestation and land conversion, are negatively affecting the forest’s C stock potential, resulting in lower C stocks in areas with more intense human disturbance. These hypotheses were tested by examining species diversity, structural attributes, regeneration patterns, and carbon stock estimations across varying altitudes and levels of human impact.

2. Materials and Methods

2.1. Study Area Description

The Entoto Mountain range in Ethiopia, north of Addis Ababa, is home to the highest elevation, Mount Entoto, reaching 3200 m. The mountain range is part of the Ethiopian highlands, a vast expanse of mountain ranges and plateaus. The Afromontane forest ecosystem, characterized by a diverse array of flora and fauna, is found within the range. The minimum elevation is around 2500 m, where it intersects with adjacent plains. The study locations are within the administrative boundaries of Addis Ababa city, covering approximately 400.30 hectares. The location is identified by its geographical coordinates, specifically between latitudes of 9°04′42.21″ N and longitudes of 38°45′33.15″ E (Figure 1).

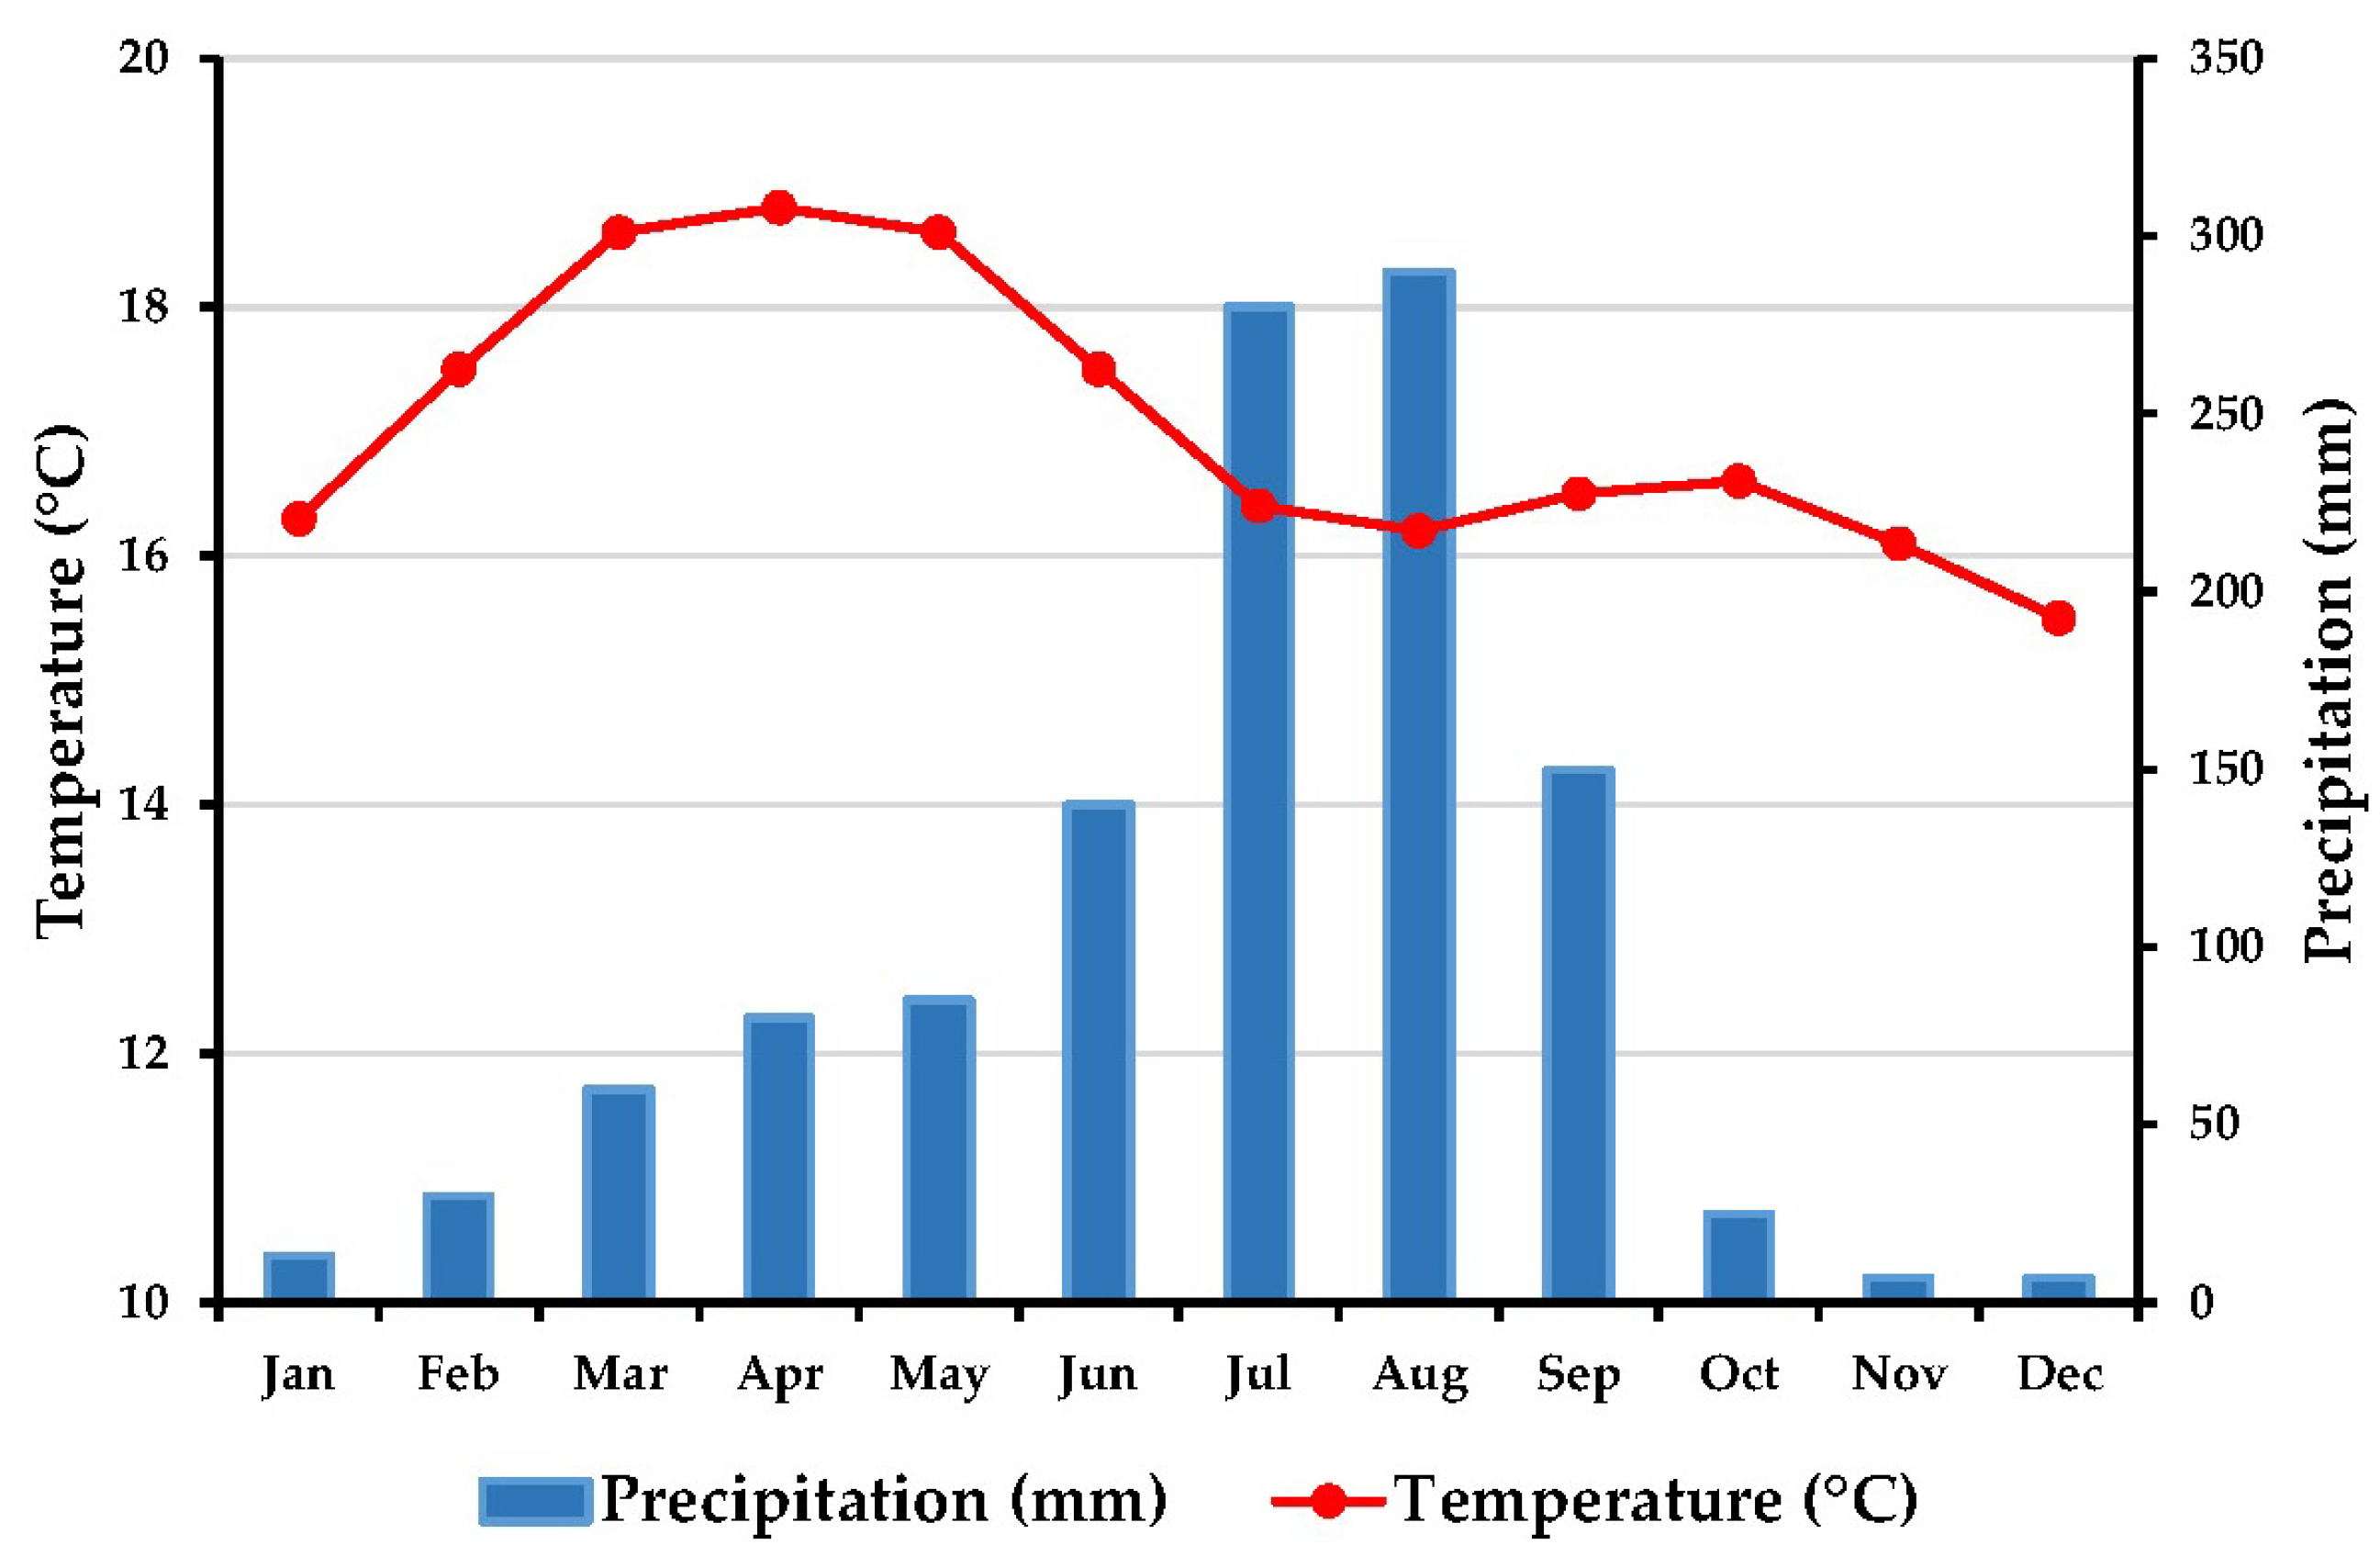
2.2. Climate of Study Area

Temperature and rainfall data from Alemu and Dioha [16] for the years 1991–2020 show that the average annual precipitation in the area is around 1165 mm. The region’s monthly precipitation records show that the area receives the most rainfall from June to September. The region’s prevalent weather conditions are commonly described as the rainy season. Minimal precipitation is recorded from October to April. The average yearly temperature in the area is 17 °C. The highest and lowest average yearly temperatures in the area over the past ten years were 17 °C and 11 °C, respectively (Figure 2).

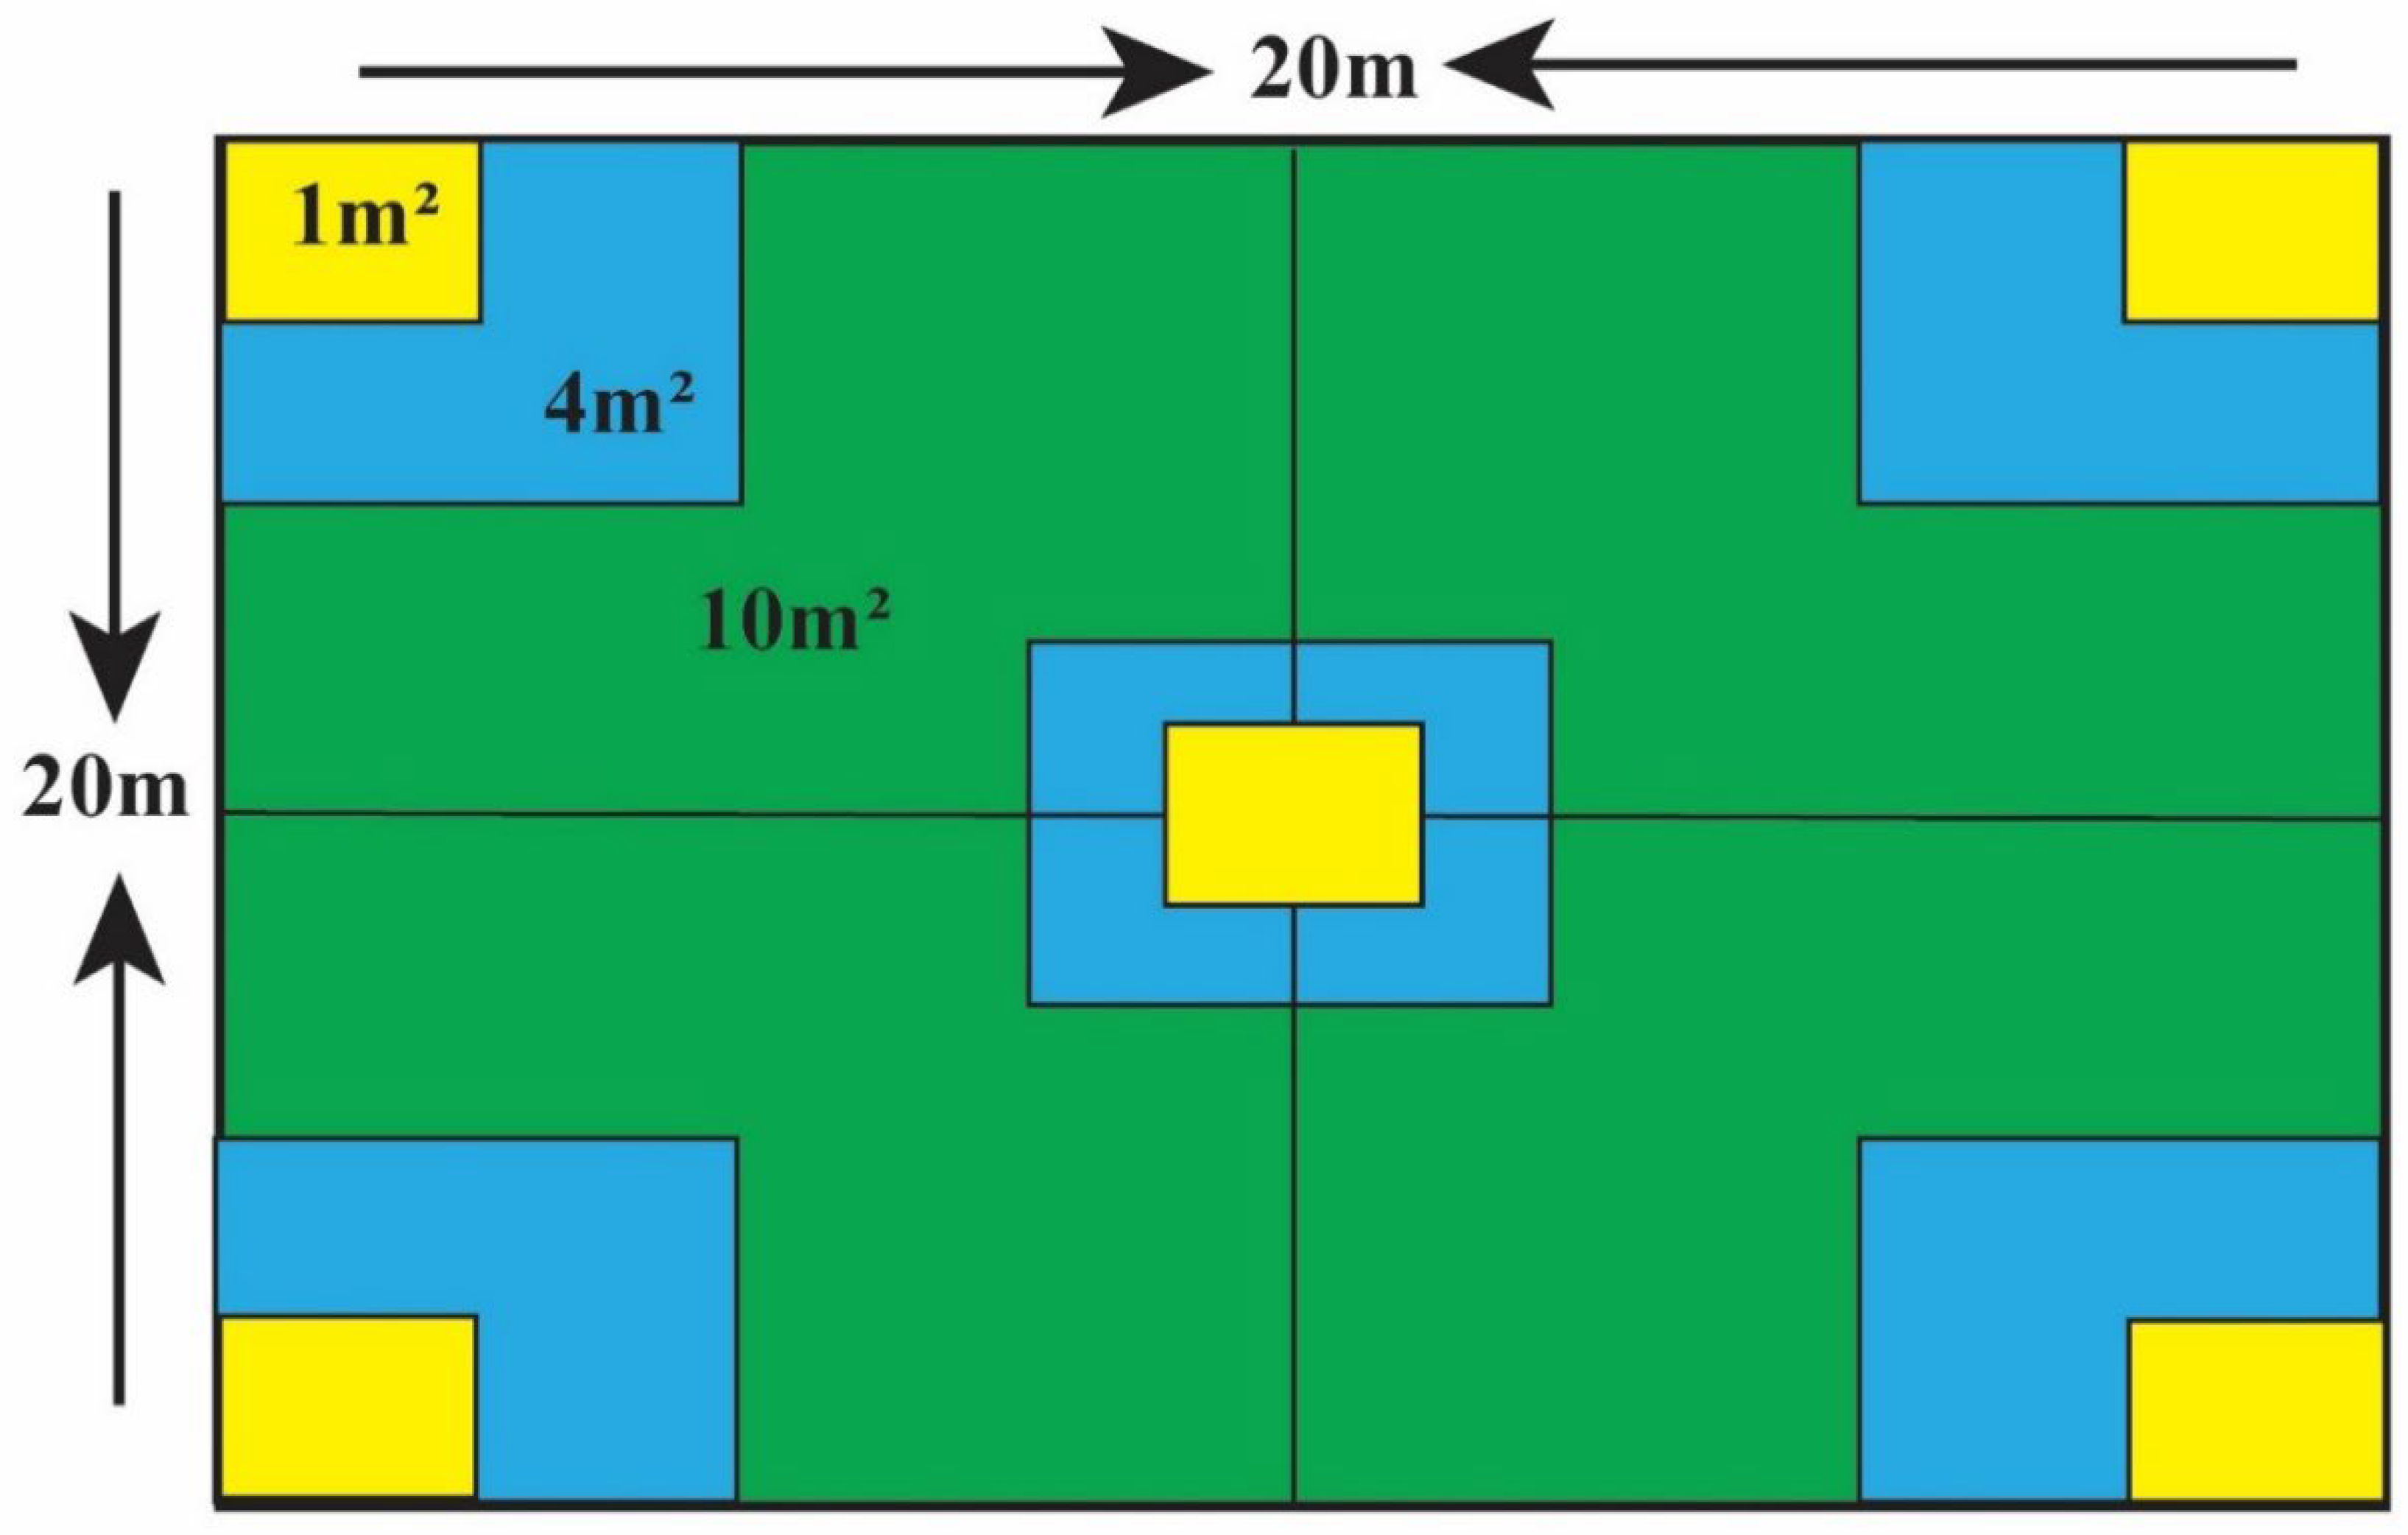
2.3. Sampling Design

To investigate the study area effectively, simple random sampling was implemented, with plots established at 100 m intervals using a measuring tape, GPS, and compass. Each main plot measured 20 m × 20 m, with smaller sub-sampling units of 4 m × 4 m and 1 m × 1 m used to gather detailed data on saplings, seedlings, falling litter, and soil (Figure 3). A total of 35 plots were surveyed, covering 1.4 hectares. A species accumulation curve (SAC) was generated to illustrate the relationship between the number of plots and the plant species observed, confirming that the sampling effort was sufficient. However, the rate of newly added species decreases with increasing sampling plot after taking 35 plots.
The study area was stratified into two altitude-based zones, lower (2137–2686 m a.s.l) and higher (2690–2739 m a.s.l) altitudes, to account for distinct differences in forest coverage and the impact of human activities observed across these zones. This stratification improved the precision of data collection, maintained homogeneity within each zone, and provided valuable insights into species distribution and environmental variations along the altitudinal gradient. In ecological communities, the number of species increases with the increase in the area sampled.

2.4. Forest Structure Analysis

The structure of the study area, Entoto Mountain forest, was characterized using the Importance Value Index (IVI). This index was determined by summing the relative density (RD), relative frequency (RF), and relative dominance (RDo) [17].
Density (the number of individuals of a species per unit area), frequency (the occurrence rate of a species across a set number of sample plots), and dominance (the area occupied by the stems of a species, measured as basal area in m2 per hectare) were calculated as follows:
D e n s i t y D = T o t a l   N o . o f   i n d i v i d u a l s   o f   a   s p e c i e s s a m p l e   s i z e   i n   h e c t a r e ,
F r e q u e n c y F = N o . o f   q u a d r a n t s   i n   w h i c h   t h e   s p e c i e s   o c c u r s T o t a l   N o . o f   q u a d r a n t s   e x a m i n e d ,
D o m i n a n c e D o = B a s a l   a r e a B A = π ( D B H ) 2 4 , w h e r e   π = 3.14 .
The three components of IVI—relative density, relative frequency, and relative dominance—were calculated for all woody species in Entoto Mountain forest using the following methods:
R e l a t i v e   d e n s i t y ( R D ) = D e n s i t y   o f   s p e c i e s S u m   d e n s i t y   a l l   s p e c i e s × 100 ,
R e l a t i v e   f r e q u e n c y ( R F ) = F r e q u e n c y   o f   s p e c i e s S u m   f r e q u e n c y   a l l   s p e c i e s × 100 ,
R e l a t i v e   d o m i n a n c e R D o = D o m i n a n c e   o f   a   s p e c i e s D o m i n a n c e   o f   a l l   s p e c i e s × 100 .

2.5. Woody Species Diversity Analysis

The Shannon–Wiener diversity and evenness indices were used to measure species diversity in Entoto forest, as they are indicators of ecological system wellbeing, and were calculated using a formula as per Magurran’s [18] work.
H = i = 1 S P i   l n   P i ,
where S is the total number of species; Pi is the proportion of individuals or the abundance of the ith species relative to the total cover; and ln refers to the natural logarithm.
Evenness or equitability (E′) is a measure of diversity that compares the observed diversity value (e.g., the Shannon–Wiener Index) to the maximum potential diversity value, which occurs when all species are equally abundant.
E = H H m a x = H I n   S ,
where Hmax represents the maximum possible level of diversity within a given population and S denotes species richness.

2.6. Regeneration Status Analysis

An evaluation was carried out to determine the regeneration status of the Entoto Mountain forest in order to predict the future condition of the woody species. The assessment was conducted by analyzing the overall density of T (trees), SA (sampling), and SE (seedling). The regeneration status of species with various growth forms was categorized as good (SE > SA > T), fair (SE > or ≤ SA ≤ T), and very poor (SA<, ≥ T and no SE), based on the density of seedlings compared to saplings and matured individual trees [19].

2.7. Field Carbon Stock Measurement

2.7.1. Aboveground Tree Biomass (AGB) and Belowground Biomass (BGB)

The sampling plots were 400 m2 with a 20 m radius. Trees with a diameter of 4.5 cm or greater were assessed using a clinometer, diameter tape, and linear tape [20]. Measurements were taken from the outermost edge to the center, ensuring proper marking to avoid duplication [21]. According to Subedi et al. [21], the C pool in BGB constitutes a proportion of 20% of the AGB.

2.7.2. Litters Biomass (LB)

The study collected litter samples from a designated forest using composite sampling techniques. The samples were collected from five sub-quadrats, each measuring 1 m2 inside the main quadrat. The wet weight of the composite samples was measured and recorded. The overall weight of the samples was determined after a 24 h drying period at 70 °C in an oven. The C fraction was also tested in a laboratory [21].

2.7.3. Soil Organic Carbon (SOC)

Soil samples were collected from five sub-plots using a composite procedure, using a 30 cm soil probe and a depth core sampler. The samples were collected from three layers (0–10 cm, 10–20 cm, and 20–30 cm), and average values were calculated. The volume of the soil sample was calculated using the core sampler’s height and radius. All samples were placed in plastic bags, and five equal weights of each sample were collected by each layer. A composite subsample of 100 g from each plot was submitted for laboratory analysis using the Walkley–Black procedure [22].

2.8. Estimation of Carbon Stocks in Different Carbon Pools

2.8.1. Aboveground Biomass Carbon Stock Estimation (CAGB)

The allometric equations are widely used to estimate the biomass of trees aboveground. These equations consider factors like climate, species type, geographical location, and forest stand type. The species-specific equations were chosen based on the study location’s environmental conditions, including climate and terrain profile.
The current study applied the equation developed by Chave et al. [23] (Equation (9)) to estimate aboveground biomass (AGB) of the forest, using diameter at breast height (DBH), tree height, and wood-specific density as dependent variables. This equation is particularly suitable for the study area as it integrates data from diverse tropical woodlands across Africa, covering a wide range of climatic conditions and dry tropical forest types. Additionally, it accommodates a broad DBH range (4.5–212 cm), making it well-suited to the forest structure observed in this study.
AGB = 0.0673 × (P × D2 × H) 0.976,
where AGB = aboveground biomass (kg);
P = density in g/cm3; wood density of each tree species was obtained from reference [24];
D = diameter at breast height (cm);
H = height (m).
The C stock was calculated using a recommended conversion factor of 0.47, which translates to a carbon content of 47% for aboveground biomass in tropical and subtropical forests, as reported in previous research [21].
C = 0.47 × AGB.

2.8.2. Belowground Biomass Carbon Stock Estimation (CBGB)

The estimation of C stock in BGB was conducted using the methodology proposed by Subedi et al. [21], which entails the application of a root-to-shoot ratio approach.
The equation used to calculate the belowground biomass (BGB) is provided as follows:
BGB = AGB × 0.20,
where BGB represents belowground biomass, AGB denotes aboveground biomass, and 0.20 is the conversion factor (indicating that BGB is 20% of AGB). The biomass stock density was then converted to carbon stock density by applying a default carbon fraction value of 0.47 [21].
C = 0.47 × BGB

2.8.3. Litter Biomass Carbon Stock Estimation (CL)

According to Subedi et al. [21], the estimation of the amount of biomass in the leaf litter was calculated as follows:
LB = W f i e l d A × W s u b s a m p l e   d r y W s u b s a m p l e   w e t × 10 ,
where LB = litter biomass of litter (t ha−1);
Wfield = weight of wet field sample of litter sampled within an area of size 1 m2 (kg);
A = size of the area in which litter was collected (m2);
Wsub-sample dry = weight of the oven-dry sub-sample of litter taken to the laboratory to determine moisture content (g);
Wsub-sample fresh = weight of the fresh sub-sample of litter taken to the laboratory to determine moisture content (g).
Once the litter biomass (LB) was determined, the carbon stock in the dead litter biomass was estimated. This was achieved by calculating the percentage of organic carbon stored in the litter carbon pool, derived from the dry ash content, using the following (Subedi et al. [21]):
% Ash = ( W c W a ) ( W b W a ) 100
%C = (100 − Ash%) 0.58.
This calculation considers 58% organic carbon in ash-free soil material. The parameters used include the following:
where C = organic carbon (%);
Wa = weight of the crucible (g);
Wb = weight of oven-dried ground samples in crucibles (g);
Wc = weight of ash and crucibles (g).
Finally, carbon in litter t/Cha for each sample was determined.
The carbon stocks in dead litter biomass are as follows:
CL = LB × % C,
where CL represents the carbon stock in dead litter (tC ha−1), and % C is the carbon fraction determined in the laboratory.

2.8.4. Soil Organic Carbon (SOC) Estimation

The soil organic carbon stock density was calculated based on the soil volume and bulk density, as recommended by Ebasan et al. [22].
SOC = BD × d × % C × 100,
where SOC = soil organic carbon stock per unit area (tC ha−1);
  • BD = soil bulk density (g cm−3);
  • d = the total depth at which the sample was taken (30 cm);
  • %C = Carbon concentration (%),
where C represents the SOC concentration obtained from laboratory analysis, expressed as a decimal fraction. The value 100 serves as a conversion factor to change units from g cm−3 to tC ha−1.

2.8.5. Total Carbon Stock Estimation (TC)

The total C stock density for each site was determined by summing the carbon stock densities from each individual carbon pool, using the formula provided in Subedi et al. [21].
TC = CAGB + CBGB + CL+ SOC.

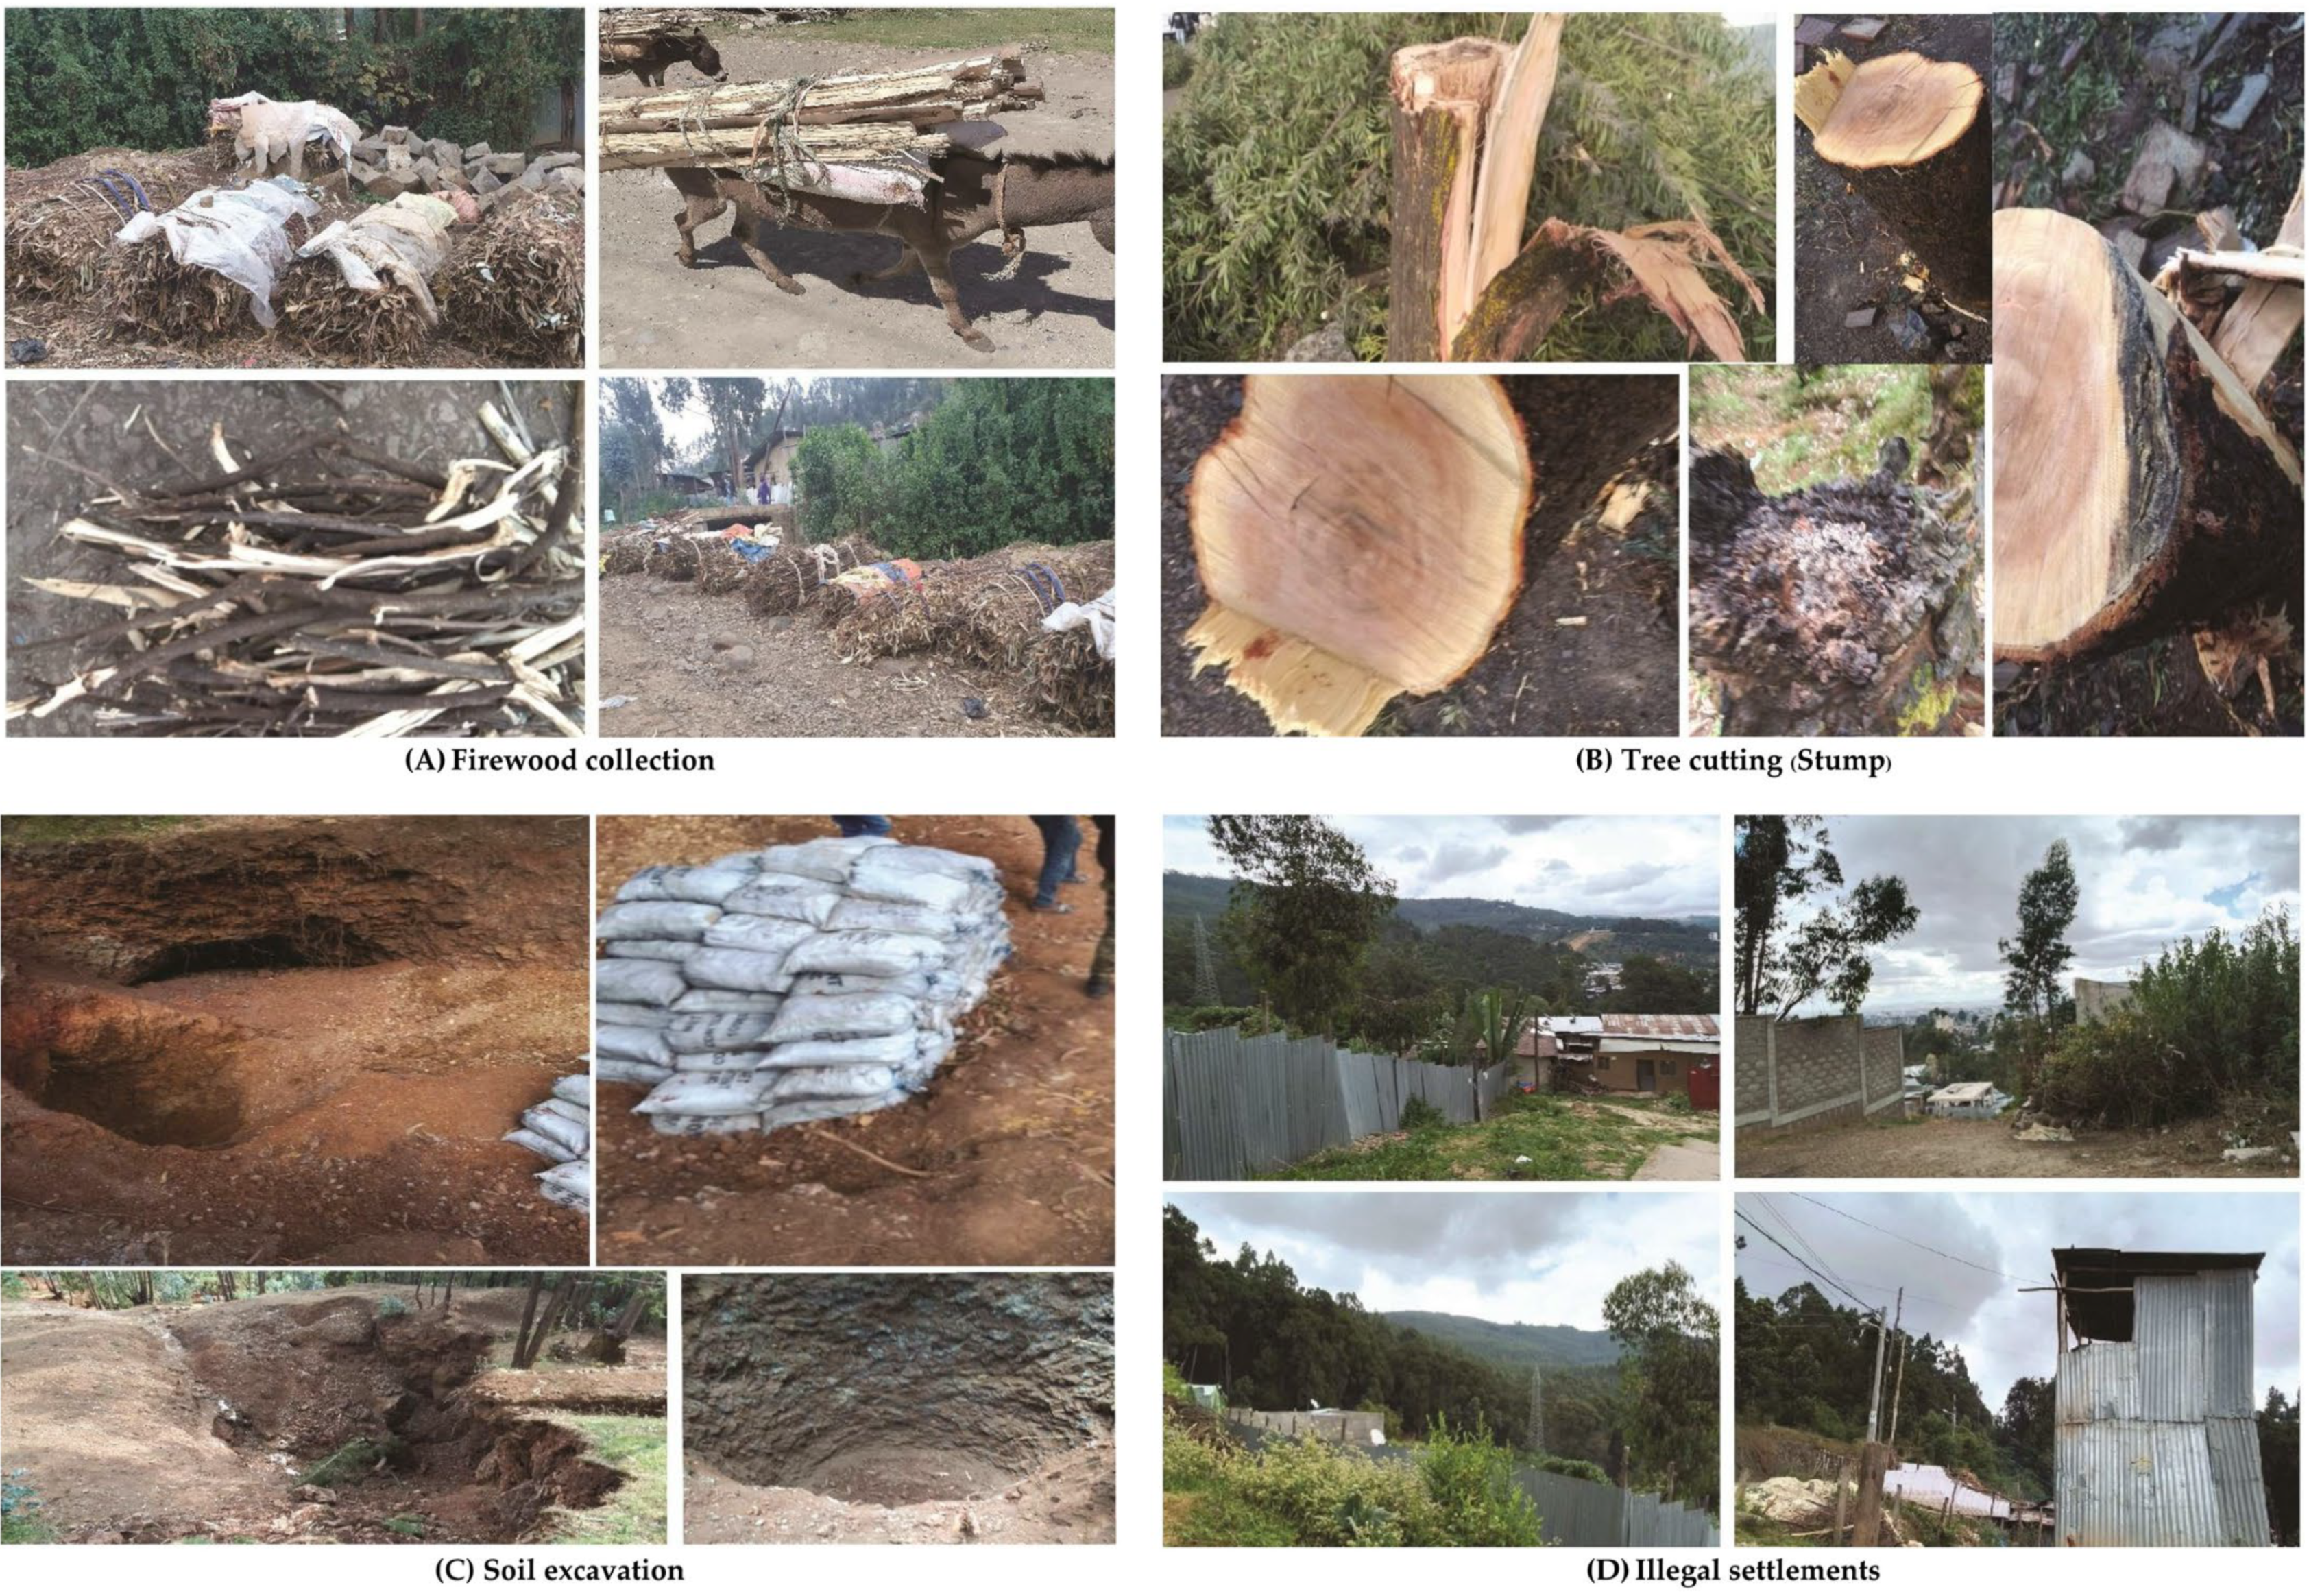
2.9. Human Disturbance Index Estimation

The human disturbance index in Entoto Mountain forest was assessed through direct visualization in the field, based on indicators of human action. Factors such as stumps, roads within the forest, firewood collection, soil excavation, and infrastructure were used to evaluate the effects of human activities on each plot in relation to the forest’s carbon stock. The human disturbance index was calculated by adding the presence of each observed human impact in the plot and dividing by five. The values ranged from 0 to 1, with 0 indicating no impact and 1 indicating all impacts, indicating highly impacted by human intervention [25].
In order to determine the level of human disturbance, it was estimated and categorized into four main groups based on a visual scale. In all the sample plots within the Entoto Mountain forest, every human disturbance factor (including stumps, roads, firewood collection, soil excavation, and infrastructure) was documented. The human disturbance classifications were as follows: 1 = undisturbed (no visible indicators of human disturbance), 2 = slightly disturbed (<20% human disturbance), 3 = moderately disturbed (>20% human disturbance) and 4 = highly disturbed (>60% human disturbance) [7].

2.10. Data Analysis

The data were organized and summarized using Microsoft Excel (version 2010) and ArcGIS (version 10) to visually illustrate the locations under investigation. Data analysis was conducted using the Statistical Package for the Social Sciences (SPSS, version 21, IBM, Armonk, NY, USA). Key factors such as density, dominance, frequency, DBH, species richness, Shannon diversity, and biomass carbon were analyzed using descriptive statistics, focusing on key summary metrics, including mean, minimum, and maximum values. Analysis of variance (ANOVA) was performed to assess the statistical significance of carbon stock in relation to both the human disturbance index and altitude. Additionally, Pearson’s correlation was used to examine significant interrelationships among various environmental variables.

3. Results

3.1. The Forest Structures

3.1.1. Frequency

According to the Raunkiaer percentage frequency values [26], woody plant species were categorized into five frequency classes. These classes are defined as follows: “constantly present species” for those occurring in 81–100% of the plots (1st class), “mostly present species” for those found in 61–80% of the plots (2nd class), “often present species” for those in 41–60% of the plots (3rd class), “seldom present species” for those in 21–40% of the plots (4th class), and “rarely present species” for those occurring in 1–20% of the plots (5th class).
The distribution of woody species varied across altitudinal zones. The upper altitude was dominated by Eucalyptus globulus Labill, which had the highest frequency (51.46%), followed by Juniperus procera Hoechst. Ex Endl. (36.49%). Acacia decurrens Willd had a lower presence (10.42%) compared to the lower altitude. Hagenia abyssinica J.F.Gmel and Schefflera abyssinica (Hochst. ex A. Rich.) Harms were recorded at very low frequencies, while Olea europaea L. subsp. cuspidata and Acacia melanoxylon R. Br. were absent in the upper altitude (Table 1). In the lower altitude, Acacia decurrens Willd had the highest frequency (52.35%), followed by Juniperus procera Hoechst. Ex Endl. (27.47%) and Eucalyptus globulus Labill (18.32%). Other species, including Olea europaea L. subsp. cuspidata, Hagenia abyssinica J.F.Gmel, and Acacia melanoxylon R. Br. were present in much lower proportions, while Schefflera abyssinica (Hochst. ex A. Rich.) Harms was absent (Table 1).

3.1.2. Density

The total density of woody plants with a DBH between 4.5 and 10 cm and a height greater than 1.5 m was 35.71 per hectare. A small portion of this density (11.99%) was contributed by species with a DBH between 4.5 and 10 cm. The highest density, 182.14 per hectare, was recorded for species within the DBH size range of 10.1 to 20 cm, contributing 61.15%. The density of woody plants with a DBH greater than 20 cm was 80 individuals per hectare, contributing 26.86% (Table 2).

3.1.3. Dominance and Important Value Index

The analysis of total dominance (basal area) and the Importance Value Index (IVI) in the Entoto Mountain forest provides a comprehensive understanding of the forest structure and species contributions. These metrics are detailed in Table 3, which integrates the dominance of woody plants across diameter at breast height (DBH) classes and their relative contributions to forest structure.
The total dominance or basal area of woody plants in the study area of Entoto Mountain forest was 11.45 per hectare. Approximately 70.22% (8.04 individuals per hectare) of the entire area were occupied by trees in the largest diameter class (>20cm), consisting mainly a few numbers of large-sized individuals like Eucalyptus globulus Labill, Acacia decurrens Willd, and Juniperus procera Hoechst. Ex Endl. About 27.42% (3.14 individuals per hectare) of the second biggest basal area were found in the diameter class of 10.1–20 cm, perhaps due to all species except Schefflera abyssinica (Hochst. ex A. Rich.) Harms contribute significantly. DBH smaller than 10 cm contributed only about 2.36% (0.27 individuals per hectare) to the total basal area of woody species in the forest.
The IVI was calculated using three parameters: relative density (RD), relative frequency (RF), and relative dominance (RDo). Eucalyptus globulus Labill had the highest IVI score of 132.25, contributing 45.08% to relative density, 44.29% to relative frequency, and 42.88% to relative dominance. Juniperus procera Hoechst. Ex Endl. followed with an IVI score of 120.31, with notable contributions to RD (38.13%), RF (40.53%), and RDo (41.65%).
Acacia decurrens Willd contributed moderately with an IVI of 41.17, while other species, such as Olea europaea L. subsp. cuspidate, Hagenia abyssinica J.F. Gmel, and Schefflera abyssinica (Hochst. ex A. Rich.) Harms, had significantly lower IVI values (2.42, 1.77, and 0.59, respectively), reflecting their limited presence and influence in the forest structure.

3.2. Species Diversity and Evenness

The Shannon diversity analysis unveiled the diversity and evenness of each woody species. The species diversity and evenness of the research area were measured at 0.59 and 0.19, respectively. Eucalyptus globulus Labill and Juniperus procera Hoechst. Ex Endl. species exhibit the maximum diversity, with values of 1.79 and 1.65, respectively. The evenness values were highest for Eucalyptus globulus Labill species and Juniperus procera Hoechst. Ex Endl. compared to other species in the forest types (Table 4).

3.3. Regeneration Status of Forest

A field evaluation of woody plant regeneration in Entoto Mountain Forest revealed that 98.8% of the total 417 woody species were in the SE and SA stages, accounting for 410 species. Conversely, seven species (1.2%) were absent in the SE and SA stages within the study area. The species mentioned include Hagenia abyssinica J.F.Gmel, Acacia melanoxylon R. Br., and Schefflera abyssinica (Hochst. ex A. Rich.) Harms. The overall regeneration density of woody species in the forest was 479.28 individuals per hectare, comprising 80.71 per hectare for SE (16.84%), 100.71 per hectare for SA (21.01%), and 297.86 per hectare for T (62.15%) (Table 5).

3.4. Estimation of Biomass and Carbon Stocks in Different Pools

To determine the C stock and biomass of the trees at the research site, the biomass estimate method was used. According to the findings, the range of AGB ranged from 7.56 t ha−1 to 678.49 t ha−1. The BGB value is calculated by multiplying the AGB result by 0.2, and the mean AGB was 114.28 t ha−1. At its peak, the average was 135.70 t ha−1, while the lowest recorded value was 1.51 t ha−1. The average BGB was 22.86 t ha−1.
The range of CAGB potential values varied from 3.55 tC ha⁻1 to 318.89 tC ha−1, while the amount of C sequestered in BGB ranged from 0.71 to 63.78 tC ha⁻1. The average amounts of CAGB and CBGB were 53.73 tC ha−1 and 10.81 tC ha−1, respectively.
The biomass of L ranged from 0.079 to 0.332 t ha−1, with a mean LB of 0.17 t ha−1. In LB, the maximum C stock was 0.17 tC ha−1, while the lowest was 0.04 tC ha−1. On average, the total C stock was 0.09 tC ha−1.
The soil profile in the site had a bulk density ranging from 1.13 g cm−3 to 3.60 g cm−3, with an average value of 2.35 g cm−3. The high bulk density in the deeper layer is associated with a high iron mineral content. The forest study area had a soil C stock ranging from 188.18 tC ha−1 to 1010.14 tC ha−1, with an average of 470.32 tC ha−1. The mean soil C content for the three depth layers (0–10 cm, 10–20 cm, and 20–30 cm) was 166.59, 161.23, and 142.50 tC ha−1, respectively.

3.4.1. Total Carbon Stock

The total C stock of the Entoto Mountain forest study area was calculated by summing the C values from each pool, including CAGB, CBGB, CL, and SOC, across all sample plots. The total C stock in the study area ranged from a maximum of 1027.27 tC ha−1 to a minimum of 203.06 tC ha−1. The average C stock across all pools at the research site was 534.95 tC ha−1.
The correlations between forest structure variables and C pools, as shown in Table 6 and Table 7, provide additional insights into these patterns. A significant positive correlation was observed between IVI and aboveground biomass carbon (r = 0.515, p < 0.01) and total C stock (r = 0.364, p < 0.05), indicating that dominant species contribute substantially to C storage.

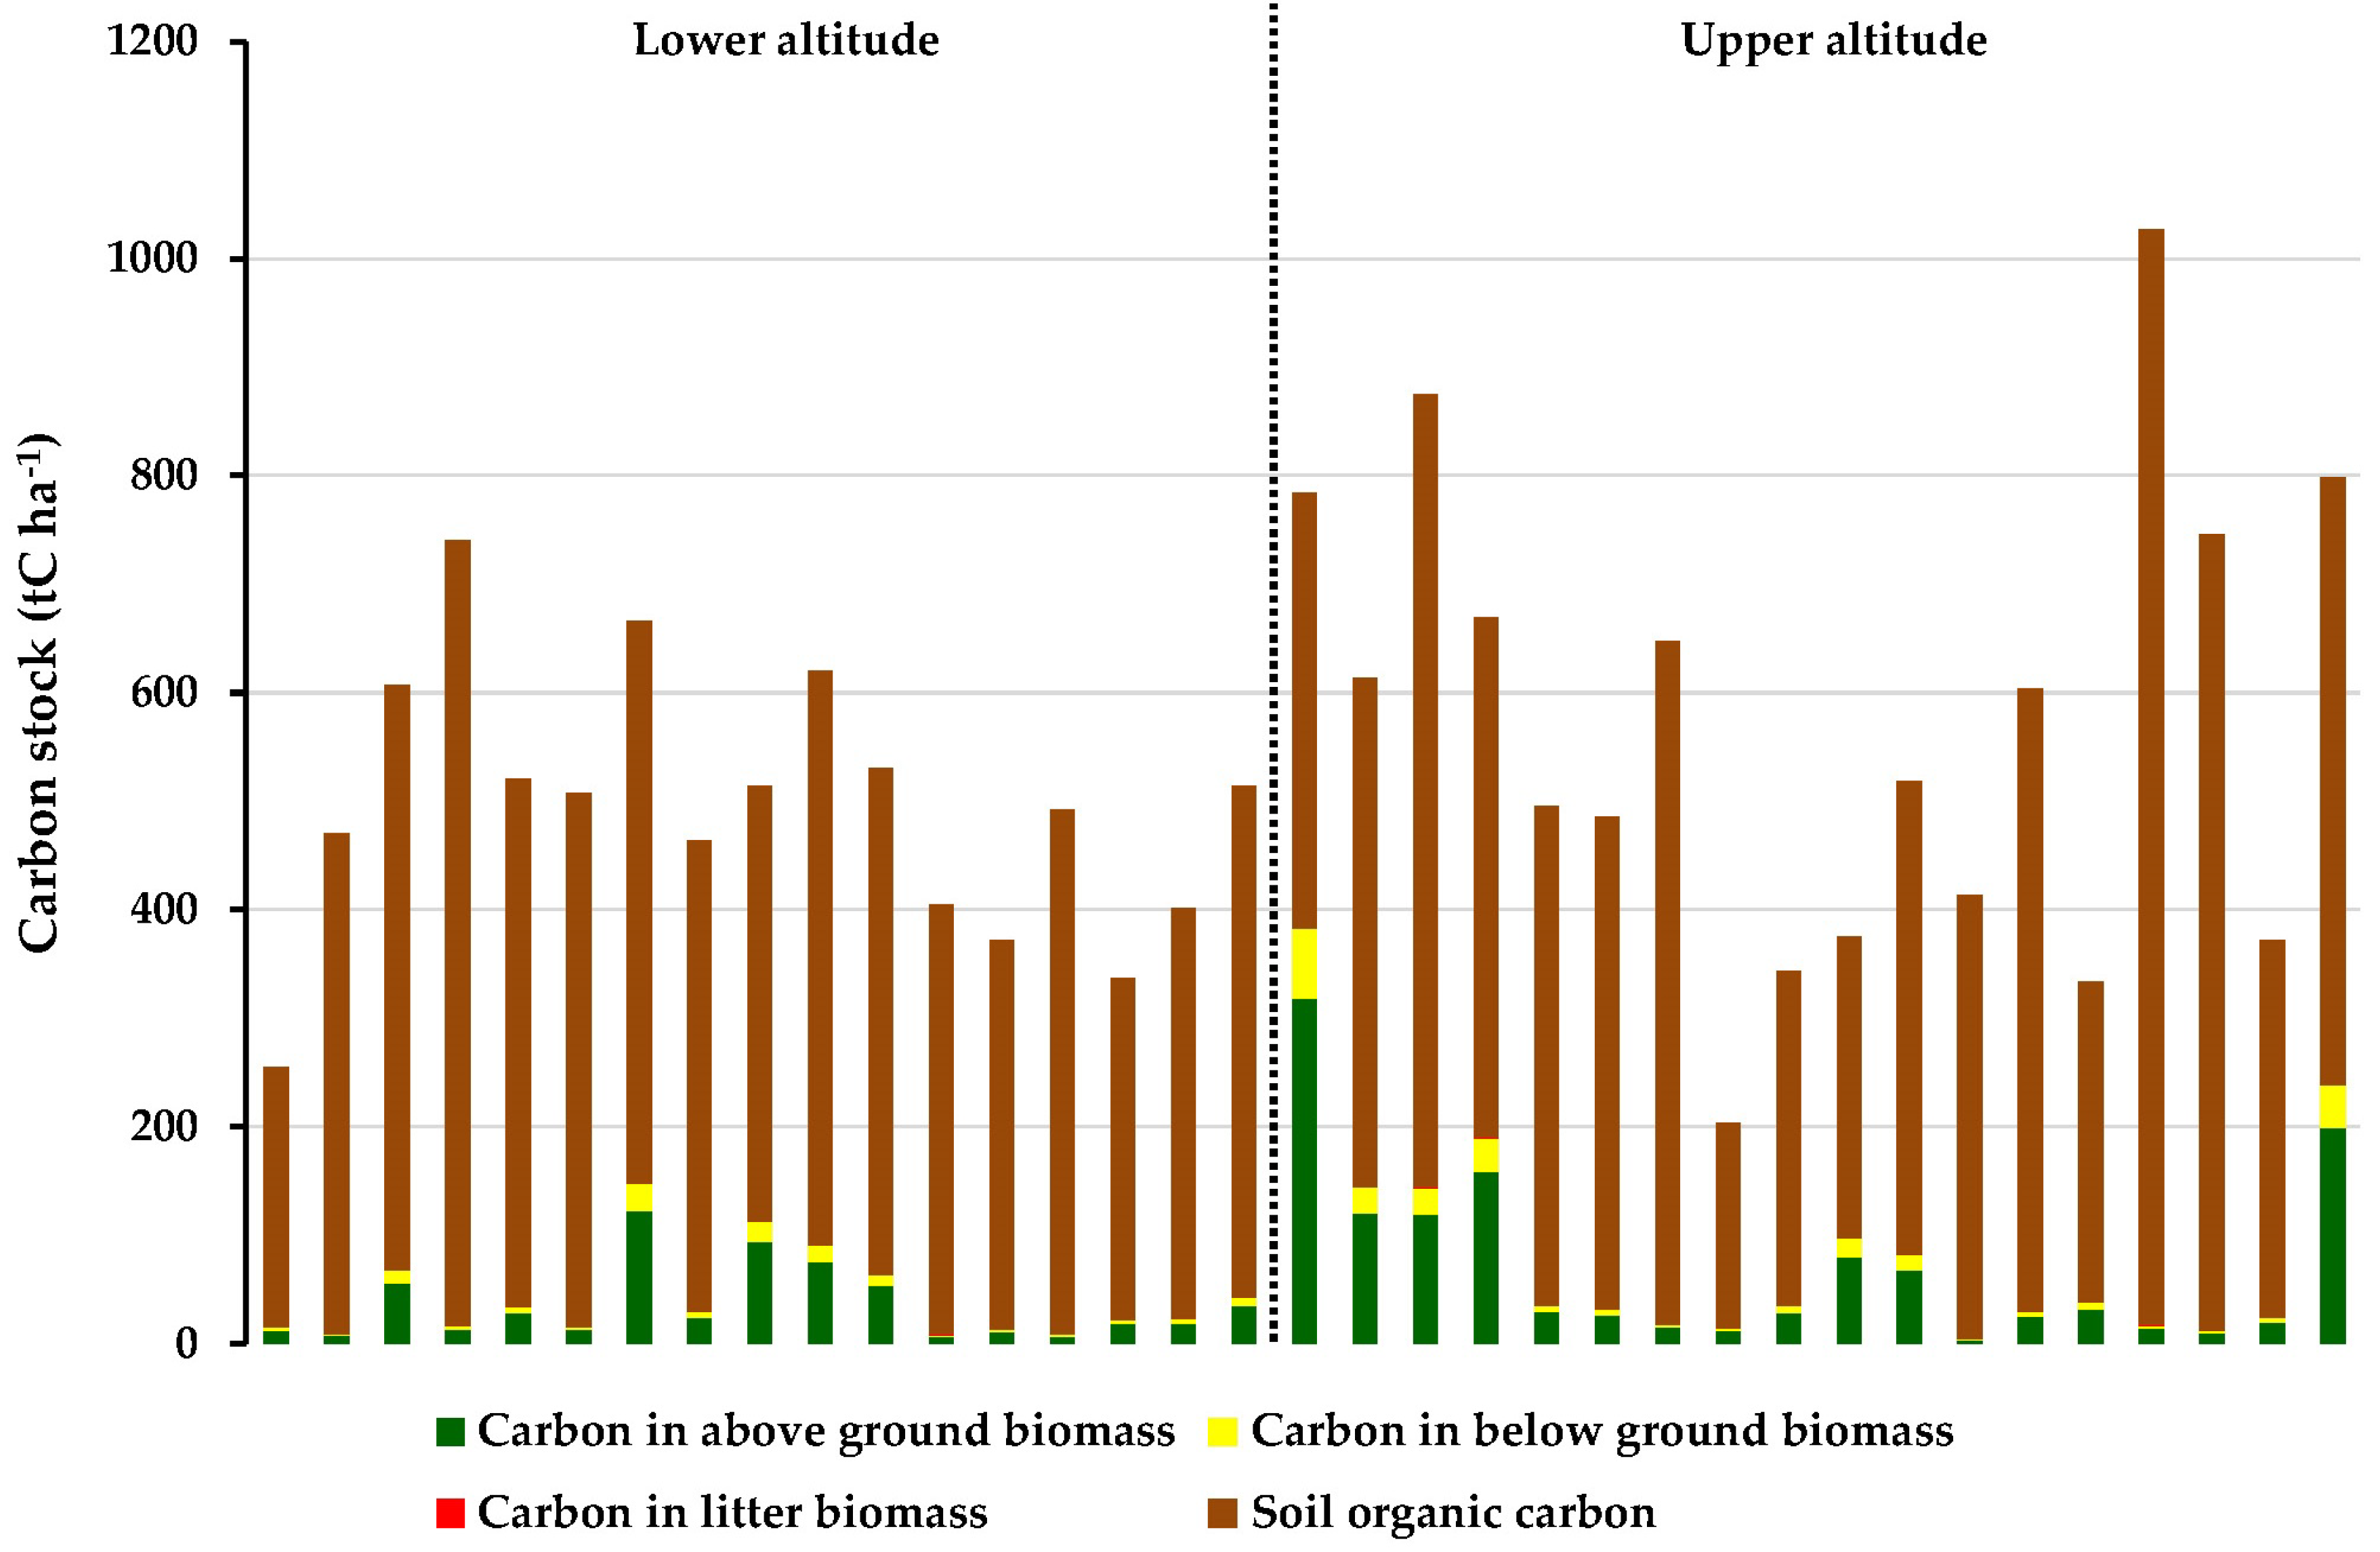
3.4.2. Carbon Stock Along Altitudinal Gradient

Altitudinal variation influences the C storage of various C pools in the forest, as shown in Table 8 and Figure 4. The lower altitude class, ranging from 2137 to 2686 m a.s.l., had 17 sample plots, while the upper altitude class, from 2690 to 2739 m a.s.l., had 18 sample plots. The C stock in the upper altitude section of the forest was greater than that in the lower altitude section. The average total C stock at higher altitudes was 572.63 tC ha⁻1, while at lower altitudes it was 495.04 tC ha⁻1. This difference was statistically significant at a 95% confidence level for C stock in both aboveground and belowground biomass (p = 0.055) but insignificant for other C pools. The C stock in each C pool at higher altitudes was greater than at lower altitudes, except for litter biomass, which showed similar C stock potential in both altitude classes. This can be explained by the balance between litter production and decomposition. Higher-altitude sites may generate more litter due to denser vegetation, but decomposition rates are slower due to the colder climate. In contrast, lower-altitude sites may produce less litter but experience faster decomposition due to higher temperatures, resulting in a similar steady-state litter biomass.

3.5. Human Disturbance Index

As the Entoto Mountain forest study site is open to the public, various types of human disturbances are commonly observed (Figure 5). These disturbances have been classified into five major categories, as presented in Table A1, along with their corresponding human disturbance index (HDI) values: tree cutting (stump), firewood collection, soil excavation, road presence within the forest plot, and infrastructure within the forest plot. The HDI had a mean value of 0.48 across the study sites. Table 9 shows that the conditions were not statistically significant at a 95% confidence level for the study area’s carbon pools, regeneration pattern status, structure, diversity, or altitude in relation to the human disturbance index.

4. Discussion

4.1. Carbon Stock in Different Carbon Pools

Our study revealed that total C stock was primarily influenced by SOC, which contributed an average of 470.316 tC ha−1. This finding aligned with recent studies highlighting soil as a significant carbon reservoir in degraded or disturbed forests [27]. In contrast, the AGB and BGB C stocks averaged 53.73 tC ha−1 and 10.81 tC ha−1, respectively, underscoring the adverse impacts of deforestation and urban encroachment, as noted in tropical forest degradation studies [28].
A comparative analysis with other Ethiopian forests showed that while the study area of Entoto Mountain forest had a moderate total C stock, it lagged in biomass C due to human disturbances. For instance, better-conserved forests, such as Danaba community forest (278.03 tC ha−1) and Egdu forest (278.08 tC ha−1), reported significantly higher CAGB stocks, reflecting effective forest management practices [29,30].
In contrast, the SOC in Entoto Mountain forest was exceptionally high at 470.32 tC ha−1, surpassing the SOC levels of most Ethiopian forests, including Egdu forest (277.6 tC ha−1) and Danaba community forest (186.4 tC ha−1). This disparity may be attributed to specific urban influences, such as organic matter deposition, or historical soil management practices that enhanced carbon storage in the soil [31]. Similar findings have been reported by [32], who observed that high SOC levels could reflect historical accumulation or specific ecological dynamics in disturbed forests. Nonetheless, the reliance on soil C as the predominant C pool, given the depletion of AGB, presents a fragile balance that could be further jeopardized by ongoing anthropogenic pressures.
The average of total C stock in Entoto Mountain forest was estimated at 534.95 tC ha−1, placing it in the intermediate range when compared to forests such as Egdu forest (614.72 tC ha−1) and Danaba community forest (507.29 tC ha−1). However, the disproportionate contribution of SOC to the total C stock underscores the diminished role of biomass in C sequestration within the forest. This imbalance is a direct consequence of deforestation and other forms of human disturbance, which have significantly reduced the forest’s AGB, BGB, and LB C storage capacity [15].

4.2. The Effect of Forest Structure, Diversity, and Regeneration Pattern Status in Carbon Stock

The findings strongly supported the hypothesis that human activities have negatively impacted the variety, structure, and regeneration patterns of woody species in the Entoto Mountain forest. The Shannon–Wiener diversity index for the study area, as shown in Table 4, was only 0.59, significantly below the typical range of 1.5 to 3.5 for moderately diverse ecosystems [33]. This low diversity reflects dominance by a few species, particularly Eucalyptus globulus Labill and Juniperus procera Hoechst. Ex Endl., which exhibited the highest IVI scores at 44.08% and 40.10%, respectively, as illustrated in Table 3. The dominance of these species suggests selective planting or preferential survival of non-native or resilient species, leading to reduced species variety and ecological homogenization [34].
The regeneration patterns, depicted in Table 5, further illustrate the negative impacts of human activities. The density of seedlings (113 individuals) was significantly lower than that of saplings (141 individuals) and mature trees (417 individuals). This imbalance demonstrates poor regeneration, characteristic of forests under anthropogenic pressure, such as logging, grazing, and urban encroachment, which hinder seedling establishment and survival [35]. Insufficient recruitment of young plants threatens the long-term sustainability of the forest’s woody species population and highlights a disrupted regeneration cycle [36].
However, the weak or nonsignificant correlations between species diversity, regeneration pattern, and C pools suggest that the forest’s C dynamics rely heavily on a few dominant species rather than a diverse and well-regenerating ecosystem. This underscores the limited ecological functionality and resilience of the forest, further emphasizing the detrimental effects of human disturbances [37].

4.3. The Effect of Altitude on Carbon Pools in Study Sites

The results supported the hypothesis that the forest’s C stock potential was higher at higher altitudes due to denser forest cover. The average total C stock in the upper altitude range (572.63 tC ha−1) surpassed that in the lower altitude range (495.04 tC ha−1), as shown in Table 8. Aboveground and belowground biomass C in the upper altitude class, as shown in Table 8, exhibited significantly higher mean values (CAGB: 71.19 tC ha−1; CBGB: 14.37 tC ha−1) compared to the lower altitude class (CAGB: 35.24 tC ha−1; CBGB: 7.04 tC ha−1). These differences were statistically significant at the 95% confidence level (p = 0.055). This highlighted that biomass C pools were more abundant at higher altitudes, likely due to favorable environmental conditions such as cooler temperatures and higher moisture availability [38,39]. These conditions, along with reduced human interference, supported more robust vegetation growth and carbon accumulation, consistent with findings in an earlier study [40].
Litter carbon biomass (CLB), as recorded in Table 8 and Figure 4, showed negligible variation between altitudes, with similar values observed for both lower (0.087 tC ha−1) and upper altitudes (0.085 tC ha−1). This suggested that factors influencing litter C storage, such as litterfall rates and decomposition processes, were largely uniform across altitudes [41]. Soil organic carbon (SOC), also detailed in Table 8, demonstrated slightly higher mean values at higher altitudes (486.98 tC ha−1) than at lower altitudes (452.67 tC ha−1), but the differences were statistically insignificant (p > 0.05). This indicated that soil C dynamics were influenced more by site-specific factors, including soil texture, microbial activity, and historical land use, rather than altitude alone [42].

4.4. The Effect of Human Disturbance in Forest Structures and Carbon Stock

The one-way ANOVA analyzed the relationships between human disturbance indices and various forest metrics, including carbon pools, species diversity, the important value index, and regeneration patterns, as shown in Table 9. The result indicated weak correlations between disturbance levels and C stocks, as evidenced by high p-values. These results suggested that while direct statistical relationships are not significant, other ecological processes may mediate the impacts of human activities on carbon dynamics over time [43]. The high variability in forest metrics across different sites, driven by abiotic factors like soil type and microclimate, can reduce the statistical power of analyses, potentially masking the direct impacts of human disturbances. Nevertheless, broader trends highlight the cumulative effects of anthropogenic pressures on forest ecosystems [44]. Despite disruptions to both above- and belowground biomass, SOC levels remain resilient, underscoring the forest’s capacity to serve as a vital C sink and maintain soil C storage under varying environmental and anthropogenic conditions.

5. Conclusions and Recommendation

This study highlights the critical role of urban forests in C sequestration, with SOC serving as the primary reservoir despite the detrimental effects of anthropogenic disturbances on above- and belowground biomass. The results underscore the importance of higher-altitude areas, which were found to hold significantly greater C stock potential due to favorable environmental conditions and reduced human interference.
Species composition further influenced C storage, with dominant species like Eucalyptus globulus Labill and Juniperus procera Hoechst. Ex Endl. contributing significantly to total C stocks. However, their prevalence points to ecological homogenization and a need to foster greater biodiversity to ensure long-term resilience and functionality.
To maximize the potential of urban forests as C sinks, it is imperative to focus on conserving old-growth forest areas, enhancing species diversity, and prioritizing soil conservation. Moreover, a comprehensive forest conservation policy combining legal protection, sustainable management, community participation, and urban planning can help restrict human disturbances and preserve carbon stocks. These strategies not only support C sequestration but also contribute to broader ecosystem stability in Entoto Mountain forest. The findings from this study provide valuable insights applicable to urban forests worldwide, particularly in regions facing similar challenges from urbanization and climate change.

Author Contributions

Conceptualization, L.W.S., N.A., T.P., W.W. and S.S.; methodology, L.W.S., N.A. and T.P.; investigation, L.W.S., N.A. and T.P.; writing—original draft, L.W.S., N.A., T.P. and S.S.; writing—review and editing, L.W.S., N.A., T.P., W.W., S.S. and R.H.; supervision, N.A., T.P., W.W., S.S. and R.H. All authors have read and agreed to the published version of the manuscript.

Funding

This research was funded by the Thailand International Cooperation Agency (TICA) for the first author.

Institutional Review Board Statement

Not applicable.

Informed Consent Statement

Not applicable.

Data Availability Statement

The datasets generated during and/or analyzed during the current study are available from the corresponding author upon reasonable request.

Acknowledgments

The authors would like to recognize Michael Girmay and Yabsra Melak for their assistance in data collection. Furthermore, the authors are grateful to the Gullele sub-city administration environmental protection office, Addis Ababa, Ethiopia, for granting permission to gather data.

Conflicts of Interest

The authors declare no conflicts of interest.

Appendix A

Table A1. Human disturbance index and average carbon stock value of study site of Entoto Mountain forest.
No. of PlotsAltitudeStumpRoadFirewood CollectionSoil ExcavationInfra-
Structure
Total
Frequency of HDI
HDIHDI%
12137 20.4040.00
22341 30.6060.00
32619 40.8080.00
42619 20.4040.00
52629 30.6060.00
62635 20.4040.00
72641 10.2020.00
82643 30.6060.00
92644 20.4040.00
102645 20.4040.00
112652 30.6060.00
122653 30.6060.00
132677 20.4040.00
142679 10.2020.00
152679 20.4040.00
162683 30.6060.00
172686 30.6060.00
182690 20.4040.00
192693 20.4040.00
202695 30.6060.00
212699 30.6060.00
222704 40.8080.00
232709 20.4040.00
242710 10.2020.00
252711 40.8080.00
262714 20.4040.00
272716 20.4040.00
282718 30.6060.00
292720 10.2020.00
302722 30.6060.00
312724 20.4040.00
322725 20.4040.00
332735 30.6060.00
342735 20.4040.00
352739 20.4040.00
Total-25193343840.4848.00

References

  1. Nowak, D.J.; Greenfield, E.J. The increase of impervious cover and decrease of tree cover within urban areas globally (2012–2017). Urban For. Urban Green. 2020, 49, 126638. [Google Scholar]
  2. FAO. The State of the World’s Forests 2022; FAO: Rome, Italy, 2022. [Google Scholar]
  3. Joshi, V.C.; Negi, V.S.; Bisht, D.; Sundriyal, R.C.; Arya, D. Tree biomass and carbon stock assessment of subtropical and temperate forests in the Central Himalaya, India. Trees For. People 2021, 6, 100147. [Google Scholar]
  4. Pan, Y.; Birdsey, R.A.; Fang, J.; Houghton, R.; Kauppi, P.E.; Kurz, W.A.; Phillips, O.L.; Shvidenko, A.; Lewis, S.L.; Canadell, J.G.; et al. A large and persistent carbon sink in the world’s forests. Science 2011, 333, 988–993. [Google Scholar] [PubMed]
  5. Negassa, M.D.; Mallie, D.T.; Gemeda, D.O. Forest cover change detection using Geographic Information Systems and remote sensing techniques: A spatio-temporal study on Komto Protected forest priority area, East Wollega Zone, Ethiopia. Environ. Syst. Res. 2020, 9, 1. [Google Scholar]
  6. Abebe, M.T.; Megento, T.L. The city of addis ababa from ‘forest city’ to ‘urban heat island’: Assessment of urban green space dynamics. J. Urban Environ. Eng. 2016, 10, 254–262. [Google Scholar]
  7. Bisht, S.; Bargali, S.S.; Bargali, K.; Rawat, G.S.; Rawat, Y.S.; Fartyal, A. Influence of Anthropogenic Activities on Forest Carbon Stocks—A Case Study from Gori Valley, Western Himalaya. Sustainability 2022, 14, 16918. [Google Scholar] [CrossRef]
  8. Deribew, K.T. Spatiotemporal analysis of urban growth on forest and agricultural land using geospatial techniques and Shannon entropy method in the satellite town of Ethiopia, the western fringe of Addis Ababa city. Ecol. Process. 2020, 9, 46. [Google Scholar]
  9. Gebeyehu, G.; Soromessa, T.; Bekele, T.; Teketay, D. Carbon stocks and factors affecting their storage in dry Afromontane forests of Awi Zone, northwestern Ethiopia. J. Ecol. Environ. 2019, 43, 7. [Google Scholar]
  10. Ryan, C.M.; Williams, M.; Grace, J. Above- and belowground carbon stocks in a miombo woodland landscape of mozambique. Biotropica 2011, 43, 423–432. [Google Scholar]
  11. Solomon, N.; Birhane, E.; Tadesse, T.; Treydte, A.C.; Meles, K. Carbon stocks and sequestration potential of dry forests under community management in Tigray, Ethiopia. Ecol. Process. 2017, 6, 20. [Google Scholar]
  12. Nowak, D.J.; Hoehn, R.E.; Bodine, A.R.; Greenfield, E.J.; O’Neil-Dunne, J. Urban forest structure, ecosystem services and change in Syracuse, NY. Urban Ecosyst. 2016, 19, 1455–1477. [Google Scholar]
  13. Davies, Z.G.; Edmondson, J.L.; Heinemeyer, A.; Leake, J.R.; Gaston, K.J. Mapping an urban ecosystem service: Quantifying above-ground carbon storage at a city-wide scale. J. Appl. Ecol. 2011, 48, 1125–1134. [Google Scholar]
  14. Benti, T.R.; Zelalam Gasisa, S. An Assessment of Urban and Per-Urban Household’s Attitude to Participate in Urban Forest Conservation Practice in Assosa District, Western Ethiopia. Int. J. Clim. Stud. 2023, 2. Available online: www.iprjb.org (accessed on 20 January 2024).
  15. Meseret, H.; Eyasu, E. Role of Urban Forests for Carbon Emission Reduction in Addis Ababa:A review. Civ. Environ. Res. 2022, 12, 316. [Google Scholar]
  16. Alemu, Z.A.; Dioha, M.O. Climate change and trend analysis of temperature: The case of Addis Ababa, Ethiopia. Environ. Syst. Res. 2020, 9, 27. [Google Scholar]
  17. Taylor, D.; Kent, M.; Coker, P. Vegetation description and analysis: A practical approach. Geogr. J. 1993, 159, 237. [Google Scholar]
  18. Magurran, A.E. Ecological Diversity and Its Measurement; Springer: Dordrecht, The Netherlands, 1988. [Google Scholar]
  19. Pandey, S.; Shukla, R. Plant Diversity and Community Patterns Along the Disturbance Gradient in Plantation Forests of Sal (Shorea robusta Gaertn.). Curr. Sci. 1999, 77, 814–818. [Google Scholar]
  20. Pearson, T.R.H.; Brown, S.L.; Birdsey, R.A. United States Department of Agriculture Measurement Guidelines for the Seques-tration of Forest Carbon. 2007. Available online: http://www.nrs.fs.fed.us/ (accessed on 23 January 2024).
  21. Subedi, B.P.; Pandey, S.S.; Pandey, A.; Rana, E.B.; Bhattarai, S.; Banskota, T.R.; Charmakar, S.; Tamrakar, R. Forest Carbon Stock Measurement: Guidelines for Measuring Carbon Stocks in Community-Managed Forests. 2010. Available online: https://ansab.org.np/wp-content/uploads/2010/08/forest-carbon-measurement-guideline.pdf (accessed on 18 December 2023).
  22. Ebasan, M.S.; Aranico, E.C.; Tampus, A.D.; Amparado, R.F. Carbon stock assessment of three different forest covers in Panaon, Misamis Occidental, Philippines. J. Bio. Env. Sci. 2016, 8, 252–264. Available online: http://www.innspub.net (accessed on 23 January 2024).
  23. Chave, J.; Réjou-Méchain, M.; Búrquez, A.; Chidumayo, E.; Colgan, M.S.; Delitti, W.B.; Duque, A.; Eid, T.; Fearnside, P.M.; Goodman, R.C.; et al. Improved allometric models to es-timate the aboveground biomass of tropical trees. Glob. Change Biol. 2014, 20, 3177–3190. [Google Scholar]
  24. EFRL. ETHIOPIA’S FOREST REFERENCE LEVEL SUBMISSION TO THE UNFCCC. March 2017. Available online: https://redd.unfccc.int/media/ethiopia_frel_3.2_final_modified_submission.pdf (accessed on 15 December 2023).
  25. Bastos, J.R.; Capellesso, E.S.; Vibrans, A.C.; Marques, M.C.M. Human impacts, habitat quantity and quality affect the dimensions of diversity and carbon stocks in subtropical forests: A landscape-based approach. J. Nat. Conserv. 2023, 73, 126383. [Google Scholar]
  26. Clapham, A.R.; Raunkiaer, C.; Gilbert-Carter, H.; Tansley, A.G.; Fausboll. The life forms of plants and statistical plant geography. J. Ecol. 1935, 23, 247. [Google Scholar]
  27. Abegaz, A.; Tamene, L.; Abera, W.; Yaekob, T.; Hailu, H.; Nyawira, S.S.; Da Silva, M.; Sommer, R. Soil organic carbon dynamics along chrono-sequence land-use systems in the highlands of Ethiopia. Agric. Ecosyst. Environ. 2020, 300, 106997. [Google Scholar]
  28. Woldegerima, T.; Yeshitela, K.; Lindley, S. Ecosystem Services Assessment of the Urban Forests of Addis Ababa, Ethiopia. Urban Ecosyst. 2017, 20, 683–699. [Google Scholar]
  29. Nega Bazezew, M. Above- and Below-Ground Reserved Carbon in Danaba Community Forest of Oromia Region, Ethiopia: Implications for CO2 Emission Balance. Am. J. Environ. Prot. 2015, 4, 75. [Google Scholar]
  30. Yohannes, H. Carbon Stock Analysis Along Altitudinal Gradient in Gedo Forest: Implications for Forest Management and Climate Change Mitigation. Am. J. Environ. Prot. 2015, 4, 237. [Google Scholar]
  31. Houghton, R.A. Aboveground forest biomass and the global carbon balance. Glob. Change Biol. 2005, 11, 945–958. [Google Scholar]
  32. Chinasho, A. Carbon Stock in Woody Plants of Humbo Forest and its Variation along Altitudinal Gradients: The Case of Humbo District, Wolaita Zone, Southern Ethiopia. Int. J. Environ. Prot. Policy 2015, 3, 97. [Google Scholar]
  33. Magurran, A.E. Measuring biological diversity. Curr. Biol. 2021, 31, R1174–R1177. [Google Scholar]
  34. Worku, A.; Teketay, D.; Lemenih, M.; Fetene, M. Diversity, regeneration status, and population structures of gum and resin producing woody species in borana, southern ethiopia. For. Trees Livelihoods 2012, 21, 85–96. [Google Scholar]
  35. Amlin, G.; Suratman, M.N.; Isa, N.N.M. Anthropogenic impacts on forest regeneration: Challenges and the way forward. In ISBEIA 2012—IEEE Symposium on Business, Engineering and Industrial Applications; IEEE: Piscataway, NJ, USA, 2012; pp. 158–162. [Google Scholar]
  36. Giri, A.; Katzensteiner, K. Anthropogenic disturbances on the regeneration of tree species in the mixed broadleaved forest of the himalayan region, Nepal. J. Nat. Hist. Mus. 2013, 27, 35–44. [Google Scholar]
  37. Salete Capellesso, E.; Cequinel, A.; Marques, R.; Luisa Sausen, T.; Bayer, C.; Marques, M.C.M. Co-benefits in biodiversity con-servation and carbon stock during forest regeneration in a preserved tropical landscape. For. Ecol. Manag. 2021, 492, 119222. [Google Scholar]
  38. Raich, J.W.; Schlesinger, W.H. The global carbon dioxide flux in soil respiration and its relationship to vegetation and climate. Tellus B 1992, 44, 81–99. [Google Scholar]
  39. Arunrat, N.; Pumijumnong, N.; Sereenonchai, S.; Chareonwong, U. Factors controlling soil organic carbon sequestration of highland agricultural areas in the mae chaem basin, Northern Thailand. Agronomy 2020, 10, 305. [Google Scholar] [CrossRef]
  40. Zhu, B.; Wang, X.; Fang, J.; Piao, S.; Shen, H.; Zhao, S.; Peng, C. Altitudinal changes in carbon storage of temperate forests on Mt Changbai, Northeast China. J. Plant Res. 2010, 123, 439–452. [Google Scholar]
  41. Tadese, S.; Soromessa, T.; Aneseye, A.B.; Gebeyehu, G.; Noszczyk, T.; Kindu, M. The impact of land cover change on the carbon stock of moist afromontane forests in the Majang Forest Biosphere Reserve. Carbon Balance Manag. 2023, 18, 24. [Google Scholar]
  42. Jackson, R.B.; Lajtha, K.; Crow, S.E.; Hugelius, G.; Kramer, M.G.; Piñeiro, G. The Ecology of Soil Carbon: Pools, Vulnerabilities, and Biotic and Abiotic Controls. Annu. Rev. Ecol. Evol. Syst. 2024, 8, 419–464. [Google Scholar] [CrossRef]
  43. Klein, L.J. Urban Forests for Carbon Sequestration and Heat Island Mitigation. 2022. Available online: https://elib.dlr.de/187233/1/Paper_2022_KDD_AI4GoodWorkshop-UrbanForests4CO2SequestrationAndHeatIslandMitigation.pdf (accessed on 18 December 2023).
  44. Chazdon, R.L. Beyond deforestation: Restoring forests and ecosystem services on degraded lands. Science 2008, 320, 1458–1460. [Google Scholar]
Figure 1. Map showing the study area of Entoto Mountain forest with geographical boundaries.
Diversity 17 00225 g001
Figure 2. Climate data of the study area, illustrating average annual temperature and precipitation levels.
Diversity 17 00225 g002
Figure 3. Sampling design for plots and subplots used for trees, seedlings, saplings, litter, and soil sampling.
Diversity 17 00225 g003
Figure 4. Carbon stock distribution in different pools across lower and upper altitudinal zones.
Diversity 17 00225 g004
Figure 5. Human activities in the study area. (A) Firewood collection for cooking, heating, and selling, (B) tree cutting (stump) for timber, and charcoal production, (C) soil excavation for pottery production, (D) illegal settlements in the forest due to population growth, (E) infrastructure development within the forest, (F) road construction within the forest for transportation.
Diversity 17 00225 g005aDiversity 17 00225 g005b
Table 1. Frequency class of each woody plant with their percentage distribution.
Upper Altitude
Species NameRaunkiaer Percentage Frequency ClassPercentage Distribution of Species
Eucalyptus globulus Labill3rd51.46%
Juniperus procera Hoechst. Ex Endl4th36.49%
Acacia decurrens Willd5th10.42%
Olea europaea L. subsp. cuspidate-0.00%
Hagenia abyssinica J.F.Gmel5th1.01%
Acacia melanoxylon R. Br.-0.00%
Schefflera abyssinica (Hochst. ex A. Rich.) Harms-0.62%
Lower altitude
Eucalyptus globulus Labill5th18.32%
Juniperus procera Hoechst. Ex Endl4th27.47%
Acacia decurrens Willd3rd52.35%
Olea europaea L. subsp. cuspidate5th1.07%
Hagenia abyssinica J.F.Gmel-0.20%
Acacia melanoxylon R. Br.-0.59%
Schefflera abyssinica (Hochst. ex A. Rich.) Harms-0.00%
Table 2. Total density of woody plants with their contribution by diameter at breast height (DBH) class size.
DBH ClassTotal Density of SpeciesPercentage DBH Size Distribution of Species
4.5–10 cm5011.99%
10.1–20 cm25561.15%
>20cm11226.86%
Table 3. Contribution of different DBH classes to the total basal area and Importance Value Index of woody plants in the study area.
Species NameTotal Basal Area (m² ha−1) by DBH Class (cm)IVI Components
(%)
(4.5–10)(10.1–20)(>20)RDRFRDoIVIAv.
IVI
Eucalyptus globulus Labill0.112.014.7145.0844.2942.88132.2544.08
Juniperus procera Hoechst. Ex Endl0.111.734.8038.1340.5341.65120.3140.10
Acacia decurrens Willd0.040.521.7514.1512.5414.4841.1713.72
Olea europaea L. subsp. cuspidate0.000.070.000.961.040.422.420.81
Hagenia abyssinica J.F.Gmel0.000.050.000.720.710.341.770.59
Acacia melanoxylon R. Br.0.010.020.000.720.570.201.490.50
Schefflera abyssinica (Hochst. ex A. Rich.) Harms0.110.000.000.240.320.030.590.20
Total0.384.4011.26100100100300100
Table 4. Estimated statistical values of woody plant abundance and distribution.
Species NameSpecies RichnessShannon–Wiener Diversity IndexEvenness
Index
Eucalyptus globulus Labill271.7920.544
Juniperus procera Hoechst. Ex Endl.311.6490.480
Acacia decurrens Willd100.5580.242
Hagenia abyssinica J.F.Gmel20.0400.058
Olea europaea L. subsp. cuspidate10.0450.000
Acacia melanoxylon R. Br.10.0350.000
Schefflera abyssinica (Hochst. ex A. Rich.) Harms10.0140.000
Average total10.8570.5900.187
Table 5. Total density of regeneration status of seedlings, saplings, and trees.
HabitTotal Density of Plant IndividualsPercentage Distribution of Plant Habit
Seedlings11316.84%
Saplings14121.01%
Trees41762.15%
Table 6. Pearson correlation of carbon pool variables with important value index, species diversity, and regeneration pattern status.
n12345678910
1Carbon in Aboveground Biomass35
2Carbon in Belowground Biomass3510.00 **
3Carbon in Litter Biomass350.070.08
4Soil Organic Carbon350.030.020.09
5Total Carbon350.47 **0.46 **0.110.90 **
6Important Value Index350.51 **0.52 **−0.250.150.36 *
7Shannon–Wiener Woody Species Diversity35−0.23−0.23−0.050.130.020.01
8Number of Trees35−0.23−0.23−0.020.130.010.010.91 **
9Number of Saplings35−0.01−0.01−0.39 *−0.02−0.020.43 **−0.34 *−0.36 *
10Number of Seedlings350.250.24−0.210.110.20.46 **−0.12−0.180.34 *
* Denotes statistically significant (p < 0.05); ** denotes statistically significant (p < 0.01).
Table 7. Pearson correlation between species diversity and regeneration pattern status.
n1234
1Shannon–Wiener woody species diversity35
2Number of trees350.91 **
3Number of sapling35−0.34 *−0.36 *
4Number of seedling35−0.12−0.180.34 *
* Denotes statistically significant (p < 0.05); ** denotes statistically significant (p < 0.01).
Table 8. Results of one-way ANOVA for carbon pools across altitudinal gradients.
nMeanSDF-Valuep-Value
CAGB in lower altitude1735.2434.222.5810.314
CAGB in upper altitude1871.1984.0817.6870.055 *
CBGB in lower altitude177.046.852.5650.316
CBGB in upper altitude1814.3716.8417.7330.055 *
CLB in lower altitude170.090.020.9610.621
CLB in upper altitude180.090.040.3610.905
SOC in lower altitude17452.67106.220.6790.737
SOC in upper altitude18486.98197.940.1760.986
* Denotes statistically significant (p < 0.05).
Table 9. Results of one-way ANOVA for forest structure, diversity, regeneration status, and carbon pools with human disturbance index.
nMeanSDF-Valuep-Value
CAGB3553.7366.470.4360.729
CBGB3510.8113.330.4600.712
CLB350.090.030.5530.650
SOC35470.32156.750.5590.646
No. of T3511.913.891.1850.331
No. of SA354.034.911.0490.385
No. of SE353.235.620.5910.626
IVI3510.344.150.8060.500
H’350.110.041.4440.249
Alt352660113.830.1120.953
CAGB, carbon stock in aboveground biomass; CBGB, carbon stock in belowground biomass; CLB, carbon stock in litter biomass; SOC, soil organic carbon; No. of T, number of trees; No. of SA, number of sapling; No. of SE, number of seedling; IVI, important value index; H’, Shannon–Wiener woody species diversity; Alt, altitude.
Disclaimer/Publisher’s Note: The statements, opinions and data contained in all publications are solely those of the individual author(s) and contributor(s) and not of MDPI and/or the editor(s). MDPI and/or the editor(s) disclaim responsibility for any injury to people or property resulting from any ideas, methods, instructions or products referred to in the content.

