Abstract
China has significant mineral resources, but prolonged extraction has caused considerable environmental degradation. Interactions among rhizosphere, phyllosphere, and soil microorganisms, along with host plants, are essential for supporting plant growth and increasing stress tolerance. This study employed high–throughput sequencing to assess microbial diversity and community structure related to four common tree species in the mountainous areas of Shanxi Province, with samples collected from three regions over two seasons and three locations. The dominant fungal and bacterial phyla identified were Ascomycota, Basidiomycota, Mortierellomycota, Pseudomonadota, Actinobacteriota, Gemmatimonadota, Acidobacteria, Myxococcota, and Firmicutes. Alpha–diversity analysis revealed that Taiyue Mountain exhibited the highest fungal diversity among the plots, while Liushenyu displayed the highest bacterial diversity. Alpha–diversity was greater in spring than in summer across the seasons. Significant differences in Alpha–diversity were observed among different tree species, with Betula platyphylla showing the lowest diversity. In comparison to phyllosphere microorganisms, rhizosphere and soil microorganisms exhibited higher diversity, richness, and evenness. Beta–diversity analysis indicated significant differences in fungal and bacterial community composition between spring and summer samples, as well as among samples from leaves, roots, and soil. The assessment of soil physicochemical properties and redundancy analysis demonstrated that soil moisture content and organic matter were key factors influencing the composition of fungal and bacterial communities. These findings provide valuable insights into the structural changes in plant microbial communities in mining areas and the restoration of damaged ecosystems.
1. Introduction
China stands as a leading coal–producing nation globally, with annual output accounting for over 50% of the world’s total [1,2]. Coal production serves as a pivotal driver in sustaining China’s national economy [3,4]. In the Shanxi Province, the region with the most abundant coal reserves in China, raw coal production reached 1.36 billion tons in 2023, representing 29.12% of the nation’s total output [5,6]. With rapid industrialization and urbanization, prolonged high–intensity coal extraction has triggered a cascade of ecological degradation [7]. During coal mining processes, substantial quantities of slag, waste gas, and dust are generated, disseminating through physical, biological, and chemical pathways to contaminate surrounding soil, water systems, and atmospheric environments [8]. The ecological consequences of mining activities on microbial communities have been extensively documented in China’s mineral–rich regions such as Inner Mongolia and Northern Shaanxi [9,10]. For example, Song et al. reported that mining–induced fissures modify soil microbial abundance through variations in horizontal distance and vertical depth relative to fracture zones. Maximum microbial depletion occurred at 60 cm vertical depth and 20 cm horizontal distance from fissures, exhibiting 36.68% and 41.22% reductions in bacterial and fungal populations, respectively, compared to controls [10]. Consistently, a UK–based study revealed that decade–long mining disturbances eradicated rare microbial taxa through heavy metal accumulation, culminating in drastic declines in bacterial diversity [11]. Such perturbations not only diminish microbial biomass and soil biodiversity but also propagate ecological risks through bioaccumulation in food chains, compromising human health [12,13]. The production value and social service functions of mining areas have been severely affected for an extended period, posing a threat to ecological security [14,15].
Accumulating evidence demonstrates that plant––microbe synergistic remediation constitutes a paramount strategy for mitigating environmental contamination [16,17]. Bioremediation is prioritized for its minimal ecosystem disruption, reduced secondary pollution risks, and cost–effectiveness [18], positioning it as an eco–sustainable soil restoration approach [19]. Notably, this technology has evolved into a dominant method for rehabilitating mining–area soils, demonstrating enhanced remediation efficacy [20,21]. Nevertheless, challenges persist in optimizing microbial consortia and standardizing implementation protocols [22].
Rhizosphere and phyllosphere microorganisms constitute fundamental components of plant–associated microbial communities, modulating plant physiology and soil properties [23,24]. Plant roots reconfigure the metabolism and population structure of rhizospheric microbial communities through secretory compounds, exudates, and residues, thereby reciprocally modifying the rhizospheric soil environment [25,26]. Rhizosphere microbiota are regulated by abiotic drivers (e.g., climatic conditions, fertilization practices) [27,28,29] and biotic processes, including interspecies competition and symbiotic relationships [30,31]. Importantly, plant developmental stages exert critical control over the assembly of rhizosphere microbial communities [32]. Phyllosphere microorganisms mediate microenvironmental adaptations, enhance plant growth, and catalyze pollutant degradation [33,34]. Environmental perturbations reconfigure phyllosphere microbial community structures, thereby modulating plant heavy metal uptake efficiency [35,36]. These epiphytic communities decontaminate foliar surfaces via heavy metal biosorption and biochemical transformation [37,38]. Contemporary studies confirm that phyllosphere microbial assemblages are shaped by plant species identity, seasonal dynamics, and habitat–specific ecological parameters [39,40,41,42].
Soil microorganisms execute pivotal functions in sustaining soil ecology and facilitating heavy metal remediation through enzymatic catalysis, thereby promoting nutrient cycling and preserving soil health [43,44]. Their functional repertoire encompasses carbon, nitrogen, and phosphorus cycling; organic matter decomposition; soil enzyme activity maintenance; and augmentation of soil ecological services [45,46,47]. Notably, alterations in soil microbial community structure and metabolic network functionality represent sensitive biomarkers for tracking soil quality dynamics [48]. Empirical evidence substantiates that microbial impacts on soil systems are predominantly manifested through taxonomic composition disparities and functional metabolic heterogeneity [49].
Mining induces fractures, and improper waste disposal near sites exacerbates surface subsidence, and soil–water–air pollution, leading to severe forest ecosystem degradation. Drastic habitat changes and microbial sensitivity to environmental shifts may severely reduce microbial populations. Studies confirm microorganisms are key bioindicators for ecological health assessment [50,51]. However, their sheer abundance, diversity, and complex networks hinder environmental risk evaluations. The intricate interactions among vegetation, soil, and microbes require clarifying interdependencies to guide mining–area restoration strategies. To resolve this, studies must prioritize microbial distribution, biodiversity shifts, interactions, and environmental drivers. Here, we analyzed microbial communities via high–throughput sequencing of 108 samples from two mining sites and one control site in Qinyuan County, Shanxi. We investigated linkages between rhizosphere/phyllosphere microbes, vegetation, and environmental factors. We propose that pollution and degradation near mines reduce microbial diversity, weakening soil–vegetation functions. Additionally, we assess whether specific environmental factors significantly alter microbial communities.
2. Materials and Methods
2.1. Site Description
The research area was situated in Qinyuan County, central southern Shanxi Province, at the eastern foot of Taiyue Mountain and northwest of Changzhi City (36°20′20″–37°00′42″ N, 111°58′30″–112°32′30″ E) [52]. The forest coverage rate in Qinyuan County reaches 55.3%, ranking first in the city [53]. Qinyuan County is rich in diverse and widely distributed mineral resources, primarily including coal, iron, bauxite, and limestone [54]. It has the highest number of mines in Changzhi City, resulting in significant land degradation due to mining activities (For a detailed description of the sampling sites, refer to the Supplementary Materials) [55].
The following sampling scheme is designed based on the actual conditions of the sampling area: This study selected three sampling points. Sampling point one is the Coal Preparation Plant of Shanxi Qinxin Energy Group Co., Ltd. (hereinafter referred to as Xuanmeichang, X), located in Hanjiagou Village, Liyuan Town, which was established in 2006. Its head office, Shanxi Qinxin Energy Group Co., Ltd., which is located in Hanjiagou Village, Qinhe Town, is a leading enterprise in Qinyuan County. Since its establishment, it has produced over 100 million tons of coal. Sampling point two is Shanxi Tongzhou Group Liushenyu Coal Industry Co., Ltd. (hereinafter referred to as Liushenyu, Y), located in Shangzhuang Village, Qinhe Town, which commenced operations in 2010 and has an annual output of 1.2 million tons of washed raw coal. Thus, the analysis also provides insights into the impact of mining duration. Based on the findings from field interviews, a significant amount of coal gangue is being dumped in the forests near the mining area. The mountains surrounding the gangue disposal sites and the piles of gangue are bare, while a layer of black soil covers the yellow earth in the forest. During windy weather, the black coal ash is raised into the air, resulting in severe dust pollution. This not only negatively affects the surrounding ecological environment but also impacts the health of local residents. Therefore, we can also gain insights into the impact of mining duration. Sampling point three is the Shanxi Taiyue Mountain Forest Ecological Positioning Observation and Research Station of Beijing Forestry University (hereinafter referred to as Taiyueshan, T), located in Lingkong Mountain Forest Farm under the Qinyuan County Taiyue Mountain Forest Management Bureau. This site serves as a National Nature Reserve in Shanxi Province and acts as a control group for the two mining areas.
Due to the insufficient growth of Populus davidiana and Ulmus pumila in the selected plots, contrary to our expectations, we adjusted our sampling scheme to include the dominant tree species. The final sampling scheme is as follows: in plot X, we selected Ulmus pumila and Betula platyphylla; in plot L, we selected U. pumila and Populus davidiana; and in plot T, we selected P. davidiana and Juglans mandshurica. Because the tree species we have selected are all deciduous, sprouting leaves in spring but shedding them entirely by autumn and winter, we opted not to conduct research during the autumn and winter seasons.
2.2. Sample Collection
Samples were collected in spring and summer in Qinyuan County, Changzhi City, Shanxi Province. In the process of collecting soil samples, the initial step involved the removal of the surface litter layer, and then a soil core extending from 0 to 20 cm in depth was extracted using a soil drill. The five–point sampling method was employed to homogenize and composite the soil samples, which were then placed into self–sealing bags, labeled, and stored in an insulated box. For the collection of leaves, trees spaced approximately 20 m apart and exhibiting robust growth characteristics were selected. Leaves were uniformly selected from various parts of the collected trees, removed, placed in self–sealing bags, labeled, and stored in insulated boxes. When collecting rhizosphere soil, after removing the litter layer, the lateral roots along the base of the tree trunk and the fine roots along the direction of lateral root growth. After shaking off the loose soil, the soil attached to the roots was gently brushed with a sterile soft–bristled brush as the rhizosphere soil sample. The rhizosphere soil samples were thoroughly mixed, placed in a self–sealing bag, labeled, and placed in an insulated box. Three biological replicates were used for each sample.
2.3. Soil Physicochemical Analyses and High–Throughput Sequencing
Soil pH was measured using a pH meter (PHS–3C) with a soil–to–water mass ratio of 1:2.5. Total nitrogen (TN) was quantified using the Kjeldahl method [56]. Soil Organic matter (SOM) was assessed using the potassium dichromate heating method [57,58]. Available phosphorus (AP) was measured using the molybdenum–antimony colorimetric method [59]. Cation exchange capacity (CEC) was determined using the ammonium acetate exchange method, and soil water content (SWC) was assessed using the gravimetric method [57,60].
DNA was extracted from 108 samples using the MagBeads FastDNA Kit for Soil (MP Biomedicals, Santa Ana, CA, USA) following the manufacturer’s instructions. The samples were stored at −20 °C until needed for PCR amplification. The ITS1 region was amplified for fungal DNA, while the 16S V5–V7 variable region was amplified for bacterial DNA. The PCR thermal cycling conditions were based on the methods described by Yang et al. [61]. Subsequently, the amplicons underwent extraction, purification, and quantification, and were then subjected to paired–end sequencing on an Illumina MiSeq platform (MiSeq–PE250, Personalbio, Shanghai, China).
2.4. Statistical Analysis
After a quality screening of the original sequences, QIIME 2 was employed to perform sample splitting, quality control, chimerism removal, and denoising on the raw offline data. The sequences were clustered into feature sequences (Amplicon Sequence Variants, ASVs) based on the principle of 100% similarity. Fungal taxonomy was annotated using the UNITE database, while bacterial taxonomy was annotated using the SILVA database (version 138). Taxonomic assignment was performed using the sklearn algorithm within QIIME 2, with a confidence threshold set at 0.7. The raw sequencing data have been uploaded to the National Center for Biotechnology Information (NCBI) in the United States (Accession Number: PRJNA1225013). The comparison of microbial community Alpha–diversity indices was conducted using the Kruskal–Wallis rank sum test. Compositional differences in fungal and bacterial communities across different groups were assessed using species community composition bar charts (at the phylum level), association network analysis (at the phylum level), LEfSe analysis, and cluster heatmaps (at the genus level). Additionally, beta–diversity among different species was evaluated based on Bray–Curtis distance. A one–way ANOVA of soil physicochemical factors was performed using SPSS (version 26.0), and redundancy analysis was conducted to analyze the correlation between microbial populations and soil physicochemical factors. The results were visualized using R (4.3.3), GraphPad Prism (9.0.1), Personalbio gene cloud platform (https://www.genescloud.cn/, accessed on 12 July 2024), Chiplot (https://www.chiplot.online/index.html, accessed on 23 July 2024), etc.
3. Results
3.1. Sequencing
In all sample tests, a total of 9,087,842 valid sequences were obtained from fungal samples, and a total of 16,570 feature sequences (ASVs) were identified through 100% similarity clustering. Additionally, 7,111,047 valid sequences were obtained from bacterial samples, resulting in a total of 54,814 ASVs. The dilution curves for fungal and bacterial samples indicated that the curves became smoother with increasing sequencing depth, suggesting that the experimental sequencing depth was sufficient to support subsequent analyses (Figure S1).
Bacterial amplicon sequence variants (ASVs) exhibited higher abundance compared to fungal counterparts. The maximum ASVs for both fungi and bacteria were recorded in plot T, whereas plot X showed the lowest values. Interspecific variations in ASV richness were observed, with J. mandshurica displaying the minimum ASVs across all tree species. Seasonal comparisons revealed elevated ASVs in spring relative to summer for both microbial groups. Notably, spring fungal samples contained 3.2-fold more ASVs than summer samples, while bacterial samples demonstrated a 2.25-fold increase in spring. Regarding sampling niches, soil samples yielded the highest ASVs richness for both fungi and bacteria, followed by rhizosphere communities, with the lowest ASVs observed in phyllosphere samples (Figure 1).
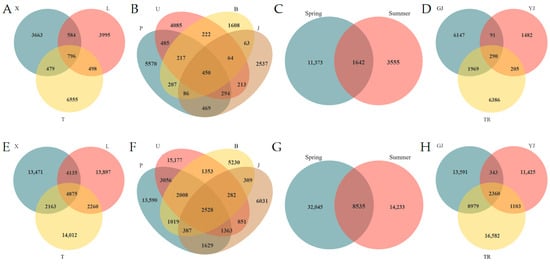
Figure 1.
ASVs–based Venn diagrams of fungi (A–D) and bacteria (E–H) in different groups. Different sampling plots (A,E), different tree species (B,F), different seasons (C,G), and different sampling locations (D,H). GJ: sampling from rhizosphere; YJ: sampling at the phyllosphere; TR: sampling from soil. Same below.
3.2. Microbial Alpha–Diversity
Alpha–diversity index analysis was conducted on samples categorized by different criteria. In fungal samples from various plots, the Chao 1, Pielou’s evenness index, and Shannon index were the highest in plot T, followed by plot L, with the lowest values in plot X. For bacterial samples, both the Chao 1 and Shannon indices were the highest in plot L, followed by plot X, and the lowest in plot T. Pielou’s evenness index was the highest in plot L, intermediate in plot T, and the lowest in plot X, though the differences were not statistically significant.
Among fungal samples from different tree species, Chao 1 showed the following descending order: B. platyphylla > P. davidiana > U. pumila > J. mandshurica. The Pielou’s evenness and Shannon indices followed the order P. davidiana > B. platyphylla > U. pumila > J. mandshurica. For bacterial samples, the Chao 1 mirrored the fungal pattern, while the Pielou’s evenness index ranked, while the Pielou’s evenness index ranked B. platyphylla > U. pumila > P. davidiana > J. mandshurica, and the Shannon index was ordered as U. pumila > B. platyphylla > P. davidiana > J. mandshurica. Although variations in the Alpha–diversity indices were observed among tree species, J. mandshurica consistently displayed the lowest values across all indices, indicating minimal microbial diversity.
In fungal samples collected across seasons, all three diversity indices were significantly higher in spring than in summer, with the Chao 1 and Shannon indices showing statistically significant increases. For bacterial samples, both the Chao 1 and Shannon indices were also higher in spring compared to summer; however, Pielou’s evenness index was elevated in summer, albeit without statistical significance.
Across sampling locations, the three indices were significantly higher in rhizosphere and soil samples than in phyllosphere samples, with no significant differences between rhizosphere and soil (Table 1, Figure S2).

Table 1.
Alpha–diversity index of different groups.
3.3. Microbial Community Structure
3.3.1. Microbial Community Composition at Phylum Level
This study employed relative abundance (RA) to assess the abundance of different taxonomic units across various taxonomic levels within the fungal community composition. Following statistical analysis of the species composition at these levels, a total of 18 phyla, 76 classes, 197 orders, 502 families, and 1263 genera were identified from the fungal samples. The dominant phyla (phyla with a relative abundance greater than 1%) included Ascomycota (68.81%), Basidiomycota (18.92%), and Mortierellomycota (2.23%). Bacterial samples were identified across 31 phyla, 82 classes, 197 orders, 349 families, and 818 genera. The most abundant phyla included Pseudomonadota (67.33%), Actinobacteria (15.80%), Gemmatimonadota (4.92%), Acidobacteria (4.18%), Myxococcota (2.35%), and Firmicutes (1.51%).
Analysis of the dominant fungal phyla at different sampling locations revealed that the predominant fungal phyla in plots X, L, and T were Ascomycota, Basidiomycota, and Mortierellomycota as predominant phyla, with statistically comparable proportions. The dominant bacterial phyla in plots X and L included Pseudomonadota, Actinobacteria, Gemmatimonadota, Acidobacteria, Myxococcota, and Firmicutes, whereas plot T exhibited distinct dominance of NB1–j (1.40%) and Desulfobacterota (1.33%). Notably, plot T contained significantly higher proportions of unclassified fungi and bacteria (categorized as “Others”), suggesting enhanced microbial diversity in this habitat. The interspecific comparison demonstrated that P. davidiana, U. pumila, and J. mandshurica shared identical dominant fungal and bacterial phyla profiles, whereas B. platyphylla displayed divergent bacterial phyla composition with increased diversity. Seasonal dynamics analysis indicated that summer samples harbored a significantly richer assemblage of dominant fungal phyla compared to spring, though bacterial phyla composition remained consistent between seasons. The dominant fungal phyla in the rhizosphere and soil samples were found to be similar and in comparable proportions, with Basidiomycota and Mortierellomycota being more abundant than in the phyllosphere. The dominant bacterial phyla were more abundant in soil samples than in rhizosphere samples, which in turn were more abundant than in phyllosphere samples. It is noteworthy that 91.58% of the phyllosphere samples comprised Pseudomonadota (Figure 2, Tables S1 and S2).
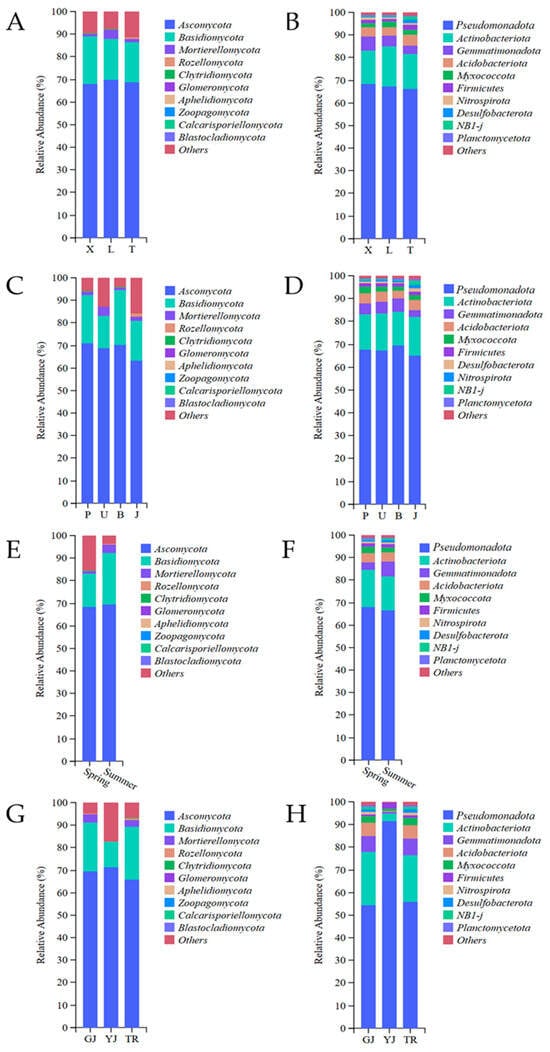
Figure 2.
Relative abundance of fungi (A,C,E,G) and bacteria (B,D,F,H) in different groups at the phylum level. Different sampling plots (A,B), different tree species (C,D), different seasons (E,F), and different sampling locations (G,H).
Network analysis revealed that in the fungal samples, the predominant phyla were Ascomycota, Mortierellomycota, and Basidiomycota. In contrast, the bacterial community was primarily composed of Pseudomonadota, Actinobacteria, Gemmatimonadota, Acidobacteriota, Myxococcota, Desulfobacterota, Nitrospirota, Planctomycetota, NB1–j, and Firmicutes (Figure S3).
3.3.2. LEfSe Analysis
LEfSe analysis was performed on the fungal and bacterial samples from different plots, selecting groups with an LDA score greater than 4 as indicators of significant differences. In the fungal samples, the characteristic indicator taxa for the X plot included Taphrinomycetes, Helotiales, Taphrinales, Tremellales, Leotiomycetes, Taphrinaceae, Taphrina, Ceratobasidaceae_gen_Incertae_sedis, Bulleribasidaceae, and Inocybe. The L plot was characterized by Tremellomycetes and Nothophoma, while the T plot included Trechisporales, Hydnodontaceae, Subulicystidium, and Fungi_gen_Incertae_sedis. In the bacterial samples, characteristic species were identified only from the X and L mining areas. Notably, Sphingomonas was a characteristic indicator in the X plot, while Beijerinckiaceae, Oxalobacteraceae, and Massilia were characteristic indicators in the L mining area (Figure 3).
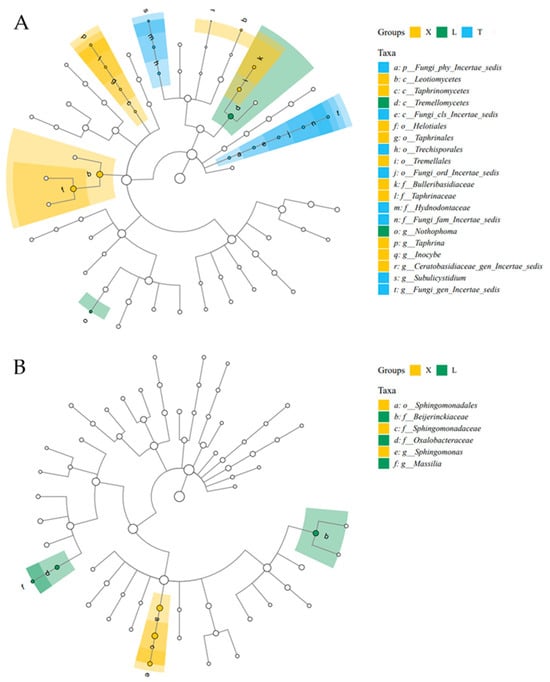
Figure 3.
Analysis of LEfSe species differences in microbial communities of fungi (A) and bacteria (B) at different sampling plots.
3.4. Microbial Beta–Diversity
Principal coordinate analysis (PCoA) and non–metric multidimensional scaling (NMDS) were used to analyze the community structure differences in fungal and bacterial samples across four distinct groups. Both analyses revealed no significant differences in community compositions among the various plots and tree species. However, seasonal variation showed a distinct separation between the fungal and bacterial community compositions of spring and summer samples. In terms of sampling locations, significant separation was observed among rhizosphere, soil, and phyllosphere samples, although rhizosphere and soil samples exhibited some overlap. PCoA explained 12.3% of the variation in fungal samples, with PCo1 accounting for 7.3% and PCo2 for 5%. In bacterial samples, 28.3% of the variation was explained, with PCo1 accounting for 19.8% and PCo2 for 8.5% (Figure 4 and Figure S4).
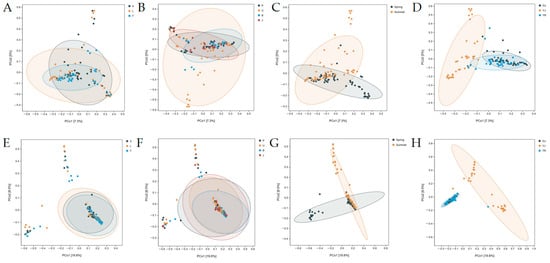
Figure 4.
Microbial community PCoA analysis based on Bray–Curtis distance matrix of fungi (A–D) and bacteria (E–H) in different groups. Different sampling plots (A,E), different tree species (B,F), different seasons (C,G), and different sampling locations (D,H).
3.5. Environmental Determinants of Microbial Community Structures
3.5.1. Soil Properties
Analysis of physicochemical indicators revealed that the pH values of the X, L, and T plots were similar, while total nitrogen (TN), organic matter (OM), available phosphorus (AP), and cation exchange capacity (CEC) were significantly higher in the T plot compared to the X and L plots. In spring, TN and OM levels were higher than in summer, whereas pH, AP, CEC, and soil water content (SWC) were slightly lower than in summer (Table 2).
Table 2.
Physicochemical parameters of soil samples X, L, and T.
3.5.2. Relationship Between Microbial Community Structure and Soil Properties
The results indicated a positive correlation among TN, OM, AP, CEC, and SWC within the soil physicochemical indicators. Additionally, a significant correlation was found between the Alpha–diversity indices of fungi and bacteria, as well as with the dominant bacterial genera; however, no significant correlation was observed with the dominant fungal genera (Figure S5, Table S3).
To investigate the impact of soil physicochemical factors on microbial community structure, redundancy analysis (RDA) was applied. RDA effectively elucidated the correlation between bacterial community composition and soil physicochemical factors, as well as the relationships between dominant genera in fungal and bacterial communities and these properties at the genus level. For fungal samples, the first sorting axis explained 6.65% of the variance, while the second sorting axis explained 5.27%. SWC emerged as the most significant physicochemical indicator affecting fungal community composition, with the genera Solicoccozyma, Fusarium, and Arxiella showing strong correlations with both the fungal community structure and soil physicochemical factors. In bacterial samples, the first sorting axis explained 26.01% of the variance, and the second sorting axis explained 4.1% (Figure 5). OM was identified as the most influential physicochemical factor affecting bacterial community composition, with the genera Sphingomonas, MB–A2–108, and Ellin6067 demonstrating strong correlations with bacterial community structure and soil physicochemical factors. Analysis of the correlation between soil physicochemical factors and the RDA coordinate axes revealed negative correlations between pH and OM, TN, CEC, and SWC.
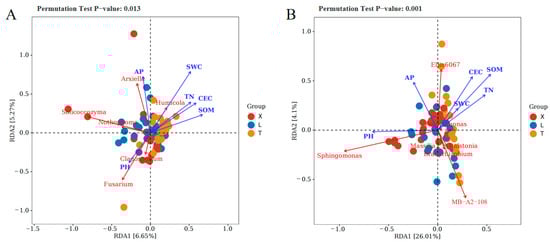
Figure 5.
Redundancy analysis of the top 10 relative abundances of community genera and soil physicochemical indicators of fungi (A) and bacteria (B).
4. Discussion
4.1. Differences in Microbial Diversity in Different Groups
As delineated by the Venn diagram analysis, plot T demonstrated the highest endemic ASVs richness in both fungal and bacterial communities, indicating superior microbial uniqueness relative to plots X and L. Consistent with this pattern, α–diversity indices (Chao1, Pielou’s evenness, Shannon) exhibited a clear hierarchical gradient for fungal communities: T > L > X. Bacterial communities, conversely, displayed negligible inter–plot variations in α–diversity indices. Ecologically, plot T’s location within Lingkong Mountain National Nature Reserve (Taiyue Mountain Forest Management Bureau, Qinyuan County)—characterized by preserved vegetation and minimal anthropogenic disturbance—likely supported microbial uniqueness. In contrast, plots X and L in coal mining areas displayed reduced unique microbial taxa, potentially linked to mining impacts. Plot X showed marginally lower unique ASV diversity than plot L, possibly reflecting its longer mining history and associated ecological stress. Notably, bacterial communities demonstrated comparable α–diversity metrics between disturbed and undisturbed plots. This observation aligns with prior investigations in the Pingfeng mining area, where rhizosphere soils of three pioneer plant species displayed significantly elevated microbial richness and Shannon diversity indices relative to undisturbed ecosystems (agricultural, forest, desert), demonstrating negligible growth inhibition despite heavy metal contamination [51]. Additionally, long–term adaptation of microorganisms to heavy metals in polluted environments has been associated with greater community diversity compared to unpolluted areas [62].
Previous studies have demonstrated that tree species significantly influence microbial community structure [63], and even different varieties of the same species can exhibit varying levels of microbial diversity [64]. The substantial differences among tree species may be attributed to species–specific characteristics, leaf and root secretions, and other factors, indicating that tree species are significant determinants of microbial community abundance. In our study, however, the Alpha–diversity among the four tree species did not show significant differences. Similarly, a study investigating the effects of nitrogen on the microbial foliar community structure found comparable results [65]. This study, conducted over a two–year field trial in a commercial environment, examined the bacterial and fungal communities in baby leaf spinach (Spinacia oleracea) and arugula (Diplotaxis tenuifolia) and also found no significant differences in Alpha–diversity between the two crops.
Seasonal analysis revealed that the ASVs in both fungal and bacterial communities were significantly elevated in spring compared to summer, a pattern concordant with α–diversity index trends. This phenomenon could be attributed to suboptimal summer conditions, including extreme thermal stress and precipitation–driven habitat instability [66], which may impede microbial niche specialization. Conversely, spring provided corroborated prior evidence identifying seasonal dynamics as a key determinant of microbial community structure and functional diversity [67].
In terms of sampling locations, rhizosphere, and soil samples exhibited higher unique ASVs, as well as greater bacterial and fungal diversity, richness, and evenness compared to leaf samples [68]. The research findings additionally indicated that the Shannon index, Chao 1, and Pielou’s evenness index were generally lower in leaf samples compared to soil samples, which is consistent with the results reported by Bao et al. [69]. This study characterized the shared microbiome of the phyllosphere and rhizosphere among three plant species (Ipomoea pescaprae, Wedelia chinensis, and Cocos nucifera) to gain insights into the relationships between bacteria (including diazotrophic bacteria) and fungi present in these host plants. The results indicated that for the same plant species, the three microbial indices (Chao1, Shannon, and Heip’s evenness index) were generally lower in the phyllosphere samples compared to the soil samples. This may be attributed to the unstable living environment of phyllosphere microorganisms, which are significantly affected by environmental changes such as ultraviolet radiation and temperature fluctuations, making survival more challenging. Conversely, the living environments of rhizosphere and soil microorganisms are relatively stable [70,71]. Since the living conditions for rhizosphere microorganisms are similar to those of soil microorganisms, no significant differences in the diversity of bacteria and fungi were observed.
The results of the β-diversity analysis revealed distinct community compositions of fungal and bacterial samples between spring and summer. Additionally, samples collected from different locations, specifically the phyllosphere, rhizosphere, and soil, exhibited separate community compositions. These findings indicate significant differences in the community structures of fungi and bacteria across seasons and sampling locations. However, the overlapping compositions of fungi and bacteria across various plots and tree species suggest that their community structures are similar regardless of these factors. These results align with the Alpha–diversity analysis, highlighting that both season and sampling location are critical factors influencing community structure.
4.2. Differences in Microbial Community Composition in Different Groups
At the phylum level, the dominant fungal phyla in all three regions were Ascomycota, Basidiomycota, and Mortierellomycota, which is consistent with the findings of several previous studies [72,73]. Ascomycota and Basidiomycota are the primary decomposer communities in soil, with Ascomycota predominantly consisting of saprophytic fungi that can decompose recalcitrant organic matter, while Basidiomycota includes many saprophytic or parasitic species that decompose lignocellulosic materials in moist soils. Wu et al. found that Mortierellomycota prefers to grow in low–nitrogen soils; however, this preference was not evident in our study results [74]. In different tree species, besides the common dominant fungal phyla, J. mandshurica also exhibited an additional abundant phylum, Rozellomycota. In the study by Chen et al., the soil fungal communities were primarily composed of Ascomycota, Basidiomycota, unclassified fungi, Mortierellomycota, and Rozellomycota [75]. Rozellomycota is largely parasitic within the cells of chytrids, algae, or oomycetes; while it possesses high biodiversity, it remains poorly characterized [76]. The higher relative abundance of Rozellomycota in Juglans mandshurica may be attributed to a more favorable surrounding environment for Rozellomycota survival or may be related to the specific characteristics of the tree species.
Pseudomonadota and Actinobacteriota are the dominant bacterial phyla shared across multiple groups. Research indicates that Pseudomonadota exhibit strong environmental adaptability, metabolizing various organic compounds and thriving under diverse conditions, making them the most abundant and metabolically diverse bacterial phyla in the environment [77]. Studies have also shown that Pseudomonadota can tolerate heavy metals, such as copper [78]. Due to the potentially unstable living conditions of phyllosphere microorganisms, Pseudomonadota exhibit strong environmental adaptability, which provides them with a competitive advantage in various ecological niches. Consequently, Pseudomonadota comprised 91.58% of the phyllosphere samples [70,71]. Within the Pseudomonadota, genera such as Sphingomonas, Ralstonia, Bradyrhizobium, Pseudomonas, Massilia, and Roseomonas significantly contributed to this trend (Table S5). Actinobacteria facilitate the decay of animal and plant residues in soil, playing a crucial role in organic matter mineralization and enhancing soil nutrients [79]. Additionally, Gemmatimonadota is a dominant bacterial phylum in arid regions, capable of adapting to extreme environments, including water scarcity [80]. The abundance of Acidobacteria was slightly higher in the X and L plots compared to the T plot, despite soil moisture testing indicating poor moisture conditions in plots X and L. Acidobacteria thrive in oligotrophic environments, enhance soil acidity, and adapt well to the complex conditions found in mining areas [81]. This phylum was highly abundant across all groups. Research has demonstrated that Myxococcota can stably exist in sewage treatment processes and are a dominant bacterial type, potentially playing a crucial role in degrading harmful substances in sewage [82]. They also exhibit characteristics such as antibiotic secretion and tolerance to harsh environments [83]. Firmicutes are known for their resistance to dehydration and extreme environmental conditions; they are widely present in various samples and play a significant role in the structure and function of microbial communities. The phylum NB1–j was abundant in B. platyphylla trees and soil samples from the T plot, consistent with previous research. However, this group is more suited to deep–sea sediments and cannot be cultured [84,85]. Desulfobacterota were relatively abundant in the T plot and in association with B. platyphylla. Studies indicate that this phylum plays potential central roles in the mercury cycle and is also related to sulfide oxidants, suggesting metabolic associations within sulfur cycling [86]. The abundance of Nitrospirae was notably high in B. platyphylla, and research indicates that this group is primarily distributed in marine and terrestrial underground environments. Its physiological functions include hydrogen oxidation, sulfate reduction, nitrate reduction, and sulfur disproportionation [87]. Seasonal changes, plant types, and sampling locations can influence the richness of dominant fungi, while variations in sampling plots, plant types, and locations affect the richness of dominant bacteria.
4.3. Drivers of Microbial Diversity Across Different Groups
High–quality soil is essential for plant growth and development, with soil physicochemical properties serving as key indicators of soil quality. Important soil properties include pH, TN, OM, AP, CEC, and SWC. These properties not only influence nutrient availability but also significantly affect plant responses to biotic and abiotic stresses and the structure of soil microbial communities [62]. Overall, among the three regions, the soil conditions in plot T are significantly superior to those in plots X and L. This indicates that the enterprises have overlooked fundamental ecological protection during coal mining, resulting in a depletion of soil nutrients. Furthermore, the majority of soil in the control group contains higher levels of nitrogen, phosphorus, and other nutrients, whereas the soil layers of the mountainous areas after mining exhibit a decline in these essential nutrients [88].
The physicochemical properties of soil are crucial for microorganisms as well. Correlation analysis revealed that soil TN, OM, AP, CEC, and SWC were positively correlated, while pH showed a negative correlation. Significant correlations were observed between soil physicochemical indicators and the Alpha–diversity indices of fungi and bacteria, as well as with the top 10 genera of bacterial abundance; however, no significant correlation was found with the top 10 genera of fungal abundance. RDA indicated that SWC was the most significant physicochemical factor affecting fungal community composition. This may be attributed to the rapid response of soil microorganisms to changes in moisture content, which alters community composition and structure to adapt to environmental conditions. For bacterial samples, soil OM emerged as the most influential physicochemical factor. This influence may stem from soil organic matter’s ability to absorb complex heavy metals, thereby affecting their migration and transformation, as well as the soil microbial environment through changes in physical soil properties. Some studies suggest that soil microorganisms drive soil organic carbon mineralization, relying on carbon sources provided by the soil for cell synthesis, reproduction, and decomposition, thus playing a key role in nutrient cycling within soil ecosystems [89]. Microorganisms demonstrate the capacity to adapt to specific soil environments through structural modifications, showcasing significant resilience under adverse conditions. This study elucidates the environmental and microbial impacts of coal mining areas, examines the similarities and differences in microbial community structures across various tree species, seasons, and sampling locations, enhances the understanding of plant–microbe–environment interactions, and provides a theoretical foundation for ecological restoration in mining areas.
5. Conclusions
This study investigated the diversity patterns and driving factors of fungi and bacteria in the rhizosphere, phyllosphere, and soil across various mining areas, four tree species, and two seasons in Qinyuan County, Shanxi Province. The results indicate that coal mining significantly depletes soil nutrients and diminishes the diversity of endemic microbial species, with the severity of this impact increasing over the duration of mining activities. The effect of coal mining on fungi was notably greater than on bacteria, although this difference was not statistically significant. Seasonal variations significantly influenced the separation of fungal and bacterial communities, with both fungal and bacterial diversity being substantially higher in spring compared to summer, particularly for fungi. Additionally, microbial diversity was significantly greater in the rhizosphere and phyllosphere than in the surrounding soil, with bacteria exhibiting a more pronounced presence. Overall, bacterial diversity was significantly higher than that of fungi, and SWC emerged as a primary driving factor for fungal diversity and community structure. Additionally, OM was identified as an important driver of bacterial diversity and community structure. This study underscores the importance of investigating microbial diversity for maintaining ecological balance and functional stability in changing environments, highlighting its critical role in ecological restoration.
We acknowledge that there are certain limitations and constraints that may affect the interpretation and generalizability of our research findings. First, our study is limited to three regions within Qinyuan County, which may restrict the generalizability of the results. Second, although the samples were collected from three regions and across two seasons, the number of sampling points and the uniformity of their spatial distribution may be insufficient, potentially impacting the reliability and comprehensiveness of the results. Furthermore, while the study took into account the physicochemical properties of the soil, other environmental factors were not adequately addressed, which may also influence the structure of microbial communities.
Supplementary Materials
The following supporting information can be downloaded at https://www.mdpi.com/article/10.3390/d17030199/s1. Site description, sample naming. Figure S1. Rarefaction curves of microbial species at different sampling plots, fungal samples (A), and bacterial samples (B); Figure S2. Alpha–diversity index of fungi (A–C) and bacteria (D–F) for different groups. Chao l (A,D), Pielou’s evenness (B,E), Shannon indices (C,F). The numbers in the box plot represent the p-values of the Kruskal–Wallis test, and *** indicates significant differences between groups (Kruskal–Wallis, p < 0.05); Figure S3. Horizontal correlation network analysis of fungi (A) and bacteria (B); Table S1. Percentage of fungal phyla in different groups; Table S2. Percentage of bacterial phyla in different groups; Figure S4. Microbial community NMDS analysis based on Bray–Curtis distance matrix of fungi (A–D) and bacteria (E–H) in different groups. Different sampling plots (A,E), different tree species (B,F), different seasons (C,G), and different sampling locations (D,H); Table S3. Correlation analysis of soil physicochemical indicators; Figure S5. Correlation analysis of soil physicochemical indicators and mantle analysis of the top 10 genera in terms of Alpha–diversity index and abundance of fungal and bacterial communities. The size of the squares in the image represents the magnitude of the correlation between the physicochemical factors; and the Microbial Community Composition at the Genus Level; Microbial community composition at genus level; Figure S6. Relative abundance of fungi (A,C,E,G) and bacteria (B,D,F,H) in different groups at the genus level; Different sampling plots (A,B), different tree species (C,D), different seasons (E,F), and different sampling locations (G,H); Table S4. Percentage of fungal genus in different groups; Table S5. Percentage of bacterial genus in different groups; Figure S7. Heat map of top 20 genera in relative abundance of fungi (A–D) and bacteria (E–H) in different groups. Different sampling plots (A,E), different tree species (B,F), different seasons (C,G), and different sampling locations (D,H).
Author Contributions
Conceptualization, Y.Y., X.Z., Y.C. and A.Y.; methodology, Y.Y. and A.Y.; software, A.Y., Y.Y. and Y.C.; validation, A.Y., Y.Y. and X.Z.; formal analysis, A.Y. and Y.Y.; investigation, Y.Y. and A.Y.; resources, X.Z.; data curation, A.Y. and Y.Y.; writing—original draft preparation, A.Y.; writing—review and editing, X.Z., Y.Y. and Y.C.; visualization, A.Y.; supervision, X.Z.; project administration, X.Z.; funding acquisition, X.Z. and Y.Y. All authors have read and agreed to the published version of the manuscript.
Funding
This research was supported by the National Natural Science Foundation of China (NO. 32271832) and 5·5 Engineering Research & Innovation Team Project of Beijing Forestry University (NO. BLRC2023B06).
Institutional Review Board Statement
Not applicable.
Data Availability Statement
Data will be made available on request.
Acknowledgments
The help of Xueying Ren and Jiheng Li during the sample sampling is highly appreciated.
Conflicts of Interest
The authors declare no conflicts of interest.
References
- Ouyang, S.Y.; Huang, Y.L.; Gao, H.D.; Guo, Y.C.; Wu, L.W.; Li, J.M. Study on the distribution characteristics and ecological risk of heavy metal elements in coal gangue taken from 25 mining areas of China. Environ. Sci. Pollut. Res. 2022, 29, 48285–48300. [Google Scholar] [CrossRef] [PubMed]
- Xing, J.; Gao, L.F.; He, L. Species distribution and concentration pollution of soil heavy metals in coal mine reclamation areas. Front. Environ. Sci. 2022, 10, 925074. [Google Scholar] [CrossRef]
- Li, J. Development strategies of China’s coal industry in the context of global industrial Chain restructuring. Bus. Obs. 2024, 10, 25–29. [Google Scholar]
- Zhang, L.J.; Ponomarenko, T. Directions for sustainable development of China’s coal industry in the post–epidemic era. Sustainability 2023, 15, 6518. [Google Scholar] [CrossRef]
- China National Coal Association. Analysis of Raw Coal Production in Various Provinces and Regions in China in 2023: Henan Returns to Top Growth in Billion Tons in Xinjiang. Available online: https://www.coalchina.org.cn/index.php?m=content&c=index&a=show&catid=10&id=151796 (accessed on 17 January 2025).
- Ministry of Natural Resources. China Mineral Resources 2024. Available online: https://www.mnr.gov.cn/sj/sjfw/kc_19263/zgkczybg/202410/t20241022_2871217.html (accessed on 17 January 2025).
- Zhang, X.T.; Cheng, H.Y.; Wang, T.; Li, N. Analysis and evaluation of soil microbial diversity around mining area in Suzhou of Anhui Province. Yinshan Acad. J. 2017, 31, 38–42. [Google Scholar]
- Zhang, G.S. Monitoring and Assessment of Vegetation Damage and Soil Heavy Metal Pollution in Open Coalmine Area. Ph.D. Thesis, Henan Polytechnic University, Jiaozuo, China, 2023. [Google Scholar]
- Ma, J.; Hua, Z.Y.; Cheng, Y.J.; Zhu, Y.F.; Yang, Y.J.; Cheng, F. Impacts of vegetation restoration type on abundant and rare microflora in reclaimed soil of open–pit mining area. Coal Sci. Technol. 2024, 52, 363–377. [Google Scholar]
- Song, S.J.; Zhang, Y.L.; Wang, S.M.; Du, L.; Liu, M.N. Influence of mining ground fissures on soil microorganism and enzyme activities in Northern Shaanxi coal mining area. J. China Coal Soc. 2021, 46, 1630–1640. [Google Scholar]
- Singh, B.K.; Quince, C.; Macdonald, C.A.; Khachane, A.; Thomas, N.; Al–Soud, W.A.; Sørensen, S.J.; He, Z.L.; White, D.; Sinclair, A.; et al. Loss of microbial diversity in soils is coincident with reductions in some specialized functions. Environ. Microbiol. 2014, 16, 2408–2420. [Google Scholar] [CrossRef]
- Chen, J.H. Effect of mine wastelands vegetation on soil properties. Met. Mine 2016, 45, 147–150. [Google Scholar]
- Yang, C.M.; Niu, J.H.; Wang, D.S.; Fan, B.B. Effect of sludge treated by different methods on soil microorganisms in abandoned mining areas. China Water Wastewater 2019, 35, 114–119. [Google Scholar]
- Ma, D.; Zhang, J.X.; Duan, H.Y.; Huang, Y.L.; Li, M.; Sun, Q.; Zhou, N. Reutilization of gangue wastes in underground backfilling mining: Overburden aquifer protection. Chemosphere 2021, 264, 128400. [Google Scholar] [CrossRef] [PubMed]
- Bridge, G. Contested terrain: Mining and the environment. Annu. Rev. Environ. Resour. 2004, 29, 205–259. [Google Scholar] [CrossRef]
- Li, Y.T.; Rouland, C.; Benedetti, M.; Li, F.B.; Pando, A.; Lavelle, P.; Dai, J. Microbial biomass, enzyme and mineralization activity in relation to soil organic C, N and P turnover influenced by acid metal stress. Soil Biol. Biochem. 2009, 41, 969–977. [Google Scholar] [CrossRef]
- Wang, Y.P.; Shi, J.Y.; Wang, H.; Lin, Q.; Chen, X.C.; Chen, Y.X. The influence of soil heavy metals pollution on soil microbial biomass, enzyme activity, and community composition near a copper smelter. Ecotoxicol. Environ. Saf. 2007, 67, 75–81. [Google Scholar] [CrossRef]
- Bettahar, M.; Ducreux, J.; Schäfer, G.; van Dorpe, F. Surfactant enhanced in situ remediation of LNAPL contaminated aquifers: Large scale studies on a controlled experimental site. Transp. Porous Media 1999, 37, 255–276. [Google Scholar] [CrossRef]
- Zhao, B.W.; Zhang, J.S.; Fang, H.L. Research progress on plant–microorganism combined remediation of petroleum contaminated soil. China Resour. Compr. Util. 2024, 42, 118–120. [Google Scholar]
- Li, S. Review of combined plant–microbe remediation technologies for soil heavy metals. Agric. Technol. 2016, 36, 31–62. [Google Scholar]
- Huang, J.W.; Chuang, S.C.; Chen, K.; Ling, W.T.; Tang, X.Y.; Jiang, J.D. Progress on plant–microorganism combined remediation of organic pollutants. J. Zhejiang Univ. 2017, 43, 757–765. [Google Scholar]
- Wang, R.H. The Characteristic of Phyllosphere and Rhizosphere Microbial Community of Bohtriochloa ischaemum in Copper Tailings Area. Master’s Thesis, Shanxi University, Taiyuan, China, 2020. [Google Scholar]
- Jia, T.; Yao, Y.S.; Wang, R.H. Characteristics of phyllosphere and rhizosphere bacterial communities in Bothriochloa ischaemum in copper tailings. Environ. Sci. 2020, 41, 5628–5635. [Google Scholar]
- Chai, Y.Y. Effect of DBP on the Community Structure of Phyllosphere; Rhizosphere Microorganisms and Endophytes of Vegetables. Master’s Thesis, Qingdao University of Science and Technology, Qingdao, China, 2018. [Google Scholar]
- Shen, J.B.; Bai, Y.; Wei, Z.; Chu, C.C.; Yuan, L.X.; Zhang, L.; Cui, Z.L.; Cong, W.F.; Zhang, F.S. Rhizobiont: An Interdisciplinary Innovation and Perspective for Harmonizing Resources, Environment, and Food Security. Acta Pedol. Sin. 2021, 58, 805–813. [Google Scholar]
- Simonin, M.; Dasilva, C.; Terzi, V.; Ngonkeu, E.L.M.; Diouf, D.; Kane, A.; Béna, G.; Moulin, L. Influence of plant genotype and soil on the wheat rhizosphere microbiome: Evidences for a core microbiome across eight African and European soils. FEMS Microbiol. Ecol. 2020, 96, fiaa067. [Google Scholar] [CrossRef] [PubMed]
- Zou, C.L.; Wu, F.Z.; Zheng, Y. Advances in the study of the effects of high CO2 concentrations on plants. J. Northeast Agric. Univ. 2008, 39, 134–139. [Google Scholar]
- Zhou, X.H.; Wang, Y.; Fan, X.J.; Gao, H.H.; Qin, D.Y.; Zhuang, Q.Y.; Yu, Y. Effects of high temperature on rhizosphere microbial diversity of chives. Shandong Agric. Sci. 2019, 51, 81–86. [Google Scholar]
- Xu, H.Z.; Xue, Y.H.; Ding, H.F.; Qi, H.R.; Li, T.H.; Mao, W.J.; Cheng, F.S. Microbial community structure and diversity of peach rhizosphere soil in different regions. China Fruit Veg. 2024, 44, 72–79. [Google Scholar]
- Xiao, X.; Chen, W.M.; Zong, L.; Yang, J.; Jiao, S.; Lin, Y.B.; Wang, E.T.; Wei, G.H. Two cultivated legume plants reveal the enrichment process of the microbiome in the rhizocompartments. Mol. Ecol. 2017, 26, 1641–1651. [Google Scholar] [CrossRef] [PubMed]
- Lu, Y.H.; Zhang, F.S. The Advances in Rhizosphere Microbiology. Soils 2006, 38, 3–11. [Google Scholar]
- Chaparro, J.M.; Badri, D.V.; Vivanco, J.M. Rhizosphere microbiome assemblage is affected by plant development. ISME J. 2014, 8, 790–803. [Google Scholar] [CrossRef]
- Fan, Z.Q.; Zheng, L.X.; Feng, J.H.; Zhou, J.X.; Wang, S.; Chen, F. Research progress on influencing factors of rhizosphere microbial assembly. Ind. Microbiol. 2024, 54, 7–9. [Google Scholar]
- Han, X.X. Study of Effect of Fly Ash from Pangzhuang Mining Area on Wheat Seedling and Its Microenvironment. Master’s Thesis, China University of Mining and Technology, Xuzhou, China, 2019. [Google Scholar]
- Zhou, Q.; Wang, X.T.; Wang, J.Y.; Tian, Y.Q. Research progress on microbial remediation technology for soil polluted by heavy metals. Mod. Agric. Sci. Technol. 2024, 13, 95–98+122. [Google Scholar]
- Nowak, D.J.; Dwyer, J.F. Urban and Community Forestry in the Northeast, 2nd ed.; Springer: Dordrecht, The Netherlands, 2007; pp. 25–46. [Google Scholar]
- Rahman, Z. An overview on heavy metal resistant microorganisms for simultaneous treatment of multiple chemical pollutants at co–contaminated sites; and their multipurpose application. J. Hazard. Mater. 2020, 396, 122682. [Google Scholar] [CrossRef]
- Xu, A.L.; Song, Q.; Jiang, M.; Song, Z.W. Study on the leafsurface morphology and microbial community structure of three plants on the trunk road of Qingdao. J. Qingdao Univ. Technol. 2023, 44, 65–73. [Google Scholar]
- Zhou, Z.D.; Xu, J.H. Comparison of microbial community structure and heavy metal pollution in different plant phyllospheres along the highway. Jiangsu Agric. Sci. 2021, 49, 215–221. [Google Scholar]
- Leveau, J.H. A brief from the leaf: Latest research to inform our understanding of the phyllosphere microbiome. Curr. Opin. Microbiol. 2019, 49, 41–49. [Google Scholar] [CrossRef] [PubMed]
- Schlechter, R.O.; Miebach, M.; Remus–Emsermann, M.N. Driving factors of epiphytic bacterial communities: A review. J. Adv. Res. 2019, 19, 57–65. [Google Scholar] [CrossRef]
- Espenshade, J.; Thijs, S.; Gawronski, S.; Bové, H.; Weyens, N.; Vangronsveld, J. Influence of urbanization on epiphytic bacterial communities of the platanus× hispanica tree leaves in a biennial study. Front. Microbiol. 2019, 10, 675. [Google Scholar] [CrossRef] [PubMed]
- Li, M.; Liu, M.; Li, Z.P.; Jiang, C.Y.; Wu, M. Soil N transformation and microbial community structure as affected by adding biochar to a paddy soil of subtropical China. J. Integr. Agric. 2016, 15, 209–219. [Google Scholar] [CrossRef]
- Zhao, Q.Y.; Zhang, Z.M.; Tan, Z.; Li, W.J.; Pan, L.B.; Guan, X.; Li, J.H. Characteristics of pollution and microbial community sructure in the Antimony mining area of Longnan; Gansu Province. Environ. Sci. 2024, 45, 4266–4278. [Google Scholar]
- Zhao, T.; Yan, H.; Jiang, Y.L.; Huang, Y.M.; An, S.S. Effects of vegetation types on soil microbial biomass C; N; P on the Loess Hilly Area. Acta Ecol. Sin. 2013, 33, 5615–5622. [Google Scholar] [CrossRef]
- Wang, J.Y.; Zhang, X.Y.; Wen, X.F.; Wang, S.Q.; Wang, H.M. The effect of nitrogen deposition on forest soil organic matter and litter decompostion and the microbial mechanism. Acta Ecol. Sin. 2013, 33, 1337–1346. [Google Scholar] [CrossRef]
- Zhang, X.L.; Ma, M.; Wu, Z.Z.; Zhang, Z.Z.; Gao, R.; Shi, L.Y. Effects of Helianthus annuus varieties on rhizosphere soil enzyme activities and microbial community functional diversity of saline–alkali land in Xinjiang. Acta Ecol. Sin. 2017, 37, 1659–1666. [Google Scholar]
- Zheng, C.; Li, Y.; Wang, X.; Wang, L.; Duan, Y.; Chen, Y.; Lu, J. Desertification indirectly affects soil fauna by reducing complexity of soil habitats and diversity of energy sources. Sci. Total Environ. 2024, 954, 176509. [Google Scholar] [CrossRef] [PubMed]
- Xie, Y.; Fan, J.B.; Zhu, W.X.; Amombo, E.; Lou, Y.H.; Chen, L.; Fu, J.M. Effect of heavy metals pollution on soil microbial diversity and bermudagrass genetic variation. Front. Plant Sci. 2016, 7, 755. [Google Scholar] [CrossRef] [PubMed]
- Jamsranjav, C.; Fernández–Giménez, M.E.; Reid, R.S.; Adya, B. Opportunities to integrate herders’ indicators into formal rangeland monitoring: An example from Mongolia. Ecol. Appl. 2019, 29, e01899. [Google Scholar] [CrossRef]
- Wenxin, C.H. The Community Structure and Functional Diversity of Soil Microbes in the Rhizosphere of Three Plants from Fengfeng Mining Area. Master’s Thesis, Hebei University, Baoding, China, 2019. [Google Scholar]
- County Situation Overview. Available online: https://www.qinyuan.gov.cn/zjqy/xqgk/ (accessed on 17 January 2025).
- Natural Environment. Available online: https://www.qinyuan.gov.cn/zjqy/xqgk/zrhj/ (accessed on 17 January 2025).
- Li, Y.L. Discussion on the formation and prevention measures of geological disasters in Qinyuan County mining enterprises. Mod. Chem. Res. 2022, 22, 7–9. [Google Scholar]
- Cheng, J.Y. Research on Ecological Restoration Strategies of Mining Areas in Changzhi Area Based on Ecological Network. Master’s Thesis, China University of Geosciences, Beijing, China, 2021. [Google Scholar]
- Qiao, S.S.; Zhou, Y.N.; Liu, J.X.; Jing, J.H.; Jia, T.; Li, C.; Yang, X.; Chai, B.F. Characteristics of Soil Bacterial Community Structure in Coniferous Forests of Guandi Mountains, Shanxi Province. Sci. Silvae Sin. 2017, 53, 89–99. [Google Scholar]
- Page, A.L.; Miller, R.H.; Keeney, D.R. Methods of Soil Analysis, Part 2. Chemical and Microbiological Properties, 2nd ed.; Black, C.A., Ed.; American Society of Agronomy: Madison, WI, USA, 1965; pp. 539–579 & 891–901. [Google Scholar]
- Carrillo–Gonzalez, R.; Gonzalez–Chavez, M.C.A.; Aitkenhead–Peterson, J.A.; Hons, F.M.; Loeppert, R.H. Extractable DOC and DON from a dry–land long–term rotation and cropping system in Texas, USA. Geoderma 2013, 197, 79–86. [Google Scholar] [CrossRef]
- Bao, S.D. Agricultural Chemical Analysis of Soil, 3rd ed.; China Agriculture Press: Beijing, China, 2016. [Google Scholar]
- Shao, Z.; Zhang, F.; Chen, J.; Zhang, B.L. Soil moisture changes for different land use types in Loess Plateau gully and hilly region of central Gansu. J. Arid Land. 2017, 31, 129–135. [Google Scholar]
- Yang, N.; Li, X.X.; Liu, D.; Zhang, Y.; Chen, Y.H.; Wang, B.; Hua, J.N.; Zhang, J.B.; Peng, S.L.; Ge, Z.W.; et al. Diversity patterns and drivers of soil bacterial and fungal communities along elevational gradients in the southern Himalayas, China. Appl. Soil Ecol. 2022, 178, 104563. [Google Scholar] [CrossRef]
- Avidano, L.; Gamalero, E.; Cossa, G.P.; Carraro, E. Characterization of soil health in an Italian polluted site by using microorganisms as bioindicators. Appl. Soil Ecol. 2005, 3, 21–33. [Google Scholar] [CrossRef]
- Bao, G.S.; Suetsugu, K.; Wang, H.S.; Yao, X.; Liu, L.; Ou, J.; Li, C.J. Effects of the hemiparasitic plant Pedicularis kansuensis on plant community structure in a degraded grassland. Ecol. Res. 2015, 30, 507–515. [Google Scholar] [CrossRef]
- Whipps, J.M.; Hand, P.; Pink, D.; Bending, G.D. Phyllosphere microbiology with special reference to diversity and plant genotype. J. Appl. Microbiol. 2008, 105, 1744–1755. [Google Scholar] [CrossRef] [PubMed]
- Darlison, J.; Mogren, L.; Rosberg, A.K.; Grudén, M.; Minet, A.; Liné, C.; Mieli, M.; Bengtsson, T.; Håkansson, Å.; Uhlig, E.; et al. Leaf mineral content govern microbial community structure in the phyllosphere of spinach (Spinacia oleracea) and rocket (Diplotaxis tenuifolia). Sci. Total Environ. 2019, 675, 501–512. [Google Scholar] [CrossRef]
- Cui, Y.J.; Wu, F. Diversity and community structure of epiphytic fungi in the phyllosphere of Rosa chinensis in Beijing, northern China. Mycosystema 2024, 43, 4–21. [Google Scholar]
- Zhang, J.W.; Ge, Z.H.; Ma, Z.H.; Huang, D.Y.; Zhang, J.B. Seasonal changes driving shifts of aquatic rhizosphere microbial community structure and the functional properties. J. Environ. Manag. 2022, 322, 116124. [Google Scholar] [CrossRef]
- Deng, L.; Zheng, Y.; Sun, X.G. Seasonal characteristics of phyllosphere microbial diversity of Pinus massoniana. J. West China For. Sci. 2023, 52, 118–127. [Google Scholar]
- Bao, L.J.; Cai, W.Y.; Cao, J.X.; Zhang, X.F.; Liu, J.H.; Chen, H.; Wei, Y.S.; Zhuang, X.L.; Zhuang, G.Q.; Bai, Z.H.; et al. Microbial community overlap between the phyllosphere and rhizosphere of three plants from Yongxing Island; South China Sea. Microbiologyopen 2020, 9, e1048. [Google Scholar] [CrossRef]
- Zhao, Y.; Xi, R.; Fu, Q.L.; Zhu, J.; Hu, H.Q. Component characteristics of amino acids and organic acids in root exudates from transgenic Bt cotton at different growth stage. Hubei Agric. Sci. 2018, 57, 26–30. [Google Scholar]
- Ye, X.F.; Zhang, Y.J.; Lu, X.M.; Wei, Y.W.; Li, Y.Y.; Liu, G.S. Research progress on the relationship between soil microorganisms and soil nutrition. Chin. J. Soil Sci. 2010, 41, 237–241. [Google Scholar]
- Xing, L.; Yang, J.L.; Jia, Y.H.; Hu, X.; Liu, Y.; Xu, H.; Yin, H.Q.; Li, J.; Yi, Z.X. Effects of ecological environment and host genotype on the phyllosphere bacterial communities of cigar tobacco (Nicotiana tabacum L). Ecol. Evol. 2021, 11, 10892–10903. [Google Scholar] [CrossRef] [PubMed]
- Wang, X.; Yang, T.; Mao, Z.K.; Lin, F.; Ye, J.; Fang, S.; Dai, G.H.; Hu, J.R.; Hao, Z.Q.; Wang, X.G. Community structure of phyllosphere fungi associated with dominant tree species in a broad–leaved Korean pine forests of Changbai Mountain; Northeast China. Chin. J. Appl. Ecol. 2022, 33, 2405–2412. [Google Scholar]
- Zhang, X.P.; Li, Q.L.; Zhong, Z.K.; Huang, Z.Y.; Bian, F.Y.; Yang, C.B.; Wen, X. Changes in soil organic carbon fractions and fungal communities; subsequent to different management practices in Moso bamboo plantations. J. Fungi 2022, 8, 640. [Google Scholar] [CrossRef] [PubMed]
- Chen, H.J.; Mo, Y.F.; Feng, H.M.; Wang, J.Y.; Zeng, F.P.; Song, T.Q.; Peng, W.X.; Du, H.; Wang, F. Soil fungal community structure and influencing factors of different forest types in karst peak–cluster depression. Res. Agric. Mod. 2021, 42, 1146–1157. [Google Scholar]
- Corsaro, D.; Walochnik, J.; Venditti, D.; Hauröder, B.; Michel, R. Solving an old enigma: Morellospora saccamoebae gen. nov.; sp. nov. (Rozellomycota); a Sphaerita–like parasite of free–living amoebae. Parasitol. Res. 2020, 119, 925–934. [Google Scholar] [CrossRef]
- Lin, Z.P.; Zhou, Y.Q.; Zhang, J.J.; Wang, Z.; Liu, Y.X.; Ding, J.; Chang, Y.Q. The structure and functional characteristics of bacterial community in sediments of diseased area of Apostichopus japonicus culture pond. Chin. J. Ecol. 2023, 42, 1936–1943. [Google Scholar]
- Xie, B. The Effect of Copper and Zinc Ions on Activated Sludgemicrobes and Its Analysis with Molecular Biological Technique. Ph.D. Thesis, Donghua University, Shanghai, China, 2002. [Google Scholar]
- Elbendary, A.A.; Hessain, A.M.; El–Hariri, M.D.; Seida, A.A.; Moussa, I.M.; Mubarak, A.S.; Kabli, S.A.; Hemeg, H.A.; Jakee, J.K.E. Isolation of antimicrobial producing Actinobacteria from soil samples. Saudi J. Biol. Sci. 2018, 25, 44–46. [Google Scholar] [CrossRef]
- Wang, R.B.; Wang, Z.M.; Wang, H.Y.; Yu, J.L. Landward distribution and association of the soil stable organic carbon fractions and dominant bacterial phyla. Environ. Microb. Ecol. 2022, 62, 2389–2402. [Google Scholar]
- Wang, Y.; Liu, Z.Y.; Hao, X.Y.; Wang, Z.Q.; Wang, Z.; Liu, S.S.; Tao, C.Y.; Wang, D.S.; Wang, B.; Shen, Z.Z.; et al. Biodiversity of the beneficial soil–borne fungi steered by Trichoderma–amended biofertilizers stimulates plant production. npj Biofilms Microbiomes 2023, 9, 46. [Google Scholar] [CrossRef] [PubMed]
- Wu, L.; Ning, D.L.; Zhang, B.; Li, Y.; Zhang, P.; Shan, X.Y.; Zhang, Q.T.; Brown, M.R.; Li, Z.X.; Van Nostrand, J.D.; et al. Global diversity and biogeography of bacterial communities in wastewater treatment plants. Nat. Microbiol. 2019, 4, 1183–1195. [Google Scholar] [CrossRef]
- Zhou, Y.; Yi, S.X.; Zang, Y.; Yao, Q.; Zhu, H.H. The predatory myxobacterium Citreicoccus inhibens gen. nov. sp. nov. showed antifungal activity and bacteriolytic property against phytopathogens. Microorganisms 2021, 9, 2137. [Google Scholar] [CrossRef]
- Liu, X.J.; Du, F.F.; Chen, S.Z.; Li, N.W.; Cui, J.; Chang, Y.J.; Sun, L.H.; Li, J.F.; Yao, D.R. Increased diversity of rhizosphere bacterial community confers adaptability to coastal environment for Sapium sebiferum Trees. Forests 2022, 13, 667. [Google Scholar] [CrossRef]
- Kersters, K.; De Vos, P.; Gillis, M.; Swings, J.; Vandammeand, P.; Stackebrandt, E. Introduction to the Pseudomonadota; Springer: New York, NY, USA, 2006; pp. 3–37. [Google Scholar]
- Rincón–Tomás, B.; Lanzén, A.; Sánchez, P.; Estupiñán, M.; Sanz–Sáez, I.; Bilbao, M.E.; Rojo, D.; Mendibil, I.; Pérez–Cruz, C.; Ferri, M.; et al. Revisiting the mercury cycle in marine sediments: A potential multifaceted role for Desulfobacterota. J. Hazard. Mater. 2024, 465, 133120. [Google Scholar] [CrossRef] [PubMed]
- D’Angelo, T.; Goordial, J.; Lindsay, M.R.; McGonigle, J.; Booker, A.; Moser, D.; Stepanauskus, R.; Orcutt, B.N. Replicated life–history patterns and subsurface origins of the bacterial sister phyla Nitrospirota and Nitrospinota. ISME J. 2023, 17, 891–902. [Google Scholar] [CrossRef] [PubMed]
- Chang, B. Analysis of the impact of mountain coal mining on soil physical and chemical properties. Chem. Eng. Manag. 2017, 32, 135. [Google Scholar]
- Bakhshandeh, E.; Francaviglia, R.; Renzi, G. A cost and time–effective method to evaluate soil microbial respiration for soil quality assessment. Appl. Soil Ecol. 2019, 140, 121–125. [Google Scholar] [CrossRef]
Disclaimer/Publisher’s Note: The statements, opinions and data contained in all publications are solely those of the individual author(s) and contributor(s) and not of MDPI and/or the editor(s). MDPI and/or the editor(s) disclaim responsibility for any injury to people or property resulting from any ideas, methods, instructions or products referred to in the content. |
© 2025 by the authors. Licensee MDPI, Basel, Switzerland. This article is an open access article distributed under the terms and conditions of the Creative Commons Attribution (CC BY) license (https://creativecommons.org/licenses/by/4.0/).