Article

Assessing the Potential Risk of Invasion of the Neophyte Pluchea ovalis (Pers.) DC. (Asteraceae) in the Canarian Archipelago Using an Ensemble of Species Distribution Modelling

by
Juan José García-Alvarado
1,*,
Miguel Pestano-González
1,
Cristina González-Montelongo
1,
Agustín Naranjo-Cigala
2 and
José Ramón Arévalo
1,*
1
Department of Botany, Ecology and Plant Physiology, University of La Laguna, 38203 San Cristobal de La Laguna, Spain
2
Department of Geography, University of Las Palmas de Gran Canaria, 35001 Las Palmas de Gran Canaria, Spain
*
Authors to whom correspondence should be addressed.
Diversity 2025, 17(3), 195; https://doi.org/10.3390/d17030195
Submission received: 12 February 2025 / Revised: 25 February 2025 / Accepted: 4 March 2025 / Published: 10 March 2025
(This article belongs to the Section Biodiversity Loss & Dynamics)

Abstract

:
Invasive species represent a significant threat to biodiversity and ecosystem conservation, with their impacts often amplified in island ecosystems. Species distribution models (SDMs) can infer the potential habitat throughout the life of an organism and are considered a valuable tool for predicting the risk of expansion of invasive plants and animals. In our approach, we used an ensemble of four presence–absence models (GLM, GAM, Random Forest, and BART) calibrated only with data collected in Tenerife, the island with the best representation of the species, to infer the habitat suitability for Pluchea ovalis (Pers.) DC. (Asteraceae). Subsequently, we transferred the ensembled model to the rest of the Canarian Island archipelago. Our results show that under near-present conditions, the suitable areas are in the coastal and mid-elevations of the south slope sectors of Tenerife and Gran Canarian Islands, as well as a vast portion of the westernmost and drier islands, always coinciding with ravines and highly disturbed ecosystems. In addition, we forecasted the potential distribution of Pluchea ovalis under different climate change conditions (SSP126, SSP370, and SSP585), showing how its habitability would increase in the worst scenarios. Both contexts favor areas gained by the species in places where they are currently not present, revealing new suitable sectors in the westernmost islands.

1. Introduction

The wildlife trade, gardening, land use changes, and economic development (human activities broadly) are the main contributors to the growing exchange and the establishment of species in areas outside their natural distributions [1]. In this sense, the number of introductions is projected to increase as the result of globalization [2], and, consequently, there will be more opportunities for a portion of them to be successful in terms of sustaining populations, spreading over great distances, and establishing negative interactions in their non-native ranges, ultimately becoming an invasive species [3]. Human activities and socioeconomics have been recognized as the primary factors driving the colonization and establishment phase, leading to invasion—resulting in tangible negative impacts—while numerous other factors, such as climate and habitat, also play a role. So, only a fraction of established non-native species become invasive [4]. Even so, biological invasions are considered one of the most significant threats to biodiversity and ecosystems worldwide [5,6] as well as to the provision of ecosystem services, health, and the economy [7,8].
Oceanic islands harbor a substantial proportion of endemic species, providing an exceptional framework for studying evolutionary processes and the composition of local plant communities [9,10]. Additionally, insular floras are reported to contain a higher proportion of endemic and rare threatened species than continental floras [11]. Often characterized as fragile environments [12], islands require careful assessment and monitoring of invasions, alongside detailed studies of their resulting impacts [13]. The effects of such invasions have been extensively studied and are well documented: in ecological terms, they can lead to losses in distinctiveness or a rapid decline in the original species pool (biotic homogenization) [14,15], direct damage to native species [16,17], and the alteration of the ecosystem structure by changes in biotic interactions like dispersal or seed recruitment [18,19]. Furthermore, ecosystem services, such as carbon capture and, indirectly, water stream quality, can also be altered [20,21].
The need to control and evaluate invasion processes and their risk is evident and necessary. For monitoring invaded areas, spatial techniques provide a wide range of utilities. For example, Berio-Fortini et al. [22] conducted a supervised classification based on remote sensing bands to obtain the different classes of land use in Lanai (Hawaii); they were able to delimit and discriminate patches relative to different non-native vegetation, which can be valuable in terms of the established or incipient process of invasion and for assessing the state of native forests in front to alien species. In this regard, Devkota et al. [23] also performed a supervised classification to detect pixels occupied by Castanea sativa Mill. in La Palma [24]. Similarly, the invasive strawberry guava (Psidium cattleianum Sabine) has been monitored in Mauritius using remote sensing analysis [25]. Later, this remotely sensed data were incorporated into species distribution models (hereafter SDMs) to supplement field data collected or gridded records and to provide spatial predictors [26].
In addition to satellite tools or other spatial approaches [27,28], species distribution models (SDMs) are valuable tools that can predict the risk and extent of an invasion across a specific geographical area [29,30] and help conservation managers to make solid decisions. They can encapsulate occurrence records and spatial co-variables in a statistical framework, producing map predictions of the potential distribution of a species. Another property of SDMs is their capacity to be projected in space or time (transferability; [31]), which could be beneficial in delineating areas with great potential to be invaded and contribute to early detection, prevention, and prioritization.
Climate change is expected to have a significant impact on the distribution and abundance of invasive species, as well as in the composition of local ecosystems [32,33]. On islands, it exists as an important background regarding the use of species distribution models in invasions and climate change processes [34]. The development of such studies is even more critical given the remarkable vulnerability of these biodiversity hotspots to both climate change and biological invasions [35]. While some studies based on modeling have indicated increases in suitability for invasive species [36], others have concluded that it limits their distribution [37], even in target species that currently occupy an extensive distribution and have acquired a clear invasive potential [38].
In the case of genus Pluchea (sensu lato), there is a lack of literature on possible invasive behavior on islands, contrary to species such as gorse (Ulex europaeus L.) or fountain grass (Cenchrus setaceus (Forssk.) Morrone), among others. Many plant species have shown an evident invasive background in archipelagos such as Reunion [39], Hawaii [40,41], Madeira [42], or the island of Tenerife itself [43,44]. In addition to the widespread presence of Pluchea ovalis (P. ovalis) in Tenerife [45], individuals of Pluchea carolinensis (Jacq.) G.Don have also been reported in Gran Canaria [46], thriving in similar environmental conditions on both islands. These facts highlight the need for a detailed assessment of the risk of invasion of the Canary Islands by Pluchea ovalis with a description of the spatial patterns and dynamics of the invasion. Pluchea ovalis, also known as Quincy pride, is a shrub reaching 2.5 m in height and having yellow-white or pale mauve florets. Its leaves vary from lanceolate to elliptical, with smooth margins and a typical ovate shape that gives it its name [47]. It naturally occurs in xeric areas of Africa, Comoros, Madagascar, and the Arabian Peninsula to northwest India, although it also inhabits wetlands, riverbanks, mangroves, and marshes [48]. A detailed description of its morphological, phonologic, ecological, and distribution are provided in [48,49].
Regarding the current distribution of Pluchea ovalis, our initial hypothesis is that the Canary Islands present certain ideal conditions encouraging invasion by this species, at least partially and at an early stage [50]. Subsequently, climate change could increase the suitability of the Islands for the species and make other islands more suitable for its establishment and subsequent spread [51]. Additionally, we will examine the suitability of each zonal ecosystem along the altitudinal gradient of Tenerife for invasion, recognizing that not all ecosystems exhibit the same level of vulnerability to invasion. Secondly, we will also attempt to assess changes in species suitability due to global change, providing a spatial analysis of regions that could become more prone to invasion according to different scenarios. Finally, we will present reliability metrics based on the extrapolation capacity of our predictions. This study could serve as a starting point for recognizing this species as invasive and prioritizing management actions in the short and long term.

2. Materials and Methods
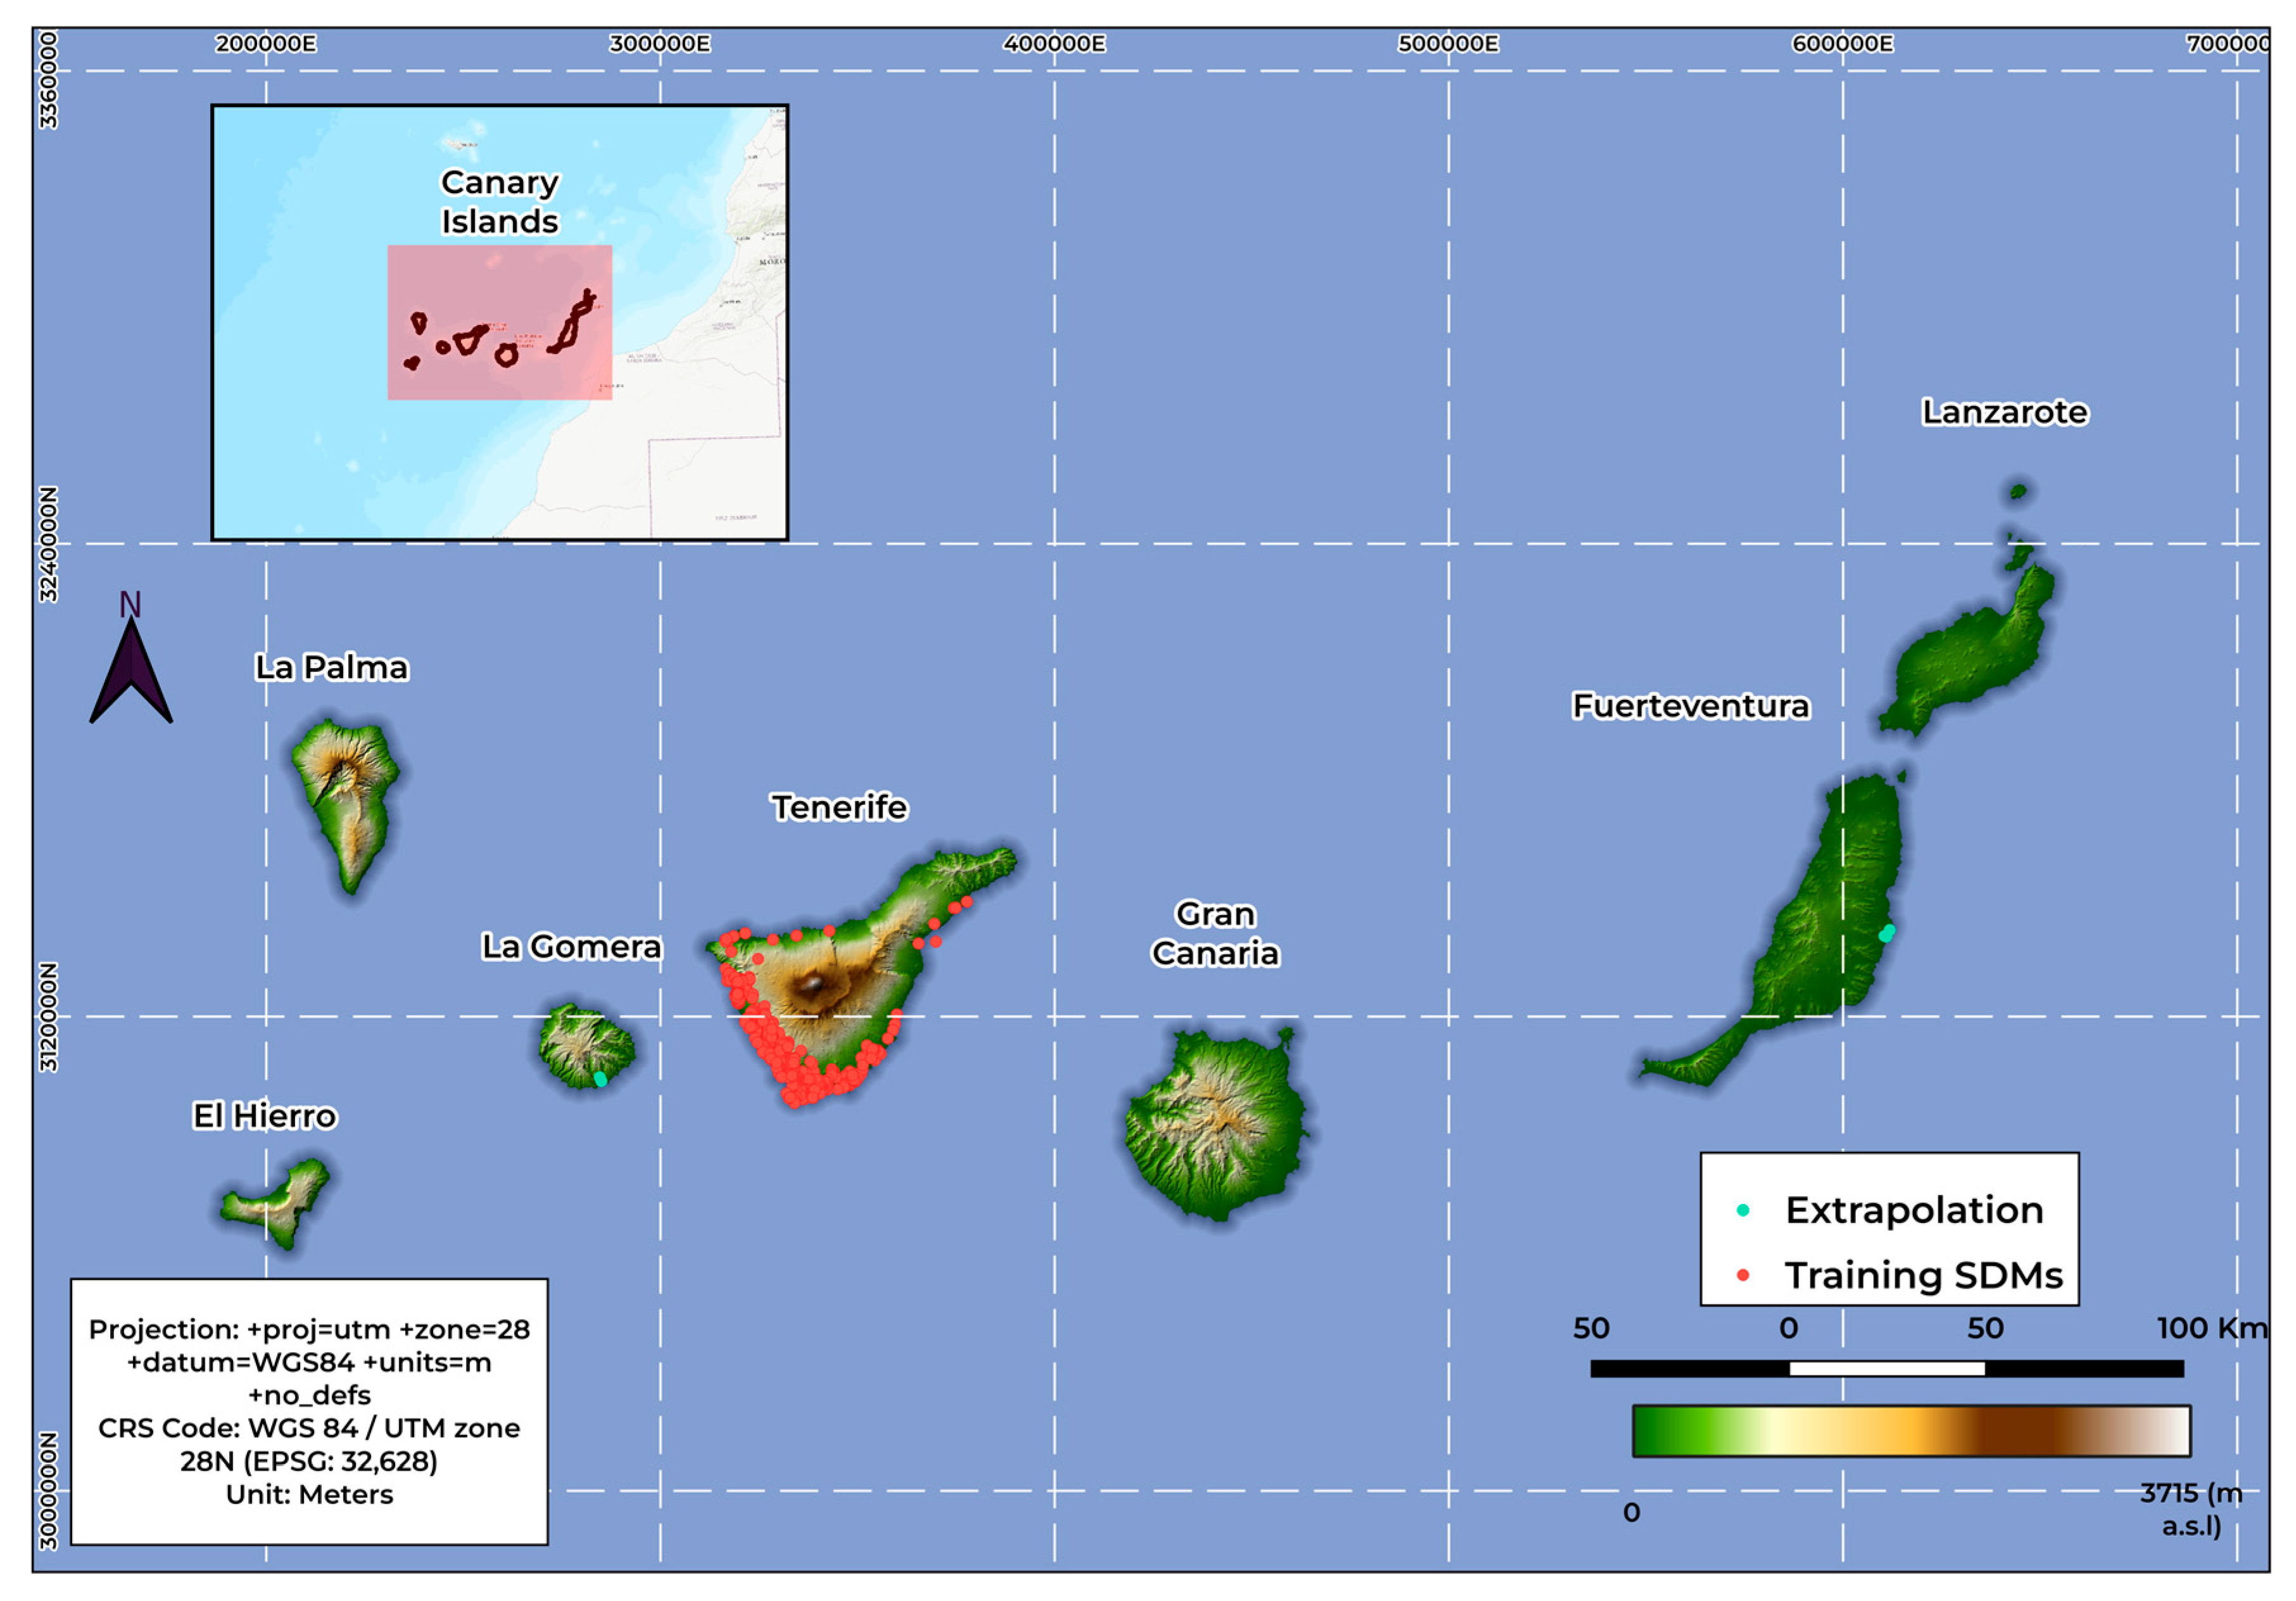
2.1. Study Area

Our study focuses on the entire Canary Island archipelago (Figure 1). These volcanic islands are located 96 km off the coast of Africa and consist of seven major islands: Fuerteventura, Lanzarote, Gran Canaria, Tenerife, La Gomera, La Palma, and El Hierro. Biogeographically, the Canary Islands are considered part of the ecoregion of Macaronesia, which also includes the Azores, Madeira, Cape Verde, and the Selvagem islands [52].
The Canarian archipelago encompasses a wide range of geological [53], climatic, and bioclimatic features [54]. These characteristics are strongly influenced by elevation and exposure to prevailing trade wind clouds, which are most evident on the leeward slopes of the central and western islands, which have a direct influence on the distribution of vegetation belts along the elevational gradient (succulent scrub, thermophilous woodland, evergreen laurel forest, pine forest, and summit vegetation). The gradients are particularly evident from the easternmost and drier islands (Fuerteventura and Lanzarote) to the central (Tenerife and Gran Canaria) and westernmost (La Palma and El Hierro) in terms of age, steepness, temperature (highly influenced by elevation regime), and annual precipitation.

2.2. Occurrence Data

We extracted the occurrence data for Pluchea ovalis from the Canary Islands Biodiversity Database (BIOTA; [55]). These data are gridded at a 500 m resolution, representing the entire archipelago. We also incorporated field data into our dataset, collecting 352 points for Tenerife on the 500 m resolution grid to align with both datasets, excluding 6 points from La Gomera and Fuerteventura. We kept prevalence at 0.5 (relationship between presence indication and the whole dataset), so we generated the same number of pseudo-absences as presences. In these cases, as noted by Acevedo and Real [56], presence probability is equivalent to habitat suitability for comparison purposes. Instead of generating 352 random pseudo-absences (random sampling in geographical space), we obtained 352 points from the portion of the environmental space least likely to have suitable conditions for the species (uniform sampling in environmental space) (Figure 2). This technique minimizes the overlap between the environmental conditions of presences and pseudo-absences, thereby challenging the concept of pseudo-absence itself (for more details on the individual relationships between presence and pseudo-absence with environmental predictors, see Appendix A, Figure A1). To accomplish this, we used the framework established by Da Re at al. [57] and the USE R package, using an optimal grid resolution of sampling of 10 and a threshold to detect portions of the multivariate space likely associated with the presence values of 0.8.

2.3. Predictors

We retrieved 19 bioclimatic variables from CanaryClim v1.0 [58] at 100 m resolution. This set of variables was obtained using the statistical downscale of CHELSA v1.2 [59]. In addition, we generated a land use raster to detect disturbances and the effect of distance to anthropic areas. For this purpose, we used the Land Use and Land Cover dataset (LULC) from CORINE Land Cover [60], calculating the distance to each point in the archipelago using the native QGIS ’nearest distance to hub’ algorithm. This function returns a set of points with each calculated distance, subsequently converting this vector layer into raster format with the desired extent and resolution. We aggregated each predictor to a 500 m resolution to maintain consistency with grid presence data resolution [61]. Here, we assumed a lack of granular detail in our spatial predictions to align with the resolution of the occurrence data and predictors. We then removed highly correlated predictors [62,63], a typically used procedure in this field, to prevent multicollinearity and always tried to keep the predictors most relevant to the species ecology. Variables were retained through a Pearson correlation < 0.7. We then assessed the variance inflation factor (VIF) for this subset of variables and excluded any with a VIF higher than 5 [64]. Finally, our selected variables to build our models were as follows: BIO3: isothermallity; BIO4: temperature seasonality; BIO9: mean temperature of driest quarter; BIO12: annual precipitation; BIO14: precipitation of driest month; BIO15: precipitation seasonality; and BIO18: precipitation of warmest quarter and distance to anthropic areas.

2.4. Habitat Suitability Modeling (HSM)

Four different modeling algorithms were utilized. We employed four different modeling algorithms: generalized linear model (GLM), generalized additive model (GAM), Random Forest (RF), and Bayesian additive regression trees (BART). The prevalence was kept at 0.5 (the same number of presence and pseudo-absence). In addition, we used only Tenerife to calibrate our models, projecting them to the whole archipelago due to the low number of samples on other islands. For modeling, we used fuzzySim [65], mgcv [66], randomForest [67], and embarcadero [68] R packages for GLM, GAM, RF, and BART, respectively. For model evaluation, we used the modEvA R package [69] and for each algorithm, we employed several tuning options. We applied GLM using a stepwise variable selection based on Akaike Information Criterion (AIC); for GAM, we generated four different models combining three types of splines (thin-plate, tensor, and cubic) and varying complexity in the smoothers (knots; 1, 3, 6), evaluating the best model based on the lowest AIC (models with ΔAIC < 2 are considered statistically valid) [70]. In the case of Random Forest models, variables were selected using the Boruta algorithm [71], and we set up the number of variables in each tree (mtry) to 2 and the number of trees to 500. For BART, we employed the default options.
We replicated each algorithm 10 times to generate our spatial predictions using the entire dataset, which was especially important in the case of machine learning methods such as RF and BART [72]. For validation, we split our data into 70% for training the models and 30% for testing them, repeating this procedure 100 times and increasing the seed number with each iteration to ensure that different samples were used for training and testing in each run. We evaluated the predictive performance of our models using four different and complementary discrimination/classification metrics: area under the curve (AUC, [73]), Boyce Index (Boyce, [74]), standardized true skill statistic (sTSS, [75]), and Sommer’s D ([D = 2 × (AUC − 0.5), [76]). AUC is a classical threshold-independent metric employed for binary classifications. Its values range from 0.5 for models without discrimination ability (model no better than a random prediction) to 1 for models with perfect classification performance. Boyce is an indicator used to evaluate the accuracy of presence and provides measured differences between model predictions and a random distribution of observed presence points across a range of prediction values. Its values range from -1 for models with low accuracy to predict the probability of presence to 1 for models that perfectly predict the probability of presence. The sTSS is a standardized (values range from 0 to 1) threshold-based metric that represents the sum of sensitivity (true positive rate: percentage of correct prediction of presence) and specificity (true negative rate: percentage of correct prediction of absence) minus 1, so values near 0 represent low classification accuracy and values near 1 imply a low rate of commission and omission errors (false positive and false negative, respectively). Sommer’s D is a metric strongly related to AUC, but its values range from 0 for low discriminative power to 1 for perfect binary classification. Calibration of the models was assessed using Miller’s slope as an indicator of reliability, representing the overall deviation of predicted probabilities from observed occurrence frequencies [77,78]. A Miller slope value of 1 indicates perfect fit, values near to 1 imply semi-good fit, and values close to 0 or excessively higher than 1 imply a poor fit.
To summarize model predictions for P. ovalis and obtain the final consensus model (hereafter referred to as ensembled model), we generated an ensembling model by calculating a weighted mean of the outcomes across the models, using the AUC as a weighting factor. As a proxy of an ecosystem’s suitability for invasion and for testing significant differences in the median habitat suitability of P. ovalis in the main vegetation belts of Tenerife, we performed a non-parametric Kruskal–Wallis test for pairwise comparisons among ecosystems after adjusting confidence levels using Holm’s method. Additionally, we have provided a map of prediction uncertainty, expressed as pixel variance between each separate model, in Appendix B (Figure A2). Response plots for each variable and variable importance are also included in Appendix C (Figure A3 and Table A1).

2.5. Future Projections

CanaryClim v1.0 covers two climate periods: near-present (1979–2013) and future conditions (2071–2100). We used three future scenarios characterized by different degrees of climate change severity. SSP126 constitutes the scenario with climate action and significant mitigation efforts, and it is the most austere in terms of the consequences of climate change severity. SSP370 reflects a medium sustainability pathway and contemplates some climate actions, but a high emissions rate is still persistent. SSP585 is the “business-as-usual” scenario, which does not consider actions in the fight against global change and their projections of temperature increase, being the least austere. To build final future variables, we averaged the five Global Circulation Models (GCMs: GFDL-ESM4, IPSL-CM4A-LR, MPI-ESM1-2-LR, MRI-ESM2-0, UKESM1-0-LL) of each scenario for each selected predictor, trying to capture all the variability of the future socioeconomic conditions. Then, we projected our ensembled model fitted to current conditions to the future scenarios to forecast favorable areas for invasion under the different projections considered.
Finally, we mapped and evaluated (range change) the differences between current and future favorability for P. ovalis in each island, quantifying overall change (gain, loss, and maintenance) between the current and projected scenarios. We achieved this by using map algebra and the “fuzzyRangeChange” function from the fuzzysim R package [65].

2.6. Extrapolation Assessment

We also studied the potential suitability of P. ovalis in the rest of the islands of the archipelago, projecting the ensemble of models calibrated in Tenerife to La Palma, El Hierro, La Gomera, Gran Canaria, Fuerteventura, and Lanzarote. In addition, we applied Multivariate Environmental Similarity Surfaces (MESS) analysis to identify areas with enhanced reliability for model extrapolation. MESS determines how similar the conditions on other islands are to the current conditions in Tenerife. Positive values of MESS indicate reliable extrapolation, while negative values imply cautious to evaluate the projection of the model in these regions as well as in current and future climatic scenarios (e.g., novel climates not available in the fitted period) [79,80]. For this purpose, we used the ‘MESS’ function of the dismo R package [81], masking the areas with MESS lower to 0 in each considered climatic scenario.
All analyses utilized R 4.4.2 [82]. Tidyterra [83] and ggplot2 [84] were used to produce all the maps and graphs. QGIS 3.34 Prizren was employed for preliminary spatial analysis [85].

3. Results

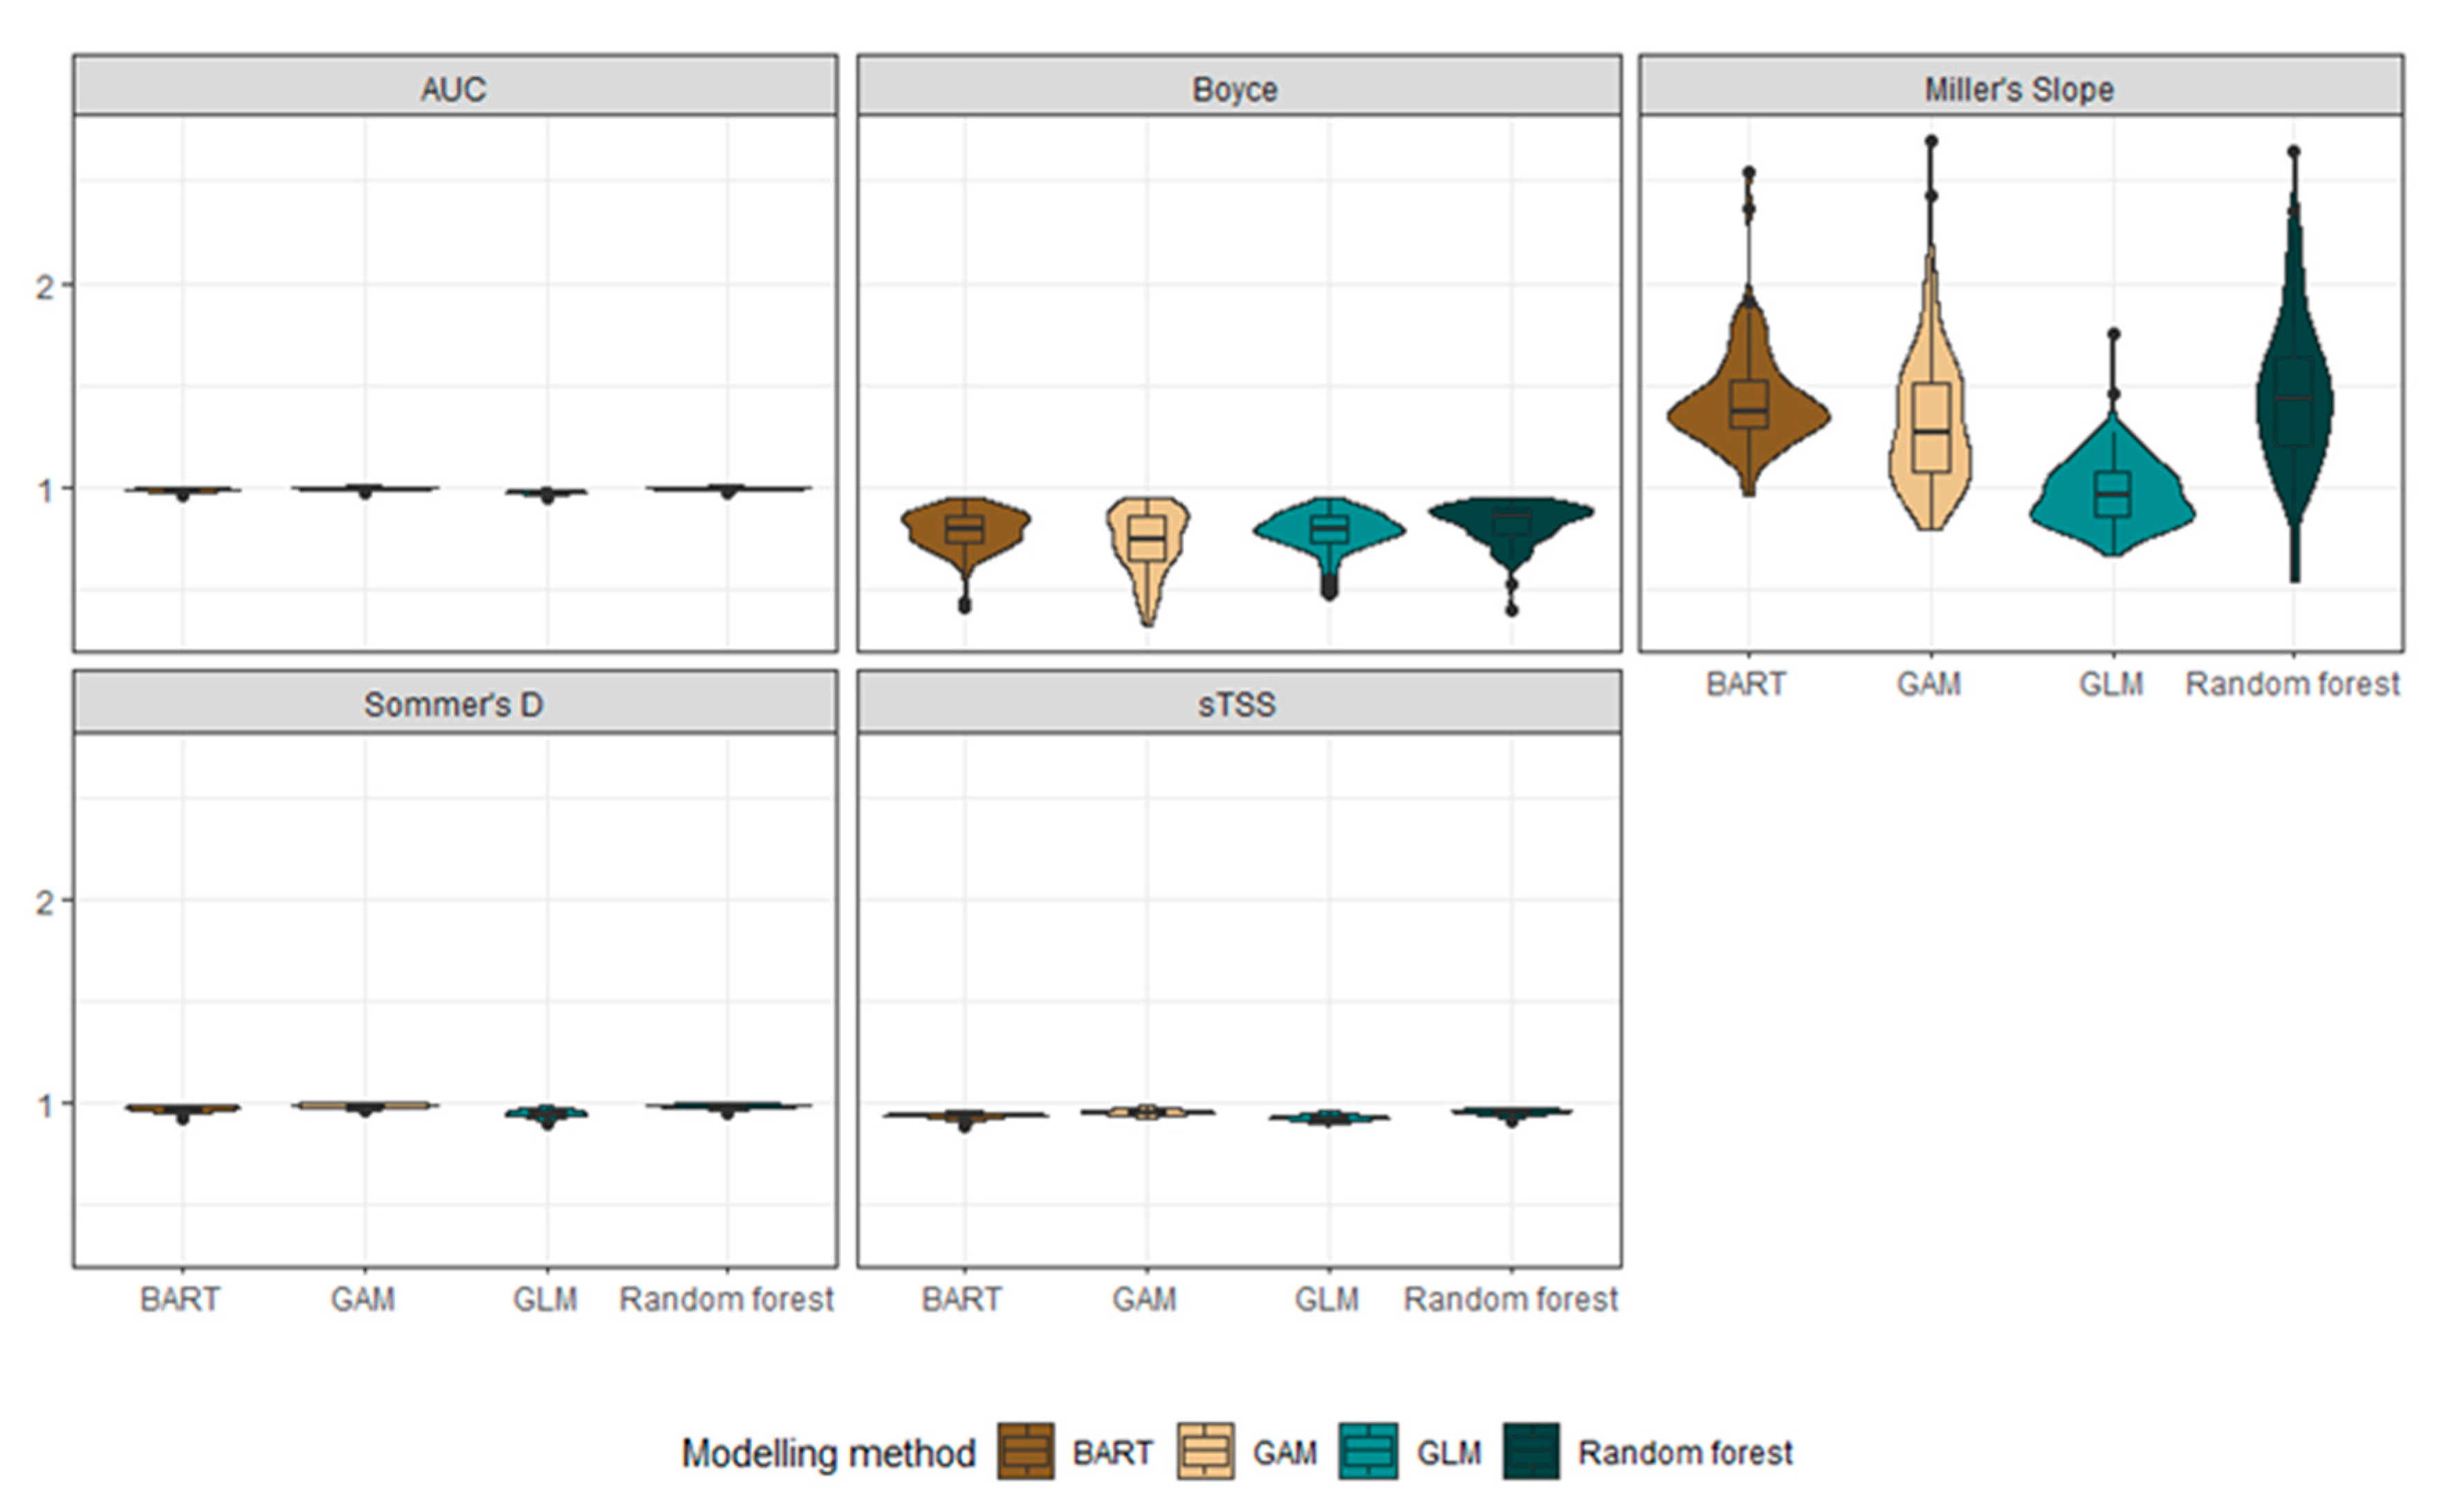
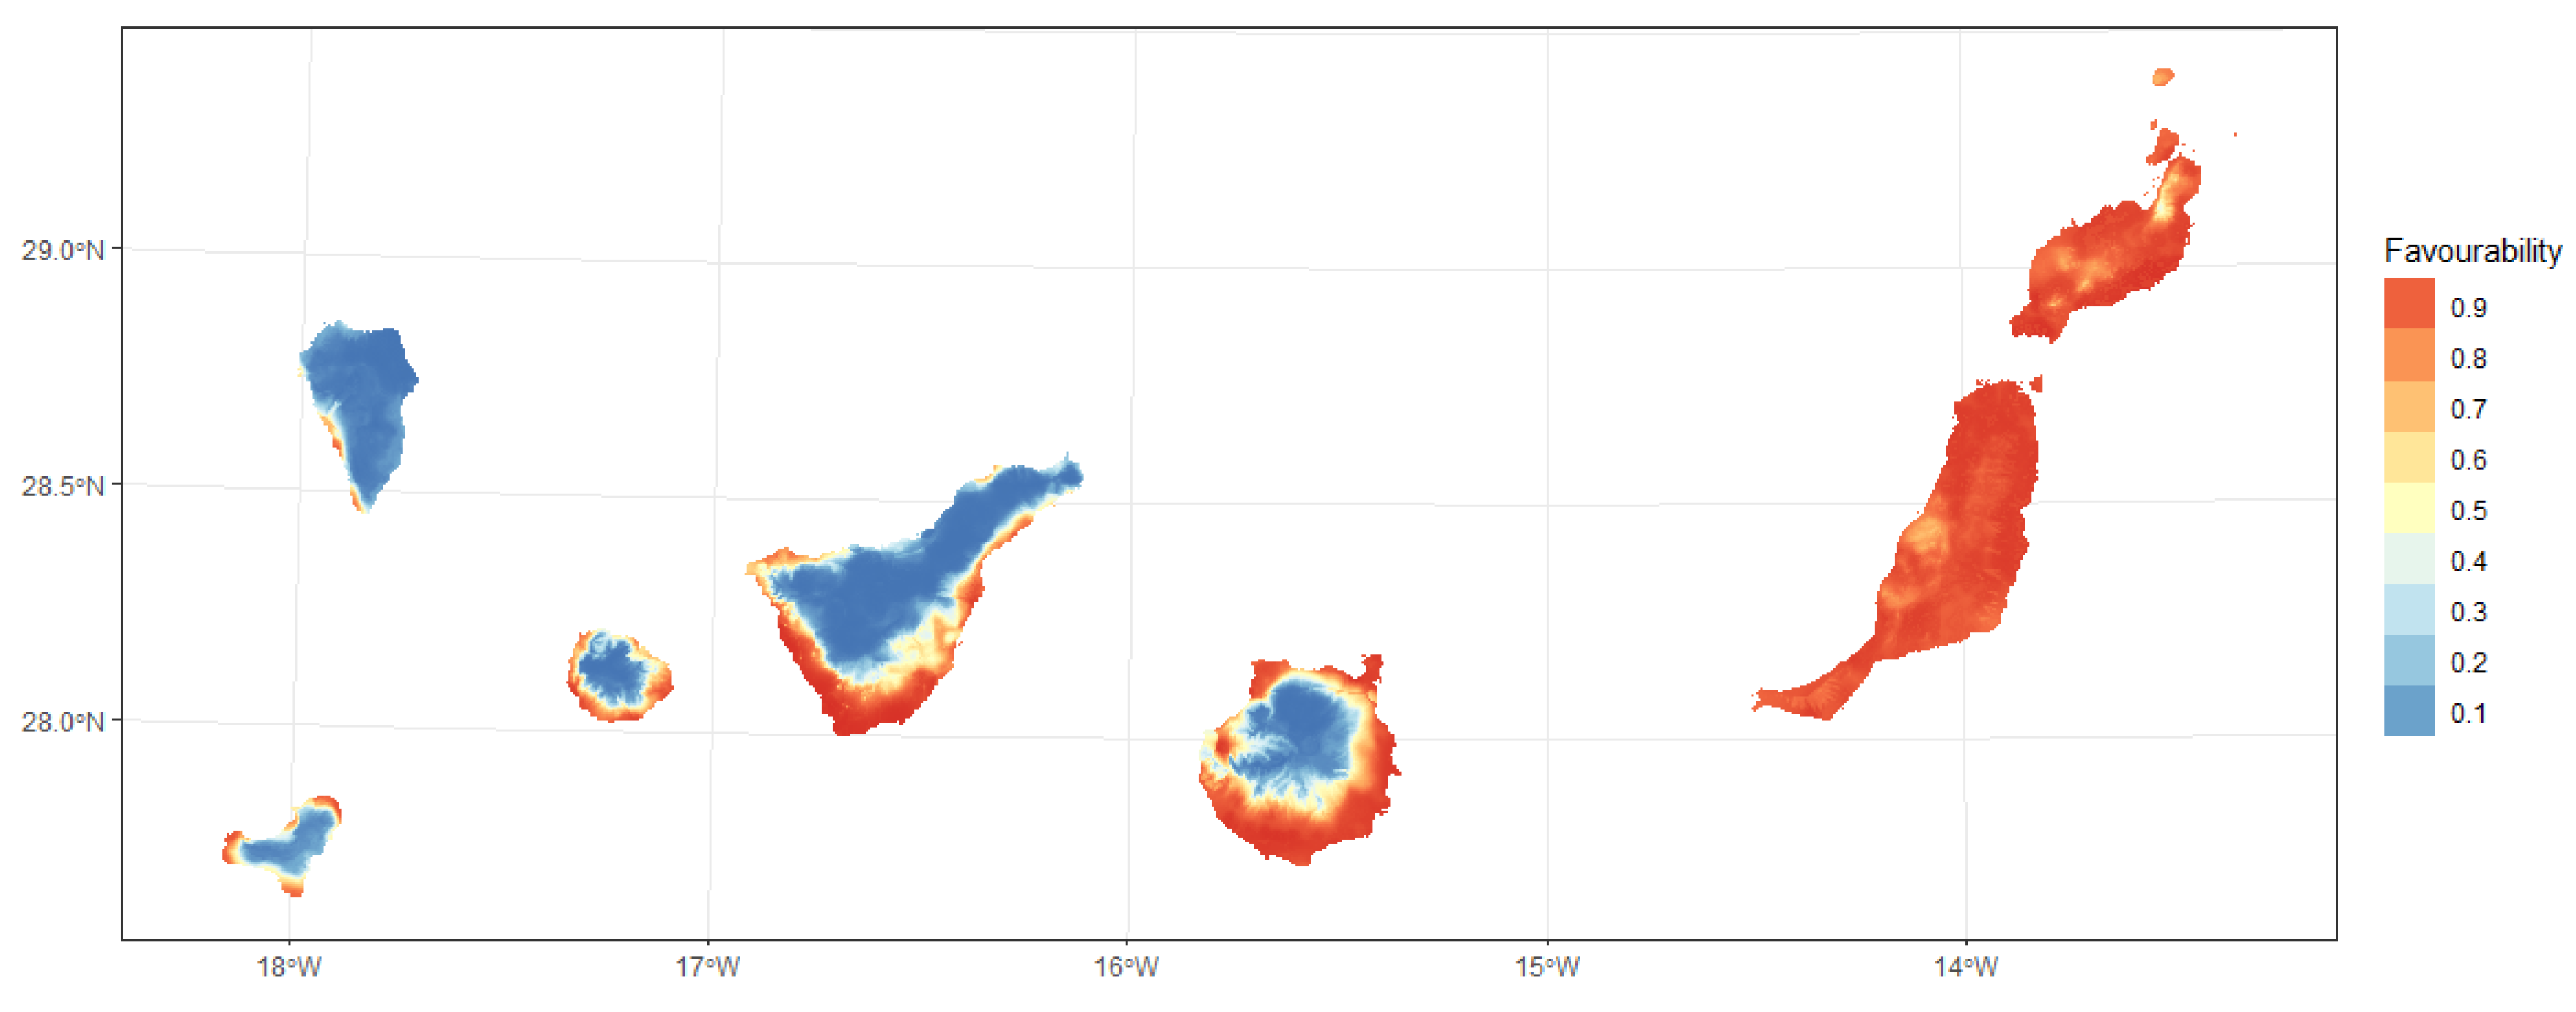
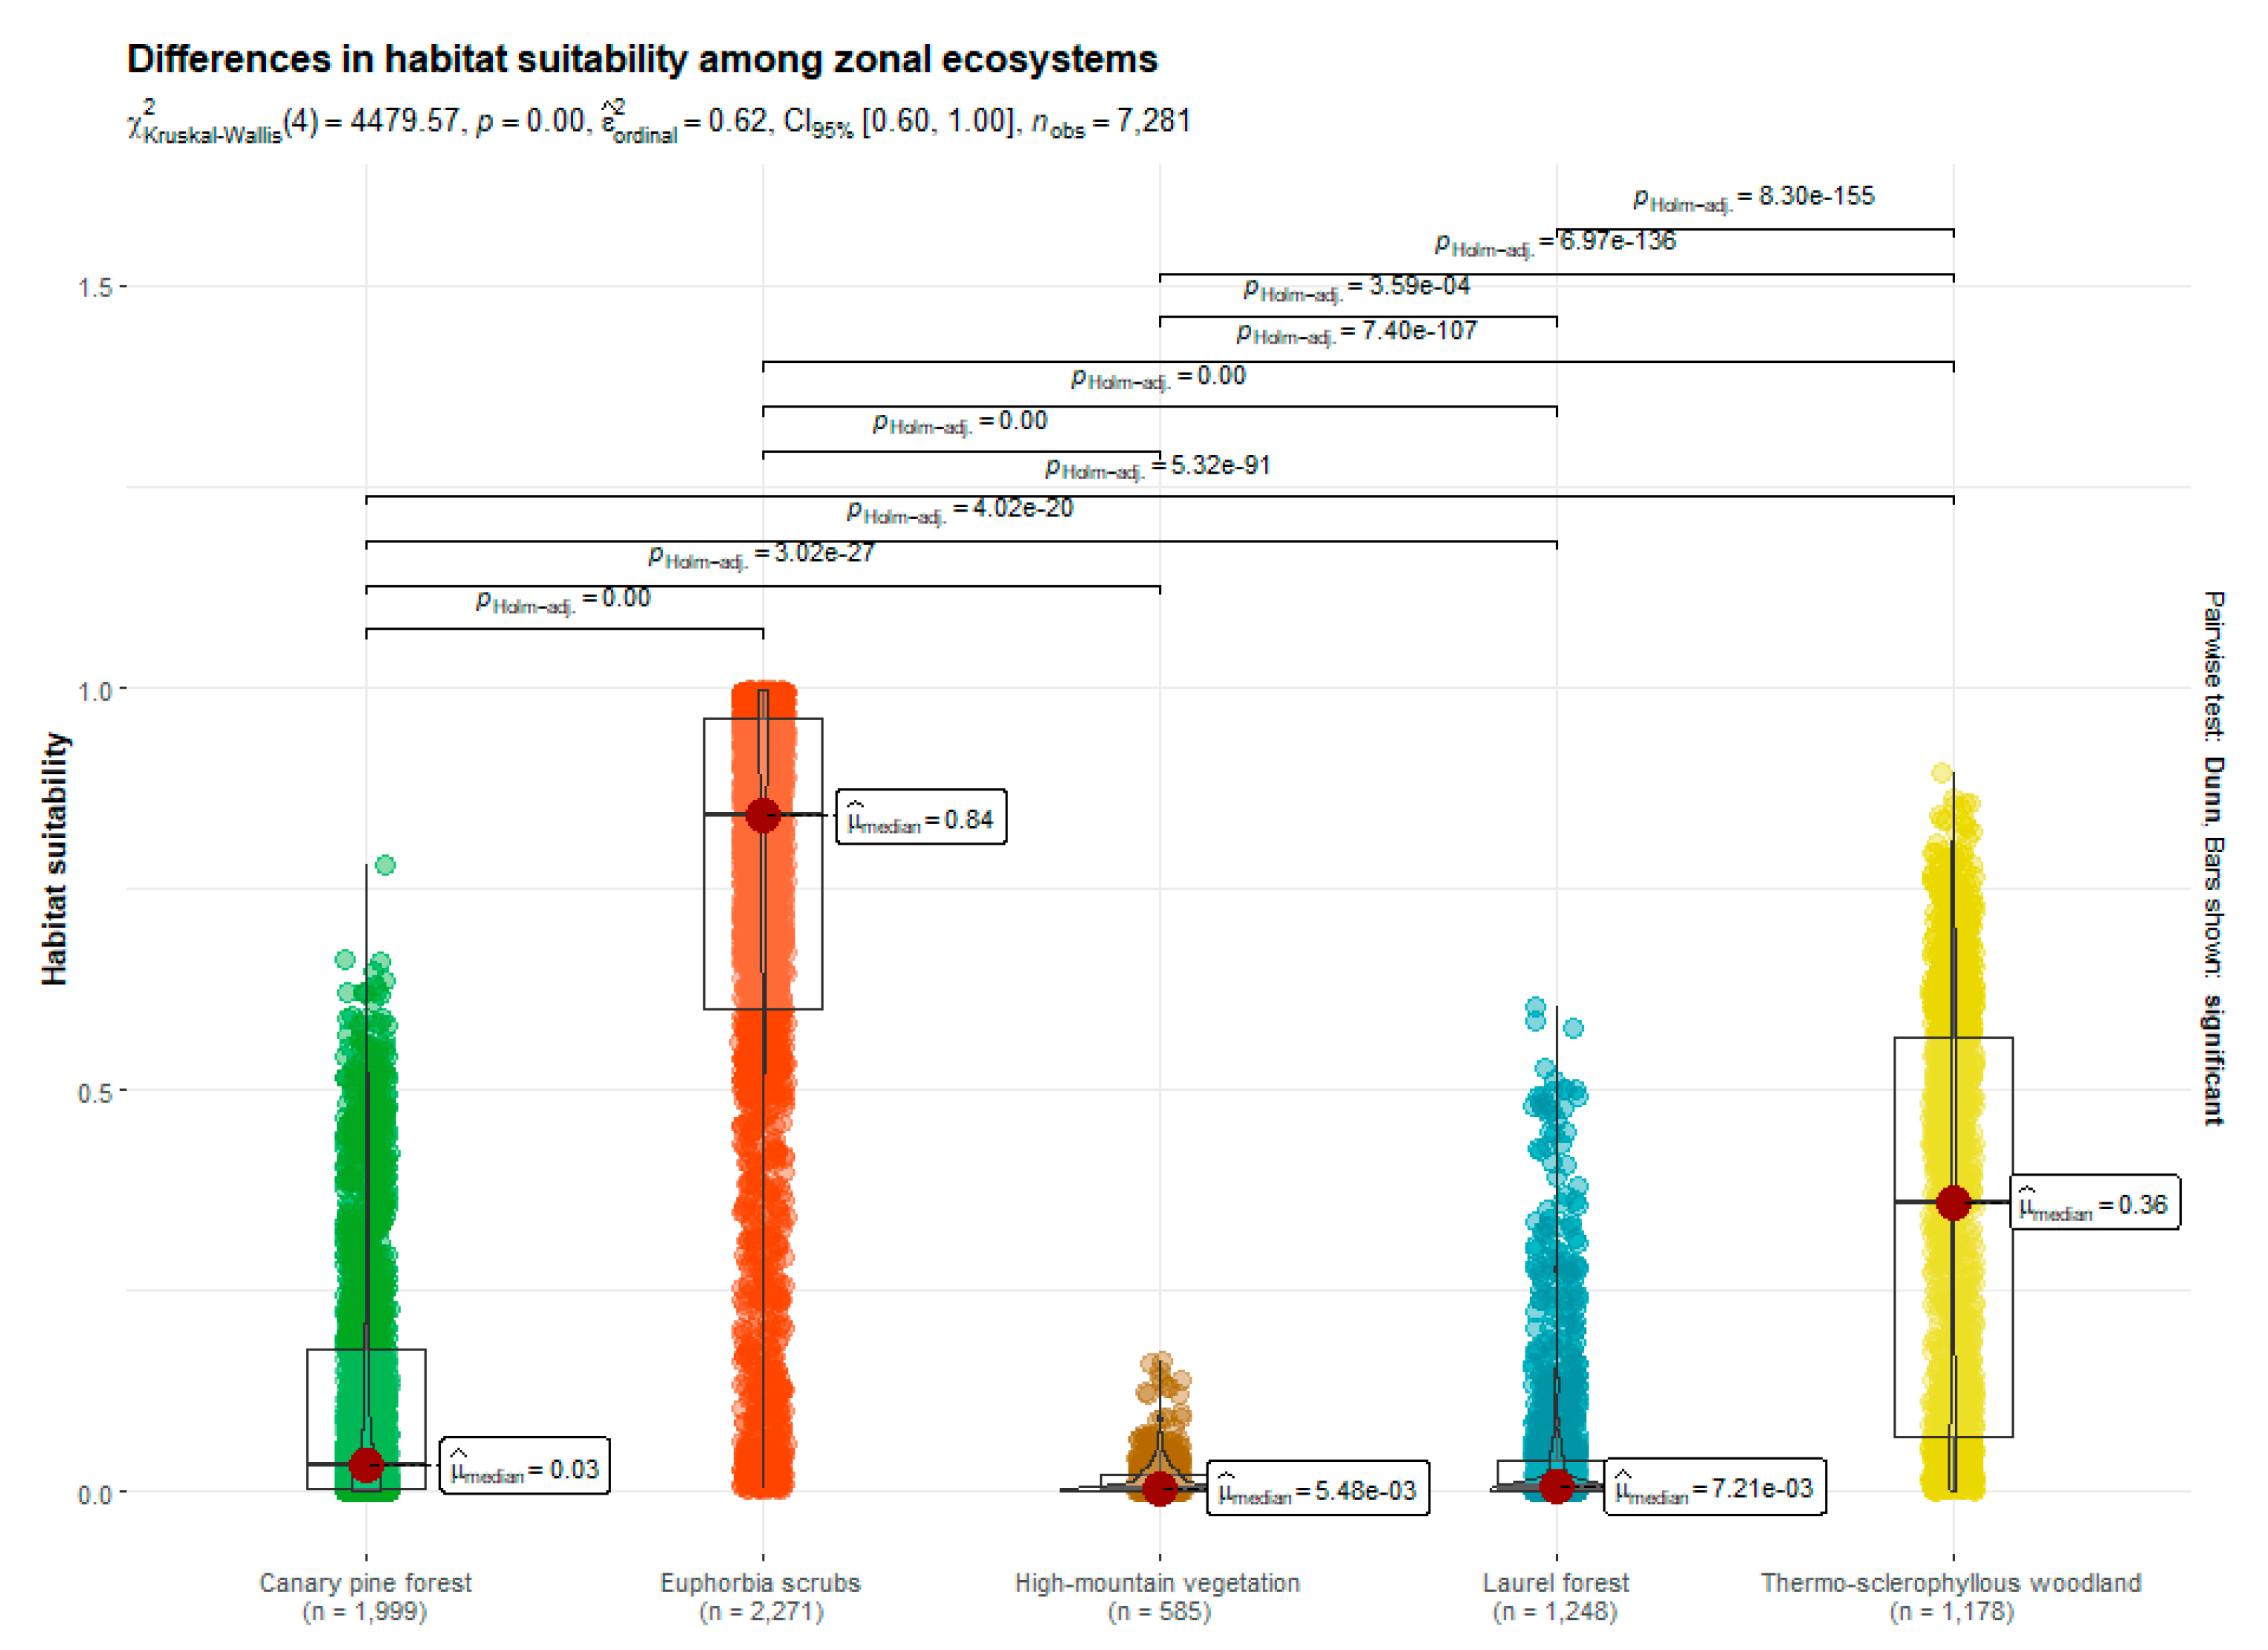
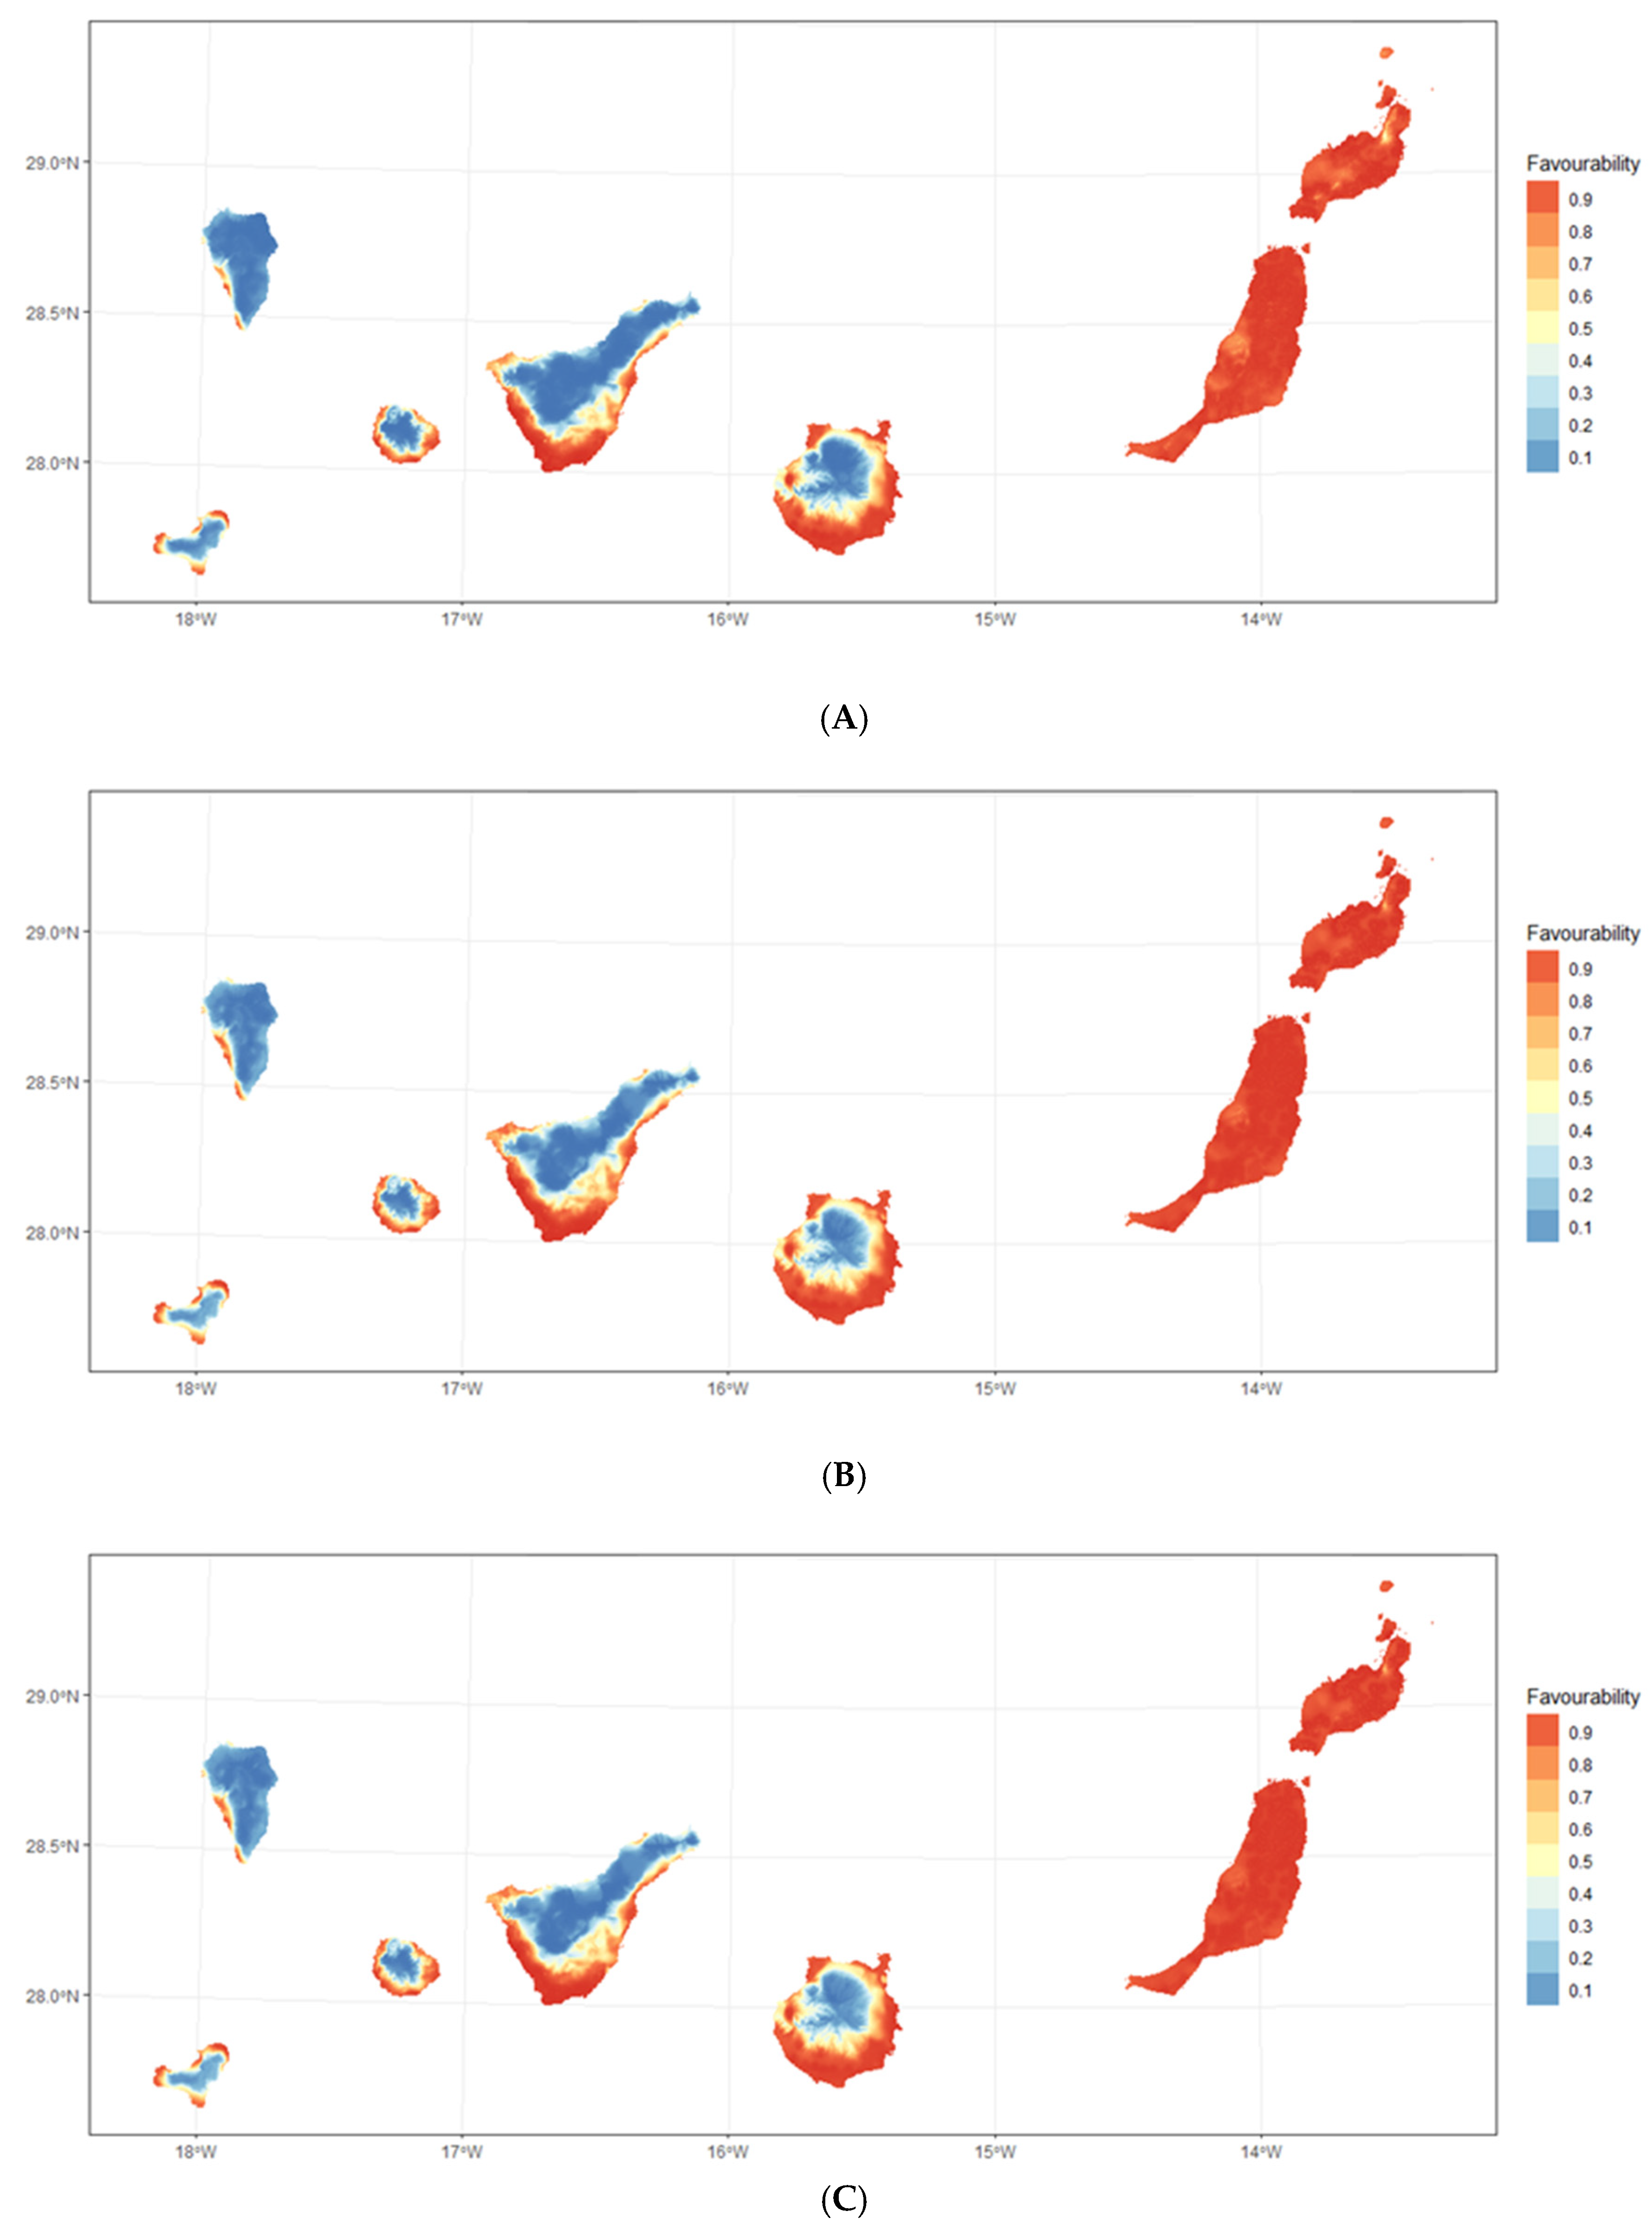
3.1. Habitat Suitabiliy Modeling

The GAM, RF, and BART showed good discrimination and classification performance considering the values of the AUC, Boyce, sTSS, and Sommer’s D metrics on the cross-validation sets, while the GLM showed a generally lower but acceptable performance (Figure 3). Conversely, regarding the reliability (measured by Miller’s slope) of the continuous probability predictions, the GLM consistently demonstrated a superior performance on the cross-validation data. The GAM followed closely, with BART performing slightly less effectively. By contrast, RF produced calibration slopes far from the desired value of 1 and showed high variability.
The ensemble model for the near-present conditions (Figure 4) shows high habitat suitability for P. ovalis in Tenerife’s southern region, which currently hosts the highest number of specimens. In addition, its projection to La Gomera and Gran Canaria shows an important circuminsular distribution, along with a generalized suitability in the easternmost islands, Fuerteventura and Lanzarote. La Palma and El Hierro appear less likely to initially support favorable habitat conditions for the species.
We found statistical differences (Kruskal–Wallis = 4479.6; p-value < 0.001, degrees of freedom = 4, effect size = 0.62) in the habitat suitability for the pairwise comparisons among all of the zonal vegetation groups (Figure 5). Euphorbia scrub exhibited the highest habitat suitability, followed by thermos-sclerophyllous forest and Canary pine forest, in that order. Finally, laurel forest and high mountain vegetation showed low favorability values.

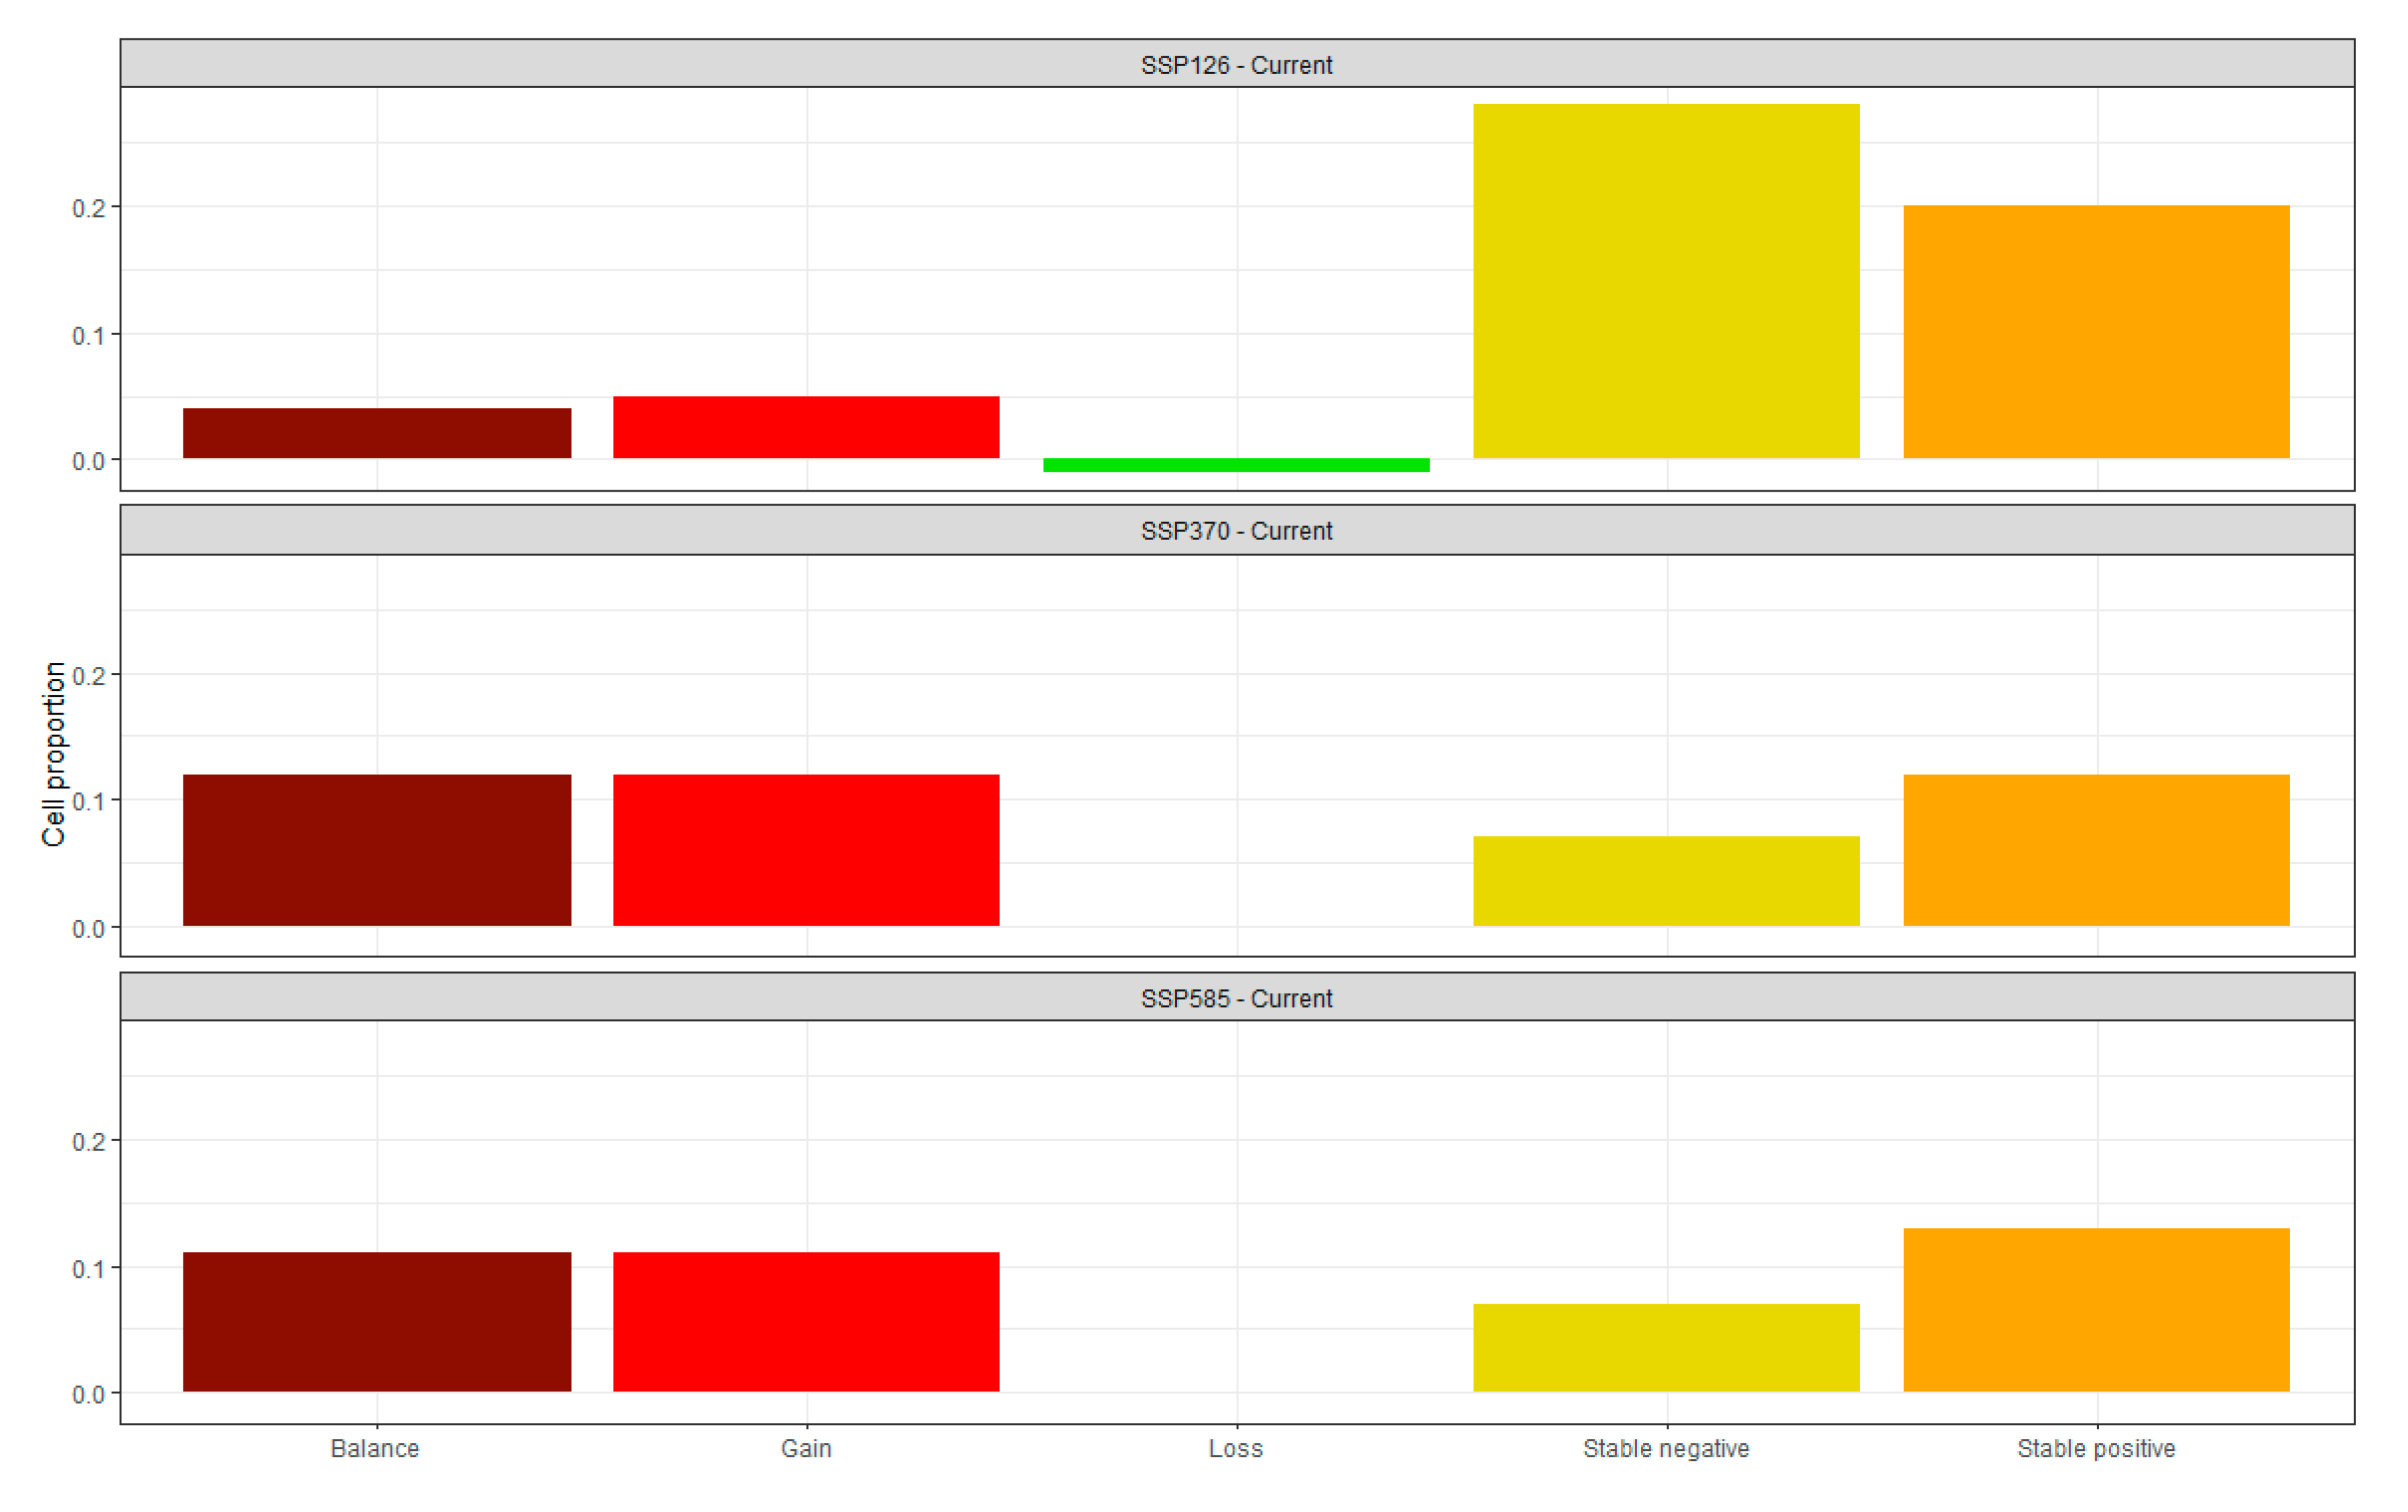
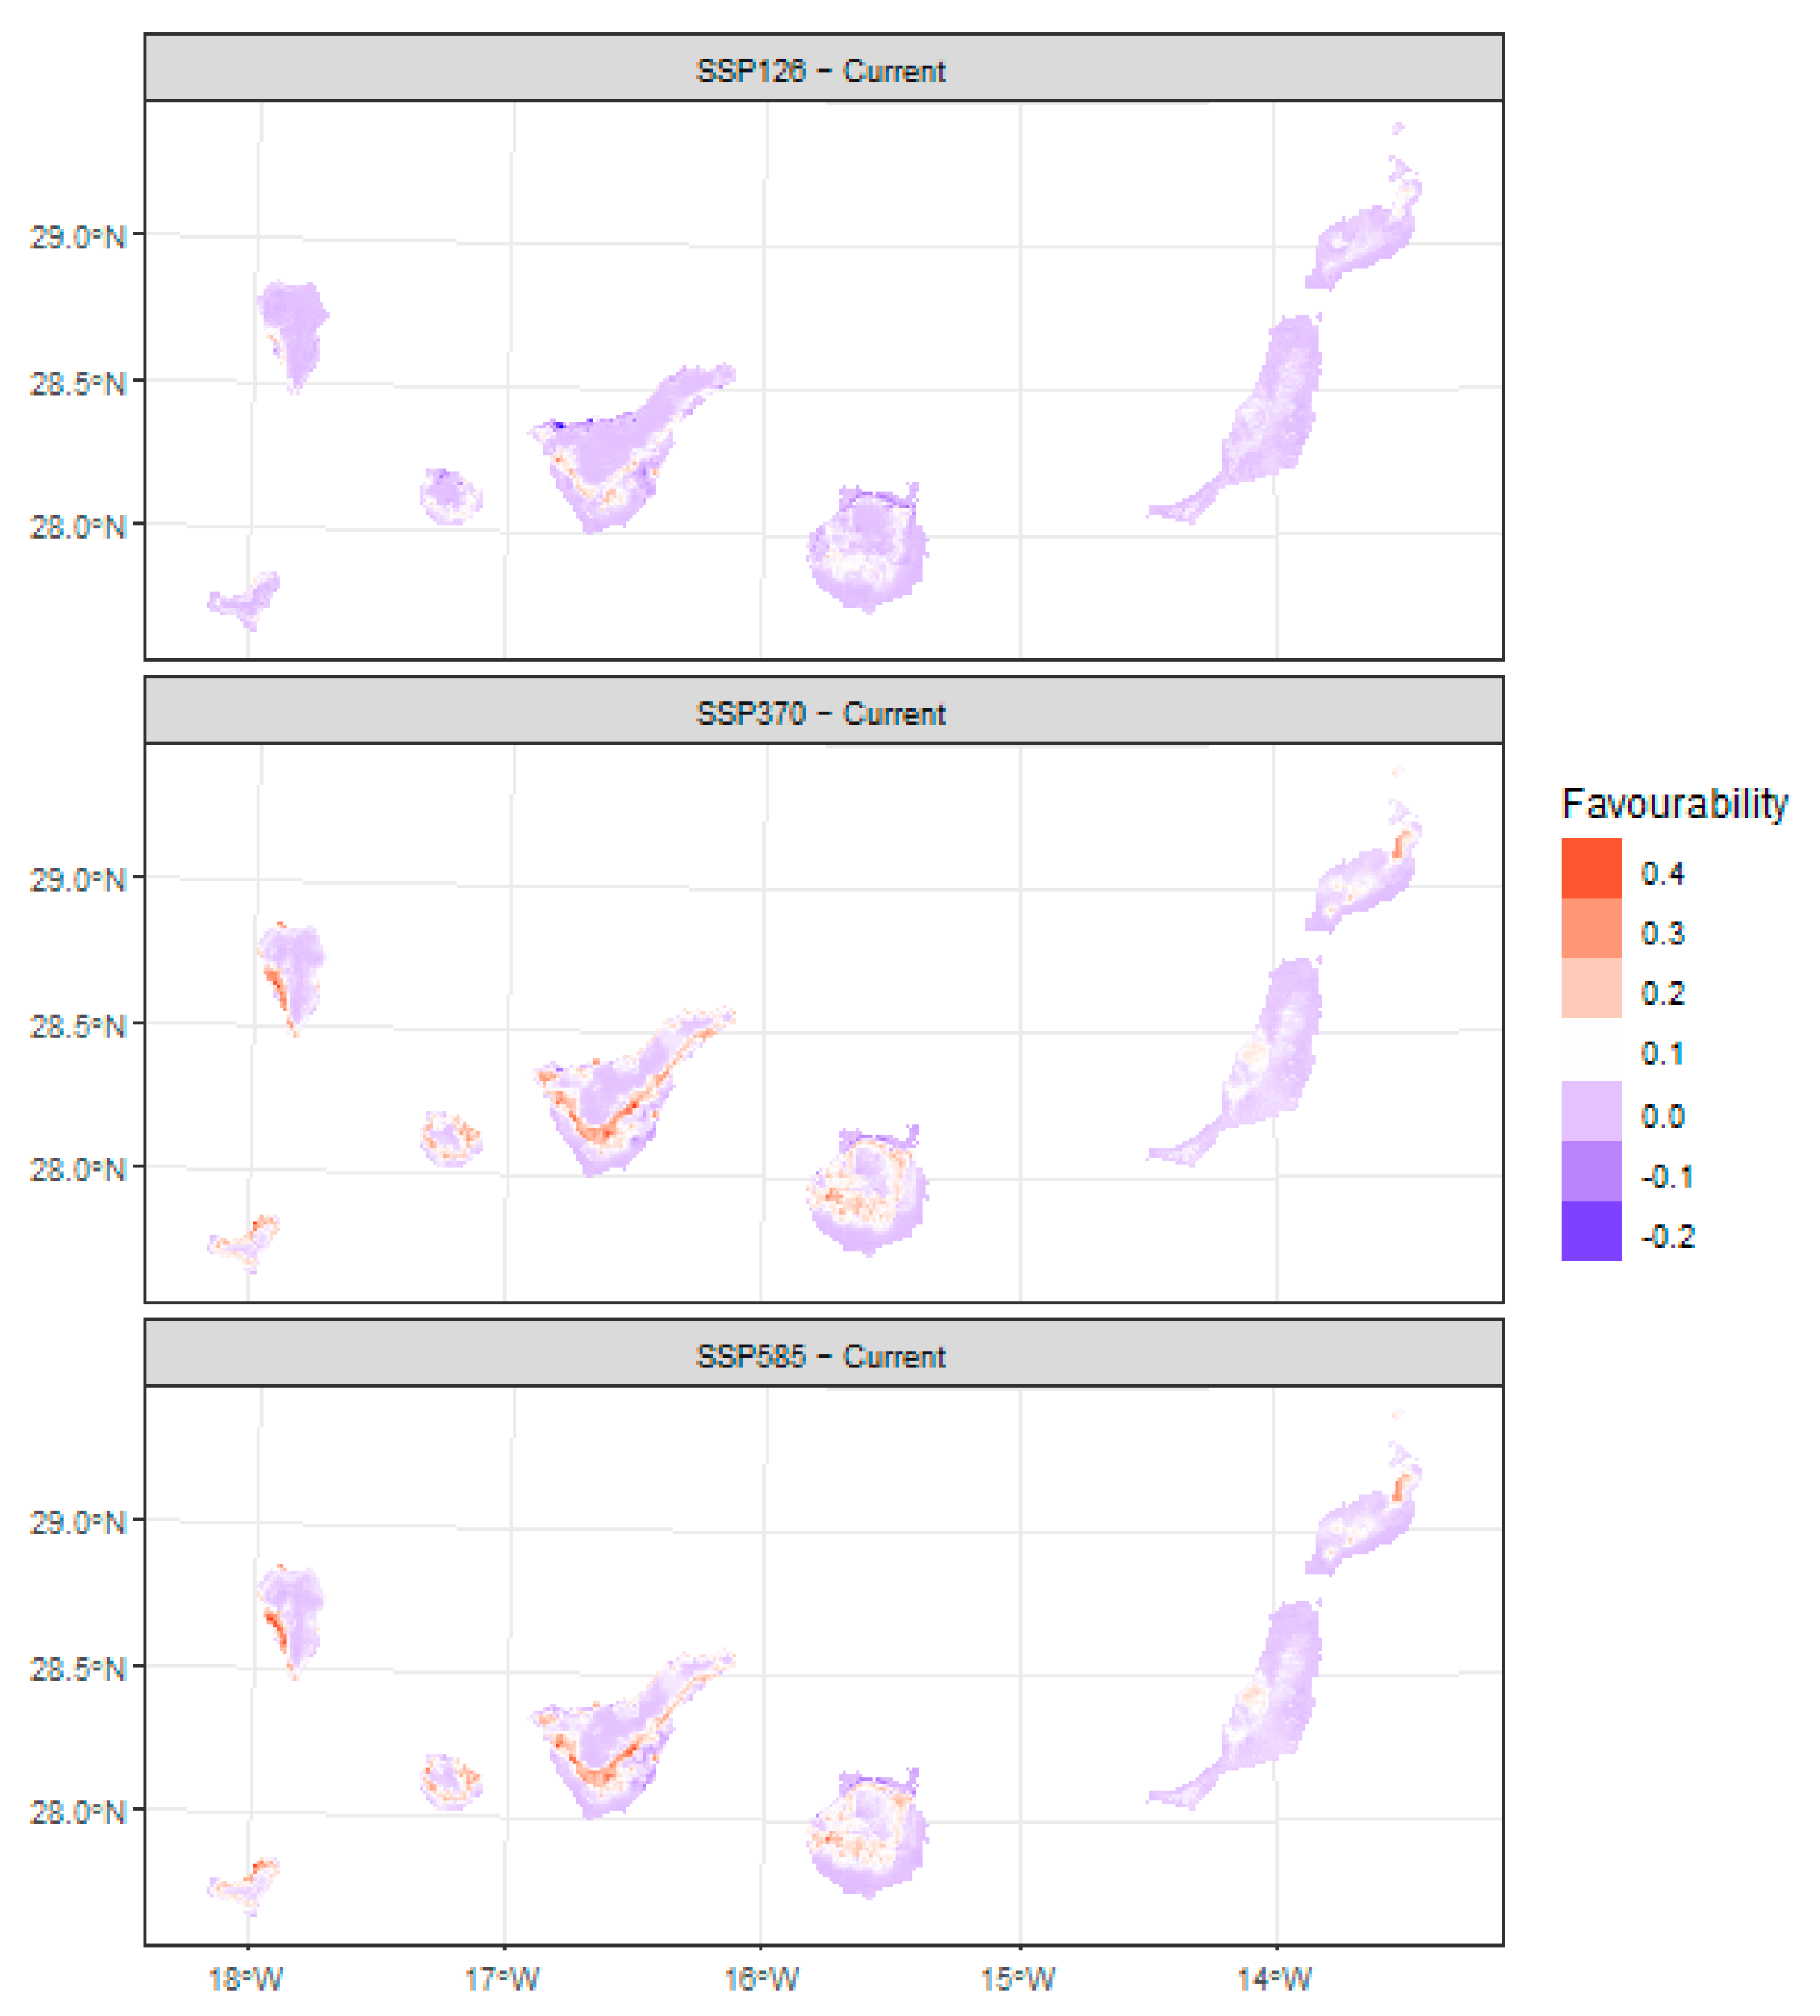
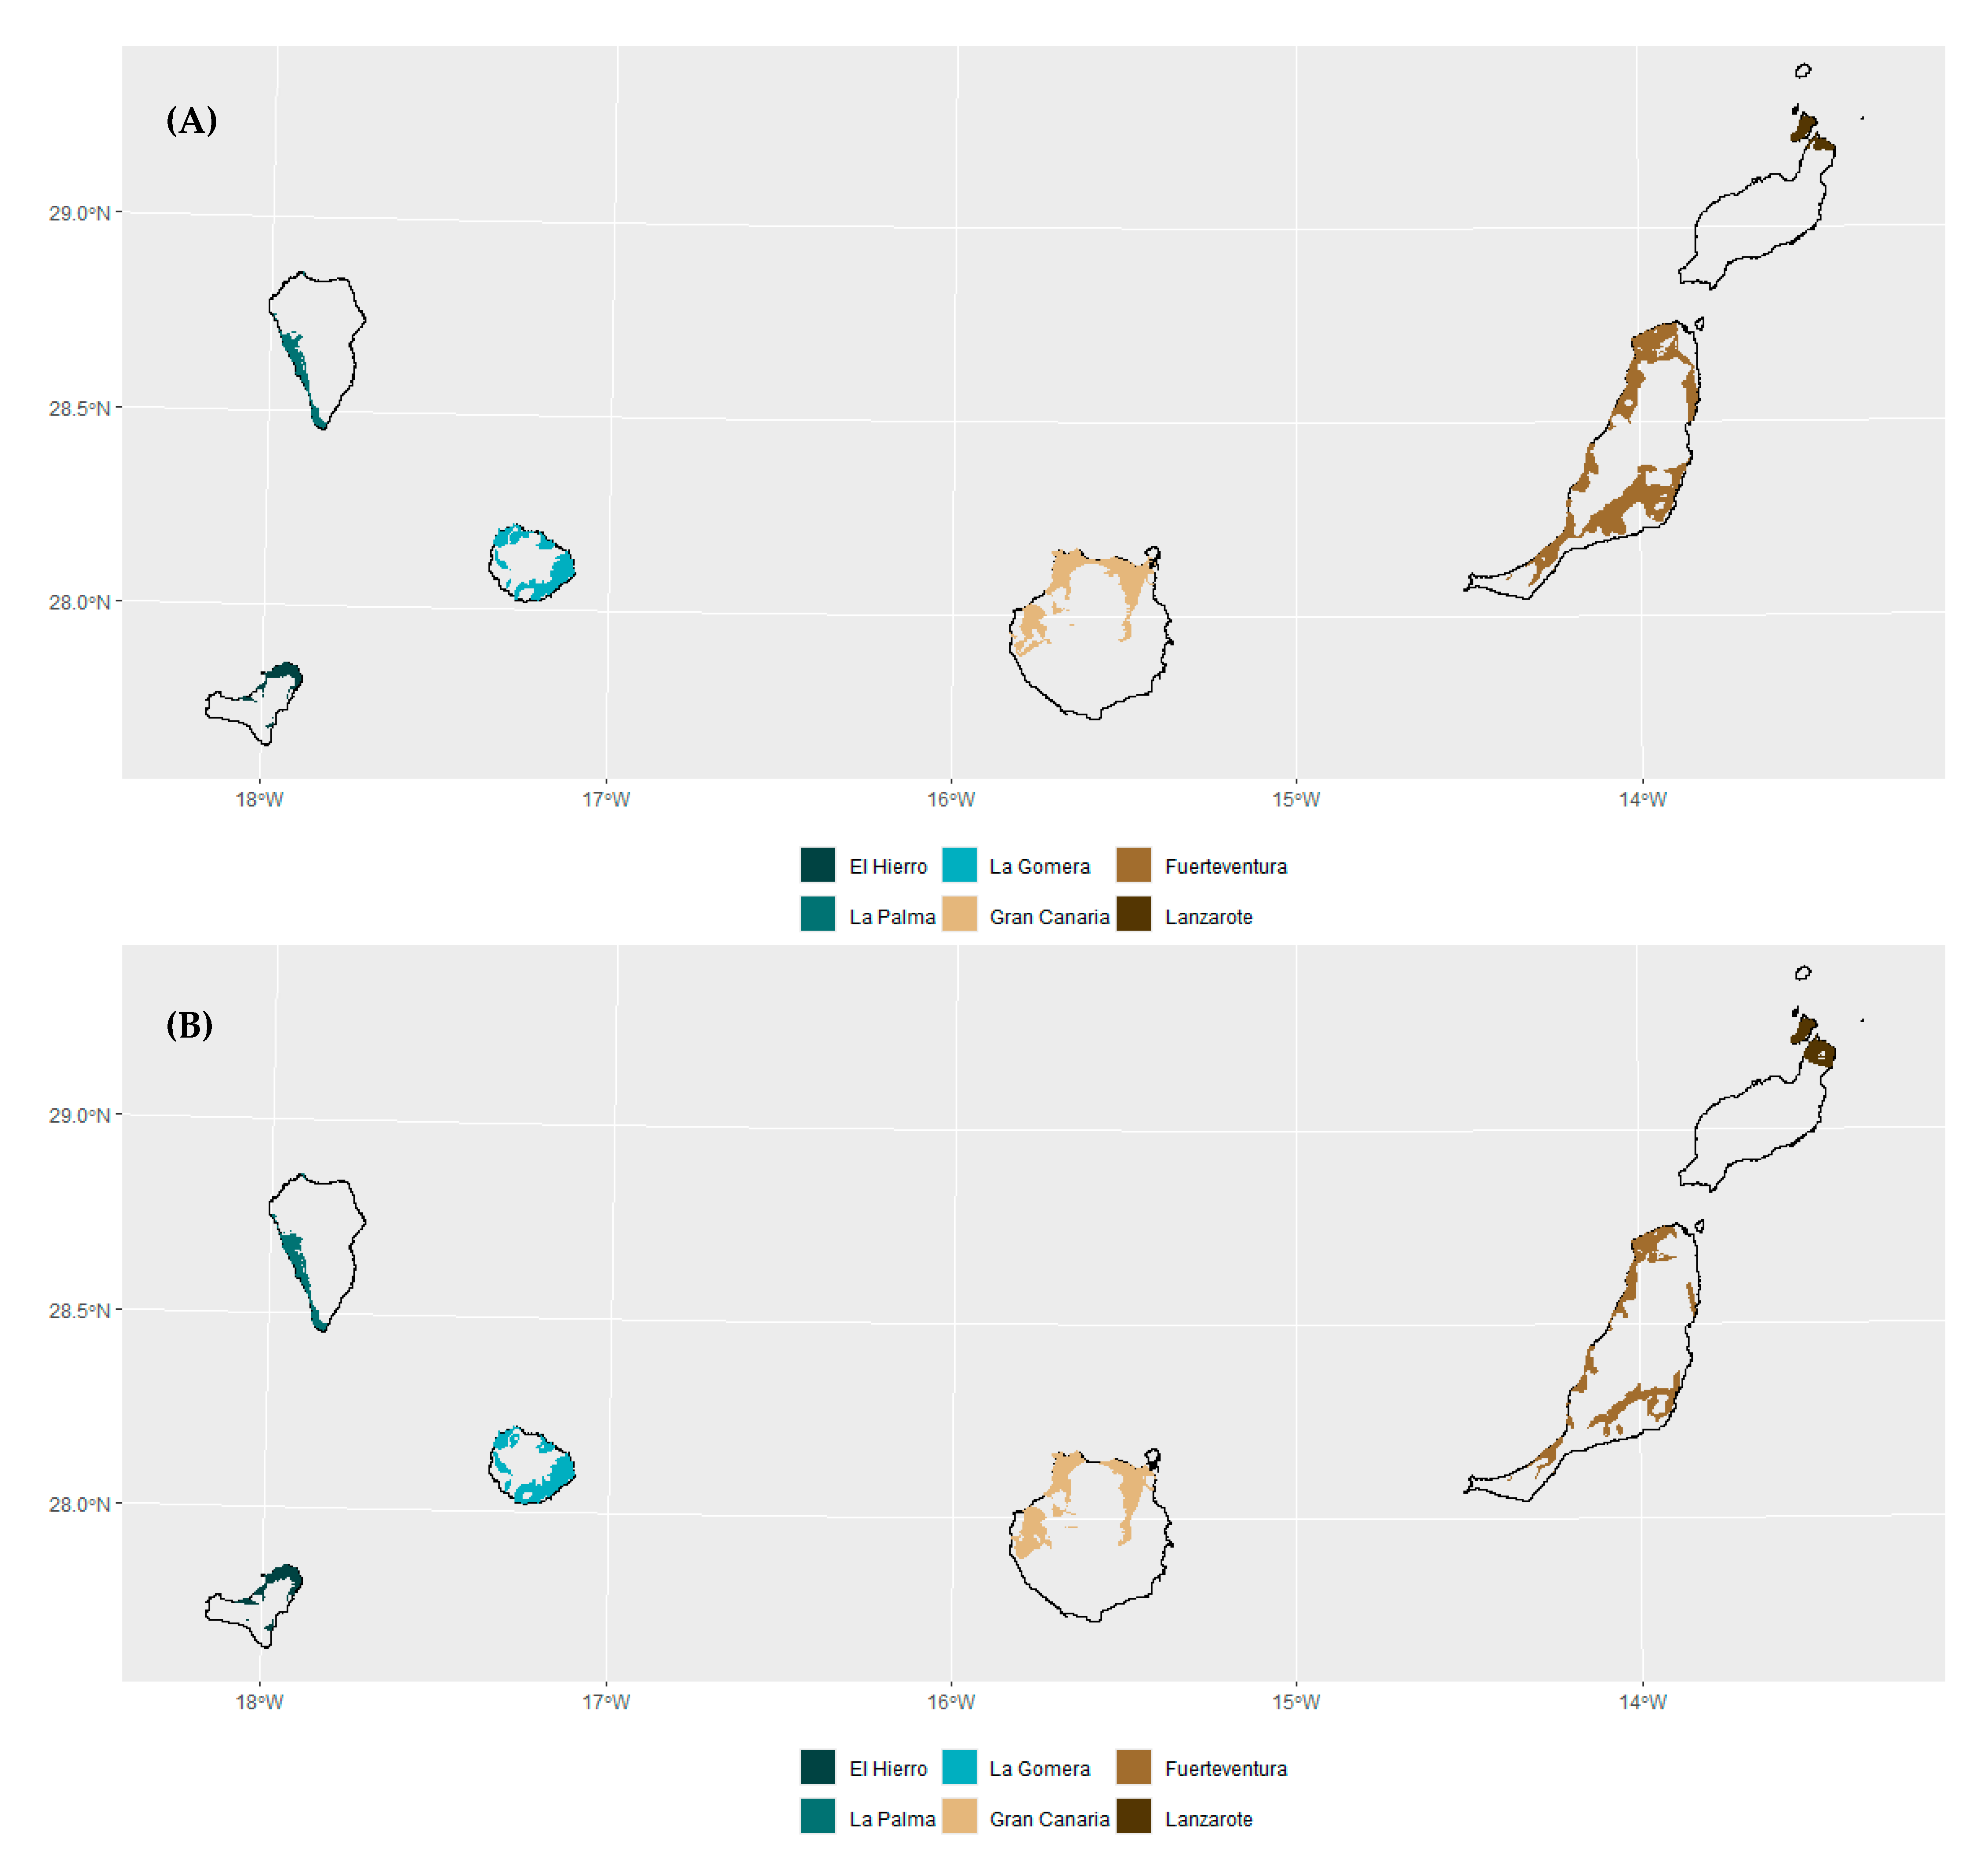
3.2. Future Projections and Changes in Site Suitability

The differences between the scenarios and the current conditions tend predominantly towards an increase in favorability for P. ovalis (Figure 6), especially in the westernmost islands and Gran Canaria, as well as in the Famara massif in Lanzarote. This area under the scenario closest to the current one is less suitable for P. ovalis. Particularly prominent conditions and predictions occur in the southwest of La Palma (Figure 7). During the least extreme scenario, the favorability remains relatively stable, although the northern regions of Tenerife experience some net losses. In addition, many cells with low favorability values preserve their status. If we consider the extreme scenarios (SSP 370 and SSP 585), the total area with favorable conditions increases overall, with the most significant growth observed in the midlands of Tenerife and Gran Canaria, as well as in the northern regions of La Gomera and El Hierro. This fact is reflected in an increment in the proportion of changing and gaining cells (in terms of the increase in favorability). More details are presented in Appendix D (Figure A4), which includes a bar plot showing the fuzzy range change in the cells for each climate scenario comparison.

3.3. Extrapolation Assessment

The MESS results by scenario reflect that the environmental similarity of the archipelago with the reference conditions of Tenerife and the scarce occurrences of P. ovalis in La Gomera and Fuerteventura is well maintained in the north and northeast of El Hierro, the southwest of La Palma, and the midlands of La Gomera and Gran Canaria, as well as the north of Lanzarote (Figure 8). This indicates a remarkable persistence in its spatial coverage across each climate scenario considered, precisely in those areas that the models mark as highly favorable for the species. Conversely, in Fuerteventura, despite the high suitability obtained in all of the projections, the MESS analysis reports a decrease in the suitability of the ecological conditions and a detrimental impact on the reliability of the projections in space and time, primarily when considering extreme climate change scenarios, with a gradual disappearance of the area where extrapolation is reliable.

4. Discussion

The models produced in this work point to significant habitat suitability for Pluchea ovalis in Tenerife, where these models have been calibrated and trained, and in the rest of the Canary Islands. Even if they do not intervene in the modeling, there are locations of the species reported in La Gomera and Fuerteventura that are sites marked with high favorability for the species. This suitability increases with extreme climate change projections. In addition, the current ecological conditions apply to the species across the entire archipelago except Fuerteventura in each climatic period analyzed. This information offers valuable insights into the potential invasion of P. ovalis in the Canaries, which could be relevant for management strategies and decision-making. Ecosystems vary in their level of invasibility, requiring the consideration of factors such as disturbance, climate, biotic resistance, and propagule pressure when assessing invasion levels [86,87,88]. According to our results, P. ovalis shows greater favorability for occupying Euphorbia scrub in the arid and semiarid infra-Mediterranean bioclimates, as well as thermo-sclerophyllous woodlands. Consistently, both ecosystems showed the highest richness in non-native species in one elevation–perturbation gradient [89,90], and they coincided with the highly transformed areas currently occupying a coverage much smaller than their potential [91]. Thermic pine forests, situated on the southern slope of the island, also show high habitat suitability values. Furthermore, humid pine forests, laurel forests, and high-mountain ecosystems are less suitable for invasion. Canarian plant communities are considered more resistant to invasion [92], particularly compared to other oceanic floras [93].
In the first state evaluated (near-present conditions), the species showed a crucial invasive potential in the central and easternmost islands. Other invasive species assessed in the Canary Islands have shown similar patterns, as in the case of the California Kingsnake (Lampropeltis calfiorniae) [94]. Conversely, El Hierro and, especially, La Palma may offer less favorable conditions for the species under milder climate change projections, which predict local losses in favorability. However, under the most extreme climate change scenarios, these islands could face a higher risk of invasion. Under such projections, regions once deemed unsuitable may become favorable, and areas where invasive species are currently absent could see their presence established. This scenario represents the highest likelihood for invasion to materialize. Additionally, we conducted an extrapolation assessment, which involved analyzing environments different from those used to calibrate the model [95]. This analysis supports the maintenance of ecological calibration conditions on El Hierro and La Palma, as well as on La Gomera, Gran Canaria, and the north of Lanzarote. This tool provides valuable and complementary information concerning habitat suitability models. Integrating both approaches is crucial for managing and identifying future areas prone to invasion, particularly in the westernmost islands.
Assessing invasibility from predictions derived from SDMs is challenging and should be interpreted carefully. Some SDMs depend exclusively on climatic variables to estimate the range and dispersal potential of invasive species, leading to a more limited understanding of how extreme climate change affects species distributions. Typically, variables that consider the effects on land use or anthropogenic effects have produced improved predictions [96,97], especially in the case of human-induced invasions. Similarly, other research has highlighted the impact of anthropogenic pressure, urbanization, trails, corridors, and road density in modifying habitats [98,99], serving as starting points or facilitating the spread of invasive alien species, as well as a lack of management of ravines [100] and the effects of human–climate interactions [101,102].
The climate matching hypothesis suggests that invasive alien species are more likely to establish in areas with climates similar to their native environmental ranges [103,104]. According to their original geographic range, P. ovalis occurs in drier areas of Africa, Asia, Comoros, Madagascar, and in tropical biomes [48,49,50,51,52,53,54,55,56,57,58,59,60,61,62,63,64,65,66,67,68,69,70,71,72,73,74,75,76,77,78,79,80,81,82,83,84,85,86,87,88,89,90,91,92,93,94,95,96,97,98,99,100,101,102,103,104,105], so more arid and less climatically and topographically variable islands like Lanzarote and Fuerteventura, as well as the south of Tenerife and Gran Canaria, could present environmental favorability for the species. This aligns with the results of our models and the distribution of suitability in the island’s most arid and thermic ecosystems. Climate, in particular, has been identified as one of the most critical factors driving invasion in the Canary Islands [106].
Other authors have suggested that some invasive species tend to experience niche shifts during the invasion process, so the climatic features of the area of origin and the invaded area differ [107,108,109]. In the early stages of invasion, SDMs fitted using non-native ranges may not be consistent with the real climatic niche of the species, and even less so at a time of imbalance with the new environment, expanding to all favorable zones [110]. For this reason, some authors have recommended generating SDMs using data from native and invasive areas or considering approaches that account for the lack of equilibrium with the new environment [111].
Restricted to insular environments, some studies have emphasized the need to incorporate global model predictions into local predictions, provided sufficient data are available, in order to more accurately assess a species’ niche in the invaded site [112]. These types of nested hierarchical models [113] could be particularly useful for species that are widely distributed and have a well-established invasive history, helping to improve extrapolation issues. Moreover, in cases where only global data are reliable and unbiased, this approach could serve as a valuable tool for anticipating and mitigating the spread of invasive species [114,115]. This method may show that regional projections tend to offer more conservative predictions than global models, providing insights into the invasion phase and suggesting that the spread could continue. However, some authors argue that this could lead to underestimations of invasion [116]. In the case of Pluchea genus invasion, where there are differences in data quality between native and invaded ranges [117], this may even involve sacrificing the resolution of local predictions. In such cases, island-scale models could be the most suitable solution.

5. Conclusions

A key finding of our research is the significant invasive potential of the species across the entire archipelago, with important implications for applied conservation. The projected results of climate change models may worsen the situation, increasing the suitability for the species. SDMs allow us to assess the potential risk of invasion for each ecosystem and each climatic projection and can support the implementation of actions to reduce the impacts and the spread of P. ovalis. Efforts should focus on controlling gardening and canals, the primary entry routes, eradicating species from ravines, and implementing early detection. Public awareness of the impact of invasive species and the promotion of citizen science have been appointed as considerable agents in monitoring biological invasions, providing significant information to professionals to develop more accurate habitat suitability predictions.

Author Contributions

Conceptualization, writing—original draft preparation and modeling methodology, J.J.G.-A.; conceptualization and data curation, M.P.-G.; validation, J.R.A. and M.P.-G.; writing—review and editing, C.G.-M., J.R.A. and A.N.-C.; supervision, J.R.A. and C.G.-M.; funding acquisition, J.R.A. All authors have read and agreed to the published version of the manuscript.

Funding

This research received no external funding.

Institutional Review Board Statement

Not applicable.

Data Availability Statement

Presence data used for the models can be provided upon request.

Acknowledgments

We thank the “Exmo. Cabildo Insular de Tenerife” and GEPLAN S.L. for the collaboration. We also thank the two anonymous reviewers for their contribution to the improvement of the original manuscript.

Conflicts of Interest

The authors declare that they have no competing interests.

Appendix A

Figure A1. Comparing the distributions of presences vs. pseudo-absences over the environmental predictors.
Diversity 17 00195 g0a1aDiversity 17 00195 g0a1bDiversity 17 00195 g0a1c

Appendix B

Figure A2. Map of the pixel-level variance of the ensemble predictions. Taken as a metric of uncertainty in the models.
Diversity 17 00195 g0a2

Appendix C

Table A1. Environmental variables and their average contribution (%) in the models.
VariableImportance (%)
BIO311.5
BIO412.9
BIO912.4
BIO1214.4
BIO1411.5
BIO1513.1
BIO1812
Distance to anthropic areas11.9
Figure A3. Individual variable response plot, using a confidence interval of 95% (linewidth).
Diversity 17 00195 g0a3

Appendix D

Figure A4. Bar plots of fuzzy range change (overall change (balance), proportional gain, loss, and maintenance of absences (stable negative) and presences (stable positive)) in areas favorable for presence; based on ensembled favorability between the periods 1979–2013 and 2071–2100.
Diversity 17 00195 g0a4

References

  1. van Kleunen, M.; Dawson, W.; Essl, F.; Pergl, J.; Winter, M.; Weber, E.; Kreft, H.; Weigelt, P.; Kartesz, J.; Nishino, M.; et al. Global exchange and accumulation of non-native plants. Nature 2015, 525, 100–103. [Google Scholar] [CrossRef] [PubMed]
  2. Seebens, H. No saturation in the accumulation of alien species worldwide. Nat. Commun. 2017, 8, 14435. [Google Scholar] [CrossRef] [PubMed]
  3. Pyšek, P.; Richardson, D.M.; Rejmánek, M.; Webster, G.L.; Williamson, M.; Kirschner, J. Alien plants in checklists and floras: Towards better communication between taxonomists and ecologists. Taxon 2004, 53, 131–143. [Google Scholar] [CrossRef]
  4. Pfadenhauer, W.G.; DiRenzo, G.V.; Bradley, B.A. Human activity drives establishment, but not invasion, of non-native plants on islands. Ecography 2024, 2024, e07379. [Google Scholar] [CrossRef]
  5. Carford, J.A.; Vesk, P.A.; Richardson, D.M.; Pysek, P. Quantifying levels of biological invasion: Towards the objective classification of invaded and invasible ecosystems. Glob. Change Biol. 2012, 18, 44–62. [Google Scholar] [CrossRef]
  6. Bellard, C.; Cassey, P.; Blackburn, T.M. Alien species as a driver or recent extinctions. Biol. Lett. 2016, 12, 20150623. [Google Scholar] [CrossRef]
  7. IPBES. Global Assessment Report on Biodiversity and Ecosystem Services of the Intergovernmental Science-Policy Platform on Biodiversity and Ecosystem Services; Brondizio, E.S., Settele, J., Díaz, S., Ngo, H.T., Eds.; IPBES Secretariat: Bonn, Germany, 2019. [Google Scholar] [CrossRef]
  8. Gallardo, B.; Bacher, S.; Barbosa, A.M.; Gallier, L.; González-Moreno, P.; Martínez-Bolea, V.; Sorte, C.; Vimercanti, G.; Vilá, M. Risk posed by invasive species to the provision of ecosystem services in Europe. Nat. Commun. 2024, 15, 2631. [Google Scholar] [CrossRef]
  9. Whittaker, R.J.; Fernández-Palacios, J.M. Island Biogeography. Ecology, Evolution and Conservation, 2nd ed.; Oxford University Press: Oxford, UK, 2007. [Google Scholar]
  10. Fernández-Palacios, J.M.; Otto, R.; Borregaard, M.K.; Kreft, H.; Price, J.P.; Steinbauer, M.J.; Weigelt, P.; Whittaker, R.J. Evolutionary winners are ecological losers among oceanic islands plants. J. Biogeogr. 2021, 48, 2186–2198. [Google Scholar] [CrossRef]
  11. Schrader, J.; Weigelt, P.; Cai, L.; Westoby, M.; Fernández-Palacios, J.M.; Cabezas, F.J.; Plunkett, G.M.; Ranker, T.M.; Triantis, K.M.; Trigas, P.; et al. Islands are key for protecting the world’s plant endemism. Nature 2024, 634, 868–874. [Google Scholar] [CrossRef]
  12. Fernández-Palacios, J.M.; Kreft, H.; Irl, S.D.H.; Norder, S.; Ah-Peng, C.; Borges, P.A.V.; Burns, K.C.; de Nascimento, L.; Meyer, J.Y.; Montes, E.; et al. Scientists’ warning—The outstanding biodiversity of islands is in peril. Glob. Ecol. Conserv. 2021, 31, e01847. [Google Scholar] [CrossRef]
  13. Simberloff, D. Why do introduced species appear to devastate islands more than mainland areas? Pac. Sci. 1995, 49, 87–97. [Google Scholar]
  14. Otto, R.; Fernández-Lugo, S.; Blandino, C.; Manganelli, G.; Chiarucci, A.; Fernández-Palacios, J.M. Biotic homogenization of oceanic islands depends on taxon, spatial scale and the quantification approach. Ecography 2020, 43, 747–758. [Google Scholar] [CrossRef]
  15. Strandberg, N.A.; Steinbauer, M.J.; Walentowitz, A.; Gosling, W.D.; Fall, P.L.; Prebble, M.; Stevenson, J.; Wilmshurst, J.M.; Sear, D.A.; Langdon, P.G.; et al. Floristic homogenization of South Pacific islands commenced with human arrival. Nat. Ecol. Evol. 2024, 8, 511–518. [Google Scholar] [CrossRef] [PubMed]
  16. Cubas, J.; Martín-Esquivel, J.L.; Nogales, M.; Irl, S.D.H.; Hernandez-Hernandez, R.; Lopez-Darias, M.; Marrero-Gomez, M.V.; Del Arco, M.J.; Gonzalez-Mancebo, J.M. Contrasting effects of invasive rabbits on endemic plants driving vegetation change in a subtropical alpine insular environment. Biol. Invasions 2018, 20, 793–807. [Google Scholar] [CrossRef]
  17. Essl, F.; Dawson, W.; Kreft, H.; Pergl, J.; Pysek, P.; van Kleunen, M.; Weigelt, P.; Mang, T.; Dullinger, S.; Lenzner, B.; et al. Drivers of the relative richness of naturalized and invasive plant species on Earth. AoB Plants 2019, 11, plz051. [Google Scholar] [CrossRef]
  18. Loh, R.K.; Daehler, C.C. Influence of woody invader control methods and seed availability on native and invasive species establishment in a Hawaiian forest. Biol. Invasions 2008, 10, 805–819. [Google Scholar] [CrossRef]
  19. Guerrero-Campos, M.; Mendes, S.B.; Marrero, P.; Romero, J.; Nieves, C.; Hervías-Parejo, S.; González-Mancebo, J.M.; Nogales, M. Introduced rabbits as seed-dispersing frugivores: A study case on a environmentally diverse oceanic island (Tenerife, Canaries). Biol. Invasions 2023, 25, 2117–2129. [Google Scholar] [CrossRef]
  20. Asner, G.P.; Martin, R.E.; Knapp, D.E.; Kenedy-Bowdoin, T. Effects of Morella faya tree invasion on aboveground carbon storage in Hawaii. Biol. Invasions 2010, 12, 477–494. [Google Scholar] [CrossRef]
  21. Berio-Fortini, L.; Leopold, C.R.; Perkins, K.S.; Chadwick, O.A.; Yelenik, S.; Jacobi, J.D.; Bishaw, K.; Gregg, M. Landscape level effects of invasive plants and animals on water infiltration through Hawaiian tropical forests. Biol. Invasions 2021, 23, 2155–2172. [Google Scholar] [CrossRef]
  22. Berio-Fortini, L.; Chen, Q.; Uyehara, Y.; Bogner, K.; Sprague, J.; Sprague, R. Fine-resolution land cover mapping over large and mountainous areas for Lāna‘i, Hawaii using posterior probabilities, and expert knowledge. Int. J. Remote Sens. 2024, 45, 1949–1971. [Google Scholar] [CrossRef]
  23. Devkota, R.S.; Field, R.; Hoffmann, S.; Walentowitz, A.; Medina, F.M.; Vetaas, O.R.; Chiarucci, A.; Weiser, F.; Jentsch, A.; Beierkuhnlein, C. Assessing the Potential Replacement of Laurel Forest by a Novel Ecosystem in the Steep Terrain of an Oceanic Island. Remote Sens. 2020, 12, 4013. [Google Scholar] [CrossRef]
  24. González-Montelongo, C.; Pérez-Vargas, I. Is an invasive alien tree able to sustain a similar lichen diversity as the native forest? The case of the sweet chestnut (Castanea sativa Mill.) and the laurel forest in Macaronesia. For. Ecol. Manag. 2021, 448, 19009. [Google Scholar] [CrossRef]
  25. Koerner, L.M.; Chadwick, M.A.; Tebbs, E.J. Mapping invasive strawberry guava (Psidium cattleianum) in tropical forests of Mauritius with Sentinel-2 and machine learning. Int. J. Remote Sens. 2022, 43, 841–872. [Google Scholar] [CrossRef]
  26. Rocchini, D.; Andreo, V.; Förster, M.; Garzón-López, C.X.; Gutiérrez, A.P.; Gillespie, T.W.; Hauffe, H.C.; He, K.S.; Kleinschmit, B.; Mairota, P.; et al. Potential of remote sensing to predict species invasions: A modelling perspective. Prog. Phys. Geogr. 2015, 39, 283–309. [Google Scholar] [CrossRef]
  27. Da Re, D.; Tordoni, E.; Negrín-Pérez, Z.; Fernández-Palacios, J.M.; Arévalo, J.R.; Otto, R.; Rocchini, D.; Bacaro, G. A spatially explicit model of alien plant richness in Tenerife (Canary Islands). Ecol. Complex. 2018, 38, 75–82. [Google Scholar] [CrossRef]
  28. Feounillas, P.; Ah-Peng, C.; Amy, E.; Bracco, I.; Dafreville, S.; Gosset, M.; Ingrassia, F.; Lavergne, C.; Lequette, B.; Notter, J.C.; et al. Quantifying invasion degree by alien plants in Reunion Island. Aust. Ecol. 2021, 46, 1125–1137. [Google Scholar] [CrossRef]
  29. Santamarina, S.; Alfaro-Saiz, E.; Llamas, F.; Acedo, C. Different approaches to assess the local invasion risk on a threatened species: Opportunities of using high-resolution species distribution models by selecting the optimal model complexity. Glob. Ecol. Conserv. 2019, 20, e00767. [Google Scholar] [CrossRef]
  30. Herrera, C.; Jurado-Rivera, J.A.; Leza, M. Ensemble of small models as a tool for alien invasive species management planning: Evaluation of Vespa velutina (Hymenoptera: Vespidae) under Mediterranean island conditions. J. Pest Sci. 2022, 96, 359–371. [Google Scholar] [CrossRef]
  31. Peterson, A.T.; Soberón, J.; Pearson, R.G.; Anderson, R.P.; Martínez-Meyer, E.; Nakamura, M.; Araújo, M.B. Ecological Niches and geographic distributions. In Monographs in Population Biology; Princeton University Press: Princeton, NJ, USA, 2011; MPB-49. [Google Scholar]
  32. Bellard, C.; Jeschke, J.M.; Leroy, B.; Mace, G.M. Insights from modeling studies on how climate change affects invasive alien species geography. Ecol. Evol. 2018, 8, 5688–5700. [Google Scholar] [CrossRef]
  33. Bellard, C.; Thuiller, W.; Leroy, B.; Genovesi, P.; Bakkenes, M.; Courchamp, F. Will climate change promote future invasions? Glob. Chang. Biol. 2013, 19, 3740–3748. [Google Scholar] [CrossRef]
  34. Benavides-Ríos, E.; Sadler, J.; Graham, L.; Matthews, T.J. Species distribution models and island biogeography. Glob. Ecol. Conserv. 2024, 51, e02943. [Google Scholar] [CrossRef]
  35. Bellard, C.; Leclerc, C.; Leroy, B.; Bakkenes, M.; Veloz, S.; Thuiller, W.; Courchamp, F. Vulnerability of biodiversity hotspots to global change. Glob. Ecol. Biogeogr. 2014, 23, 1376–1386. [Google Scholar] [CrossRef]
  36. Bello-Rodríguez, V.; Mateo, R.G.; Pellisier, L.; Cubas, J.; Cook, B.; González-Mancebo, J.M. Forecast increase in invasive rabbit spread into ecosystems of oceanic island (Tenerife) under climate change. Ecol. Appl. 2020, 31, e02206. [Google Scholar] [CrossRef] [PubMed]
  37. Baquero, R.A.; Barbosa, A.M.; Ayllón, D.; Guerra, C.; Sánchez, E.; Araujo, M.B.; Nicola, G.C. Potential distributions of invasive vertebrates in the Iberian Peninsula under projected changes in climate extreme events. Divers. Distrib. 2021, 27, 2262–2276. [Google Scholar] [CrossRef]
  38. Dutra, L.; Brito de Azevedo, E.; Vieira-Reis, F.; Bento, R.; Silva, L. Limitations of species distribution models based on available climate change data: A case of study in the Azorean Forest. Forests 2019, 10, 575. [Google Scholar] [CrossRef]
  39. Udo, N.; Darrot, C.; Atlan, A. From useful to invasive, the status of gorse in Reunion Island. J. Environ. Manag. 2019, 229, 166–173. [Google Scholar] [CrossRef]
  40. Poulin, J.; Weller, S.G.; Sakai, A.K. Genetic diversity does not affect the invasiveness of fountain grass (Pennisetum setaseum) in Arizona, California and Hawaii. Divers. Distrib. 2005, 11, 241–247. [Google Scholar] [CrossRef]
  41. Cordell, S.; Sandquist, D.R. The impact of an invasive African bunchgrass (Pennisetum setaceum) on water availability and productivity of canopy trees within a tropical dry forest in Hawaii. Funct. Ecol. 2008, 22, 1008–1017. [Google Scholar] [CrossRef]
  42. Massetii, A.; Menezes de Sequeira, M.; Pupo-Correia, A.; Figueiredo, A.; Guiomar, N.; Gil, A. Assessing the effectiveness of RapidEye multispectral imagery for vegetation mapping in Madeira Island (Portugal). Ital. J. Remote Sens. 2016, 49, 643–672. [Google Scholar] [CrossRef]
  43. Da Re, D.; Tordoni, E.; De Pascalis, F.; Negrín-Pérez, Z.; Fernández-Palacios, J.M.; Arévalo, J.R.; Rocchini, D.; Medina, F.M.; Otto, R.; Arlé, E.; et al. Invasive fountain grass (Pennisetum setaceum (Forssk.) Chiov.) increases its potential area of distribution in Tenerife Island under future climatic scenarios. Plant Ecol. 2020, 221, 867–882. [Google Scholar] [CrossRef]
  44. Da Re, D.; Tordoni, E.; Naranjo-Cigala, A.; Padrón-Mederos, M.A.; González, M.; González-Montelongo, C.; Arévalo, J.R. Assessing the impacts of land use and climate change on the distribution of Ulex europaeus L. (Fabaceae) in the Canary Islands. Biol. Invasions 2024, 26, 4363–4379. [Google Scholar] [CrossRef]
  45. Redexos. 2024. Available online: https://www3.gobiernodecanarias.org/cptss/sostenibilidad/biodiversidad/redexos/app/guide/species/pluchea-ovalis (accessed on 5 November 2024).
  46. Verloove, F. New xenophytes from Gran Canaria (Canary Islands, Spain), with emphasis on naturalized and (potentially) invasive species. Collect. Bot. 2013, 32, 59–82. [Google Scholar] [CrossRef]
  47. Available online: https://www.worldfloraonline.org/taxon/wfo-0000136883 (accessed on 24 February 2025).
  48. Plants of the World Online. 2024. Available online: https://powo.science.kew.org/taxon/urn:lsid:ipni.org:names:238870-1#distributions (accessed on 31 October 2024).
  49. Available online: https://identify.plantnet.org/es/k-world-flora/species/Pluchea%20ovalis%20(Pers.)%20DC./data (accessed on 24 February 2025).
  50. Verloove, F.; Reyes-Betancort, J.A. Additions to the flora of Tenerife (Canary Islands, Spain). Collect. Bot. 2011, 30, 63–78. [Google Scholar] [CrossRef]
  51. Clements, D.R.; Ditommaso, A. Climate change and weed adaptation: Can evolution of invasive plants lead to greater range expansion than forecasted? Weed Res. 2011, 51, 227–240. [Google Scholar] [CrossRef]
  52. Fernández-Palacios, J.M.; Otto, R.; Capelo, J.; Caujapé-Castells, J.; de Nascimento, L.; Duarte, M.C.; Elias, R.B.; García-Verdugo, C.; Menezes de Sequeira, M.; Médail, F.; et al. In defence of the entity of Macaronesia as a biogeographical region. Biol. Rev. 2024, 99, 2060–2081. [Google Scholar] [CrossRef]
  53. Troll, V.R.; Carracedo, J.C. The Geology of the Canary Islands; Elsevier: Amsterdam, The Netherlands, 2016. [Google Scholar] [CrossRef]
  54. Del Arco, M.J.; Rodríguez-Delgado, O. The Vegetation of the Canary Islands; Springer: Berlin/Heidelberg, Germany, 2018. [Google Scholar]
  55. Gobierno de Canarias. Banco de Datos de Biodiversidad de Canarias. 2024. Available online: https://www.biodiversidadcanarias.es/biota/ (accessed on 23 September 2024).
  56. Acevedo, P.; Real, R. Favourability: Concept, distinctive characteristics and potential usefulness. Naturwissenschaften 2012, 99, 515–522. [Google Scholar] [CrossRef]
  57. Da Re, D.; Tordoni, E.; Lenoir, J.; Lembrechts, J.J.; Vanwambeke, S.O.; Rocchini, D.; Bazzichetto, M. USE it: Uniformly sampling pseudo-absences within the environmental space for applications in habitat suitability models. Methods Ecol. Evol. 2023, 14, 2873–2887. [Google Scholar] [CrossRef]
  58. Patiño, J.; Collart, F.; Vanderpoorten, A.; Martin-Esquivel, J.L.; Naranjo-Cigala, A.; Mirolo, S.; Karger, D.N. Spatial resolution impacts projected plant responses to climate change on topographically complex islands. Divers. Distrib. 2023, 29, 1245–1262. [Google Scholar] [CrossRef]
  59. Karger, D.N.; Conrad, O.; Böhner, J.; Kawohl, T.; Kreft, H.; Soria-Auza, R.W.; Zimmermann, N.E.; Linder, H.P.; Kessler, M. Climatologies at high resolution for the earth’s land surface areas. Sci. Data 2017, 4, 170122. [Google Scholar] [CrossRef]
  60. CORINE Land Cover (Vector/Raster 100 m), Europe, 6-Yearly. 2018. Available online: https://sdi.eea.europa.eu/catalogue/copernicus/api/records/71c95a07-e296-44fc-b22b-415f42acfdf0?language=all (accessed on 26 October 2024).
  61. Hanz, D.; Cutts, V.; Barajas-Barbosa, M.P.; Algar, A.; Beierkuhnlein, C.; Collart, F.; Fernández-Palacios, J.M.; Field, R.; Karger, D.N.; Kienle, D.R.; et al. Effects of climate change on the distribution of plant species and plant functional strategies on the Canary Islands. Divers. Distrib. 2023, 29, 1157–1171. [Google Scholar] [CrossRef]
  62. Brun, P.; Thuiller, W.; Chauvier, Y.; Pellissier, L.; Wüest, R.O.; Wang, Z.; Zimmermann, N.E. Model Complexity Affects Species Distribution Projections under Climate Change. J. Biogeogr. 2020, 47, 130–142. [Google Scholar] [CrossRef]
  63. Zarzo-Arias, A.; Penteriani, V.; Gabor, L.; Simova, P.; Grattarola, F.; Moudry, V. Importance of data selection and filtering in species distribution models: A case study on the Cantabrian brown bear. Ecosphere 2022, 13, e4284. [Google Scholar] [CrossRef]
  64. Zuur, A.F.; Ieno, E.N.; Elphick, C.S. A protocol for data exploration to avoid common statistical problems. Methods Ecol. Evol. 2010, 1, 3–14. [Google Scholar] [CrossRef]
  65. Barbosa, A.M. fuzzySim: Applying fuzzy logic to binary similarity indices in ecology. Methods Ecol. Evol. 2015, 6, 853–858. [Google Scholar] [CrossRef]
  66. Wood, S.N. Fast stable restricted maximum likelihood and marginal likelihood estimation of semiparametric generalized linear models. J. R. Stat. Soc. B 2011, 73, 3–36. [Google Scholar] [CrossRef]
  67. Liaw, A.; Wiener, M. Classification and Regression by RandomForest. 2002. Available online: https://CRAN.R-project.org/doc/Rnews/ (accessed on 1 November 2024).
  68. Carlson, C. embarcadero: Species Distribution Models with BART. R Package Version 1.2.0.1003, Commit 0c680394089ea93da1d2028caddb757a4ffd30c4. 2024. Available online: https://github.com/cjcarlson/embarcadero (accessed on 1 November 2024).
  69. Barbosa, A.M.; Real, R.; Munoz, A.R.; Brown, J.A. New measures for assessing model equilibrium and prediction mismatch in species distribution models. Divers. Distrib. 2013, 19, 1333–1338. [Google Scholar] [CrossRef]
  70. Burnham, K.P.; Anderson, D.R. Model Selection and Multimodel Inference. A Practical Information-Theoretic Approach; Springer: New York, NY, USA, 2002. [Google Scholar]
  71. Kursa, M.B.; Rudnicki, W.R. Feature Selection with the Boruta Package. J. Stat. Softw. 2010, 36, 1–13. [Google Scholar] [CrossRef]
  72. Sillero, N.; Barbosa, A.M. Common mistakes in ecological niche models. Int. J. Geogr. Inf. Sci. 2021, 35, 213–226. [Google Scholar] [CrossRef]
  73. Fielding, A.H.; Bell, J.F. A review of methods for the assessment of prediction errors in conservation presence/absence models. Environ. Conserv. 1997, 24, 38–49. [Google Scholar] [CrossRef]
  74. Allouche, O.; Tsoar, A.; Kadmon, R. Assessing the accuracy of species distribution models: Prevalence, kappa and the true skill statistic (TSS). J. Appl. Ecol. 2006, 43, 1223–1232. [Google Scholar] [CrossRef]
  75. Hirzel, A.H.; Le Lay, G.; Helfer, V.; Randin, C.; Guisan, A. Evaluating the ability of habitatsuitability models to predict species presences. Ecol. Model. 2006, 199, 142–152. [Google Scholar] [CrossRef]
  76. Newson, R. Confidence intervals for rank statistics: Somers’ D and extensions. Stata J. 2006, 6, 309–334. [Google Scholar] [CrossRef]
  77. Miller, M.E.; Hui, S.L.; Tierney, W.M. Validation techniques for logistic regression models. Stat. Med. 1991, 10, 1213–1226. [Google Scholar] [CrossRef] [PubMed]
  78. Pearce, J.; Ferrier, S. Evaluating the predictive performance of habitat models developed using logistic regression. Ecol. Model. 2000, 133, 225–245. [Google Scholar] [CrossRef]
  79. Elith, J.; Kearney, M.; Phillips, S. The art of modelling range-shifting species. Methods Ecol. Evol. 2010, 1, 330–342. [Google Scholar] [CrossRef]
  80. Guisan, A.; Thuiller, W.; Zimmermann, N.E. Habitat Suitability and Distribution Models with Applications in R; Cambridge University Press: Cambridge, UK, 2017. [Google Scholar]
  81. Hijmans, R.J.; Phillips, S.; Leathwick, J.; Elith, J. dismo: Species Distribution Modeling. R Package Version 1.3-14. 2023. Available online: https://CRAN.R-project.org/package=dismo (accessed on 2 November 2024).
  82. Hernangómez, D. Using the tidyverse with terra objects: The tidyterra package. J. Open-Source Softw. 2023, 8, 5751. [Google Scholar] [CrossRef]
  83. Wickham, H. ggplot2: Elegant Graphics for Data Analysis; Springer: New York, NY, USA, 2016. [Google Scholar]
  84. R Development Core Team. R: A Language and Environment for Statistical Computing; R Foundation for Statistical Computing: Vienna, Austria, 2024. [Google Scholar]
  85. QGIS Development Team. QGIS Geographic Information System. Open-Source Geospatial Foundation Project. 2024. Available online: http://qgis.osgeo.org (accessed on 26 October 2024).
  86. Lonsdale, W.M. Global patterns of plant invasions and the concept of invasibility. Ecology 1999, 80, 1522–1536. [Google Scholar] [CrossRef]
  87. Richardson, D.M.; Holmes, P.M.; Esler, K.J.; Galatowitsch, S.M.; Stromberg, J.C.; Kirkman, S.P.; Pysek, P.; Hobbs, R.J. Riparian vegetation: Degradation, alien plant invasions, and restoration prospects. Divers. Distrib. 2007, 13, 126–139. [Google Scholar] [CrossRef]
  88. Chytry, M.; Jarosik, V.; Pysek, P.; Hajek, O.; Knollova, I.; Tichy, L.; Danihelka, J. Separating habitat invasibility by alien plants from the actual level of invasion. Ecology 2008, 89, 1541–1553. [Google Scholar] [CrossRef]
  89. Otto, R.; Arteaga, M.A.; Delgado, J.D.; Arévalo, J.R.; Blandino, C.; Fernández-Palacios, J.M. Road Edge effect and elevation pattern of native and alien species on an oceanic island (Tenerife, Canary Islands). Folia Geobot. 2014, 49, 65–82. [Google Scholar] [CrossRef]
  90. González-Montelongo, C.; Naranjo-Cigala, A.; Arévalo, J.R. Introduced species as a disturbance symptom. Rev. Cienc. Agrar. 2024, 47, 430–434. [Google Scholar]
  91. Del Arco, M.J.; González-González, R.; Garzón-Machado, V.; Pizarro-Hernández, B. Actual and potential natural vegetation on the Canary Islands and its conservation status. Biodivers. Conserv. 2010, 19, 3089–3140. [Google Scholar] [CrossRef]
  92. Fernández-Palacios, J.M.; Schrader, J.; de Nascimento, L.; Irl, S.D.H.; Sánchez-Pinto, L.; Otto, R. Are plant communities on the Canary Islands resistant to plant invasion? Divers. Distrib. 2022, 29, 51–60. [Google Scholar] [CrossRef]
  93. Fenouillas, P.; Caubit, M.; Cazal, M.; Soleyen, C.A.; Strasberg, D.; Rouget, M. Standardising field-based assessment of invasion degree: A case study in two habitats of Reunion Island. Ecol. Solut. Evid. 2024, 5, e12314. [Google Scholar] [CrossRef]
  94. Piquet, J.C.; Warren, D.L.; Saavedra-Bolaños, J.F.; Sánchez-Rivero, J.M.; Gallo-Barneto, R.; Cabrera-Pérez, M.A.; Fisher, R.N.; Fisher, S.R.; Rochester, C.J.; Hinds, B.; et al. Could climate change benefit invasive snakes? Modelling the potential distribution of the California Kingsnake in the Canary Islands. J. Environ. Manag. 2021, 294, 112917. [Google Scholar] [CrossRef]
  95. Soley-Guardia, M.; Alvarado-Serrano, D.F.; Anderson, R.P. Top ten hazards to avoid when modeling species distributions: A didactic guide of assumptions, problems, and recommendations. Ecography 2024, 2024, e06852. [Google Scholar] [CrossRef]
  96. Barbet-Massin, M.; Rome, Q.; Villemant, C.; Courchamp, F. Can species distribution models really predict the expansion of invasive species? PLoS ONE 2018, 13, e0193085. [Google Scholar] [CrossRef]
  97. Diogo, I.; Sillero, N.; Capinha, C. Predicting the risk of invasion by broadleaf watermilfoil (Myriophyllum heterophyllum) in mainland Portugal. Hellyon 2024, 10, e34201. [Google Scholar] [CrossRef]
  98. Arévalo, J.R.; Delgado, J.D.; Otto, R.; Naranjo-Cigala, A.; Salas-Pascual, M.; Fernández-Palacios, J.M. Distribution of alien vs native plant species in roadside communities along an altitudinal gradient in Tenerife and Gran Canaria (Canary Islands). Perspect. Plant Ecol. Evol. Syst. 2005, 7, 185–202. [Google Scholar] [CrossRef]
  99. Arévalo, J.R.; Otto, R.; Escudero, C.; Fernández-Lugo, S.; Arteaga, M.; Delgado, J.D.; Fernández-Palacios, J.M. Do anthropogenic corridors homogenize plant communities at a local scale? A case studied in Tenerife (Canary Islands). Plant Ecol. 2010, 209, 23–35. [Google Scholar] [CrossRef]
  100. Arévalo, J.R.; Afonso, L.; Naranjo-Cigala, A.; Salas-Pascual, M. Invasion of the Gran Canaria ravines ecosystems (Canary Islands) by the exotic species Acacia farnesiana. J. Plant Ecol. 2010, 206, 185–193. [Google Scholar] [CrossRef]
  101. Manzoor, S.A.; Griffiths, G.; Lukac, M. Land use and climate change interaction triggers contrasting trajectories of biological invasion. Ecol. Indic. 2021, 120, 106936. [Google Scholar] [CrossRef]
  102. Irl, S.D.H.; Schweiger, A.H.; Steinbauer, M.J.; Ah-Peng, C.; Arévalo, J.R.; Beierkuhnlein, C.; Chiarucci, A.; Daehler, C.C.; Fernández-Palacios, J.M.; Flores, O.; et al. Human impact, climate and dispersal strategies determine plant invasion on islands. J. Biogeogr. 2021, 48, 1889–1903. [Google Scholar] [CrossRef]
  103. Richardson, D.M.; Thuiller, W. Home away from home—Objective mapping of high-risk source areas for plant introductions. Divers. Distrib. 2007, 13, 299–312. [Google Scholar] [CrossRef]
  104. Cardador, L.; Tella, J.L.; Louvrier, J.; Anadón, J.D.; Abellán, P.; Carrete, M. Climate matching and anthropogenic factors contribute to the colonization and extinction of local populations during avian invasions. Divers. Distrib. 2022, 28, 1908–1921. [Google Scholar] [CrossRef]
  105. King-Jones, S. Revision of Pluchea Cass. (Compositae, Plucheeae) in the Old World; Englera. 1; Freie Universität Berlin Botanic Garden and Botanical Museum; Dahlem: Berlin, Germany, 2001. [Google Scholar]
  106. Morente-López, J.; Arjona, Y.; Salas-Pascual, M.; Reyes-Betancort, J.A.; del Arco, M.J.; Emerson, B.C.; García-Gallo, A.; Jay-García, L.S.; Naranjo-Cigala, A.; Patiño, J. Biogeographic origins and drivers of alien plant invasions in the Canary Islands. J. Biogeogr. 2023, 50, 576–590. [Google Scholar] [CrossRef]
  107. Broennimann, O.; Treier, U.A.; Muller-Schaller, H.; Thuiller, W.; Peterson, A.T.; Guisan, A. Evidence of climate niche shift during biological invasions. Ecol. Lett. 2007, 10, 701–709. [Google Scholar] [CrossRef]
  108. Broennimann, O.; Guisan, A. Predicting current and future biological invasions: Both native and invaded ranges matter. Biol. Lett. 2008, 4, 585–589. [Google Scholar] [CrossRef]
  109. Sillero, N.; Ribeiro-Silva, J.; Arenas-Castro, S. Shifts in climatic realised niches of Iberian species. Oikos 2022, 2022, e08505. [Google Scholar] [CrossRef]
  110. Briscoe-Runquist, R.D.; Lake, T.; Tiffin, P.; Moeller, D.A. Species distribution models throughout the invasion history of Palmer amaranth predict regions at risk of future invasion and reveal challenges with modeling rapidly shifting geographic ranges. Sci. Rep. 2019, 9, 2426. [Google Scholar] [CrossRef]
  111. Fornoso-Freire, V.; Barbosa, A.M.; Baselga, A.; Gómez-Rodríguez, C. Predicting the spatio-temporal pattern of range expansion under lack of equilibrium with climate. Biol. Conserv. 2023, 288, 110361. [Google Scholar] [CrossRef]
  112. Berio-Fortini, L.; Kaiser, L.R.; Daehler, C.C.; Jacobi, J.D.; Dimson, M.; Gillespie, T.W. Exploring and integrating differences in niche characteristics across regional and global scales to better understand plant invasions in Hawaiʻi. Biol. Invasions 2024, 26, 1827–1843. [Google Scholar] [CrossRef]
  113. Mateo, R.G.; Morales-Barbero, J.; Zarzo-Arias, A.; Lima, H.; Gómez-Rubio, V.; Goicolea, T. sabinaNSDM: An R package for spatially nested hierarchical species distribution modelling. Methods Ecol. Evol. 2024, 5, 1796–1803. [Google Scholar] [CrossRef]
  114. Engelstad, P.; Jarnevich, C.S.; Hogan, T.; Sofaer, H.R.; Pearse, I.S.; Sieracki, J.L.; Frakes, N.; Sullivan, J.; Young, N.E.; Prevey, J.S.; et al. INHABIT: A web-based decision support tool for invasive plant species habitat visualization and assessment across the contiguous United States. PLoS ONE 2022, 17, e0263056. [Google Scholar] [CrossRef]
  115. Dimson, M.; Fortini, L.B.; Tingley, M.W.; Gillespie, T.W. Citizen science can complement professional invasive plant surveys and improve estimates of suitable habitat. Divers. Distrib. 2023, 29, 1141–1156. [Google Scholar] [CrossRef]
  116. Santana, J.; Sillero, N.; Ribeiro, J.; Capinha, C.; Lopes, R.J.; Reino, L. Predicting the expansion of invasive species: How much data do we need? NeoBiota 2024, 95, 109–132. [Google Scholar] [CrossRef]
  117. Jarnevich, C.S.; Young, N.E.; Talbert, M.; Talbert, C. Forecasting an invasive species’ distribution with global distribution data, local data, and physiological information. Ecosphere 2018, 9, e02279. [Google Scholar] [CrossRef]
Figure 1. Study area. Red points indicate locations used to fit the models, while turquoise points represent occurrence records used exclusively for extrapolation.
Diversity 17 00195 g001
Figure 2. Presence and pseudo-absence in the multidimensional environmental space of Tenerife (regarding the two main axes of the Principal Component Analysis, PC1 explains 36.3% of the variance, and PC2 explains 28%). Contours indicate different levels of presence in kernel density. Marginal density plots reflect presence and pseudo-absence distribution frequencies in PC1 and PC2, respectively.
Diversity 17 00195 g002
Figure 3. Differences in accuracy (AUC, Boyce, Sommer’s D, and sTSS) and calibration (Miller’s slope) between the different models used in this study over test fractions (30%) after 100 cross-validations.
Diversity 17 00195 g003
Figure 4. Ensembled model of predicted potential distribution for P. ovalis in the current scenario (1979–2013).
Diversity 17 00195 g004
Figure 5. Average suitability scores by vegetation category. We included the median (as a non-parametric centrality measure) and the bars indicate significant differences between groups by post hoc Dunn’s test analysis.
Diversity 17 00195 g005
Figure 6. Ensembled models of projected potential distributions for Pluchea ovalis in the period 2071–2100. (A) Scenario ssp126, (B) ssp370, and (C) ssp585.
Diversity 17 00195 g006
Figure 7. Change in favorability between the periods 1979–2013 and 2071–2100. Blue tones represent loss, and red tones represent gain in favorability.
Diversity 17 00195 g007
Figure 8. MESS binary maps for each island except Tenerife. (A) Extrapolability in near-present scenario (1979–2013), (B) extrapolability in SSP126 (2071–2100), (C) extrapolability in SSP 370 (2071–2100), (D) extrapolability in SSP 585 (2071–2100).
Diversity 17 00195 g008aDiversity 17 00195 g008b
Disclaimer/Publisher’s Note: The statements, opinions and data contained in all publications are solely those of the individual author(s) and contributor(s) and not of MDPI and/or the editor(s). MDPI and/or the editor(s) disclaim responsibility for any injury to people or property resulting from any ideas, methods, instructions or products referred to in the content.

