Article

Two Complete Mitochondrial Genomes of Potamanthidae (Ephemeroptera): Genome Features and Phylogenetic Implications

1
School of Life Sciences, Qufu Normal University, Qufu 273165, China
2
School of Life Sciences, Nanjing Normal University, Nanjing 210023, China
*
Author to whom correspondence should be addressed.
Diversity 2025, 17(3), 164; https://doi.org/10.3390/d17030164
Submission received: 19 December 2024 / Revised: 16 February 2025 / Accepted: 25 February 2025 / Published: 26 February 2025
(This article belongs to the Special Issue Freshwater Zoobenthos Biodiversity, Evolution and Ecology)

Abstract

:
The family Potamanthidae is widely distributed across the Holarctic and Oriental regions, with nymphs often utilized as bioindicators for water pollution and human-induced environmental disturbances. However, limited mitochondrial genomes (mitogenomes) have been reported for this family. This study presents the first complete mitochondrial genome sequences of two Potamanthidae species, Potamanthus longitibius and Rhoenanthus youi. The mitogenome sizes were 15,430 bp and 15,232 bp, with A + T contents of 68.79% and 66.75%, respectively. The most abundant amino acids were phenylalanine (Phe), isoleucine (Ile), glycine (Gly), and alanine (Ala), with leucine (Leu2) showing the highest relative synonymous codon usage (RSCU) value. The analysis of tRNA secondary structures revealed high conservation among the tRNAs encoded on the H-strand. Phylogenetic reconstruction, incorporating 40 species from 13 families of Ephemeroptera, confirmed the monophyly of all the families and supported a sister group relationship between Potamanthidae and Ephemeridae. Additionally, the sequence previously identified as Rhoenanthus sp. JZ-2021 was reassigned to the genus Potamanthus. This study provides valuable insights into the evolutionary relationships within Potamanthidae and lays a foundation for future phylogenetic and taxonomic research.

1. Introduction

The typical complete mitochondrial genome (mitogenome) of insects is a circular, double-stranded molecule ranging in size from 14 to 20 kb [1,2,3]. The whole mitogenome generally comprises 37 genes: 13 protein-encoding genes (PCGs), which are part of the oxidative phosphorylation (OXPHOS) pathways; 22 transfer RNA genes (tRNAs), which transport amino acids to the ribosome and synthesize proteins under the guidance of messenger RNAs (mRNAs); and 2 ribosomal RNA genes (rRNAs, rrnS and rrnL), which are essential for translating mRNAs into mitochondrial proteins [4]. In addition, the mitogenome usually contains a single large non-coding region, known as the A + T-rich region or control region (CR), with a variable length that serves as the site of transcription initiation and gene replication [4,5]. Due to their high cellular abundance, absence of introns, maternal inheritance, compact size, and rapid evolution with a higher mutation rate while maintaining relatively conserved genetic organization, mitochondrial sequences are relatively easy to obtain and have become invaluable for applications such as species identification, phylogenetic analysis, population genetics, and molecular evolution studies across diverse taxa [6,7,8,9]. Additionally, gene rearrangements—encompassing both gene content and gene order—have been widely identified in many insect lineages. These rearrangements have proven to provide valuable phylogenetic signals, aiding in the resolution of relationships at different taxonomic levels [10,11].
Mayflies (Ephemeroptera) are the most archaic of extant winged insects, comprising approximately 4000 species, 460 genera, and 42 families [12,13]. Early research for this order primarily focused on traditional morphological classification and biological characteristics [14,15,16]. However, the higher-level classification and phylogenetic relationships within Ephemeroptera remain incompletely understood, largely due to limited molecular data. The development of high-throughput sequencing technologies has facilitated the acquisition of mitogenomic datasets, providing new insights into the phylogenetics and evolutionary studies of mayflies [17,18]. To date, more than 70 mayfly mitogenomes have been made available in GenBank (NCBI database). Phylogenetic studies within Ephemeroptera have utilized mitogenomes not only for sequence-based analyses but also for exploring gene order rearrangements [19,20]. Nevertheless, the currently available mitogenomes are limited in number and unevenly distributed across mayfly families [20]. Therefore, obtaining additional mitogenomic data is essential for improving our understanding of both intra- and inter-family relationships, and to resolve key phylogenetic uncertainties within this order.
The family Potamanthidae is widely distributed across the Holarctic and Oriental regions, with most species occurring in eastern and southeastern Asia [21]. To date, 32 species have been described worldwide, classified into four genera: Rhoenanthus Eaton, 1881; Potamanthus Pictet, 1843; Potamanthodes Ulmer, 1920; and Anthopotamus McCafferty and Bae, 1990 [22]. The nymphs of Potamanthidae typically inhabit flowing water environments, such as streams and rivers, where they primarily feed on humus residues. Due to their sensitivity to organic pollutants, these species are often used as bioindicators for water pollution and human-induced environmental disturbances [23]. Over the past few decades, studies on Potamanthidae have predominantly focused on taxonomy [24,25,26]. Although the monophyly of the family has been confirmed, its relationships with other families remain an area of active investigation. Molecular phylogenetic studies within Potamanthidae have largely relied on single mitochondrial genes, owing to the limited availability of molecular data. Currently, there are only three reported mitogenome sequences for Potamanthidae, with just one representing a complete mitogenome (Potamanthus sp. MT-2014, KM244674). As a result, the evolutionary characteristics and differentiation patterns of the mitochondrial genome in Potamanthidae remain poorly understood.
In this study, we sequenced and assembled the mitogenomes of two potamanthid mayflies (Potamanthus longitibius Bae and McCafferty, 1991 and Rhoenanthus youi (Wu and You, 1986)) using next-generation sequencing technology. We performed a comprehensive comparative analysis of these mitogenomes, examining features such as the genomic organization, nucleotide composition, tRNA secondary structure, codon usage, and intergenic spacers. Furthermore, we utilized the two newly sequenced mitogenomes along with existing Potamanthidae data to reconstruct the phylogenetic relationships within Ephemeroptera. This study enhances our understanding of the evolutionary mechanisms shaping mitogenomic diversity in Potamanthidae and offers valuable perspectives for future phylogenetic and evolutionary research.

2. Materials and Methods

2.1. Sample Collection and Species Identification

Specimens of Potamanthus longitibius were collected from Ziqiu town, Yichang, Hubei province, China, while Rhoenanthus youi were collected from the confluence of the Black River and White River in Yanqing, Beijing, China. All collected samples were promptly fixed in anhydrous ethanol and subsequently stored at −20 °C in a low-temperature freezer. No permits were required for the collection of these species. Morphological identification of the two species was carried out by Changfa Zhou, using established taxonomic keys based on external morphological traits and male genital characteristics. Voucher specimens are currently housed at the College of Life Sciences, Nanjing Normal University, Nanjing, China.

2.2. DNA Extraction and Mitogenome Sequencing

Total genomic DNA was extracted from approximately 50 mg of muscle tissue (thorax and leg from each mayfly) using the Tissue and Blood Genome DNA Extraction Kit (Qiagen, Hilden, Germany), following the manufacturer’s instructions. DNA concentration and quality were assessed by two methods: 1% agarose gel electrophoresis and a Nanodrop 2000 spectrophotometer. The extracted DNA was stored at −20 °C for further analysis.
High-quality DNA samples were sent to Personal Biotechnology Co., Ltd. (Nanjing, China) for library preparation and sequencing. For each species, a library with an average insert size of 400 bp was constructed using the Illumina TruSeq® DNA PCR-Free HT Kit. The resulting libraries were then pooled with those from other projects for sequencing. The libraries were then pooled with other projects and sequenced on the Illumina NovaSeq 6000 platform (Illumina, San Diego, CA, USA) using a paired-end strategy (2 × 150 bp).

2.3. Mitogenome Assembly and Bioinformatic Analysis

Each library generated over 4 Gb of raw genomic data, which was quality-checked using FastQC [27]. Adapter sequences were removed using the NGS-Toolkit [28], and low-quality reads, including duplicates and reads with over 10% unknown bases (N), were filtered out using Prinseq [29]. De novo assemblies were performed using NOVOPlasty v4.0 based on the clean sequencing data, following the developer’s k-mer strategy with a k-mer size of 33 [30]. The COX1 gene fragment and the Potamanthus sp. MT-2014 mitogenome were used as the ‘seed’ sequence and the ‘bait’ reference mitogenome, respectively.
Mitogenome annotation was initially performed using MitoZ v2.4, applying the invertebrate mitochondrial genetic code (05) [31]. The preliminary annotation results from MitoZ were subsequently imported into Geneious Prime software (version 2023.1.1, Biomatters, Ltd., Auckland, New Zealand) for further refinement. The start and stop codons of protein-coding genes (PCGs) were manually curated by comparing them with homologous genes from other mayfly mitogenomes. Transfer RNAs (tRNAs) were identified using tRNAScan-SE v2.0 and ARWEN v1.2, with manual adjustments made where necessary [32,33]. Secondary structures of tRNAs were manually drawn using Adobe Illustrator CS6 based on predictions from the MITOS2 web server [34]. The boundaries of ribosomal RNAs (rRNAs) were determined by comparing MITOS2 predictions with reference sequences from other mayfly species. The AT-rich regions, intergenic spacers, and overlapping regions were manually identified. Circular maps of the two newly sequenced mitogenomes were generated using the visualization module in MitoZ v2.4 [31]. Additionally, a pairwise comparison of the two mitogenomes was performed to assess interspecific variation using the mVISTA web tool in Shuffle-LAGAN mode [35].
Nucleotide composition, amino acid composition, and relative synonymous codon usage (RSCU) were analyzed in MEGA X [36]. Codon usage statistics were calculated using DnaSP v6.0 [37], and RSCU charts for the two mitogenomes were created using Adobe Illustrator CS6. Composition skews (base compositional differences) were calculated using the following formulas: AT-skew = (A − T)/(A + T) and GC-skew = (G − C)/(G + C) [38]. Additionally, the numbers of synonymous substitutions (Ks), non-synonymous substitutions (Ka), and the Ka/Ks ratios for each PCG were determined using DnaSP v6.0. [37].

2.4. Mitogenome Assembly and Bioinformatic Analysis

Forty mitogenomes of mayflies, including 2 newly sequenced genomes and 38 previously reported genomes from 13 families (Ameletidae, Baetidae, Caenidae, Ephemerellidae, Ephemeridae, Heptageniidae, Isonychiidae, Leptophlebiidae, Neoephemeridae, Potamanthidae, Siphlonuridae, Siphluriscidae, and Viemamellidae), were used for phylogenetic analyses. Additionally, two mitogenomes from Odonata (Ischnura pumilio (Charpentier, 1825) and Ictinogomphus sp.) were used as outgroups. Detailed information on all analyzed mitogenomes is presented in Table S1. In this study, the nucleotide sequences of 13 protein-coding genes (PCGs) and 2 ribosomal RNA genes (rrnS and rrnL) were employed to reconstruct phylogenetic relationships. PhyloSuite v1.2.3 was used to extract these genes, which were then aligned using MAFFT v7.475 [39,40]. The aligned sequences were then trimmed with trimAl v1.4.1 using the heuristic “automated1” method to remove positions containing only gaps or ambiguities [41]. FASconCAT-G v1.04 software was subsequently used to concatenate the trimmed sequences into a data matrix [42].
The optimal partitioning schemes and substitution models for the dataset were identified using PartitionFinder v2.2.1 [43]. The subset partitions and their corresponding models used for phylogenetic tree construction are detailed in Table S2. Phylogenetic trees were reconstructed using both Bayesian Inference (BI) and Maximum Likelihood (ML) approaches. For ML analysis, RAxML v8.2.12 was employed with the best partition schemes, and branch support for each node was estimated with 1000 bootstrap replicates [44]. BI analysis was performed using MrBayes v3.2.7a through the CIPRES Science Gateway, starting from a random tree [45,46]. Each run consisted of four chains set for 10 million generations, with sampling performed every 1000 generations. The first 25% of sampled data were discarded as burn-in, and the consensus tree was computed from the remaining trees. FigTree v1.4.4 was used to visualize and modify the resulting phylogenetic trees [47].

3. Results and Discussion

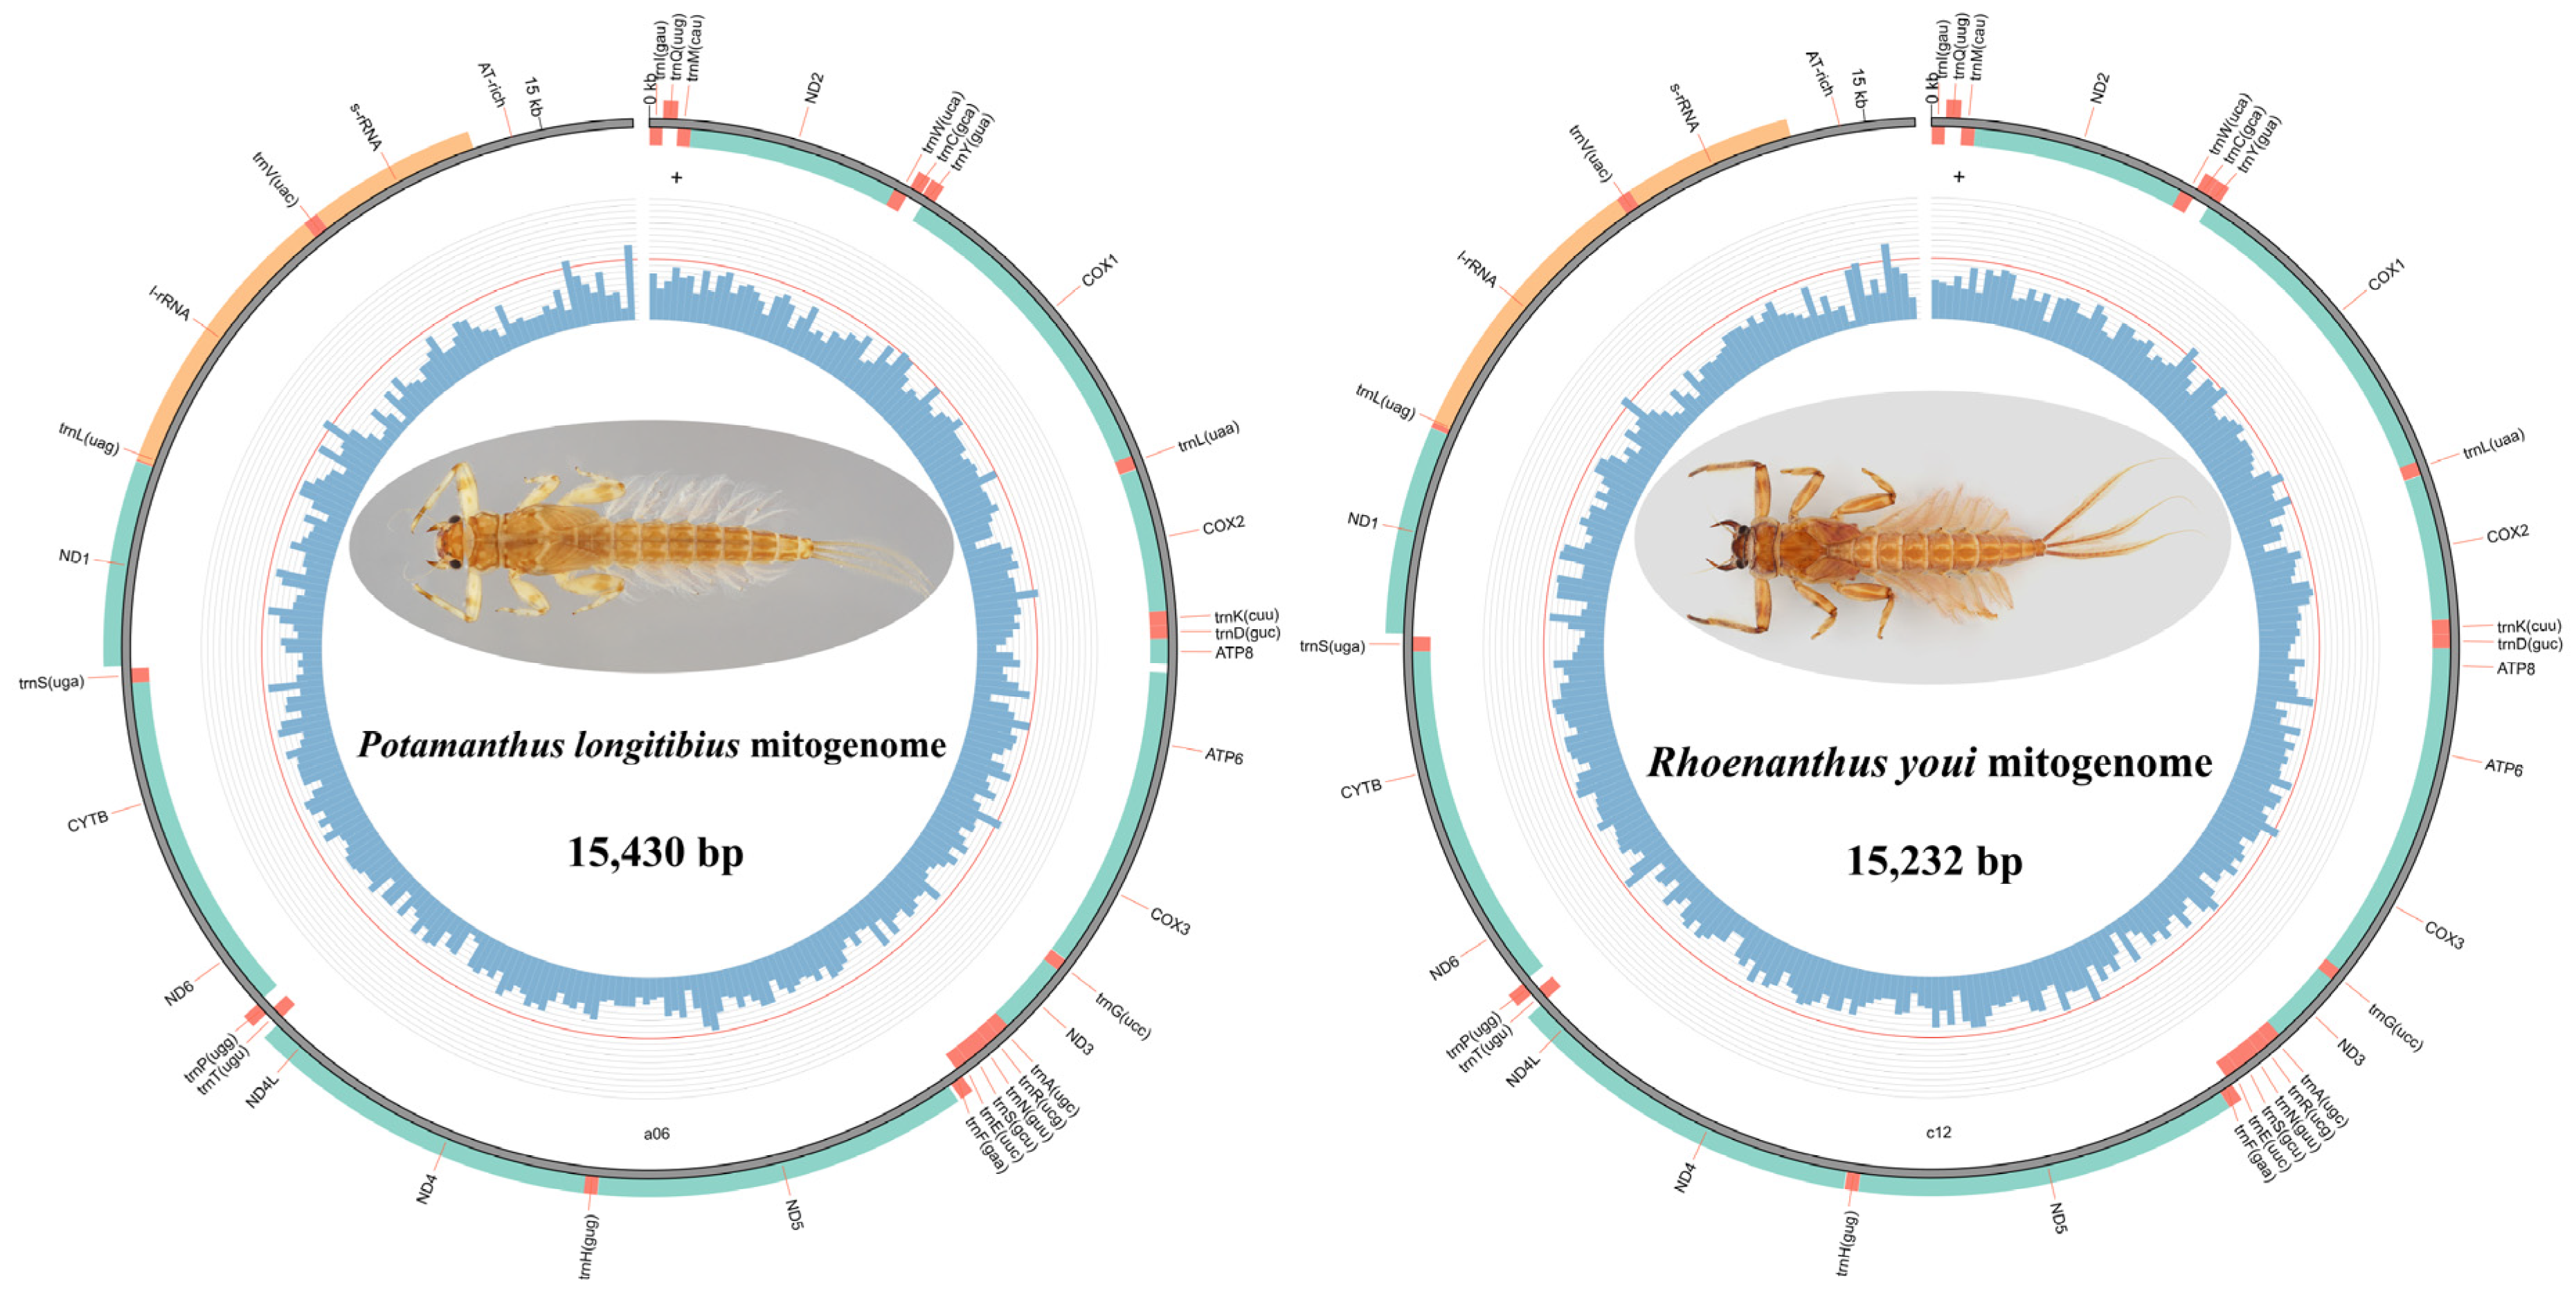
3.1. Genome Organization

In this study, we successfully determined the complete mitogenomes of P. longitibius and R. youi, which were circular, double-stranded molecules with lengths of 15,430 bp and 15,232 bp, respectively (Figure 1). The two mitogenomes have been deposited in the GenBank database under the accession numbers PQ723066 (P. longitibius) and PQ723067 (R. youi). The lengths of these newly sequenced mitogenomes fall well within the range of other complete Ephemeroptera mitogenomes, which vary from 14,589 bp (Alainites yixiani (Gui & Lu, 1999), GU479735) to 16,616 bp (Siphluriscus chinensis Ulmer (1920), HQ875717). Additionally, the gene composition of these mitogenomes was highly similar to that of previously published mitogenomes within the family Potamanthidae. Both Potamanthidae mitogenomes contained 37 typical metazoan genes: 13 protein-coding genes (PCGs: ATP6, ATP8, COX1–3, CYTB, ND1–6, and ND4L), 22 transfer RNAs (tRNAs), 2 ribosomal RNAs (rrnS and rrnL), and a large non-coding region known as the control region (CR) (Table 1). Of these genes, four PCGs, eight tRNAs, and two rRNAs were encoded on the minority strand (L-strand), while the remaining genes were located on the majority strand (H-strand). The gene arrangement, including both orientation and order, was highly conserved and identical to the ancestral insect mitogenome (Drosophila yakuba) [48].

3.2. Nucleotide Composition

The alignment analysis revealed high sequence similarity across the three available complete mitogenomes of Potamanthidae (P. longitibius, R. youi, and Potamanthus sp. MT-2014), with sequence identity values of 81.19% and 85.43%, respectively (Figure S1). The nucleotide composition of the mitogenomes was analyzed using parameters such as the A + T content, AT-skew, and GC-skew. The A + T content of the two Potamanthidae mitogenomes was 68.79% (P. longitibius) and 66.75% (R. youi), indicating a significant bias toward adenine (A) and thymine (T) in their nucleotide composition (Table 2). Furthermore, all gene components (13 PCGs, 2 rRNAs, 22 tRNAs, and CRs) exhibited nucleotide composition bias [(A + T) % > (G + C) %], consistent with previously reported insect mitogenomes [49]. A comparative analysis revealed that the A + T content of the two species was highly similar. Among the different codon positions within the PCGs, the third codon position exhibited the highest A + T content, followed by the second codon position, while the first codon position had the lowest percentage (Table 2). This pattern aligns with observations in other insect mitogenomes. The AT-skews of the whole genomes, CRs, PCGs, and the first, second, and third codon positions were all negative, indicating that the thymine (T) content exceeded the adenine (A) content. Notably, differences were observed within specific components between the two species, for example, the AT-skew of tRNAs was negative in P. longitibius but positive in R. youi. Regarding the GC-skew, most of the components were negative, except for the tRNAs, rRNAs, and the first codon position of the PCGs, which displayed positive values (Table 2).

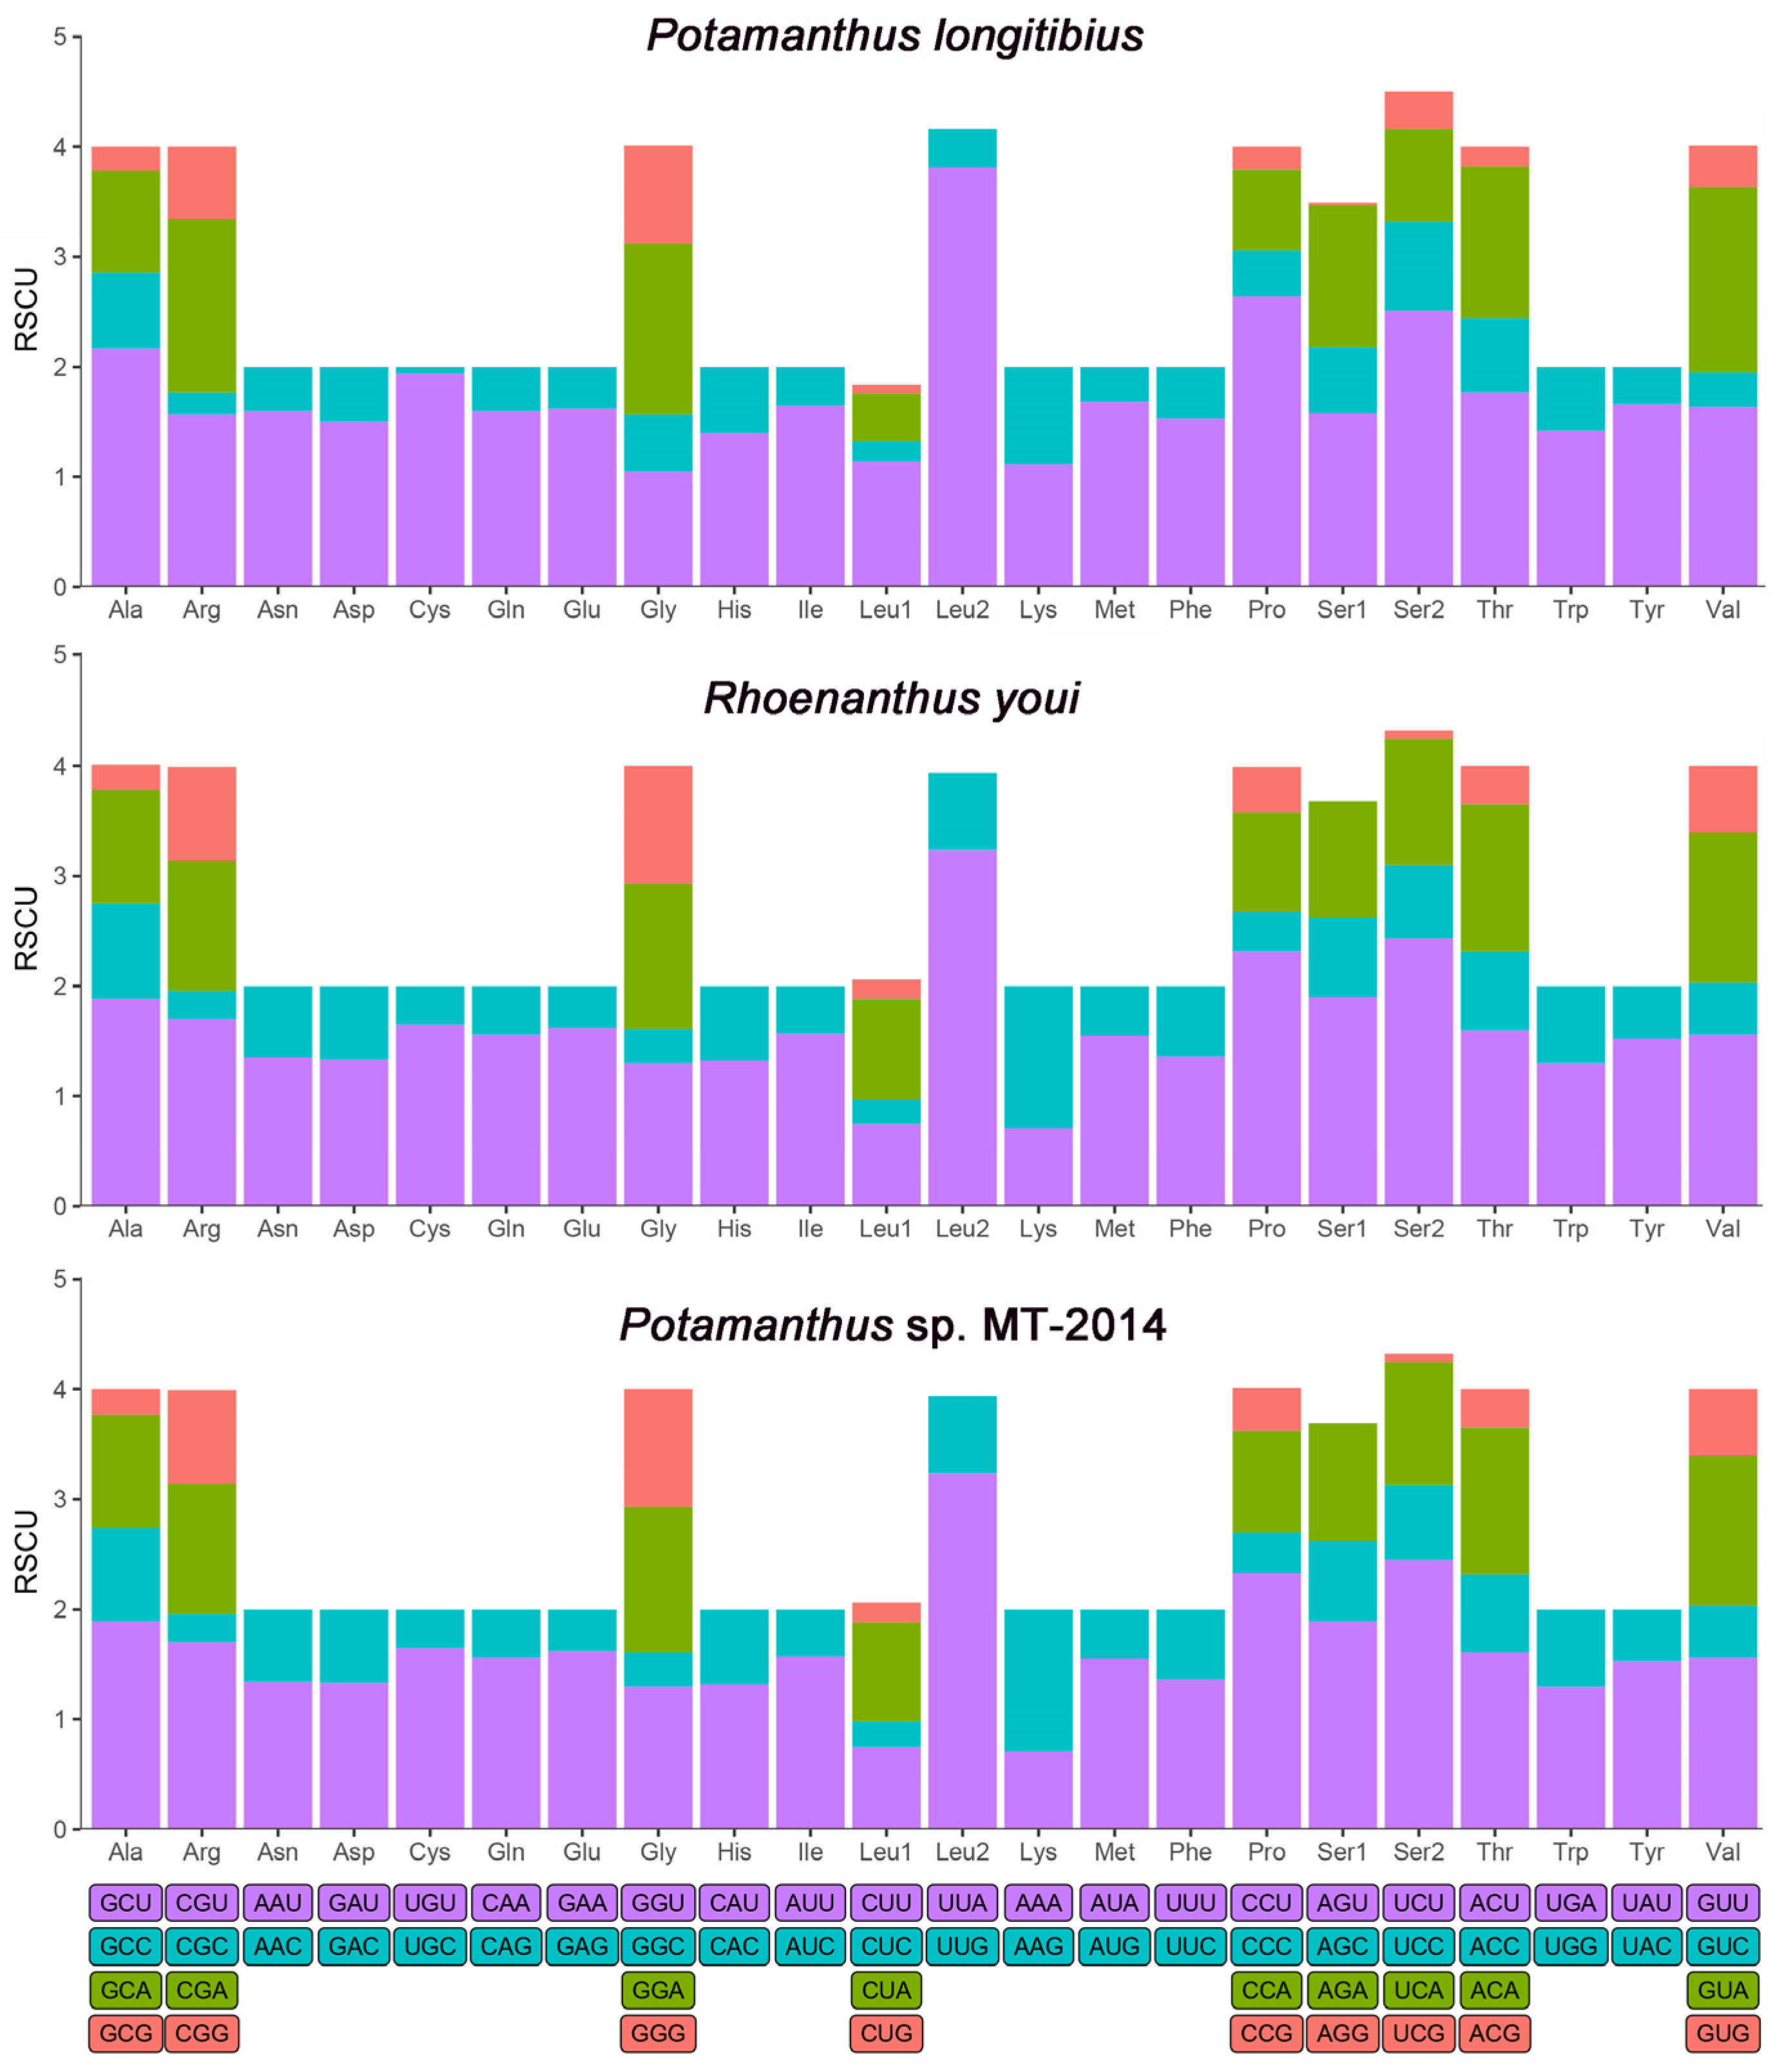
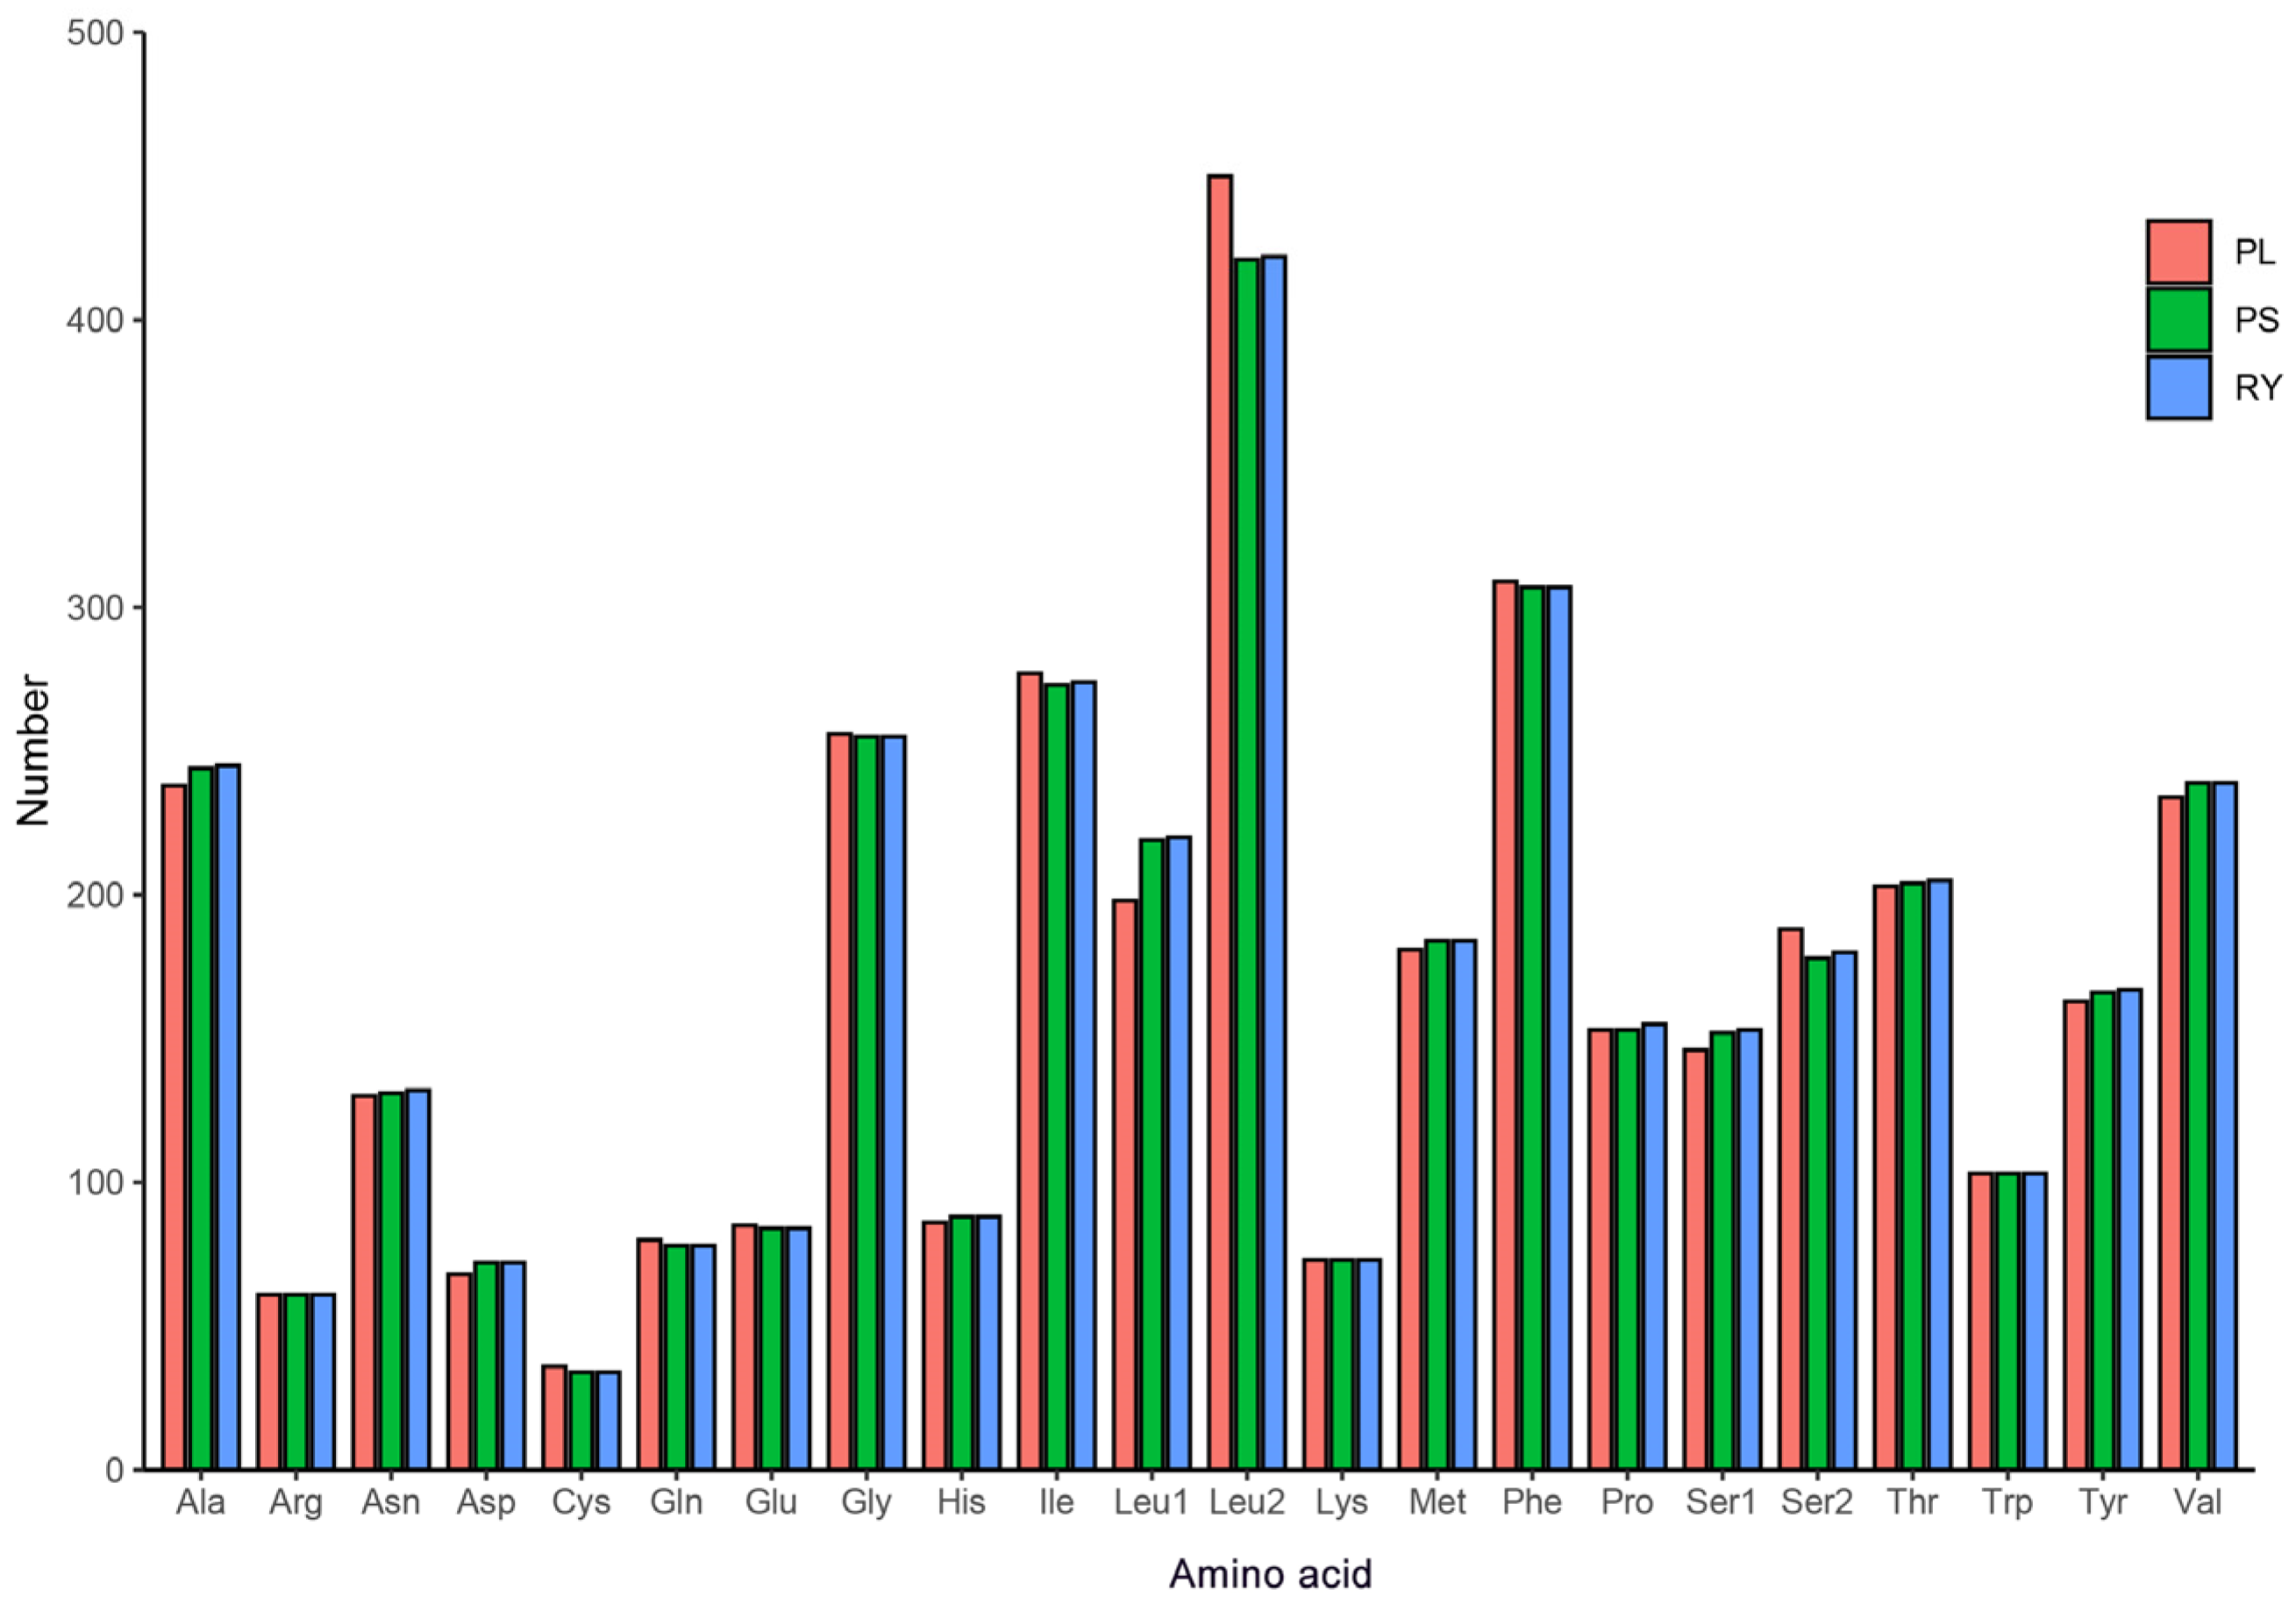
3.3. Protein-Coding Genes and Codon Usage

The sizes of all of the PCGs in P. longitibius and R. youi were 11,187 and 11,202 bp, respectively, accounting for 72.50% and 73.54% of the total sequences (Table 2). Four PCGs (ND1, ND4, ND4L, and ND5) were encoded on the L-strand, while the remaining nine PCGs were on the H-strand, as reported in other ephemeropterans (Figure 1). Among these genes, ND5 was identified as the longest gene, while ATP8 was the shortest. All of the PCGs, except for COX1, were initiated by the typical ATN start codons (ATA, ATG, ATT, or ATC). The start codons of 10 PCGs were consistent between the two species. Notably, COX1 started with the alternative start codon CGA, a feature similar to other reported mayfly mitogenomes (Table 1). A significant proportion of the PCGs terminated with the complete TAA stop codon, while certain genes, including COX2, ND5, and CYTB, ended with the incomplete stop codon T--. This incomplete stop codon has been widely reported in other invertebrate mitogenomes and is presumed to be completed through post-transcriptional polyadenylation [50].
In this study, the relative synonymous codon usage (RSCU) values and codon counts for each amino acid were calculated for the three available complete mitogenomes of Potamanthidae (P. longitibius, R. youi, and Potamanthus sp.). Excluding stop codons, the mitogenomes encoded 3718, 3731, and 3719 amino acids, respectively (Tables S3 and S4). The RSCU values are visualized in Figure 2, showing that all of the synonymous codons for the 22 amino acids were detected, except for AGG, which was absent in R. youi and Potamanthus sp. Among the amino acids, phenylalanine (Phe), isoleucine (Ile), glycine (Gly), and alanine (Ala) were the most frequently encoded, with leucine (Leu2) exhibiting the highest RSCU value (Figure 3). The most frequently used codons were UUA (L), AUU (I), and UUU (F). The comparative analysis suggests that the codon frequency may play a role in the biased usage of A + T nucleotides.
Comprehensive analyses of the genetic distance and evolutionary rates were conducted using the 13 PCGs from 40 available mayfly mitogenomes (Figure 4). The pairwise genetic distance values for the individual genes ranged from 0.2489 (COX1) to 0.6497 (ATP8), indicating that COX1 exhibits a relatively slower evolutionary rate. The non-synonymous-to-synonymous substitution ratio (Ka/Ks) was used to evaluate whether the sequences were undergoing purifying, neutral, or positive selection [51]. Our analysis revealed that all of the PCGs were under purifying selection (Ka/Ks < 1). Among these, ND2-ND6 and ND4L showed slightly relaxed purifying selection, ATP8 exhibited the highest Ka/Ks ratio due to limited sequence information, and COX1 demonstrated the strongest purifying selection. Both analyses consistently showed that COX1 had the lowest evolutionary rate and is subject to comparatively strong purifying selection, a phenomenon widely observed in other insect taxa [52].

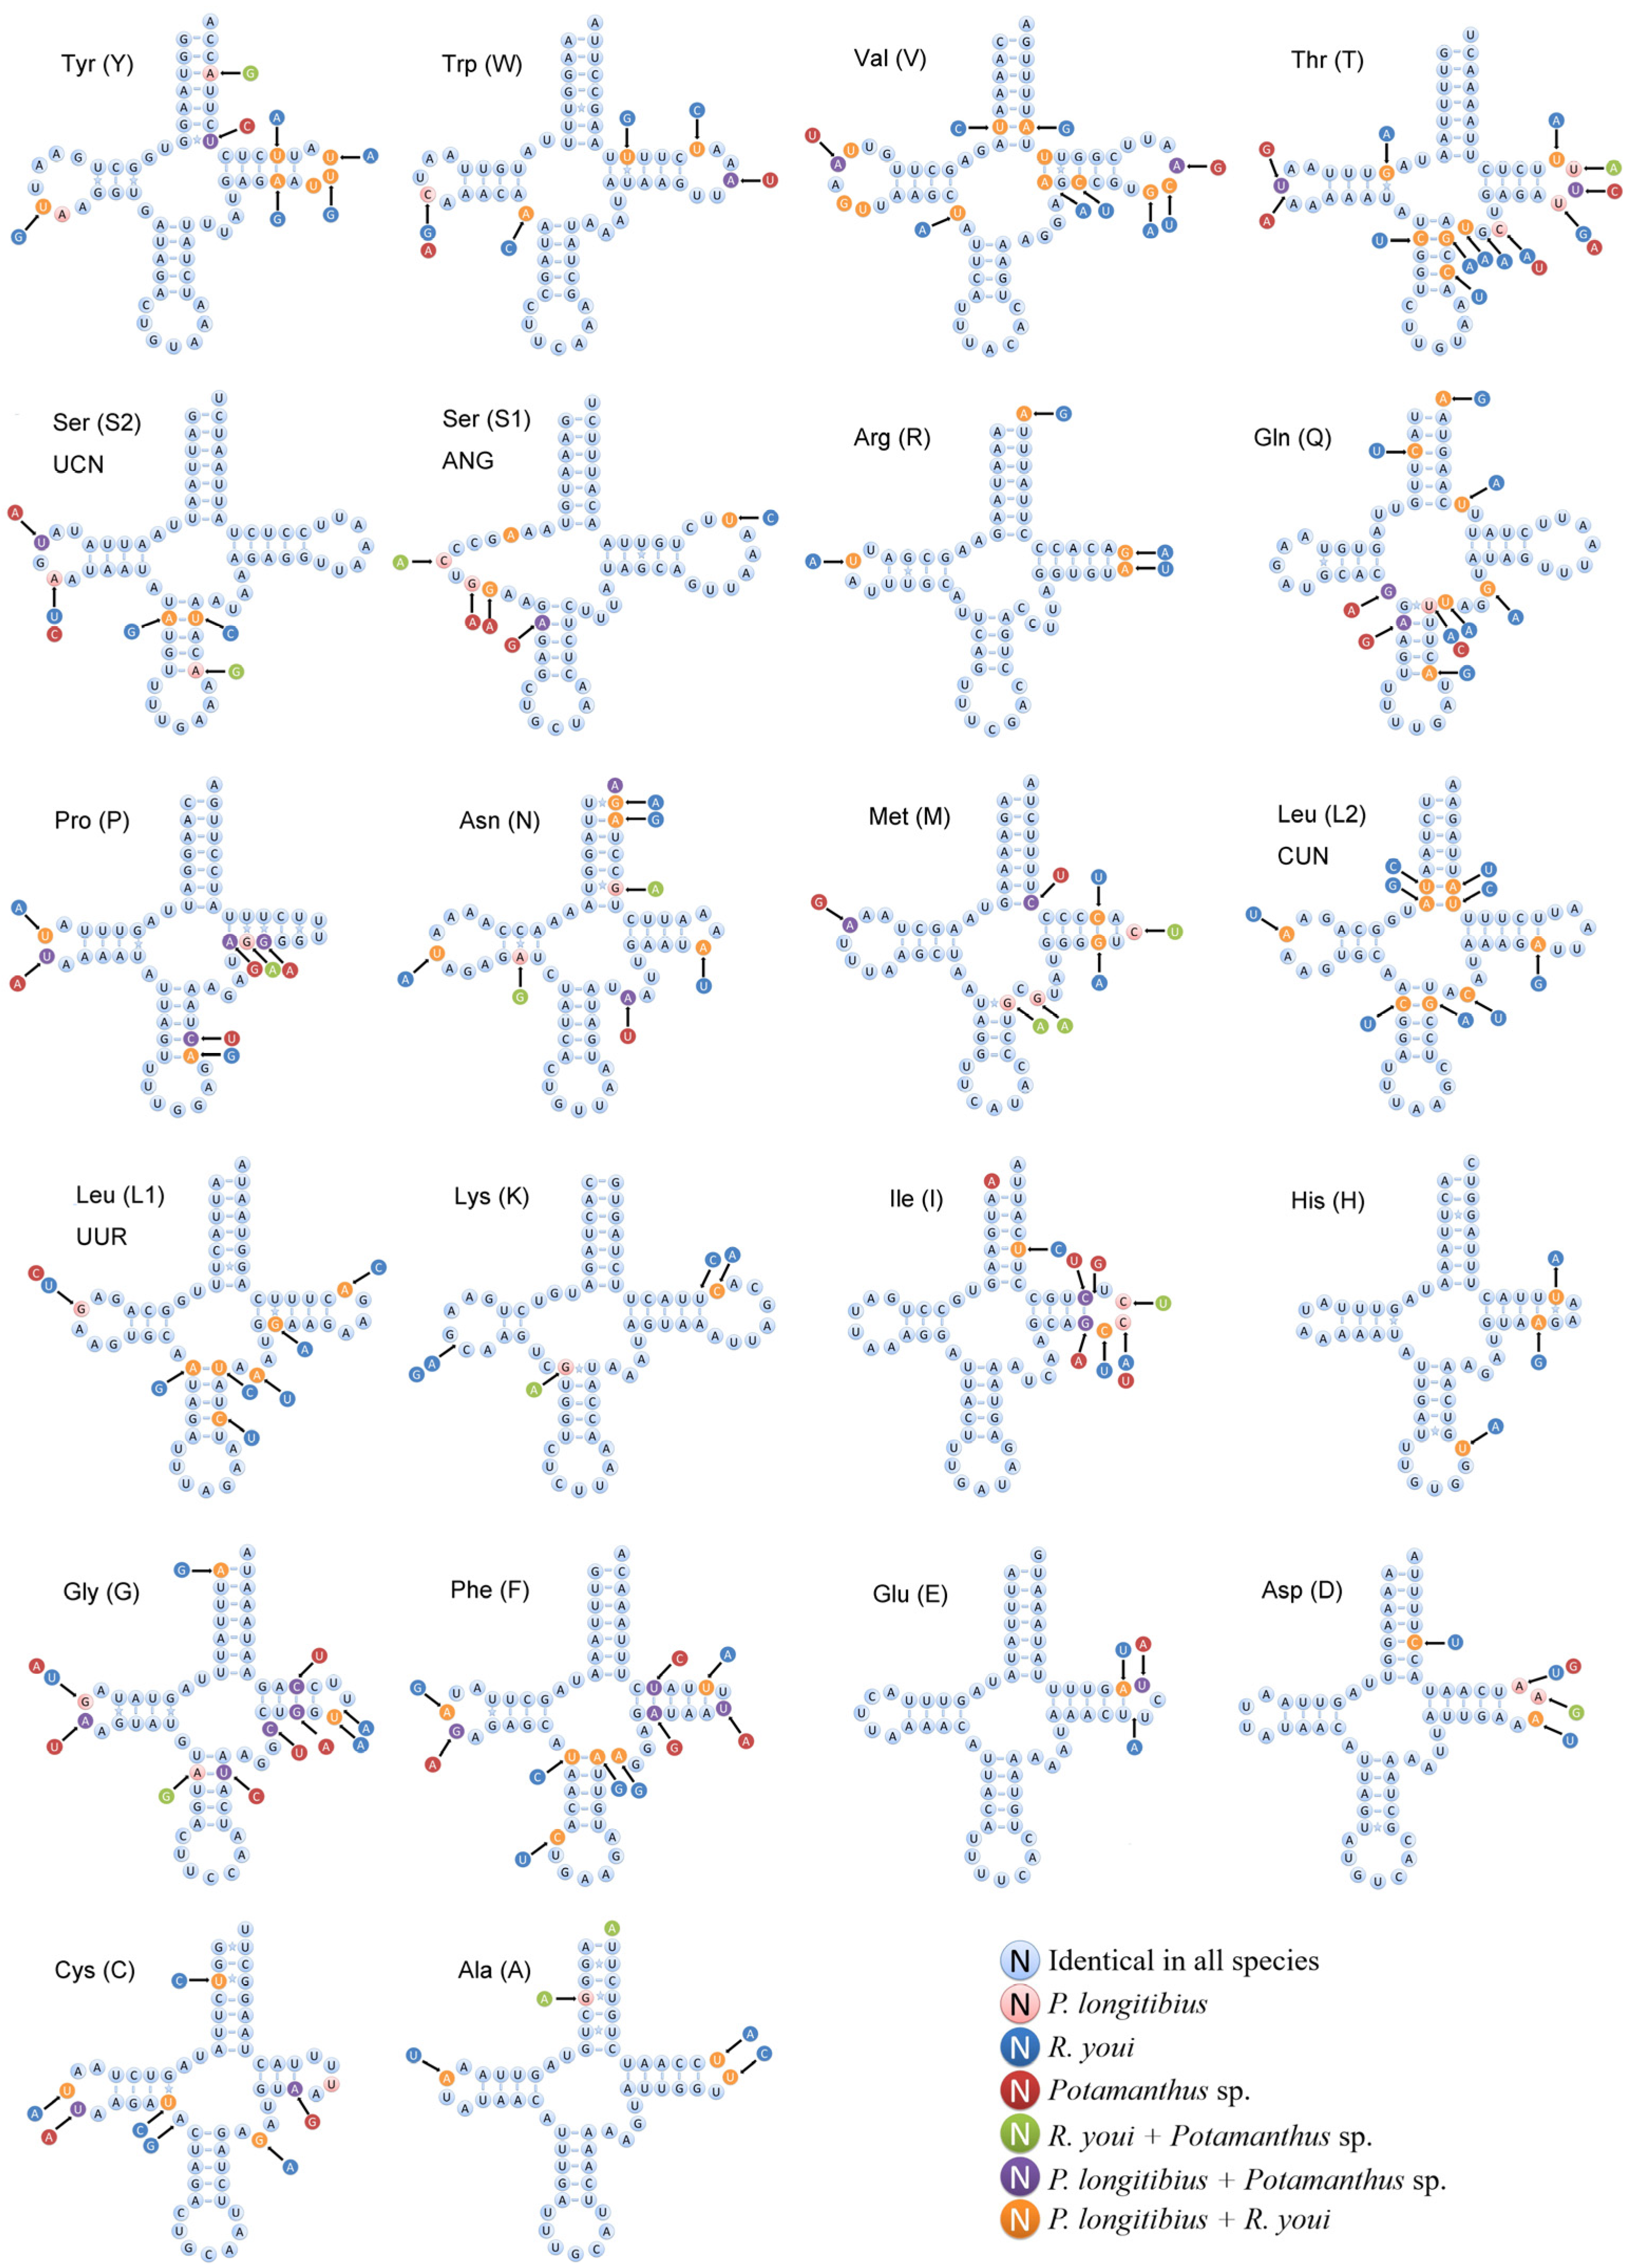
3.4. Ribosomal and Transfer RNA Genes

As observed in other mayflies, the mitogenomes encode the large (rrnL) and small (rrnS) rRNA subunits, generally located between trnL1 and trnV, and between trnV and the control region, respectively (Figure 1 and Table 1). The total size of the two rRNAs was 2024 bp in P. longitibius and 2032 bp in R. youi, with the A + T content accounting for 71.65% and 69.69%, respectively.
The 22 typical tRNA genes (1 for each amino acid, plus 2 each for serine and leucine), commonly detected in metazoan mitogenomes, were scattered throughout the entire mitogenomes of the two newly sequenced Potamanthidae species. Of these, 14 were encoded on the H-strand and 8 on the L-strand (Table 1). The tRNA sizes varied between 61 bp (trnC of R. youi) and 71 bp (trnV of P. longitibius). The total length of all of the tRNAs was 1436 bp (P. longitibius) and 1434 bp (R. youi), accounting for approximately 9.31% and 9.41% of the complete sequences. The anticodons of these tRNAs were consistent with their counterparts in previously sequenced ephemeropteran mitogenomes. All tRNAs in the two new mitogenomes exhibited typical cloverleaf secondary structures, except for trnS1, which lacked the dihydrouridine (DHU) arm. This unique feature has been commonly observed among ephemeropteran species (Figures S2 and S3). Previous studies have shown that the absence of the DHU arm in trnS1 is a widespread phenomenon, not only in insects but also in many other metazoans. Despite this structural variation, the functional integrity of the gene remains unaffected [53].
Apart from normal base pairs, numerous mismatches (C-U, A-C, and U-U) and non-complementary U-G weak bonds were found in the stem regions of the tRNAs (Figures S2 and S3). A total of 36 mismatched base pairs occurred in 18 tRNAs of P. longitibius, while 38 mismatches were scattered among 19 tRNAs of R. youi. These mismatches are thought to be corrected by RNA-editing mechanisms, ensuring the proper function of tRNA transport [54].
The comparative analysis of the tRNA secondary structures among the two new mitogenomes and the previously available Potamanthus sp. mitogenome revealed that certain tRNAs (trnE, trnH, trnK, trnD, and trnR) were highly conserved and predominantly encoded on the H-strand, except for trnH, which was located on the L-strand and exhibited a high percentage of identical nucleotides (Figure 5). Conversely, several tRNAs (trnT, trnG, trnF, and trnV) showed substantial nucleotide variation. These sequence differences, along with strand bias, differed from our previous findings in the mitogenomes of Catantopinae species (Orthoptera) [55]. However, the underlying evolutionary mechanisms of these patterns remain poorly understood.

3.5. Non-Coding Regions

The differences in the number and size of non-coding regions are generally responsible for the size variation observed in complete mitogenome sequences [56]. In the mitogenome of P. longitibius, a total of 13 non-coding regions (intergenic spacers) were identified, with a combined length of 811 bp and sizes ranging from 1 to 760 bp (Table 1). Similarly, R. youi possessed 12 non-coding regions totaling 618 bp, with lengths varying from 1 bp to 580 bp. In addition to the longest non-coding region (control region, CR), a total of 51 and 38 intergenic nucleotides were present in the mitogenomes of P. longitibius and R. youi, respectively. Furthermore, 11 instances of gene overlap were detected in both mitogenomes, involving 36 bp in P. longitibius and 54 bp in R. youi, with lengths ranging from 1 to 17 bp. The longest overlapping region in R. youi was located between COX3 and trnG. Interestingly, the overlapping region between ND4 and ND4L was not only conserved among other Potamanthidae species but was also consistent with most publicly available mayfly mitogenomes, indicating that this region is highly conserved within Ephemeroptera. The control region, positioned between rrnS and trnI, measured 760 bp in P. longitibius and 580 bp in R. youi. These sequences exhibited negative AT-skew and GC-skew, reflecting a pronounced bias toward the utilization of thymine (T) and cytosine (C).

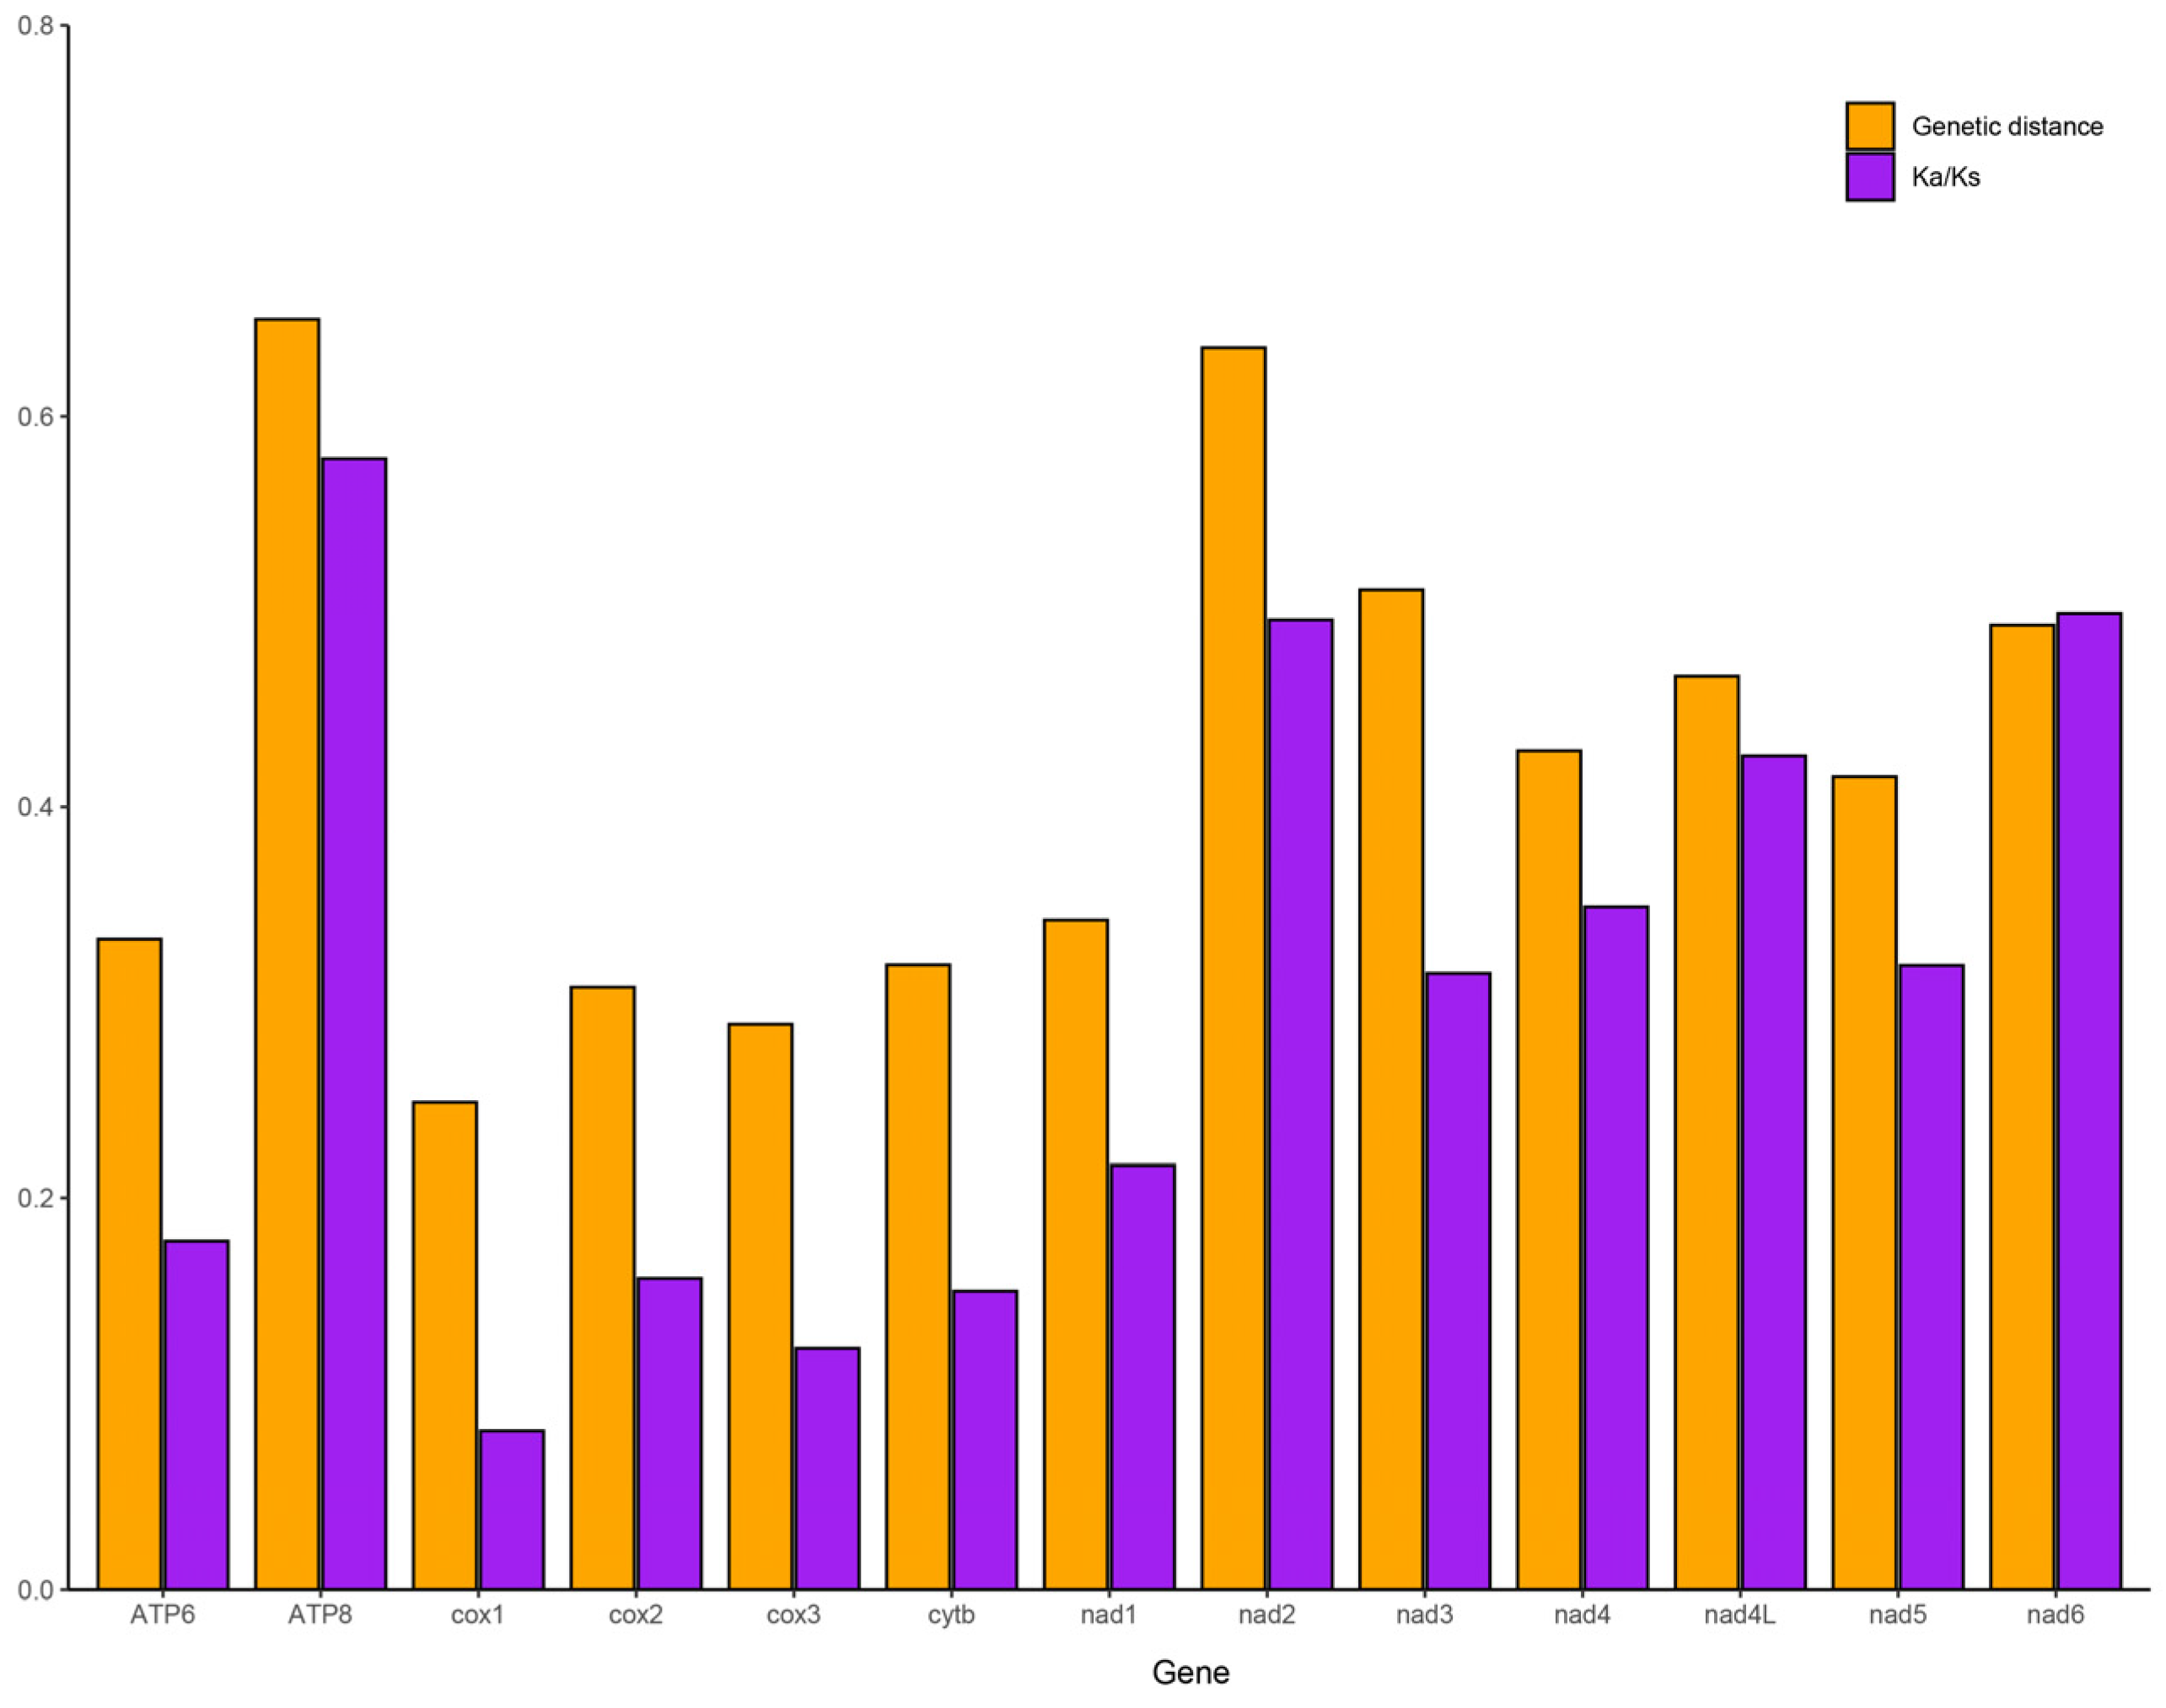
3.6. Phylogenetic Analysis

A total of 42 mitogenomes were used to reconstruct the phylogenetic relationships of Ephemeroptera using Maximum Likelihood (ML) and Bayesian Inference (BI) methods, including 40 mayfly species and 2 outgroup species from Odonata. The data matrix comprised all codon positions from 13 PCGs and 2 rRNAs, encompassing a total of 12,214 sites. The two phylogenetic trees yielded consistent topological structures with robust nodal support values [ML bootstrap support values (BS) and Bayesian posterior probabilities (BPP)]. These results indicate that the phylogenetic trees derived from mitogenome data exhibit high stability. The two trees are subsequently integrated into Figure 6.
All of the analyzed families of Ephemeroptera with more than two species were recovered as monophyletic in our phylogenetic trees. It should be noted that Siphlonurus immanis (FJ606783) was assigned to Ephemeridae, which was consistent with many studies [57,58,59]. However, according to a previous COI sequence comparison study, this species was actually identified as Ephemera supposita [59]. A sister group relationship between Potamanthidae and Ephemeridae was strongly supported, consistent with findings from our previous studies [20,60]. Within Potamanthidae, five mitogenomes from two genera (Rhoenanthus and Potamanthus) were included in the analysis. The phylogenetic relationships among the five Potamanthidae species were reconstructed with high nodal support values (BPP = 1 and BS = 100) as follows: ((((Potamanthus sp. MT-2014 + Rhoenanthus sp. JZ-2021) + Potamanthus kwangsiensis) + Potamanthus longitibius) + Rhoenanthus youi). The results revealed that the two Rhoenanthus species were not clustered together. This anomaly led us to suspect that the species identification of the mitogenome sequence for Rhoenanthus sp. JZ-2021, downloaded from GenBank, was incorrect. To investigate further, we analyzed the K2P genetic distances of the COI gene across the five Potamanthidae species (Table S5). The COI gene sequence of Rhoenanthus sp. JZ-2021 was most similar to that of Potamanthus sp. MT-2014. The genetic distance between Rhoenanthus sp. JZ-2021 and Rhoenanthus youi was 0.195, significantly greater than the distance between Rhoenanthus sp. JZ-2021 and other species. Based on the phylogenetic tree results and genetic distance analysis, we confirmed that the sequence labeled as Rhoenanthus sp. JZ-2021 actually belongs to the genus Potamanthus.

4. Conclusions

In this study, the complete mitogenomes of two Potamanthidae species (P. longitibius and R. youi) were sequenced and analyzed for the first time. The genomic organization, nucleotide composition, codon usage, and intergenic spacers were compared and examined. The nucleotide composition and gene arrangement of the mitogenomes were found to be relatively conserved. Phenylalanine (Phe), isoleucine (Ile), glycine (Gly), and alanine (Ala) were the most frequently encoded amino acids in both mitogenomes, with leucine (Leu2) showing the highest RSCU value. The comparative analysis of the tRNA secondary structures revealed that the tRNAs encoded on the H-strand exhibited a high percentage of identical nucleotides. Phylogenetic trees including 40 species from 13 families within Ephemeroptera were reconstructed to investigate the phylogeny of Potamanthidae. Based on the representative mitogenomes, our study indicated that all families with available comparable data in this analysis formed monophyletic groups, further supporting the sister group relationship between Potamanthidae and Ephemeridae. Additionally, our results confirmed that the sequence labeled as Rhoenanthus sp. JZ-2021 actually belongs to the genus Potamanthus. Since the species analyzed in this study do not represent all of the genera of Potamanthidae, future research should prioritize sequencing the complete mitogenomes of additional species to facilitate a more comprehensive molecular phylogenetic analysis of the family.

Supplementary Materials

The following supporting information can be downloaded at https://www.mdpi.com/article/10.3390/d17030164/s1, Figure S1: Alignment of the mitogenome sequences of P. longitibius, R. youi, and Potamanthus sp. MT-2014. Figure S2. The putative tRNA second structure for P. longitibius mitogenome. Figure S3. The putative tRNA second structure for R. youi mitogenome. Table S1. The mayfly information used in this study. Table S2. Partition schemes and best-fitting models selected from PartionFinder. Table S3. Codon number and RSCU in the mitogenome of P. longitibius. Table S4. Codon number and RSCU in the mitogenome of R. youi. Table S5. K2P genetic distance of DNA sequences among five Potamanthidae species.

Author Contributions

Conceptualization, R.L. and C.Z.; methodology, R.L.; software, C.X. and Z.M.; validation, C.X. and Z.M.; formal analysis, R.L. and Z.M.; investigation, R.L. and C.X.; resources, R.L.; data curation, R.L. and C.X.; writing—original draft preparation, R.L.; writing—review and editing, R.L. and C.X.; visualization, R.L.; supervision, C.Z.; project administration, R.L. and C.Z. All authors have read and agreed to the published version of the manuscript.

Funding

This research was funded by the National Natural Science Foundation of China, grant number 32200359 and the China Postdoctoral Science Foundation, grant number 2024M751749.

Institutional Review Board Statement

Not applicable.

Data Availability Statement

The mitogenomes of P. longitibius and R. youi have been deposited in the GenBank database under the accession numbers PQ723066 and PQ723067, respectively. The genomic Illumina sequencing data were deposited in the NCBI Sequence Read Archive (SRA) database under accession numbers SRR31632539 and SRR31691749, respectively.

Acknowledgments

The authors acknowledge any support given that is not covered by the author contributions or by funding.

Conflicts of Interest

The authors declare no conflicts of interest.

References

  1. Bernt, M.; Braband, A.; Schierwater, B.; Stadler, P.F. Genetic aspects of mitochondrial genome evolution. Mol. Phylogenet. Evol. 2013, 69, 328–338. [Google Scholar] [CrossRef] [PubMed]
  2. Boore, J.L. Animal mitochondrial genomes. Nucleic Acids Res. 1999, 27, 1767–1780. [Google Scholar] [CrossRef] [PubMed]
  3. Burger, G.; Gray, M.W.; Lang, B.F. Mitochondrial genomes: Anything goes. Trends Genet. 2003, 19, 709–716. [Google Scholar] [CrossRef] [PubMed]
  4. Wolstenholme, D.R. Animal mitochondrial DNA: Structure and evolution. Int. Rev. Cytol. 1992, 141, 173–216. [Google Scholar]
  5. Simon, S.; Hadrys, H. A comparative analysis of complete mitochondrial genomes among Hexapoda. Mol. Phylogenet. Evol. 2013, 69, 393–403. [Google Scholar] [CrossRef]
  6. Dong, X.; Yi, W.; Zheng, C.; Zhu, X.; Wang, S.; Xue, H.; Ye, Z.; Bu, W. Species delimitation of rice seed bugs complex: Insights from mitochondrial genomes and ddRAD-seq data. Zool. Scr. 2022, 51, 185–198. [Google Scholar] [CrossRef]
  7. Ge, X.; Wang, J.; Zang, H.; Chai, L.; Liu, W.; Zhang, J.; Yan, C.; Wang, B. Mitogenomics provide new phylogenetic insights of the family Apataniidae (Trichoptera: Integripalpia). Insects 2024, 15, 973. [Google Scholar] [CrossRef]
  8. Bunmee, K.; Thaenkham, U.; Saralamba, N.; Ponlawat, A.; Zhong, D.; Cui, L.; Sattabongkot, J.; Sriwichai, P. Population genetic structure of the malaria vector Anopheles minimus in Thailand based on mitochondrial DNA markers. Parasites Vectors 2021, 14, 496. [Google Scholar] [CrossRef]
  9. Chang, H.; Qiu, Z.; Yuan, H.; Wang, X.; Li, X.; Sun, H.; Guo, X.; Lu, Y.; Feng, X.; Majid, M.; et al. Evolutionary rates of and selective constraints on the mitochondrial genomes of Orthoptera insects with different wing types. Mol. Phylogenet. Evol. 2020, 145, 106734. [Google Scholar] [CrossRef]
  10. Ge, X.; Peng, L.; Vogler, A.P.; Morse, J.C.; Yang, L.; Sun, C.; Wang, B. Massive gene rearrangements of mitochondrial genomes and implications for the phylogeny of Trichoptera (Insecta). Syst. Entomol. 2023, 48, 278–295. [Google Scholar] [CrossRef]
  11. Cameron, S.L. Insect mitochondrial genomics: A decade of progress. Annu. Rev. Entomol. 2024, 70, 83–101. [Google Scholar] [CrossRef] [PubMed]
  12. Jacobus, L.M.; Macadam, C.R.; Sartori, M. Mayflies (Ephemeroptera) and their contributions to ecosystem services. Insects 2019, 10, 170. [Google Scholar] [CrossRef] [PubMed]
  13. Jacobus, L.M.; Salles, F.F.; Price, B.; Pereira-Da-Conceicoa, L.; Dominguez, E.; Suter, P.J.; Molineri, C.; Tiunova, T.M.; Sartori, M. Mayfly taxonomy (Arthropoda: Hexapoda: Ephemeroptera) during the first two decades of the twenty-first century and the concentration of taxonomic publishing. Zootaxa 2021, 4979, 25–30. [Google Scholar] [CrossRef] [PubMed]
  14. Sartori, M.; Brittain, J.E. Order Ephemeroptera. In Ecology and General Biology, Vol I: Thorp and Covich’s Freshwater Invertebrates, 4th ed.; Thorp, J.H., Rogers, D.C., Eds.; Academic Press: New York, NY, USA, 2015; pp. 873–891. [Google Scholar]
  15. Lei, Z.; Li, M.; Deng, M.; Zhou, C. First description of the Chinese mayfly Ephemera lota Navás, 1934 (Ephemeroptera: Ephemeridae) based on imagines with designation of the species neotype. Aquat. Insects 2024, 45, 319–334. [Google Scholar] [CrossRef]
  16. Ogden, T.H.; Gattolliat, J.L.; Sartori, M.; Staniczek, A.H.; Soldán, T.; Whiting, M.F. Towards a new paradigm in mayfly phylogeny (Ephemeroptera): Combined analysis of morphological and molecular data. Syst. Entomol. 2009, 34, 616–634. [Google Scholar] [CrossRef]
  17. Miller, D.B.; Bartlett, S.; Sartori, M.; Breinholt, J.W.; Ogden, T.H. Anchored phylogenomics of burrowing mayflies (Ephemeroptera) and the evolution of tusks. Syst. Entomol. 2018, 43, 692–701. [Google Scholar] [CrossRef]
  18. Ogden, T.H.; Breinholt, J.W.; Bybee, S.M.; Miller, D.B.; Sartori, M.; Shiozawa, D.; Whiting, M.F. Mayfly phylogenomics: Initial evaluation of anchored hybrid enrichment data for the order Ephemeroptera. Zoosymposia 2019, 16, 167–181. [Google Scholar]
  19. Guo, Z.Q.; Shen, C.Y.; Cheng, H.Y.; Chen, Y.X.; Wu, H.Y.; Storey, K.B.; Yu, D.N.; Zhang, J.Y. Mitogenome-based phylogeny with divergence time estimates revealed the presence of cryptic species within Heptageniidae (Insecta, Ephemeroptera). Insects 2024, 15, 745. [Google Scholar] [CrossRef]
  20. Li, R.; Zhang, W.; Ma, Z.X.; Zhou, C.F. Novel gene rearrangement pattern in the mitochondrial genomes of Torleya mikhaili and Cincticostella fusca (Ephemeroptera: Ephemerellidae). Int. J. Biol. Macromol. 2020, 165, 3106–3114. [Google Scholar] [CrossRef]
  21. Bae, Y.J.; McCafferty, W.P. Phylogenetic systematics of the Potamanthidae (Ephemeroptera). Trans. Am. Entomol. Soc. 1991, 117, 1–143. [Google Scholar]
  22. Kwanboon, S.; Sartori, M.; Boonsoong, B. Behningiidae and Potamanthidae (Insecta, Ephemeroptera) in Thailand. ZooKeys 2021, 1067, 57. [Google Scholar] [CrossRef] [PubMed]
  23. Bartholomae, P.G.; Meier, P.G. Notes on the life history of Potamanthus myops in southeastern Michigan (Ephemeroptera: Potamanthidae). Great Lakes Entomol. 1977, 10, 10. [Google Scholar] [CrossRef]
  24. Han, N.A.; Zhang, M.; Zhou, C.F. The genus Rhoenanthus Eaton, 1881 in China with the redescription of R. hunanensis You & Gui, 1995 (Ephemeroptera: Potamanthidae). Zootaxa 2021, 4903, zootaxa-4903. [Google Scholar]
  25. Li, W.J.; Zhou, C.F. A detailed comparison of two species in the genus Potamanthus Pictet, 1843 from China (Ephemeroptera, Potamanthidae). ZooKeys 2022, 1125, 193–205. [Google Scholar] [CrossRef]
  26. Li, W.J.; Mu, P.X.; Zhou, C.F. Systematics of Potamanthodes nanchangi Hsu, 1936 (Ephemeroptera: Potamanthidae). Zootaxa 2022, 5213, 149–158. [Google Scholar] [CrossRef]
  27. Wingett, S.W.; Andrews, S. FastQ Screen: A tool for multi-genome mapping and quality control. F1000Research 2018, 7, 1338. [Google Scholar] [CrossRef]
  28. Patel, R.K.; Jain, M. NGS QC Toolkit: A toolkit for quality control of next-generation sequencing data. PLoS ONE 2012, 7, e30619. [Google Scholar] [CrossRef]
  29. Schmieder, R.; Edwards, R. Quality control and preprocessing of metagenomic datasets. Bioinformatics 2011, 27, 863–864. [Google Scholar] [CrossRef]
  30. Nicolas, D.; Patrick, M.; Guillaume, S. NOVOPlasty: De novo assembly of organelle genomes from whole-genome data. Nucleic Acids Res. 2017, 45, e18. [Google Scholar]
  31. Meng, G.; Li, Y.; Yang, C.; Liu, S. MitoZ: A toolkit for mitochondrial genome assembly, annotation, and visualization. Nucleic Acids Res. 2019, 47, e63. [Google Scholar] [CrossRef]
  32. Laslett, D.; Canbäck, B. ARWEN, a program to detect tRNA genes in metazoan mitochondrial nucleotide sequences. Bioinformatics 2008, 24, 172–175. [Google Scholar] [CrossRef] [PubMed]
  33. Lowe, T.M.; Chan, P.P. tRNAscan-SE On-line: Integrating search and context for analysis of transfer RNA genes. Nucleic Acids Res. 2016, 44, W54–W57. [Google Scholar] [CrossRef] [PubMed]
  34. Bernt, M.; Donath, A.; Jühling, F.; Externbrink, F.; Florentz, C.; Fritzsch, G.; Pütz, J.; Middendorf, M.; Stadler, P.F. MITOS: Improved de novo metazoan mitochondrial genome annotation. Mol. Phylogenet. Evol. 2013, 69, 313–319. [Google Scholar] [CrossRef] [PubMed]
  35. Frazer, K.A.; Pachter, L.; Poliakov, A.; Rubin, E.M.; Dubchak, I. VISTA: Computational tools for comparative genomics. Nucleic Acids Res. 2004, 32, W273–W279. [Google Scholar] [CrossRef]
  36. Kumar, S.; Stecher, G.; Li, M.; Knyaz, C.; Tamura, K. MEGA X: Molecular evolutionary genetics analysis across computing platforms. Mol. Biol. Evol. 2018, 35, 1547–1549. [Google Scholar] [CrossRef]
  37. Rozas, J.; Ferrer-Mata, A.; Sánchez-DelBarrio, J.C.; Guirao-Rico, S.; Librado, P.; Ramos-Onsins, S.E.; Sánchez-Gracia, A. DnaSP 6: DNA sequence polymorphism analysis of large data sets. Mol. Biol. Evol. 2017, 34, 3299–3302. [Google Scholar] [CrossRef]
  38. Perna, N.T.; Kocher, T.D. Patterns of nucleotide composition at fourfold degenerate sites of animal mitochondrial genomes. J. Mol. Evol. 1995, 41, 353–358. [Google Scholar] [CrossRef]
  39. Zhang, D.; Gao, F.; Jakovlić, I.; Zhou, H.; Zhang, J.; Li, W.X.; Wang, G.T. PhyloSuite: An integrated and scalable desktop platform for streamlined molecular sequence data management and evolutionary phylogenetics studies. Mol. Ecol. Resour. 2020, 20, 348–355. [Google Scholar] [CrossRef]
  40. Katoh, K.; Kuma, K.; Toh, H.; Miyata, T. MAFFT version 5: Improvement in accuracy of multiple sequence alignment. Nucleic Acids Res. 2005, 33, 511–518. [Google Scholar] [CrossRef]
  41. Capella-Gutiérrez, S.; Silla-Martínez, J.M.; Gabaldón, T. TrimAl: A tool for automated alignment trimming in large-scale phylogenetic analyses. Bioinformatics 2009, 25, 1972–1973. [Google Scholar] [CrossRef]
  42. Kück, P.; Longo, G.C. FASconCAT-G: Extensive functions for multiple sequence alignment preparations concerning phylogenetic studies. Front. Zool. 2014, 11, 81. [Google Scholar] [CrossRef] [PubMed]
  43. Lanfear, R.; Calcott, B.; Ho, S.Y.; Guindon, S. PartitionFinder: Combined selection of partitioning schemes and substitution models for phylogenetic analyses. Mol. Biol. Evol. 2012, 29, 1695–1701. [Google Scholar] [CrossRef] [PubMed]
  44. Stamatakis, A. RAxML version 8: A tool for phylogenetic analysis and post-analysis of large phylogenies. Bioinformatics 2014, 30, 1312–1313. [Google Scholar] [CrossRef]
  45. Ronquist, F.; Teslenko, M.; van der Mark, P.; Ayres, D.L.; Darling, A.; Höhna, S.; Larget, B.; Liu, L.; Suchard, M.A.; Huelsenbeck, J.P. MrBayes 3.2: Efficient Bayesian phylogenetic inference and model choice across a large model space. Syst. Biol. 2012, 61, 539–542. [Google Scholar] [CrossRef] [PubMed]
  46. Miller, M.; Pfeiffer, W.T.; Schwartz, T. Creating the CIPRES science gateway for inference of large phylogenetic Trees. In Proceedings of the Gateway Computing Environments Workshop (GCE), New Orleans, LA, USA, 14 November 2010; Institute of Electrical and Electronics Engineers (IEEE): New Orleans, LA, USA, 2010; pp. 1–8. [Google Scholar]
  47. Rambaut, A. FigTree v1. 4.2: Tree Figure Drawing Tool. Available online: http://tree.bio.ed.ac.uk/software/figtree/ (accessed on 12 October 2024).
  48. Clary, D.O.; Wolstenholme, D.R. The mitochondrial DNA molecule of Drosophila yakuba: Nucleotide sequence, gene organization, and genetic code. J. Mol. Evol. 1985, 22, 252–271. [Google Scholar] [CrossRef]
  49. Dai, J.; Liu, M.; Di Giulio, A.; Sabatelli, S.; Wang, W.; Audisio, P. The first two complete mitochondrial genomes for the subfamily Meligethinae (Coleoptera: Nitidulidae) and implications for the higher phylogeny of Nitidulidae. Insects 2024, 15, 57. [Google Scholar] [CrossRef]
  50. Ojala, D.; Montoya, J.; Attardi, G. tRNA punctuation model of RNA processing in human mitochondria. Nature 1981, 290, 470–474. [Google Scholar] [CrossRef]
  51. Xue, C.; Zhang, D.; Liu, D.K.; Jiao, L.Z.; Li, R.; Yi, X.F. First record of the complete mitochondrial genome for the genus Borbo (Lepidoptera, Hesperiidae): Characterization and comparative genomic analysis. Diversity 2024, 16, 560. [Google Scholar] [CrossRef]
  52. Zhang, L.; Li, W.H. Mammalian housekeeping genes evolve more slowly than tissue-specific genes. Mol. Biol. Evol. 2004, 21, 236–239. [Google Scholar] [CrossRef]
  53. Cameron, S.L. Insect mitochondrial genomics: Implications for evolution and phylogeny. Annu. Rev. Entomol. 2014, 59, 95–117. [Google Scholar] [CrossRef]
  54. Varani, G.; McClain, W.H. The G-U wobble base pair: A fundamental building block of RNA structure crucial to RNA function in diverse biological systems. EMBO Rep. 2000, 1, 18–23. [Google Scholar] [CrossRef] [PubMed]
  55. Li, R.; Shu, X.H.; Li, X.D.; Meng, L.; Li, B.P. Comparative mitogenome analysis of three species and monophyletic inference of Catantopinae (Orthoptera: Acridoidea). Genomics 2019, 111, 1728–1735. [Google Scholar] [CrossRef] [PubMed]
  56. Lv, C.; Li, Q.; Kong, L. Comparative analyses of the complete mitochondrial genomes of Dosinia clams and their phylogenetic position within Veneridae. PLoS ONE 2018, 13, e0196466. [Google Scholar] [CrossRef] [PubMed]
  57. Xu, X.D.; Jia, Y.Y.; Dai, X.Y.; Ma, J.L.; Storey, K.B.; Zhang, J.Y.; Yu, D.N. The mitochondrial genome of Caenis sp. (Ephemeroptera: Caenidae) from Fujian and the phylogeny of Caenidae within Ephemeroptera. Mitochondrial DNA Part B 2019, 5, 192–193. [Google Scholar] [CrossRef]
  58. Guan, J.Y.; Zhang, Z.Y.; Cao, Y.R.; Xu, X.D.; Storey, K.B.; Yu, D.N.; Zhang, J.Y. The complete mitochondrial genome of Choroterpes (Euthralus) yixingensis (Ephemeroptera: Leptophlebiidae) and its mitochondrial protein-coding gene expression under imidacloprid stress. Gene 2021, 800, 145833. [Google Scholar] [CrossRef]
  59. Yu, D.N.; Yu, P.P.; Zhang, L.P.; Storey, K.B.; Gao, X.Y.; Zhang, J.Y. Increasing 28 mitogenomes of Ephemeroptera, Odonata and Plecoptera support the Chiastomyaria hypothesis with three different outgroup combinations. PeerJ 2021, 9, e11402. [Google Scholar] [CrossRef]
  60. Li, R.; Ma, Z.X.; Zhou, C.F. The first two complete mitochondrial genomes of Neoephemeridae (Ephemeroptera): Comparative analysis and phylogenetic implication for Furcatergalia. Genes 2021, 12, 1875. [Google Scholar] [CrossRef]
Figure 1. Mitochondrial genome maps of P. longitibius and R. youi.
Diversity 17 00164 g001
Figure 2. Relative synonymous codon usage (RSCU) of the mitogenomes of P. longitibius, R. youi, and Potamanthus sp. MT-2014.
Diversity 17 00164 g002
Figure 3. Amino acid composition of the PCGs in the mitogenomes of P. longitibius, R. youi, and Potamanthus sp. MT-2014.
Diversity 17 00164 g003
Figure 4. Genetic distance (on average) and non-synonymous (Ka) to synonymous (Ks) substitution rates of 13 PCGs among 40 Ephemeroptera species.
Diversity 17 00164 g004
Figure 5. The putative tRNA second structures of P. longitibius, R. youi, and Potamanthus sp. MT-2014.
Diversity 17 00164 g005
Figure 6. Phylogenetic trees obtained from ML and BI analysis.
Diversity 17 00164 g006
Table 1. Features of the complete mitogenomes of P. longitibius (Plon) and R. youi (Ryou).
GeneStrandPositionIntergenic NucleotidesCodonAnticodon
PlonRyouPlonRyouPlonRyou
trnIH1–631–6303--GAU
trnQL64–13267–13515--UUG
trnMH134–198141–20500--CAU
ND2H199–1215206–1222−2−2ATC/TAAATT/TAA
trnWH1214–12811221–1288−8−8--UCA
trnCL1274–13351281–134170--GCA
trnYL1343–14081342–140511--GUA
COX1H1410–29451407–2942−5−5CGA/TAACGA/TAA
trnLH2941–30062938–300322--UAA
COX2H3009–36963006–369300ATG/TATG/T
trnKH3697–37643694–376300--CUU
trnDH3765–38293764–382800--GUC
ATP8H3830–39943829–3990−7−7ATT/TAAATC/TAA
ATP6H3988–46653984–4661−1−1ATG/TAAATG/TAA
COX3H4665–54534661–54642−17ATG/TAAATG/TAA
trnGH5456–55175448–551000--UCC
ND3H5518–58715511–5864−1−1ATA/TAAATC/TAA
trnAH5871–59335864–592700--UGC
trnRH5934–59965928–599000--UCG
trnNH5997–60605991–6054−1−3--GUU
trnSH6060–61266052–611700--GCU
trnEH6127–61916118–6183−2−2--UUC
trnFL6190–62536182–624666--GAA
ND5L6260–79886253–798111ATG/TATG/T
trnHL7990–80527983–8044−13--GUG
ND4L8052–93958048–9391−7−7ATG/TAAATG/TAA
ND4LL9389–96859385–968172ATG/TAAATG/TAA
trnTH9693–97569684–974700--UGU
trnPL9757–98199748–981122--UGG
ND6H9822–10,3349814–10,329−1−1ATT/TAAATT/TAA
CYTBH10,334–11,46810,329–11,46300ATG/TATG/T
trnSH11,469–11,53811,464–11,5331112--UGA
ND1L11,550–12,49111,546–12,48711ATG/TAAATG/TAA
trnLL12,493–12,55712,489–12,55300--UAG
rrnLL12,558–13,81812,554–13,811100--
trnVL13,819–13,88913,812–13,87800--UAC
rrnSL13,890–14,67013,879–14,65200--
CRH14,671–15,43014,653–15,23200--
Table 2. Nucleotide composition of the mitogenomes of P. longitibius (Plon) and R. youi (Ryou).
LengthA + T %AT-SkewGC-Skew
PlonRyouPlonRyouPlonRyouPlonRyou
Whole genome15,43015,23268.7966.75−0.029−0.038−0.235−0.245
PCGs11,18711,20267.9165.73−0.201−0.187−0.004−0.023
1st codon3732373760.9059.93−0.111−0.0830.2080.178
2nd codon3729373462.8863.01−0.407−0.403−0.130−0.125
3rd codon3729373479.9974.28−0.107−0.088−0.185−0.192
tRNAs1436143470.6870.57−0.0050.0260.1210.137
rRNAs2042203271.6569.690.0230.0730.3230.325
CR76058069.7466.55−0.121−0.130−0.487−0.351
Disclaimer/Publisher’s Note: The statements, opinions and data contained in all publications are solely those of the individual author(s) and contributor(s) and not of MDPI and/or the editor(s). MDPI and/or the editor(s) disclaim responsibility for any injury to people or property resulting from any ideas, methods, instructions or products referred to in the content.

