1. Introduction
Freshwater mussels, particularly pearl mussels, serve as vital bioindicators and ecosystem engineers in fluvial systems. Their presence often signifies high water quality, as they are sensitive to pollutants and require specific physicochemical conditions for survival [
1]. Furthermore, they play a crucial role in nutrient cycling and sediment stabilization, thereby contributing to the overall health and resilience of aquatic ecosystems [
2]. Mussels offer a range of other ecosystem services, such as water purification through biofiltration, nutrient cycling, and storage. They modify and offer habitat structure and constantly rework the substrate. Beyond these ecological roles, mussels are also used for food, tools, ornamental purposes, and spiritual practices. Additional information on the ecosystem services that freshwater mussels provide can be found in Vaughn, 2018 [
3].
The freshwater pearl mussel (FPM),
Margaritifera margaritifera, is a keystone and indicator species in oligotrophic river ecosystems. Classified as “Critically Endangered” in Europe, its populations face a multitude of different pressures like river dredging, land use change, pollution, and illegal pearl fishing [
4]. Protected under the European Habitats Directive (92/43/EEC), this species also serves as a sentinel for aquatic health. Its lifecycle is intricately dependent on multiple riverine factors, such as water dynamics, substrate quality, host fish populations, and water quality, positioning it as a comprehensive indicator species for assessing river health [
1].
The populations of
Margaritifera margaritifera have experienced a significant decline, up to 90% across Europe and 80% in England and Wales [
5]. While numerous factors like land use changes, pollution, and overharvesting have been implicated [
6], a research gap in understanding the species’ relationship with underlying geological and geomorphological features that define sedimentology, hydrology, and river morphology remains [
7,
8]. Additionally, the influence of water dynamics on its habitat suitability is underexplored [
4], and the same conclusion applies to channel morphology [
9]. Both of these parameters are also sensitive to long-term climate change [
10]. These knowledge gaps call for further research into how geological formations and river geomorphology affect FPMs, both for its conservation and as a river health indicator. Although some geological features, such as limestone beds, are known to influence water chemistry, the specific interplay between geology, geomorphology, and mussel habitat is not well understood. Integrated studies using geomorphic and biological data could offer a comprehensive view of habitat suitability and resilience [
6].
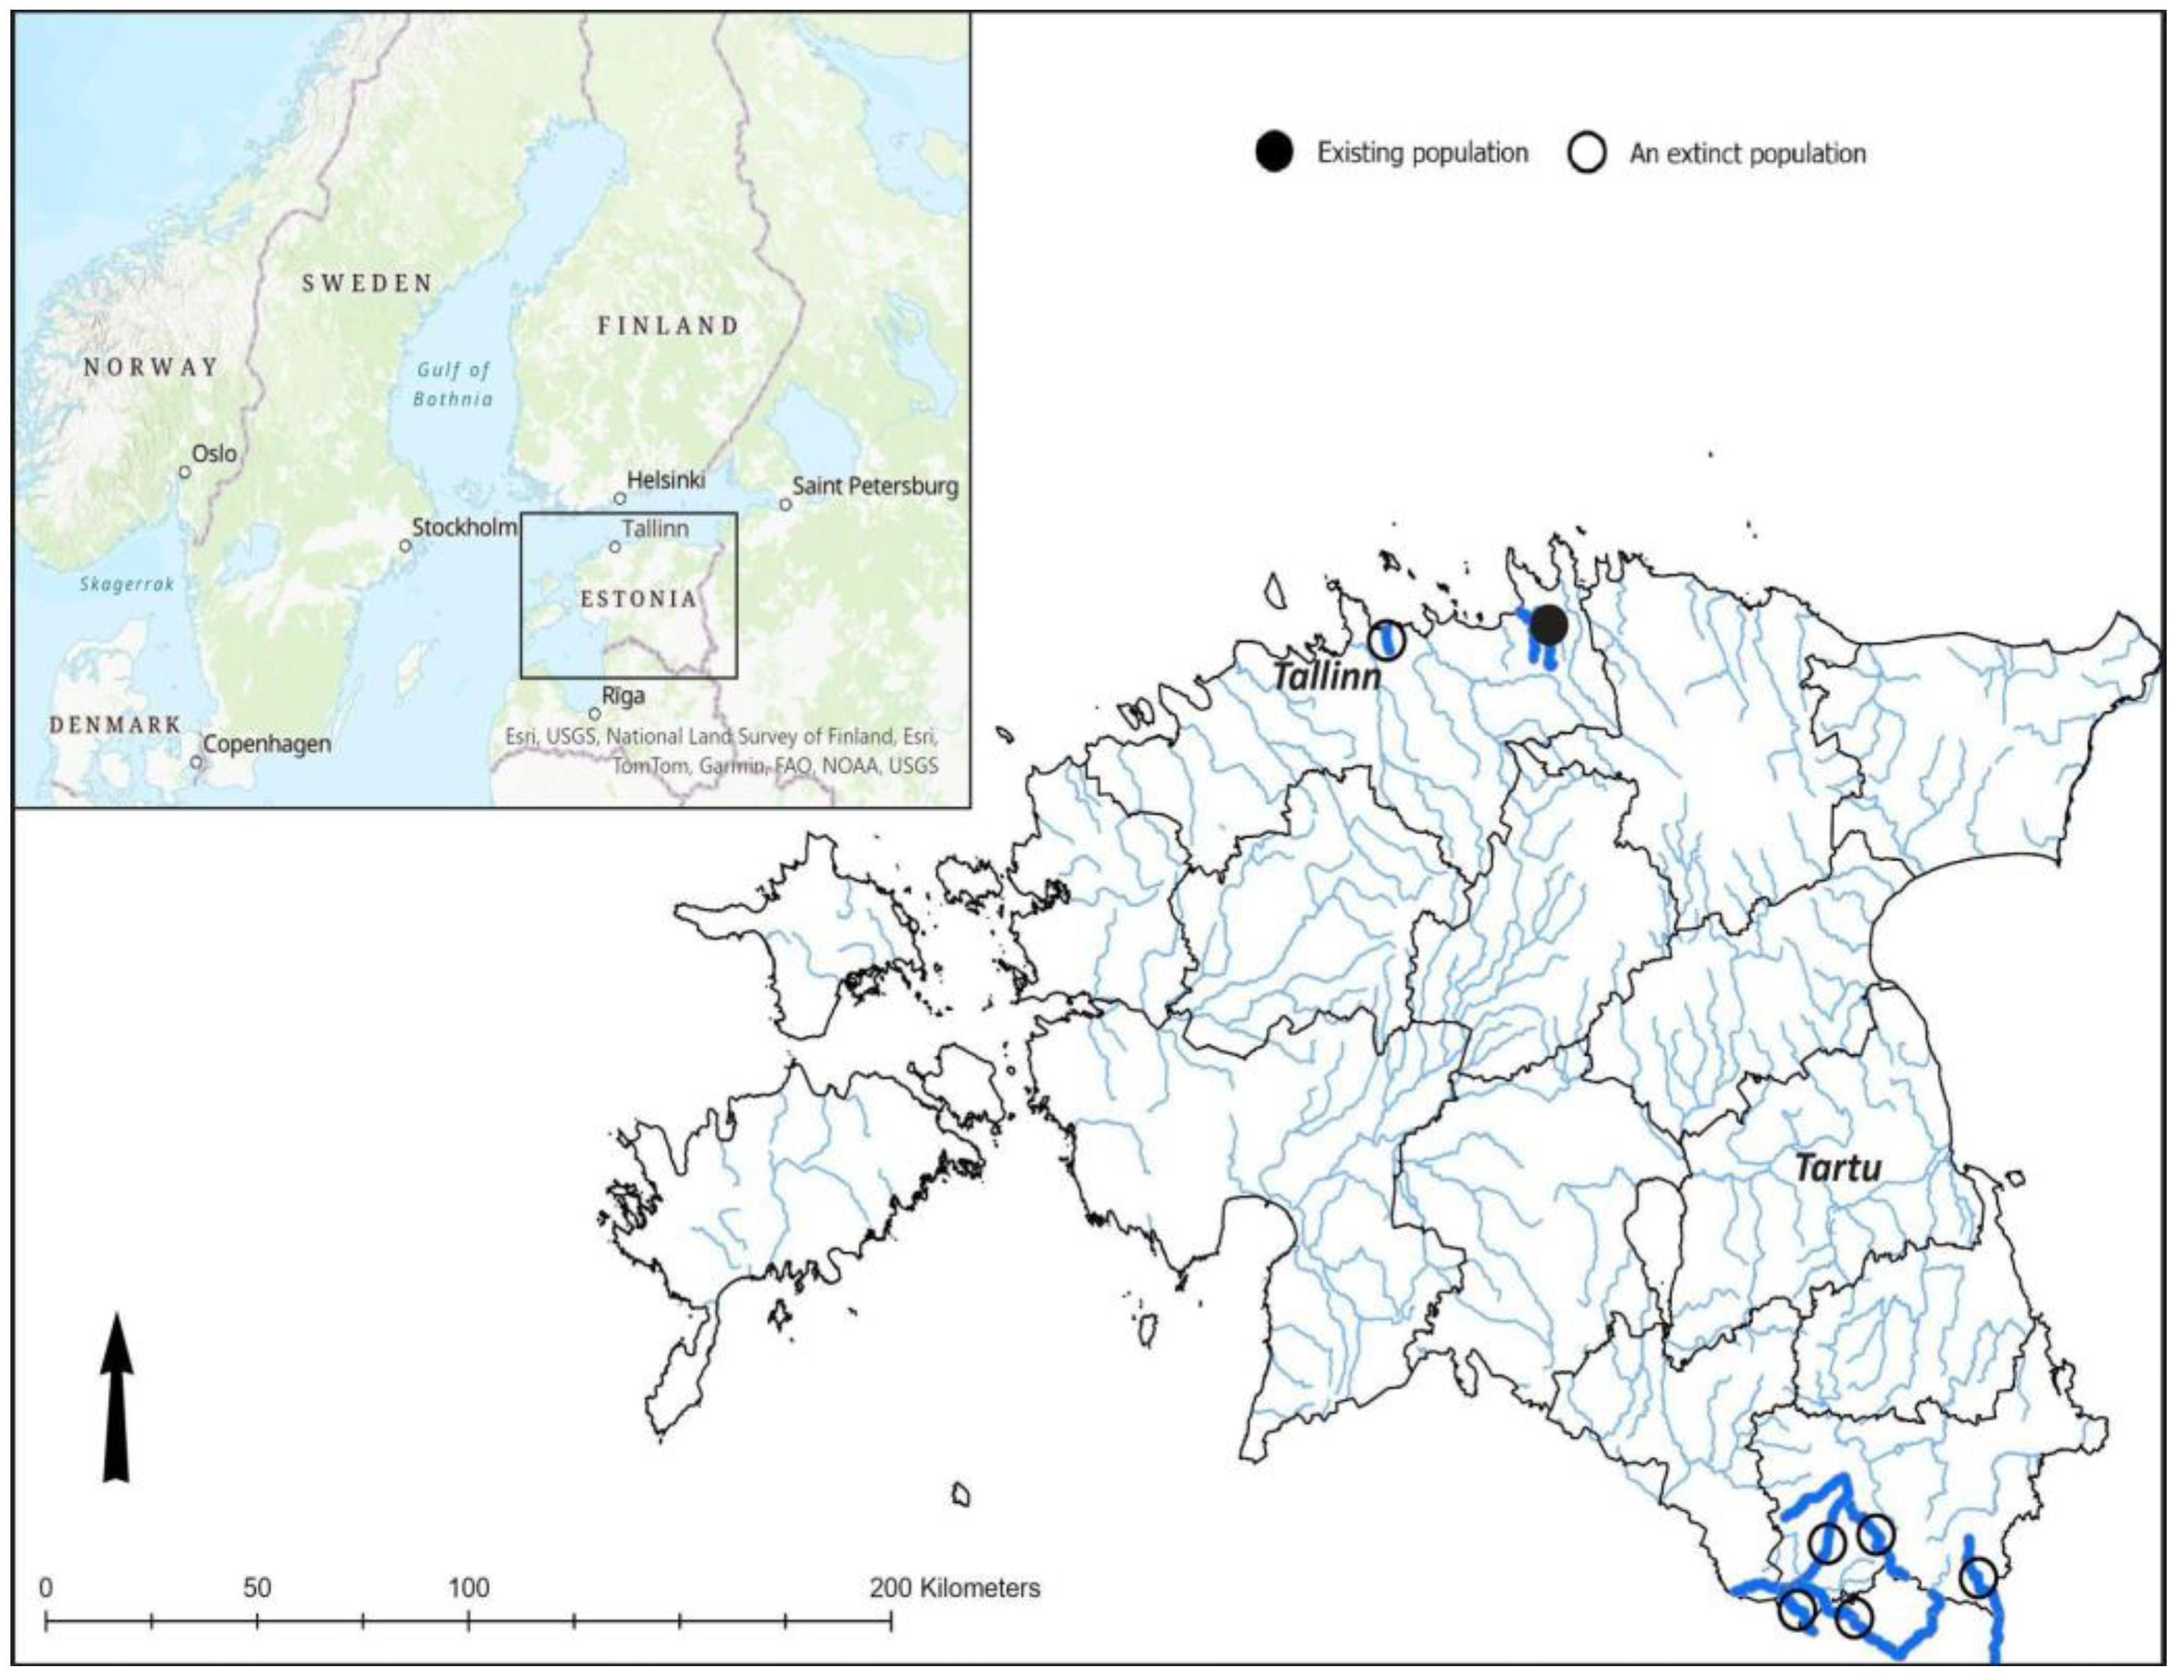
In Estonia, there is one known river basin, Pudisoo River, that is currently inhabited by the freshwater pearl mussel (
Figure 1). Located in Northern Estonia, this river has been hydrologically monitored for over sixty years, with flow rates tracked since the end of 1960s, and brown trout (
Salmo trutta) and Atlantic salmon (
Salmo salar) parr abundance have been monitored since 1975. Systematic monitoring of the freshwater pearl mussel population began in 1991. The confirmed history of the freshwater pearl mussel in Estonia spans several thousand years. The oldest known specimen from Estonia was found at a Stone Age burial site on the northern coast, near Purtse in Northeast Estonia, during archaeological excavations conducted several times between 1884 and 1934 (
https://www.zotero.org/google-docs/?bgS17R accessed on 20 October 2024) [
11]. The historical location is approximately 85 km east of the current mussel river and about 250 km from known habitats near St. Petersburg [
12]. The burial site was later dated to 4090 ± 35 radiocarbon years BC [
11]. According to local accounts recorded in the excavation diary, mussel shells were also found in other graves in the region. While there is no direct evidence, it is plausible that the freshwater pearl mussel was present in other rivers of Northeast Estonia, closer to these burial sites.
The oldest known written records of the freshwater pearl mussel appear in sources dating back to the Swedish rule (16th–17th centuries) which describe the topography of Estonia and Livonia [
13] and the natural history of Livonia [
14]. The authors mention 40–45 Livonian rivers and streams as pearl mussel rivers, of which 5–6 are within the current territory of Estonia, mostly in Southern Estonia [
13,
14,
15]. A reference is also made to the Pudisoo River, which serves as the habitat for the current mussel population, as well as to another river on the northern coast, located within the Maardu estate [
13]. However, no recent data are available regarding the mussel population in this river. The 17th-century distribution data of the pearl mussel are considered reliable because they resulted from organized searches of mussel rivers [
14]. Similar accounts have been described by Makhrov and others, 2014 for Russia [
16]. There was a very high demand for pearls in Russia for several centuries, and it is natural that this influence extended to neighboring areas in Estonia and Livonia.
Pearl gathering from small watercourses was quite common, but was strictly regulated to consider the interests of landowners [
14]. The extent and impact of pearl fishing and the historical size of the Pudisoo River basin population can only be speculated upon. It seems miraculous that, under conditions where pearl fishing was a continuous process in the region for about three centuries and lasted until the second half of the last century [
17], the Pudisoo River FPM population has still survived. Local residents, even until quite recently, described to ethnographers that searching for pearls for their own amusement was a common practice along the river [
18,
19].
The recognition of the freshwater pearl mussel as a species of significant conservation value in Estonia dates back over a century. However, systematic observations of the Pudisoo River population began in the late 1960s to early 1970s, with long-term monitoring based on methods adopted from Finnish colleagues starting in the early 1990s [
18].
The present study aims to elucidate the population dynamics of freshwater pearl mussels in Estonia using monitoring data from earlier periods and to explore their associations with habitat features. One aim of the study was to describe this system, which is somewhat unique within its surrounding region, to better understand its distinctive characteristics and to identify the factors within the river and watershed that have influenced and shaped the habitat, both historically and in the present day. To mitigate the potential deterioration in the chemical and physical qualities of water that could hinder juvenile survival, we conducted a bioindication experiment along the river. More specifically, this research examines how factors such as habitat hydrology, channel morphology, geology, and sediment distribution influence the distribution of this species.
2. Materials and Methods
2.1. Catchment Geology and River Morphology
Geological and geomorphological characterization of the Pudisoo River catchment area is based mainly on 1:50,000 scale geological mapping reports that provided data on general distribution of overburden types and thickness, landform description, development history of the area, etc. The river valley and river channel sediments were described by the authors in detail during fieldwork in 2022.
The morphometrical analysis of the river channel and its catchment was conducted using high-resolution digital terrain models (DTMs) with a pixel size of 1 m. The DTM were derived from airborne laser scanning data collected in 2022 by the Estonian Land Board. These DTMs were acquired through the Estonian Land Board’s website, downloaded, and merged to form a continuous 1 m resolution DTM covering the entire catchment area. The catchment boundary and channel network were delineated within the QGIS software (vers. 3.28) environment, utilizing the SAGA GIS hydrology toolset.
The river centerline was subsequently segmented into 100 m long sections, serving as the underlying units for morphometric and statistical analyses. The gradient of these sections was determined by calculating the difference in altitude between the endpoints of each section and its subsequent section, then dividing this by the section length. Furthermore, channel sinuosity was quantified using the QGIS RiverMetrics plugin, which follows the approach proposed by Clerici and Perego (2016) [
20]. The length of the sections for sinuosity analysis was set to 500 m, and they were successively shifted downstream by increments of 100 m.
2.2. FPM Population Monitoring
Since 1991, the dynamics of the freshwater pearl mussel (FPM) population have been systematically monitored using three distinct methods, each contributing unique insights into population trends and habitat conditions.
- (a)
Annual Data from Permanent Monitoring Sites (1991–2010, with additional data from 2015 and 2018):
Systematic population monitoring began in 1991, focusing on specific sites in the river’s middle and lower sections. Ten sites, each 10–30 m in length, were monitored annually using a consistent methodology by a single observer. Observations were collected from visibly marked sites in nature, primarily using an aquascope. Live mussels were counted, and dead mussels and empty shells were removed to avoid double-counting. Winter mortality rates were occasionally recorded during spring. This methodology remained consistent until 2010, with additional observations conducted in 2015 and 2018 [
18].
- (b)
Data from National Wildlife Monitoring Program (2011, 2014, 2018, 2022):
Initiated under the national environmental monitoring sub-program “Monitoring of Wildlife Diversity and Landscapes”, this phase aligned with the freshwater pearl mussel species action plan. Monitoring occurred at three- to four-year intervals across nine standardized test sites. These observations, conducted by Foundation Lutreola in 2011, 2014, and 2018, were collected with handheld GPS devices for site precision but without physical marking, leading to slight variations in coverage. In 2018, nine additional randomly selected sites were included, although these were not revisited in 2022. Monitoring and data analysis were carried out in 2022 by the Environmental Agency; data are available in the online KESE database (visited 31.10.2024).
- (c)
Comprehensive River-wide Census (2021–2023):
Conducted as part of the CoastNET LIFE and LIFE Revives projects, this detailed census documented every FPM individual along the river, including juveniles. Surveys employed snorkeling and aquascope methods to provide precise location data, age distribution, and a detailed overview of FPM habitat characteristics in the river.
Population data were analyzed using the MS Office Excel Analysis ToolPak. The analyzed dataset encompasses distinct monitoring periods, reflecting variations in methodology and scope.
2.3. Host Fish (Salmonids) Population Monitoring
The host fish species for freshwater pearl mussels in the Pudisoo River are juvenile brown trout (
Salmo trutta) and Atlantic salmon (
Salmo salar) parr. The abundance of parr has been monitored annually since 1992 by electrofishing at a permanent monitoring site located 6.5 km upstream from the river mouth. This site represents the largest trout spawning and juvenile rearing area in the river, with results reflecting recruitment trends across the watershed. During each monitoring affair, the site is electrofished twice with a 30-min interval between sessions. Parr density (individuals per 100 m
2) is estimated using the method described by Zippin [
21].
2.4. Bioindication Experiment
The physical and chemical water parameters in the Pudisoo River differ significantly from the known requirements for freshwater pearl mussels [
22,
23,
24], according to the Estonian Environmental Agency. Therefore, it was necessary to conduct a bioindication test that was designed to evaluate the river water’s suitability for juvenile FPMs while excluding external factors like sediment and water flow dynamics
In the summer of 2023, a bioindication experiment was carried out using juvenile FPMs collected from host fish in the previous summer (2022). Juveniles were placed along the Pudisoo River on Buddensiek plates, each with 50 slots, at six locations corresponding to the river sections shown in
Figure 2.
2.5. Hydrological Analysis
Pudisoo River has a state-run hydrological station located at the lower course of the Pudisoo River (59.50872° N, 25.59464° E). The station collects daily stage measurements that are converted to discharge measurements using site-specific rating curves. The daily discharge measurements are available on the Estonian weather service webpage and contain daily measurements from the period of 01.11.1960 to 31.12.2022 without data gaps.
The discharge time series were analyzed within the
R software (vers. 4.22) environment using algorithms from the “Flowscreen” package [
25] (algorithms were modified with the aid of ChatGPT). This package calculates up to 30 different streamflow metrics, analyzing temporal trends and change-points in time series. The Mann–Kendall test was used to assess trend significance. Trend magnitude was determined via the Theil–Sen approach. Drought events were identified when streamflow fell below a predetermined threshold, i.e., the 80th percentile of mean daily flow over a 30-day period. A minimum inter-event period of 10 days was applied, with drought events shorter than 15 days being excluded [
25].
2.6. Land Use Analysis
Scanned maps from 1935 and 1988 (scale 1:50,000) and a digital map from 2023 (scale 1:10,000) were obtained from the Estonian Land Board. The maps were georeferenced to the 2023 digital map, processed, and merged to cover the entire catchment. Filters, including dilatation, median, and low-pass, were applied to remove clutter while preserving major land-use unit boundaries.
Following the methodology outlined by Herrault and others (2013) [
26], the image was converted to HIS color space, and principal component analysis (PCA) was performed on six input channels (RGB and HIS). The first principal component accounted for 92% (1935) and 84% (1988) of the variance. PCA1 and Hue rasters were smoothed in QGIS using the MeanShiftSmoothing tool and segmented using the GrassGIS i.segment algorithm, with a minimum segment size set to 1 hectare.
Random forest (RF) supervised classification was used to classify segments into five land use classes: dry forest, wet forest, dry agricultural land, open wetlands, and water bodies. About 350 segments were labeled manually, with 30% reserved for validation. The model achieved a kappa index of 0.85 (1935 map) and 0.77 (1988 map) and was used to label all segments. Expert review of the results led to manual reshaping/relabeling of about 5% of segments. Training and classification were carried out with the QGIS Orfeo Toolbox TrainVector-Classifier and VectorClassifier tools.
Watercourses were digitized manually using the Raster Trace plugin in QGIS. Natural and artificial channels were distinguished primarily by sinuosity; shaded relief was also used as a background to identify signs of (former) natural channels. A 100-m-wide zone around any watercourse was considered “adjacent to the watercourse” and was calculated with a QGIS buffer tool.
3. Results
3.1. Catchmement Geology and River Morphology
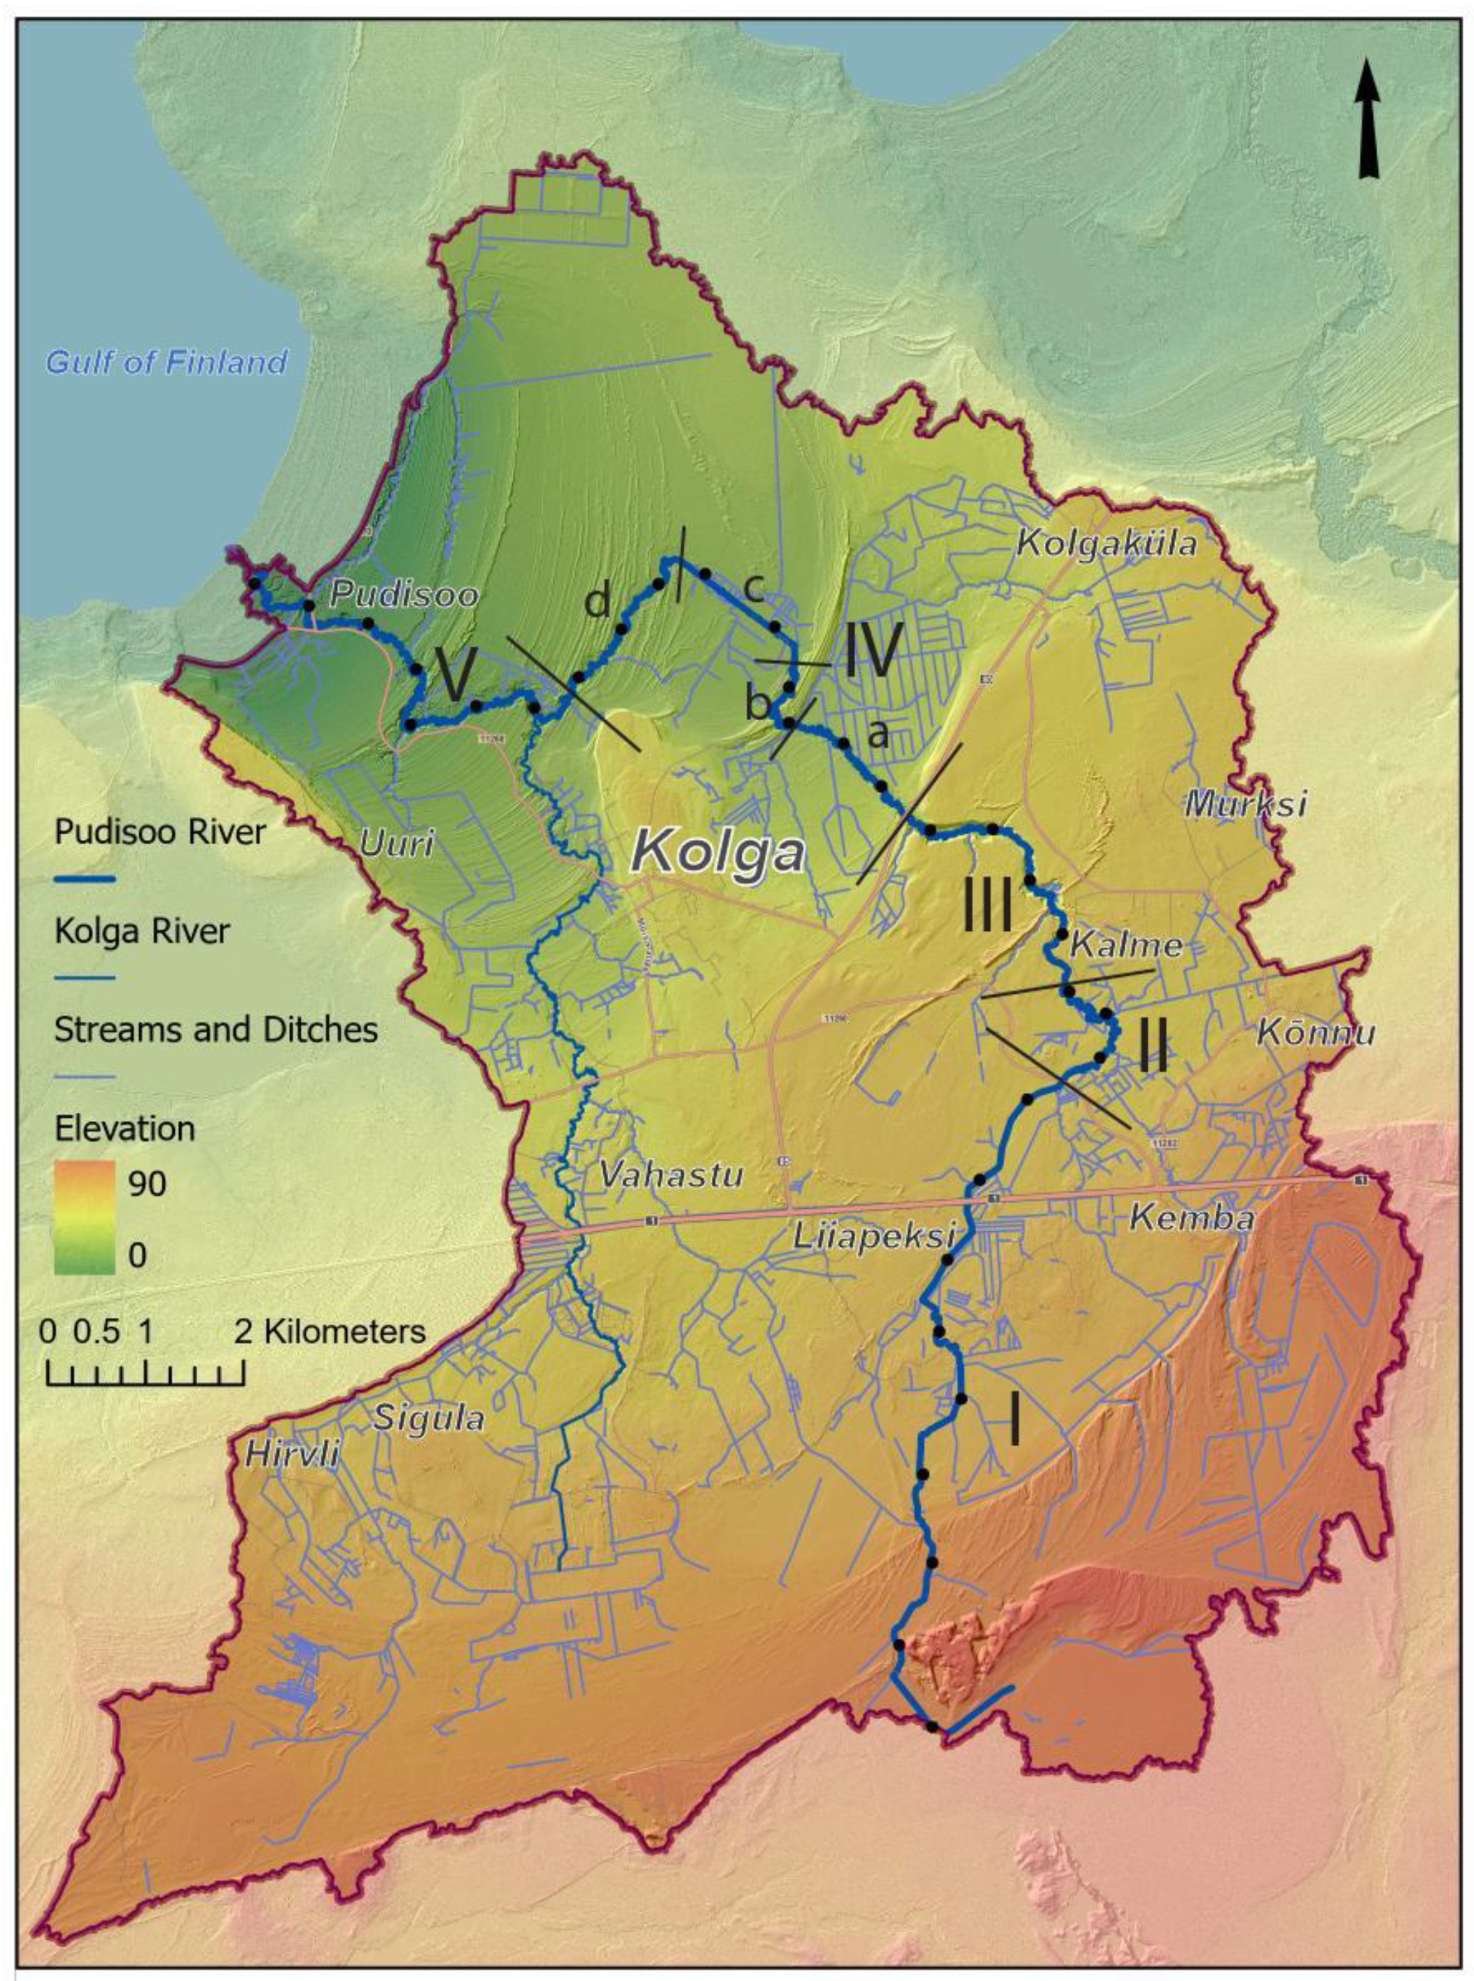
The Pudisoo River basin is characterized by a largely flat topography which generally tilts northwest (
Figure 2). In the upper and middle parts of the river, glacial landforms and bedrock elevations shape the landscape, while the lower reaches flow across the coastal strandplain, featuring shore-parallel ridges from different stages of the Baltic Sea.
The influence of the bedrock on the Pudisoo River valley is evident only in the middle course of the river, where, at 13–14 km from the source of the river, the valley has cut into the Ordovician limestone bedrock, which is exposed at the bottom of the channel. The thickness of the surface sediments varies from a few meters on the elevations of the limestone plateau to 60 m on the coastal lowland and in bedrock valleys. Glaciofluvial and glaciolacustrine sediments dominate next to postglacial marine and bog sediments.
Geomorphologically, the river flows on the surface of a glaciofluvial delta or marshy plain in its upper reaches. In the middle course of the river, it flows in a simple channel valley or in a floodplain valley a few meters deep along the glaciolacustrine plain of fine-grained sediments. The lower course of the river is located on the sandy strandplain with seashore-parallel sandy ridges.
The Pudisoo River descends 73 m along its 32 km course to the Baltic Sea. The longitudinal profile of the river (
Figure 3) shows a variable gradient shaped by bedrock outcrops, till ridges, and former coastline features. While the mean gradient is 0.23 m per 100 m, significant variations occur, such as the steeper segments in the upper course (3–4 km from the source) and mid-course (13–16 km), where gradients reach 1.8 m and 1.5 m per 100 m, respectively. The steepest drop, 12.8 m over 1 km, occurs near 25–26 km from the source. In contrast, the final stretch traverses a nearly flat coastal plain.
Figure 3 also presents sinuosity data along the river. The greater the sinuosity of the river channel, the more pronounced the flow velocity variations become, resulting in areas with both finer and coarser riverbed materials in close proximity; thus, even with a relatively low gradient, more sinuous sections of the river may still provide suitable habitats for FPM. Sinuosity was the only analyzed morphometric parameter that showed weak statistically significant correlation with FPM counts (R
2 = 0.26).
Considering the geological–geomorphological characteristics, flow gradient variability, and sediment composition, the Pudisoo River valley can be divided into five distinct sections (
Figure 2). More detailed descriptions of those sections are presented in the
Supplementary Material S1.
3.2. FPM Population Dynamics
There is a clear decreasing trend in the total number of FPM over the monitored period (
Figure 4). The decline has not been constant over time; distinct decades are emphasized by the trend lines of the periods in the
Figure 4. The decline was steeper between 1995 and 2000 and slowed between 2000 and 2018. The number of deceased individuals has also decreased over time; however, its irregular fluctuations suggest that mortality is likely influenced by random factors—such as dry periods, isolated river sections, and harsh winters—rather than indicating a clear trend.
The estimation of the FPM population size for the years 1991 to 1998 was 34,000–36,000 individuals [
18]. The same observer lowered the estimate to 10,000 individuals in 2018, considering the changes occurring during the following twenty years. The assessment was based on expert opinion, considering the high mortality observed during the period as a result of multiple adverse years (e.g., drought summers, water-scarce and cold winters) and unforeseen circumstances (e.g., river meander detachment, increased beaver activity in high-quality-habitat sections). The historical population size, based on expert opinion and primarily informed by local recollections describing distribution and abundance at the end of the 19th and beginning of the 20th century, was estimated at a minimum of 100,000 individuals [
18].
A habitat-wide counting of the FPM individuals in Pudisoo River in 2021–2023 set the population size to 26,000 individuals. Of these, roughly one hundred visible mussels belonged to a younger age group, with sizes under 7 cm. Most of these younger mussels were found in sections IV and V, i.e., from the downstream part of the FPM habitat.
A summary of the available FPM specimen length measurements (
Table 1) reveals a downward trend in the standard deviation of specimen sizes across the monitoring years, indicating a reduction in size variability. This decline likely reflects a deficiency of young specimens and suggests that the Pudisoo River is home to an aging FPM population.
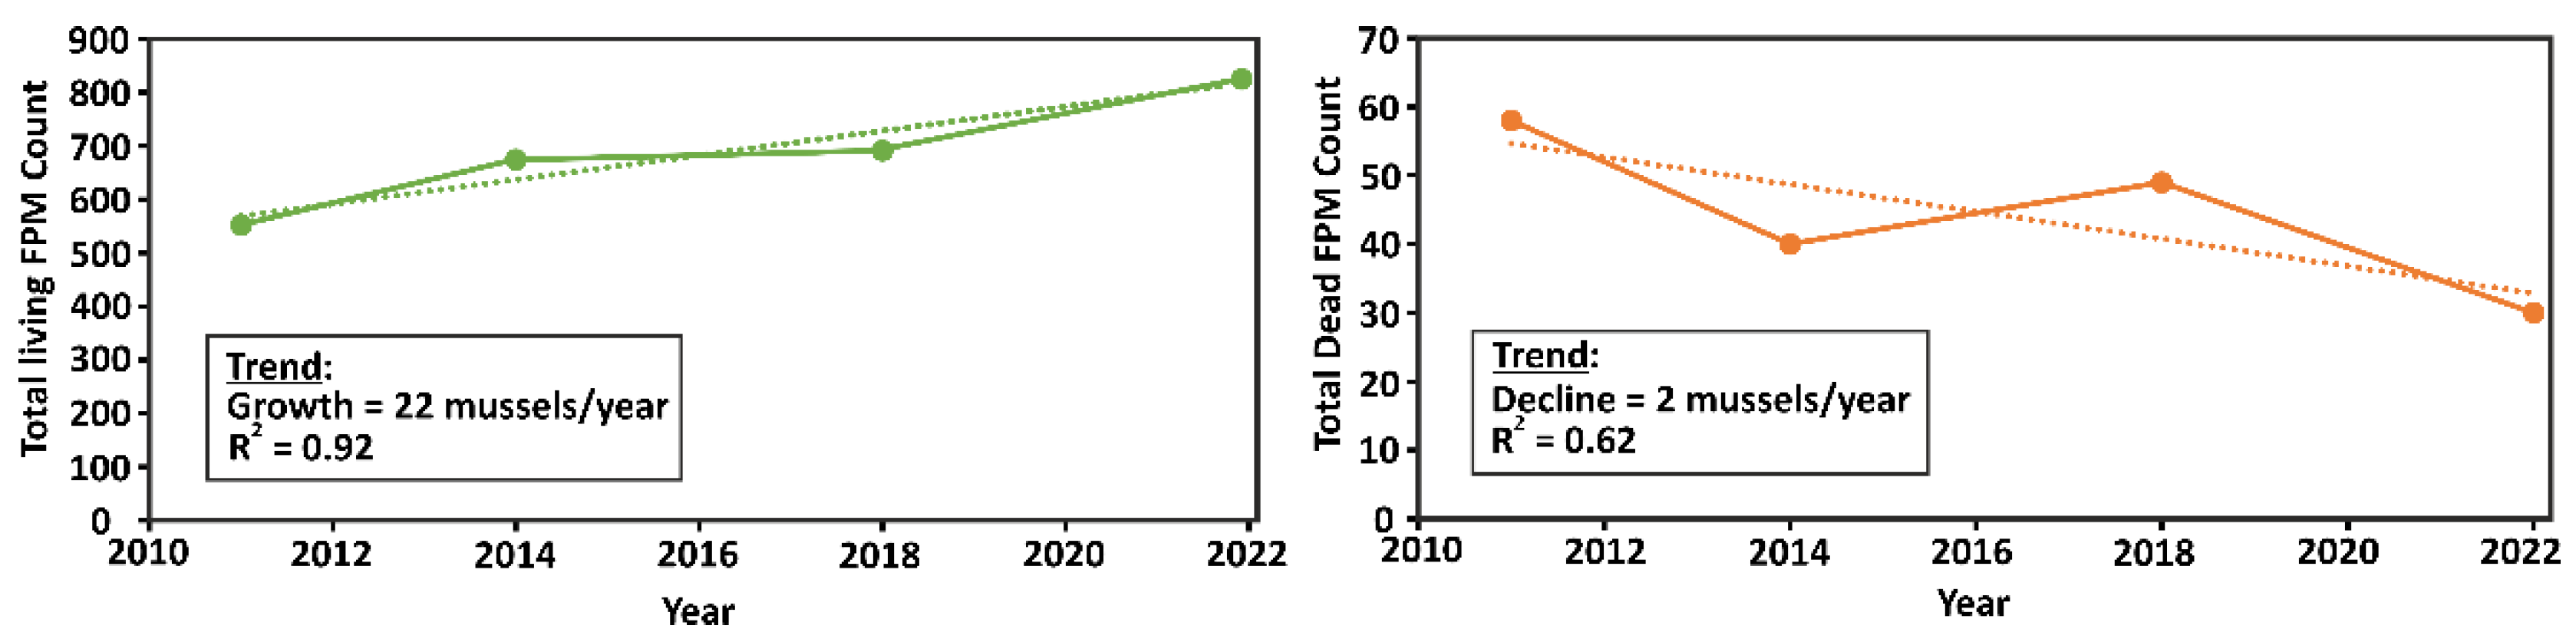
Data from different monitoring programs are challenging to reconcile or compare with data from previous years. An analysis conducted by the 2022 Environmental Agency’s monitoring report indicated that, in contrast to findings from the previous monitoring effort, FPM numbers in the Pudisoo River increased in monitored sections after 2011, with a concurrent decrease in the number of dead individuals (
Figure 5). This trend is inconsistent with the results of the river-wide inventory and the findings from the older monitoring scheme. Such discrepancies may be due to individual mussel movements and/or handheld GPS inaccuracies and, thus, slightly offset monitoring sites. During the 2021–2023 river-wide inventory, only a few dead individuals or empty shells were observed. This observation aligns with both the Environmental Agency’s monitoring and the long-term monitoring results and suggests relative stability in the river’s FPM population since 2000.
Assuming that each part of the river defined as a section in
Figure 2 represents habitat conditions shaped by similar geological or other characteristics, all mussels counted within a given section were grouped together. The results obtained from permanent monitoring sites, when applied to geological sections, indicate a decline over the monitored sites (
Figure 6). All sections (II, III, IV, and V) showed a general decline in FPM counts from 1991 to 2010, with sharper declines observed in certain sections during specific periods. Section II started with the highest counts, peaking in the late 1990s, but then showed a sharp decline beginning around 1999–2000, and continued to decrease to a lower level by 2010. Counts in Section III followed a similar trend to Section II, but with a less pronounced peak and a more gradual decline. Section IV had consistently lower counts than II and III but maintained a somewhat stable trend over the years, with only a slight decline. This relative stability might suggest that conditions in Section IV and V are less susceptible to environmental changes affecting FPM populations, or it could indicate that this area was less densely populated with FPMs initially.
3.3. Host Fish Population Dynamics
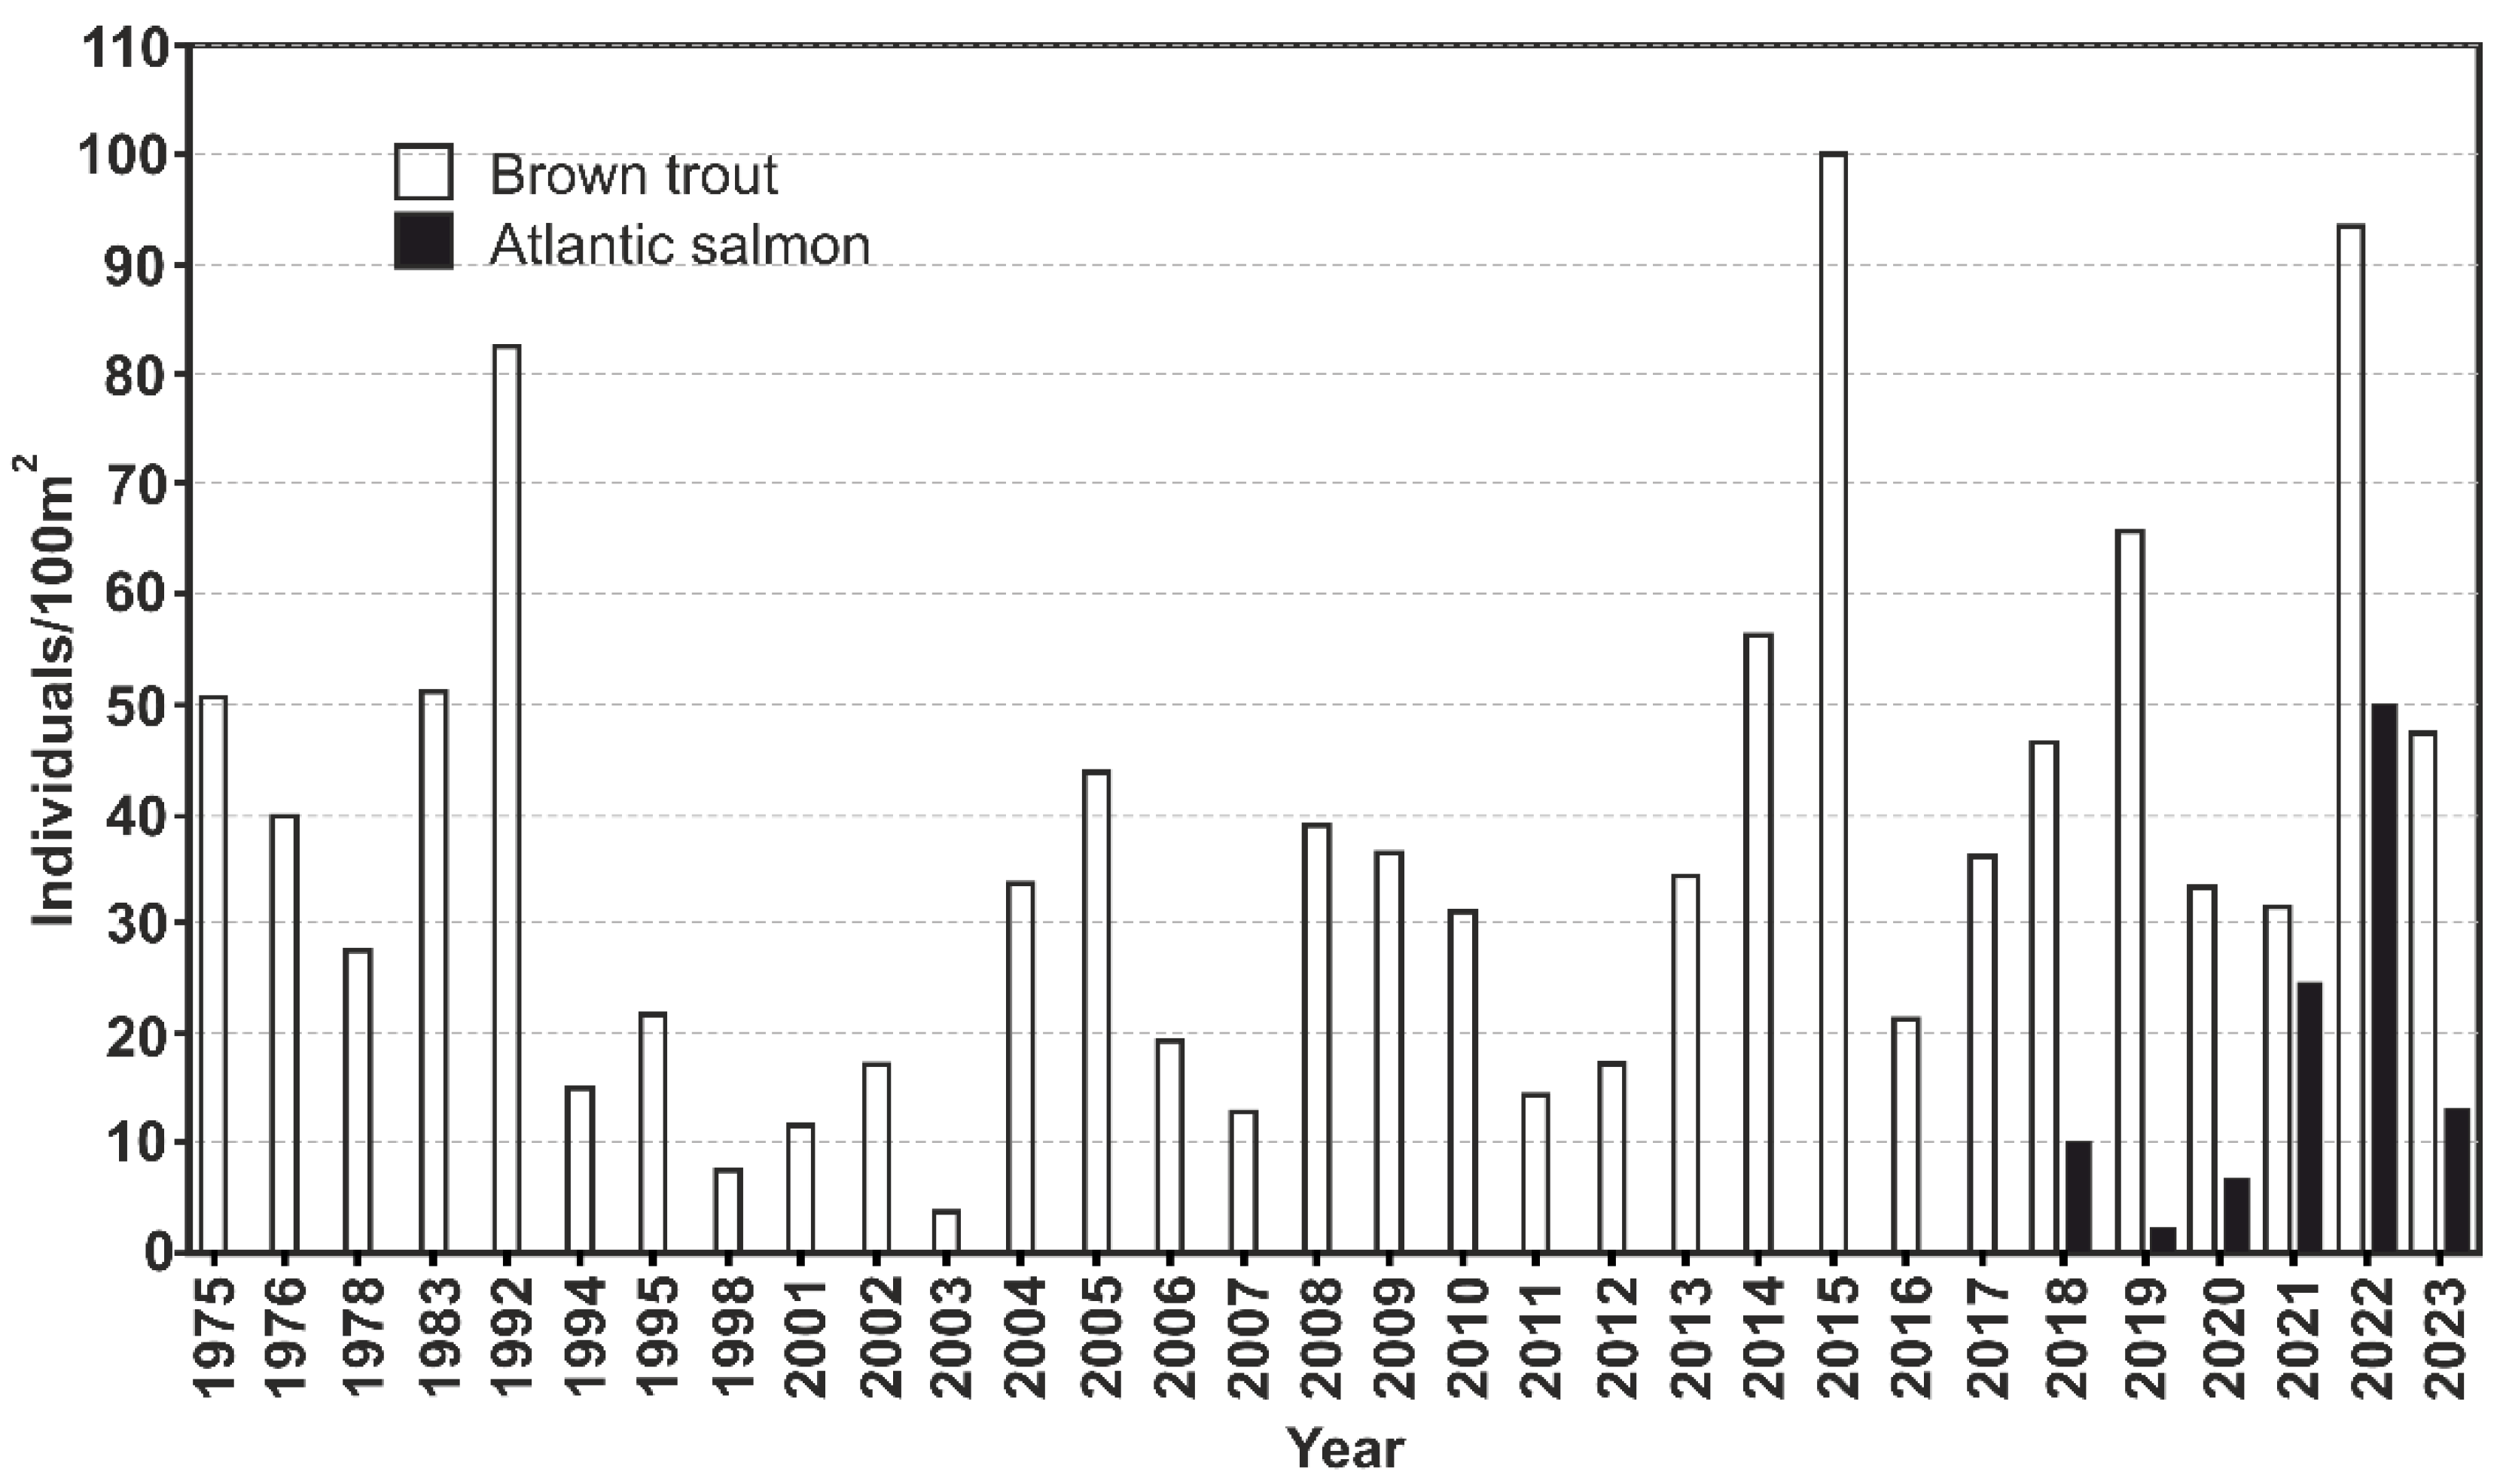
Pudisoo River sustains a fairly large brown trout population that inhabits the entire river system. Both resident and anadromous life history traits are common. The trout parr density in Pudisoo river has varied in a wide range, from almost zero to over 100 individuals per 100 m
2 (
Figure 7). A relatively low abundance during 1994–2007 was noticed, and later on, a gradual increase in parr density occurred. In the years 2003–2017, local trout were reintroduced to the Pudisoo River to increase the number of young fishes in the river as part of the national fish stock recovery program. Historically, Atlantic salmon have not been present in the river. Young-of-the-year salmon parr were found for the first time in 2018. Since then, salmon parr have been regularly found; thus, it seems that the species is in the process of establishing a local population.
In 2015–2016, a study examined the distribution of juvenile trout in the Pudisoo River and the number of FPM glochidia on trout gills. Although the highest densities of 1-year-old juveniles (individuals/100 m2) were observed closer to the river mouth and the lowest densities were observed in the upper reaches, young trout were distributed relatively evenly throughout the river. The infection rate (79%) of FPM larvae among juvenile trout was high, with an average of 460 glochidia per host fish (Environmental Board, unpublished data).
3.4. Juvenile Survival in Bioindication Experiment
The bioindication test results, also analyzed according to river sections (
Figure 2), revealed varying survival rates among juvenile FPMs in different sections of the Pudisoo River. In section V, survival was 760 out of 900 juveniles, equating to 84.4%. In sections IVc and IVa, survival was 789 out of 1050 (75.1%) and 782 out of 998 (74.5%), respectively. Sections IIIb and IIIa showed survival rates of 789 out of 1050 (75.1%) and 658 out of 900 (73.1%). In section II, survival was lowest, with 489 out of 900 juveniles surviving (54.3%).
While survival rates were systematically lower in the upper sections of the river compared to those nearer the mouth, ANOVA analysis yielded a p-value of 0.11, indicating that these differences are not statistically significant. Thus, although survival rate variations were observed, they likely resulted from random variability, potentially compounded by spatial autocorrelation and limited sample sizes, rather than reflecting substantial environmental or locational influences on the physico-chemical composition of the river water.
3.5. Hydrological Analysis
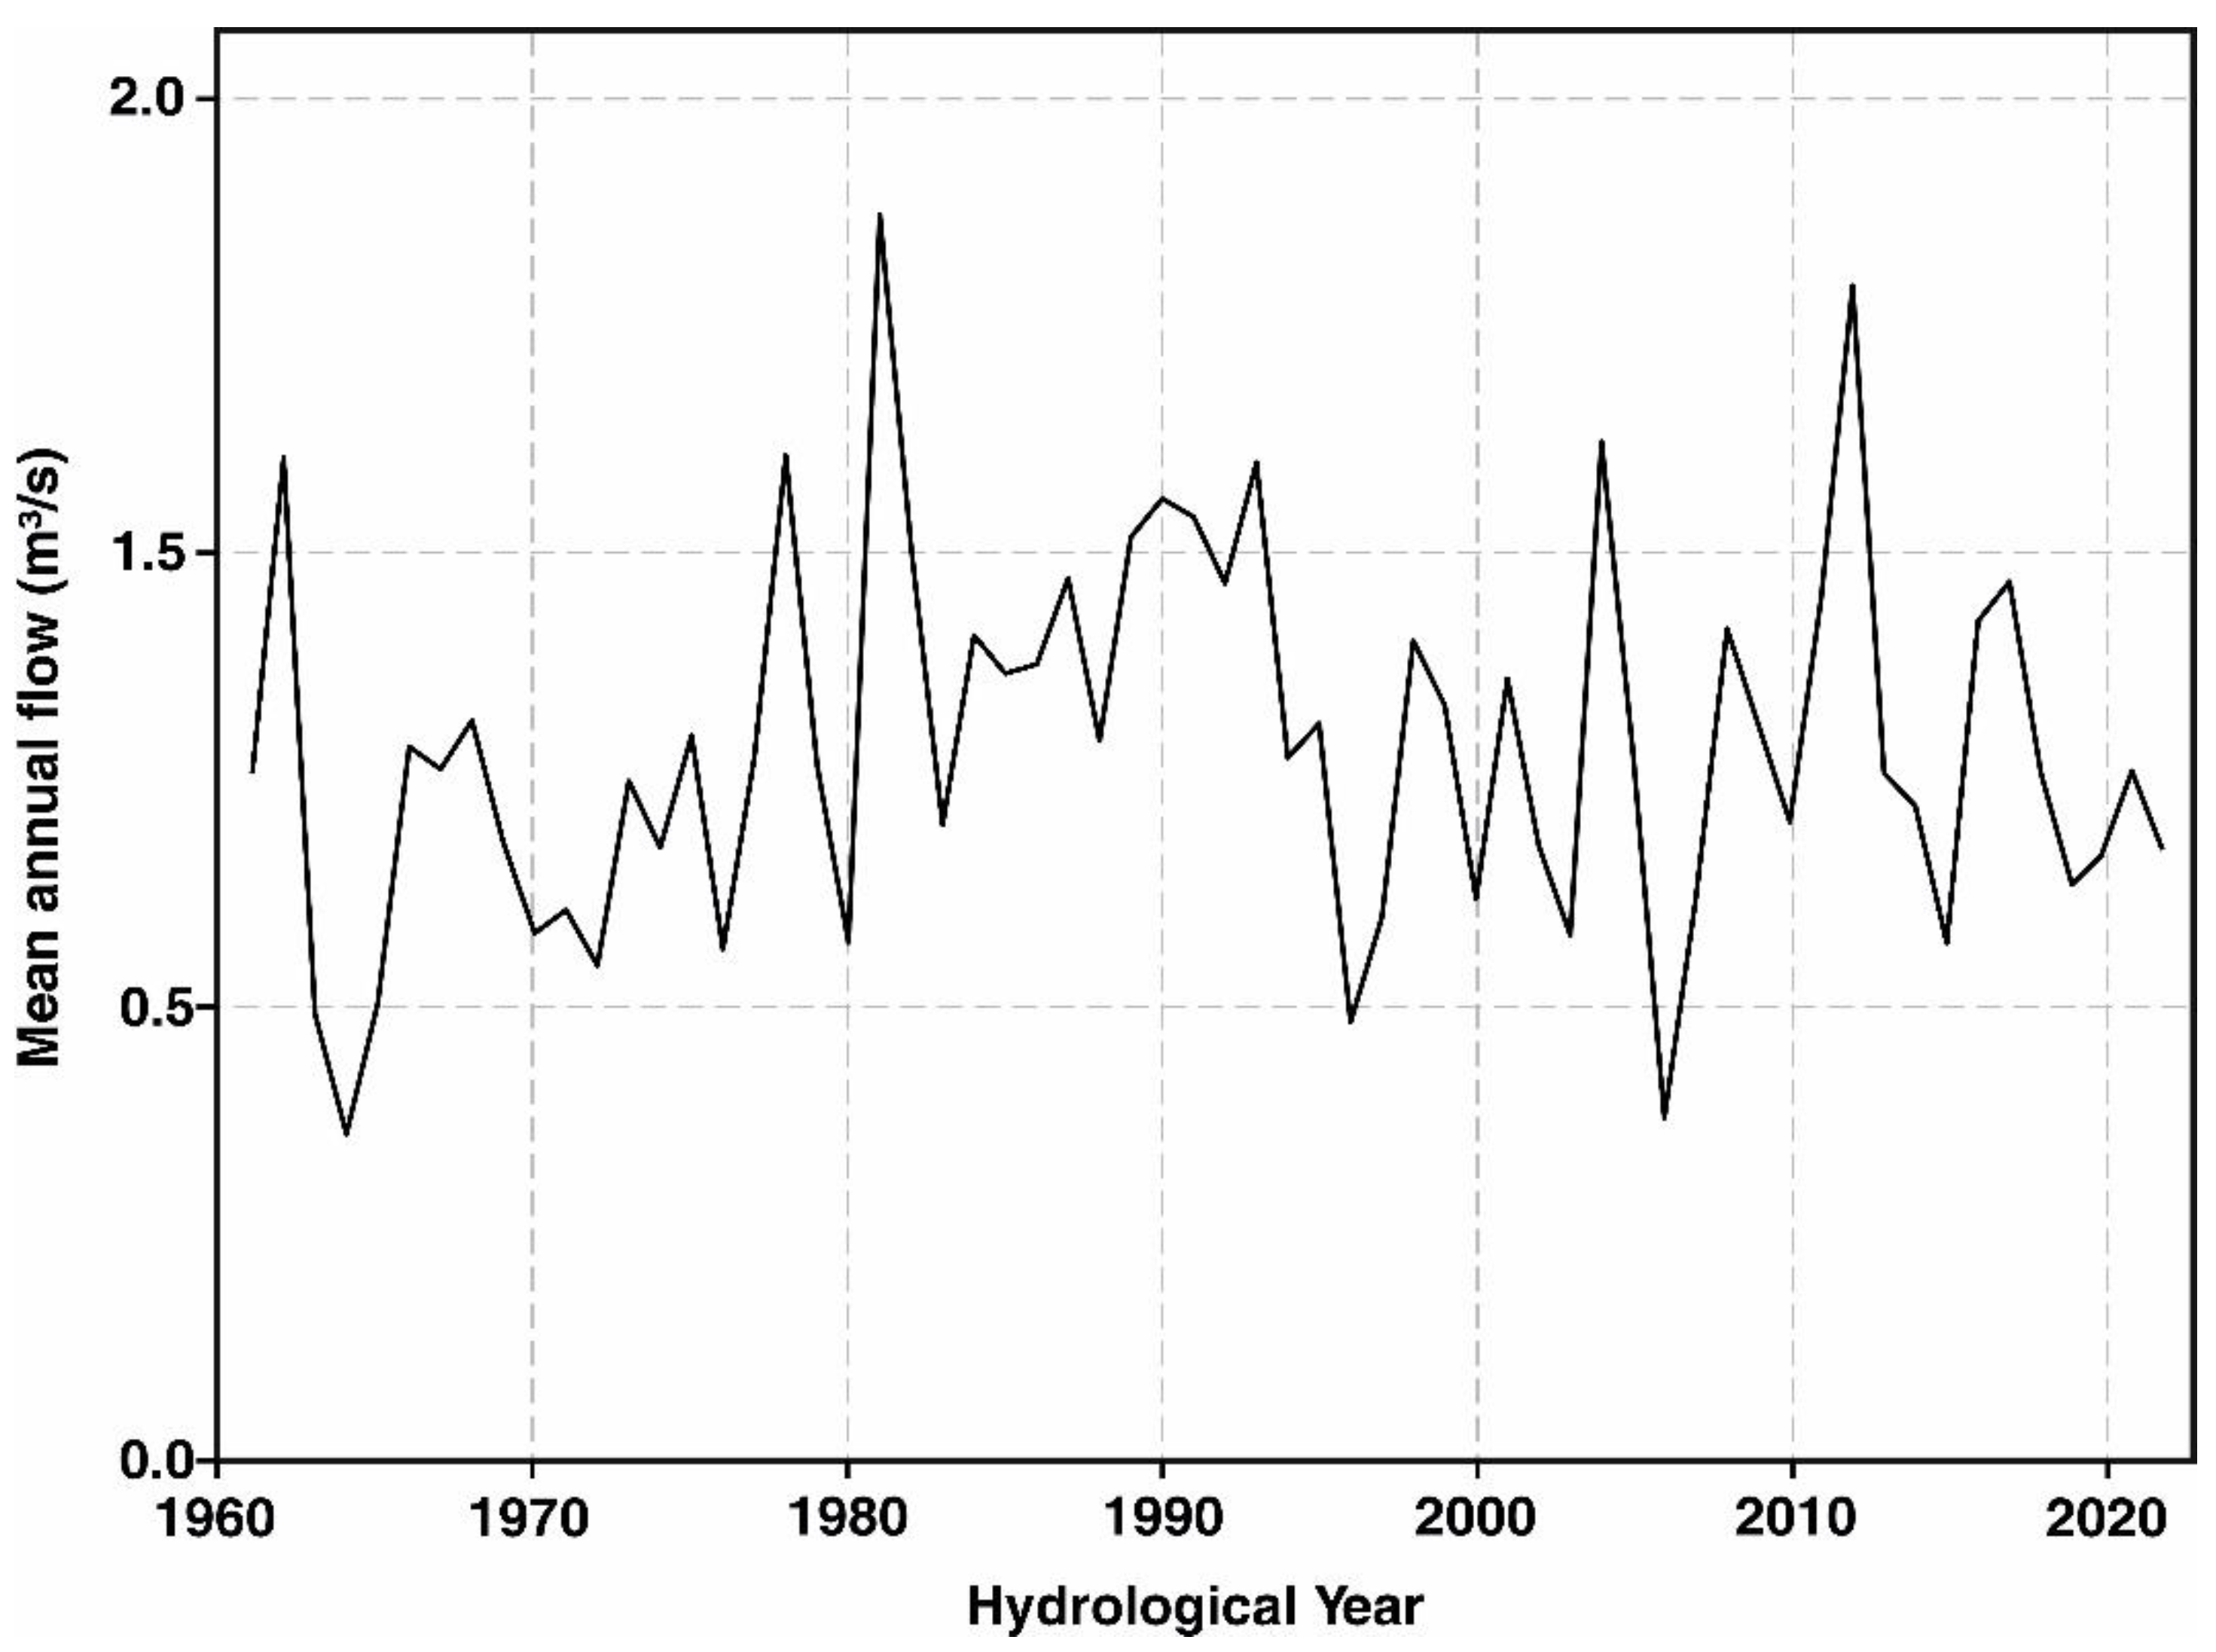
The mean annual flow of the Pudisoo River over the recorded period (1961–2022) was approximately 1.07 m
3/s, with a median value close to 1.08 m
3/s (
Figure 8). The standard deviation of the mean annual flow data is around 0.41 m
3/s, indicating moderate variability around the mean. The year with highest mean annual flow occurred is 1981, reaching mean discharge 1.83 m
3/s, while the lowest mean annual flow was observed in 1964 at 0.47 m
3/s. The mean annual flow time series did not show a statistically significant trend. The catchment area upstream of the monitoring station is 124 km
2, resulting in a mean annual specific discharge of around 8 l/s/km
2.
Most of the observed flow rate changes occurred during the high-flow segment of the discharge time series (
Figure 9). High-flow events are critical because they drive most of the sediment transport, elevating sediments onto the floodplain, provided the connection between the stream channel and the floodplain remains intact. Analysis of the annual maximum flow revealed a significant declining trend, with a change point in 1988 when the maximum annual flow decreased from 7.85 to 5.67 m
3/s. This reduction in peak flow intensities suggests alterations in the hydrological regime, potentially due to climate change, especially snow cover dynamics. The importance of the snow cover is also evident in the shift of the Day of the Annual Maximum time series. The Day of Annual Maximum Flow has progressively shifted earlier by approximately 1.36 days per decade, with an increasing variability in its occurrence over the years.
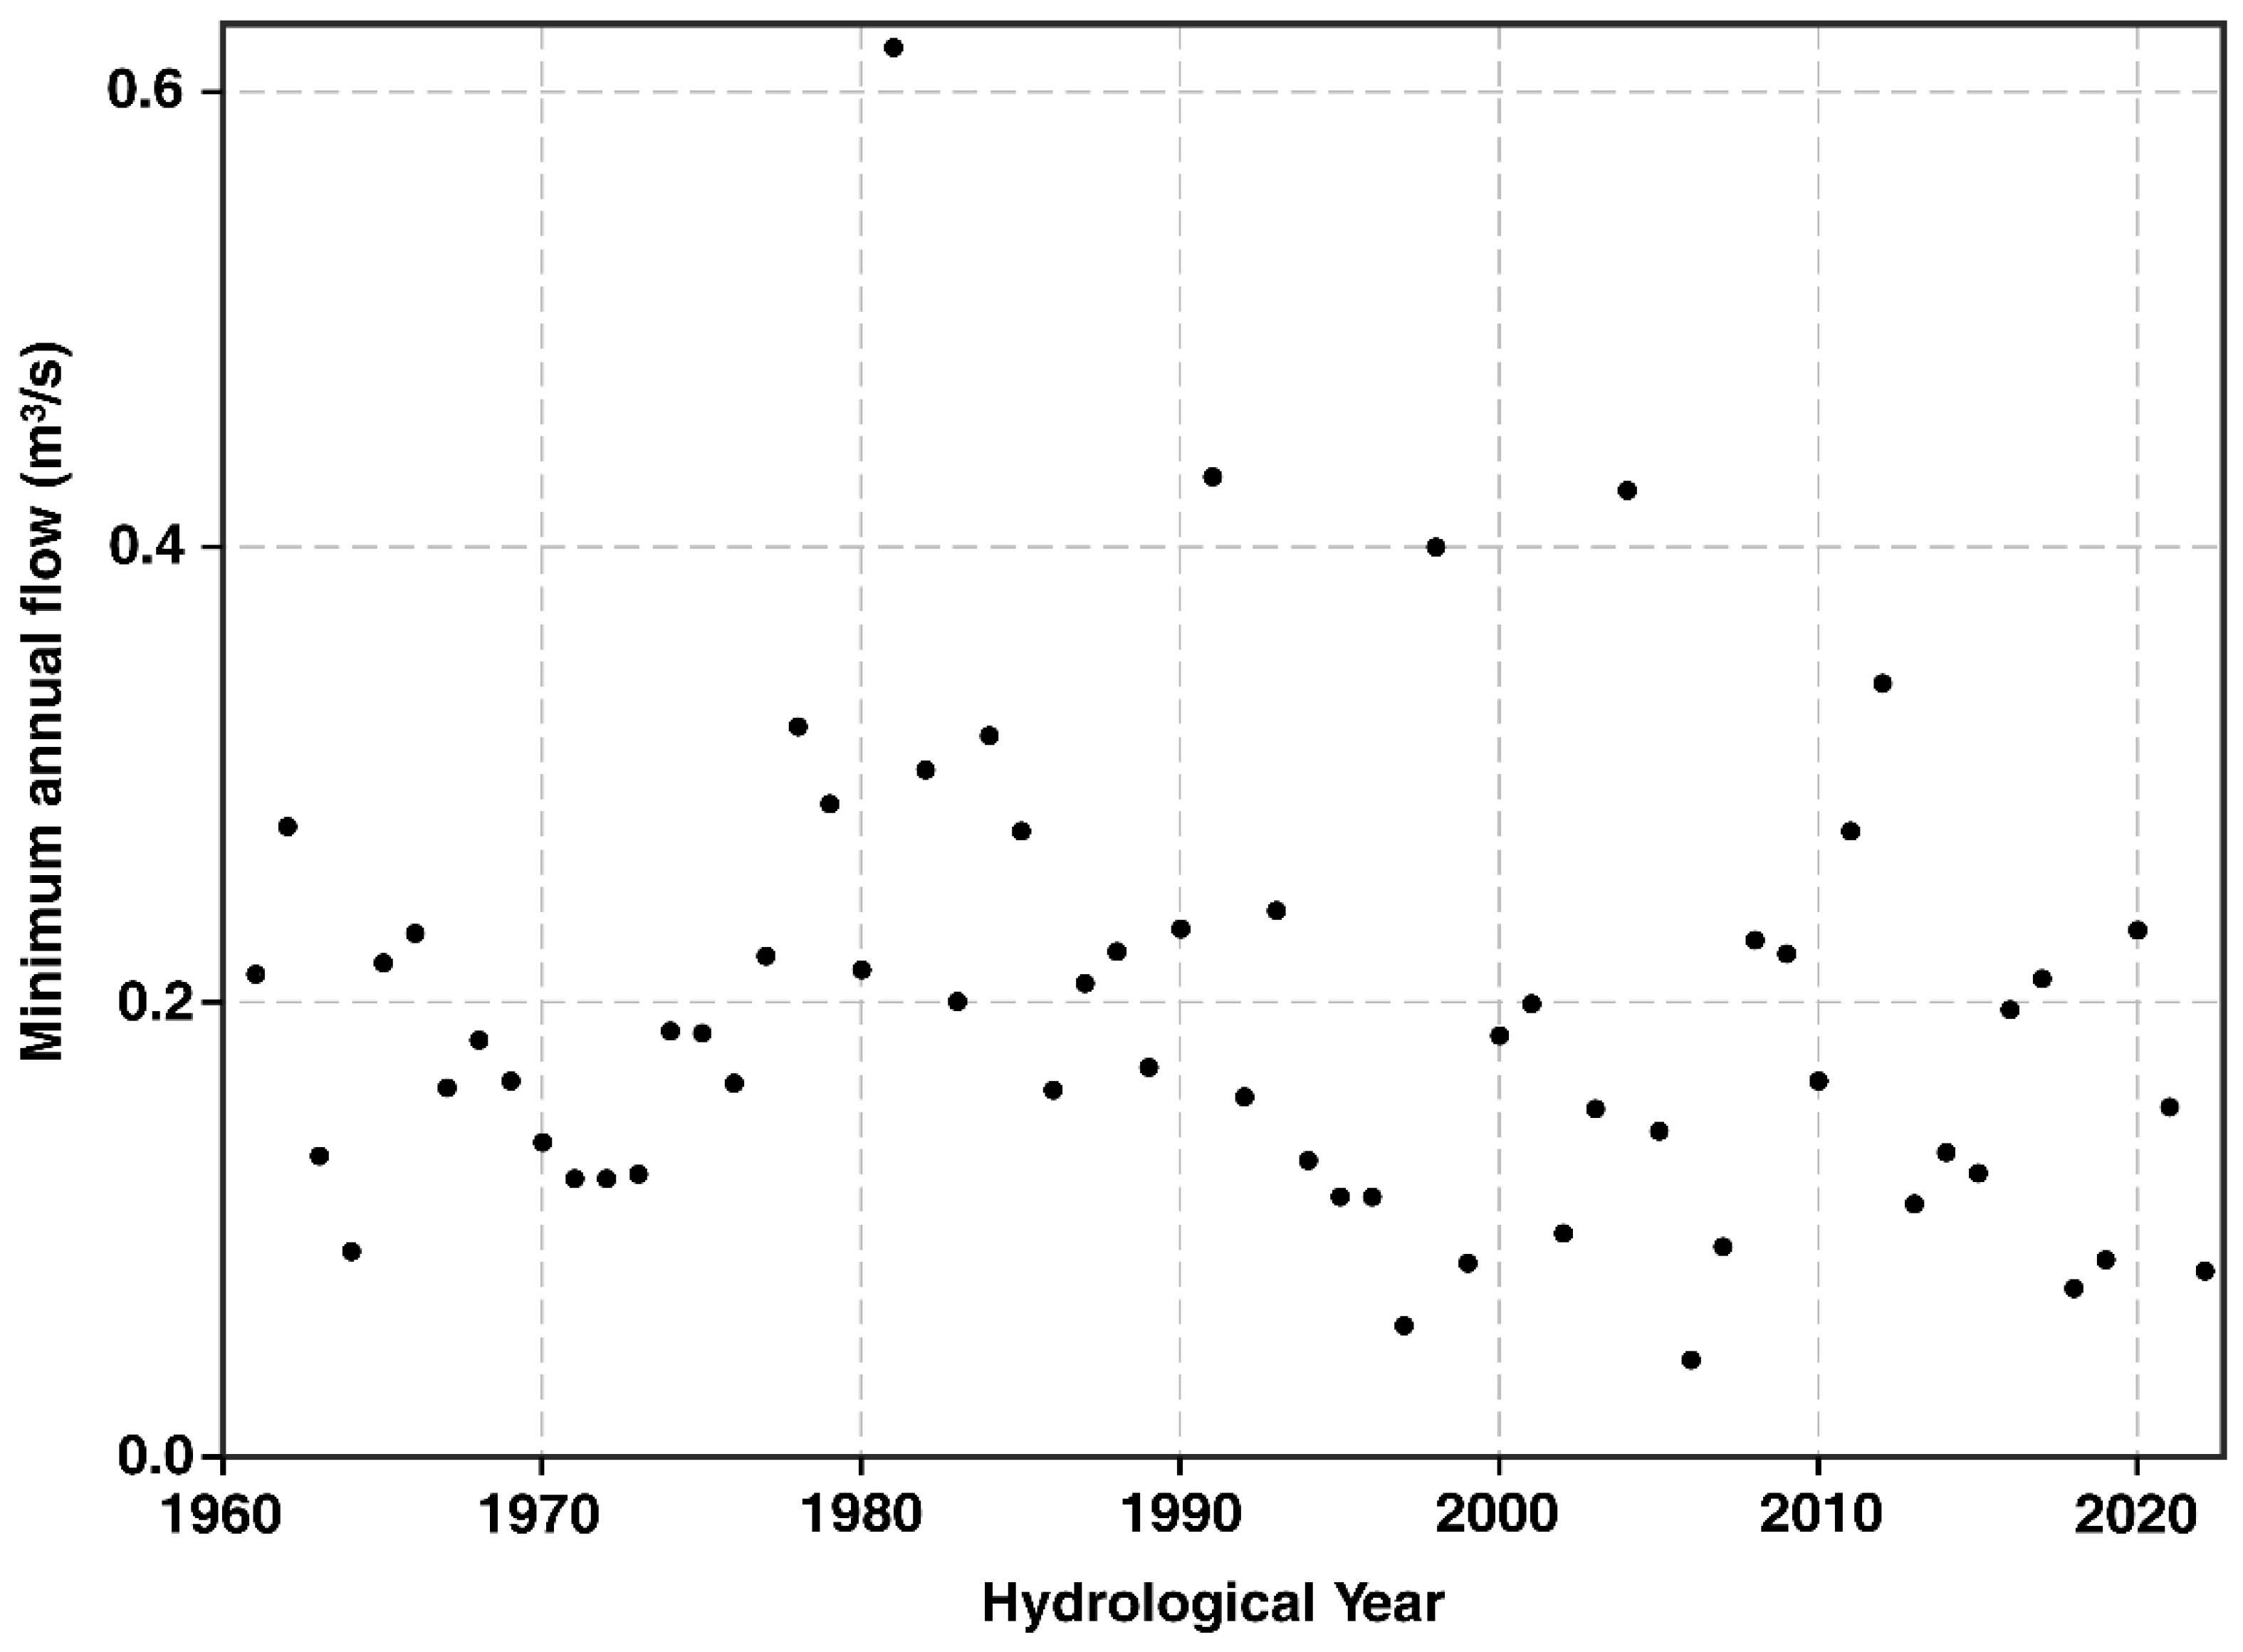
Low-flows and droughts are critical for FPM and all other water-related organisms, as the upper reaches (Section I in
Figure 2) of the Pudisoo stream sometimes completely dry out. The annual minimum flow time series does not show a statistically significant trend, but the variation seems to be increasing since 1990 (
Figure 10).
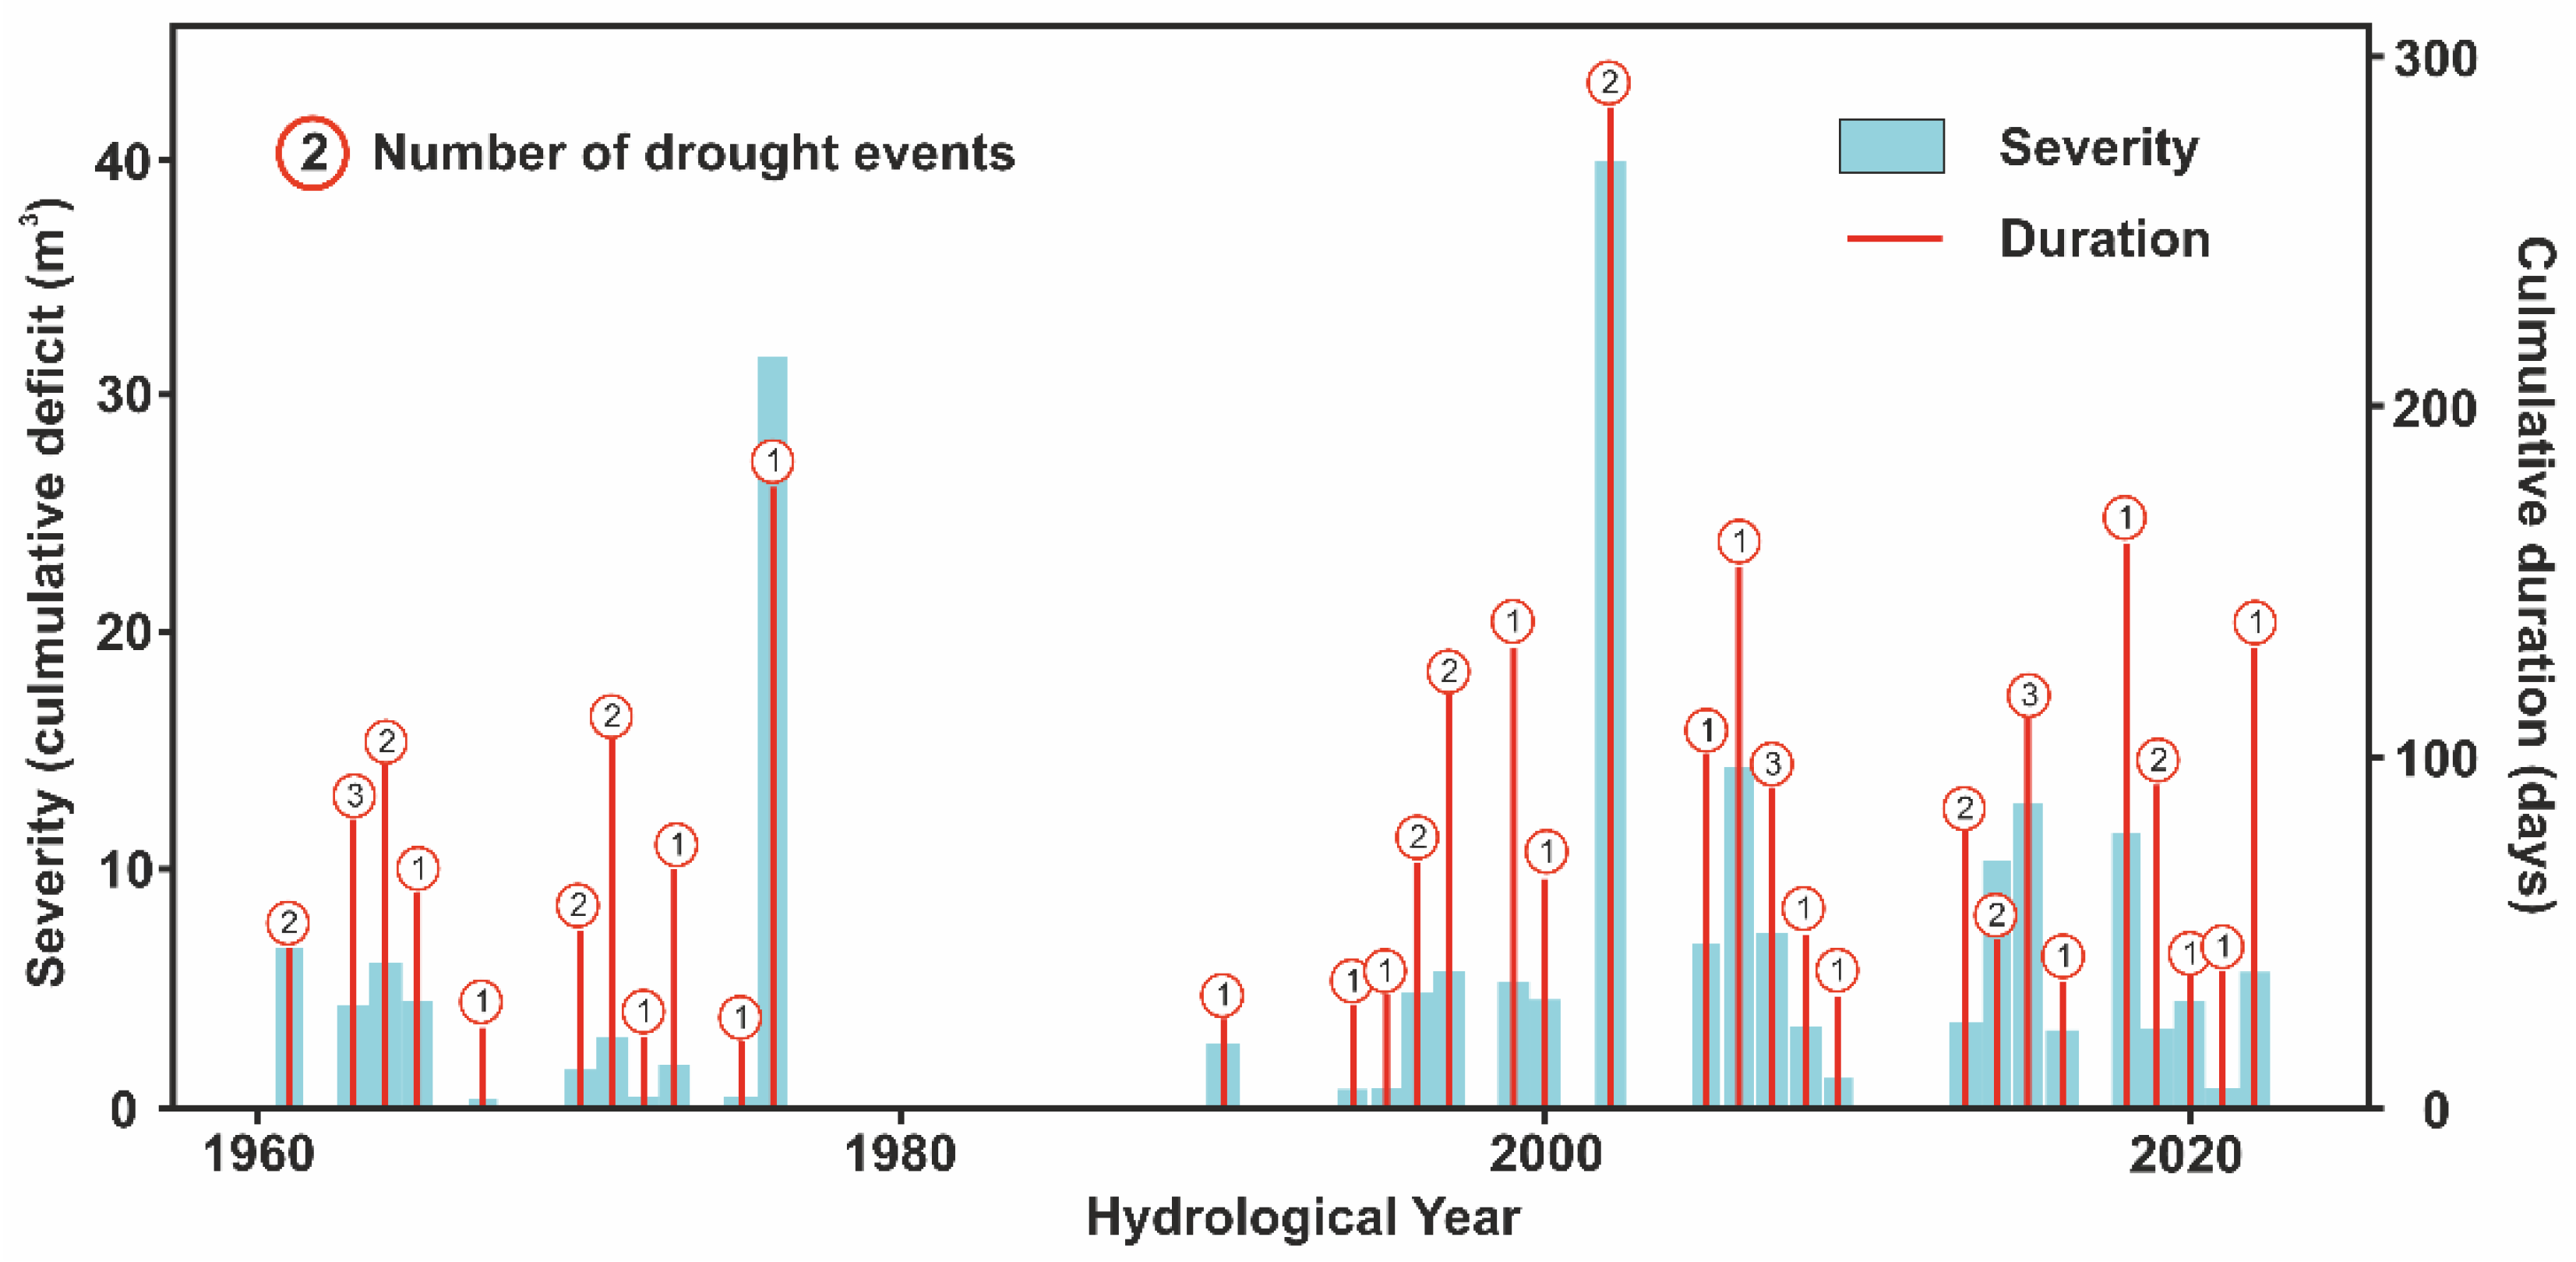
An average drought event in the Pudisoo River typically begins in late June, lasts approximately 54 days, and results in a cumulative deficit in discharge of about 4.3 m
3 (
Figure 11). Drought events present an interesting pattern, as the 15-year interval from 1975 to 1990 did not have a single drought event. Before 1975, droughts tended to be shorter (by 11.5 days) and less severe (by 0.3 m
3 deficit) compared to the post-1990 period.
The longest single drought event in the Pudisoo River occurred in 2022, and it lasted for 214 days. The year 1976 had the most severe single drought event, lasting for 177 days and resulting in a cumulative deficit of 31.7 m3/s. The most severe cumulative drought occurred in 2002, with a cumulative deficit of 39.9 m3 of water over 286 drought days, and it was divided between two separate events.
3.6. Land Use Analysis
The analysis of land use changes within the Pudisoo River catchment area reveals several trends over the past century. The results are presented in
Figure 12 and
Table 2 and described below.
Increasing forest cover: Forest cover has shown an increase, starting from a relatively high baseline of around 50% in 1935. By 2023, it had risen to around 72%. This increase is largely attributed to the decrease in agricultural fields and open wetlands. The disappearance of small households and the overgrowth of related fields with forest, along with the drainage of formerly open wetlands, have mostly contributed to this trend.
Decreasing agricultural land: Agriculturally used “dry” land has decreased by 5 percentage points since 1935. Most of these lands are now overgrown by forest. It seems that the first to disappear were the smaller plots related to single households, whereas the centers of villages and larger fields retained agricultural use throughout the study period. Notably, most of the 2023 agricultural lands (64%) are within 100 m of a watercourse or drainage system, compared to only 16% in 1935.
Decreasing open wetlands: There was a notable decrease (around 66%) in open wetlands between 1935 and 1988 due to systematic drainage that was common for that period in Estonia [
27]. This decrease was pronounced adjacent to former natural watercourses that were deepened and straightened, leading to the loss of former floodplains and fens that were kept open by haymaking. Such areas have relatively thin peat layers (if any), making them relatively easy to drain. Bogs with much thicker peat layers were spared from common agricultural or forestry drainage, but two peat mining areas, totaling 135 hectares, operated in the Viru and Hara bogs from 1960–1994. These two former peat mining areas were restored to wetlands in 2013.
Development of the drainage systems: Systematic drainage, primarily during the Soviet era (1940–1991), is evident from the map analysis but directly affects a relatively small part of the catchment (around 9%). Both surface drainage through forestry ditches and mainly below-ground drainage for agriculture were used. However, many pre-1940 ditches are likely not present in the 1:50,000 maps, as these were smaller and did not contribute much to a systematic drainage network at the landscape scale. Despite relatively small coverage, the development of drainage networks also led to the straightening and deepening of formerly meandering and shallow natural watercourses, including the main Pudisoo River channel. Straightened sections are marked in the S1.
Watercourses: The upper reaches of the Pudisoo River were partly modified even before 1935, especially sections traversing wet grasslands, but most of the river and stream channel network were in a (semi)-natural condition. Approximately 108 km of watercourses were present on the 1935 map. This number increased approximately threefold by 1988 and has remained essentially at that level since. While artificial channels comprised less than half of the total watercourses in 1935, their share rose to 86% by 1988. Natural channels were deepened and straightened, resulting in the loss of connection with surrounding floodplains, which have now mostly transformed into forests. Due to the densified watercourse network, more than three times the area of the Pudisoo River catchment (38%) was within 100 m of the nearest watercourse in 2023 compared to 1935 (14%).
The uncertainty of the land use division is around 10–15% of the area, mainly due to different mapping schemes rather than bad segmenting and misclassification.
4. Discussion
Results from FPM population monitoring periods reveal that, even when using fundamentally similar methodologies, outcomes vary due to the selection of monitored transects; differences in hydrological conditions; and factors such as observer experience, technical equipment, physical conditions, etc. Mussel monitoring is both time-consuming and costly. According to the CEN guideline authors [
28], the primary motivation for developing the CEN standard was the absence of a unified and standardized approach despite decades of monitoring tradition, a problem that has been brought up by several other authors [
28,
29]. The longevity of FPMs, often exceeding a century, makes their population trends difficult to discern over shorter timescales, especially given their slow recruitment rates [
4]. Our study also highlights a clear discrepancy between different monitoring schemes and emphasizes various factors affecting the monitoring results and the repeatability of the process. Flooding events, sedimentation, or habitat changes can displace mussels, complicating repeat surveys, and are especially problematic in the case of smaller plots or transects. This is supported by Österling et al. (2008) and Scheder et al. (2015), who describe how sediment dynamics and habitat quality directly affect survey accuracy and population stability [
30,
31].
The freshwater pearl mussel was once common in the Pudisoo River and survived even pearl fishing for several centuries. Presently, the population is mainly represented by over-60-year-old individuals, and the total number appears to be declining. A similar situation is also described in rivers across Europe, such as in Northern Ireland, where populations are composed of aged individuals with limited recruitment due to juvenile mortality linked to sedimentation and habitat degradation [
32], as well as in Austrian rivers [
31]. While the population has been followed in the relatively small Pudisoo River for over 30 years, estimating historical population size of the species, even from just three decades ago, remains challenging.
A river-wide census of the FPM was conducted in 2021–2023 by snorkeling, which provided an absolute number of individuals. The data of both methods indicate that despite decreasing trends, the last decades (after the turn of the millennium) show relative stability in the numbers, especially while looking at the lower half of the river and FPM habitat. This population stabilization in the lower half of the river could be linked to relatively undisturbed hydrological or sedimentary conditions since 2000. Research by Scheder et al. (2015) and Denic and Geist (2015) suggested that reduced siltation and better substrate quality in microhabitats can support older mussels, even when recruitment is limited [
31,
33].
Intensifying land use, especially agriculture, is often pointed out as a potential reason for the FPM population’s decline because of increased erosion and subsequent substrate siltation [
7,
32], nutrient [
31], and agrochemical pollution [
4,
30,
34]. It is plausible that the river experienced higher levels of pollution during the Soviet era (1940–1991) due to the broad and often indiscriminate use of pesticides and fertilizers in agriculture during that period. These pollutants may have adversely affected the survival of juvenile mussels, contributing to the ageing of the mussel population, as observed in other regions impacted by intensive agricultural practices [
34].
However, monitoring of the host fish population, which began in 1975, shows relatively stable brown trout stocks up to 2023. Additionally, the recent arrival of Atlantic salmon suggests that the former and current water quality, from a pollutant standpoint, is habitable for FPMs. This conclusion is further supported by a bioindication experiment conducted by the authors, in which juvenile FPM survival rates exceeded 80% in the best river sections.
Agricultural and forestry practices often contain artificial drainage systems in hemiboreal regions like Estonia. Our land use analysis indicates a decline in intensively managed agricultural lands in the Pudisoo River catchment—the former field area has declined by approx. 20% since 1935 and has been turned into drained forests. The drainage systems developed between 1960 and 1993 are still operational. Forestry drainage, unlike agricultural drainage, does not introduce agrochemicals into water courses; however, it is a significant source of fine-grained sediments and peat particles, particularly when draining mires [
35]. In the Pudisoo catchment, additional peat input was likely due to two peat mining sites that operated until 1985 and 1994. This sediment loading can negatively affect water quality and aquatic ecosystems, as fine sediments can smother aquatic habitats, and the release of peat particles may lead to increased organic matter and associated anoxia in the substrate in downstream river section. Both processes affect juvenile FPMs especially negatively [
36,
37].
Drained, managed forests are associated with clear cuts that may negatively affect nearby FPM habitats [
38], but in our case, most of the forest has been protected since the establishment of the Lahemaa National Park 1971 and is, therefore, relatively mildly managed. The habitat condition should improve from the catchment land use perspective, but this is countered by hydrological changes detected by our analysis. Drainage system closures and wider non-logging zones around the river channel are potential realistic methods that would improve the catchment from an FPM habitat quality perspective. The need for a catchment-wide restoration approach is also emphasized by several other studies [
31,
32,
39], but is challenging, mostly due to the conflicting interests of the affected stakeholders [
40]. The Pudisoo River FPM habitat condition is nevertheless improving from a land use perspective, mainly due to socio-economic reasons, but this improvement is encountered by the hydrological changes detected in our analysis.
Lowering of the river peak flow volumes progressively disconnects the river channel from the floodplains and leaves the silt in the channel, clogging the substrate [
9,
39]. This phenomenon is described over all of Estonia and is associated with climate change, namely snow dynamics [
41]. Amid the changing climate, drought periods have become more frequent and severe. Extended drought periods also threaten mussels by lowering river water levels to uninhabitable limits in the upper reaches of the river, a concern that has been risen elsewhere in the Europe [
32,
37]. Drought time series (see
Figure 10) explain the steep declines in the FPM numbers at the upper river sections (II and III) during 1995–2005 quite well, as this period contained largest cumulative drought event in 2002 as well as multiple smaller events.
The Pudisoo River flows through the area where fine sands naturally prevail. Decreased transport options to the floodplains due to decreased peak flows, and at least temporarily increased inflow due to drainage systems leads to more fine-grained sediment in the channel, but not everywhere. Expectedly, steeper river sections where flow velocity is higher are more favorable habitats for FPM, since the riverbed sediments are coarser. The sloping of Pudisoo River is rather uniformly low, but there are three relatively short river sections with higher gradients. With the exception of a steep section in the upper course of the Pudisoo River where flow rates are low and the river dries out during droughts, FPMs are more abundant near the rapids (right before and after the rapids) in the middle and lower courses of the river. However, FPMs are also present in low-gradient sections that appear to have a local source of coarser material (e.g., near Tagavälja coastal spit) or in meandering (high sinuosity) sections (see
Figure 3). The flow velocity varies within the meandering river channel, being higher near the concave bank and lower in the convex bank, which, together with turbulence [
42], enables the redistribution of sediments within the channel according to grain size and creates suitable microhabitat conditions for FPMs [
8]. Various “in channel” modifications can mimic, reinitiate, or enhance meandering processes, namely flow diverters, large stones, deadwood, partial channel blockages, etc. [
8,
31,
39]. Stabilizing riverbanks with tree roots, particularly alder (
Alnus glutinosa) in the Estonian context, could also provide multiple ecological benefits. Allowing natural regeneration or planting trees would not only stabilize banks but also create shade, which helps to reduce water temperature, a critical factor for salmonids, as they prefer colder water [
43]. Cooler temperatures also enhance the absolute oxygen content in water, benefiting not only salmonids but also FPMs [
4,
28]. Additionally, riparian vegetation promotes organic matter cycling and contributes to sediment retention, further improving habitat conditions [
8,
39].
The current situation in Pudisoo River indicates that lower sections of the riverbed are habitable for freshwater pearl mussels. There are enough host fish, their stocks are recovering, and juvenile mussels are found on the riverbed. The intensity of human impacts over the past century has affected the FPM population; however, the situation is slowly improving, or at least stable. Future challenges lie in maintaining and possibly improving the living conditions for the species to ensure their continued existence in the Pudisoo River.
Population monitoring identified 6–7 locations within the river where mussel concentrations are notably higher. These sections are characterized by coarser substrates within otherwise sandy–silty riverbeds. Specifically, two sections feature higher river gradients, and three sections are associated with areas where the river channel cuts through coarse materials, including Quaternary sediments such as glacial till and coastal spit deposits. The FPM population exhibits a positive, albeit weak, correlation with river sinuosity. This is likely caused by varying flow velocities within a meandering river, which create diverse sediment compositions ranging from coarse to fine. These varied conditions likely contribute to the heterogeneous habitats that support the FPM population.
While the Pudisoo River FPM population seems to be stable currently, the conditions may change very quickly and suddenly in the midst of the changing climate and possible future human interference and make the river inhabitable for the mussels. Continued monitoring, further studies, and targeted conservation efforts are crucial, as this ecosystem is still very fragile. This study highlights the importance of habitat diversity and specific riverbed conditions in supporting the remaining FPM population.


 ,
, 


