Abstract
Extreme droughts caused by current climate changes affect the diversity, composition and function of fish communities in lake ecosystems. Poyang Lake is the largest freshwater lake in China, and it is home to many important avian, fish and aquatic mammals. In 2022, Poyang Lake experienced one of the most severe droughts in recorded history. Understanding how fish communities responded to this event can offer key knowledge in developing strategies for coping with future climatic extremes, particularly given that the local government has been actively posting several middle- to long-term policies on managing the fish diversity of Poyang Lake, including fishery resource supplements and the well-known “ten-year fishing ban”. To understand how the fish diversity of Poyang Lake has been altered by climate change and human interventions, here, we analyzed the α- and β-taxonomic diversity (TD) and functional diversity (FD) of fish species using environmental DNA (eDNA), and we compared the fish diversity and community changes before and after the 2022 drought. In total, 77 native fish species and 4 invasive species were detected. The species richness and Shannon–Wiener index decreased significantly, and Simpson’s index had no significant difference post-drought. Rao’s Quadratic Entropy (Rao’sQE) index increased significantly, and the Functional Evenness (FEve) index decreased significantly. The differences in α- and β-TD and FD in the north part and south part of Poyang Lake also reflect the impact of drought. When calculating biodiversity contribution rates of the different species, we found that small-sized species were dominant pre-drought, while medium- and large-sized species were predominant post-drought. These patterns indicate that the fish community of Poyang Lake is undergoing a reestablishing process after the extreme drought. This fish community reestablishment post-drought does not correspond to the natural process of community recovery; instead, it is the result of human intervention while being affected by drought brought about by climate change.
Keywords:
taxonomic diversity; functional diversity; extreme drought; fishing ban; Poyang Lake; eDNA 1. Introduction
Global warming is recognized as threatening the function of natural ecosystems, especially when freshwater is subject to accumulated anthropogenic influences (such as water pollution, dams, etc.) [1]. Freshwater ecosystems are particularly vulnerable to global climate changes compared to terrestrial ecosystems since they are more isolated and geographically fragmented [2], normally resulting in a decline in aquatic biodiversity [3,4] among other consequences, which, in turn, will affect the structure and function of the ecosystems and ultimately human society [5].
Lakes hold about 90% of the freshwater surface on the Earth and are an important part of the aquatic ecosystem, supplying key habitats for aquatic biodiversity [6,7]. China harbors numerous lakes with different sizes and types, and the number of lakes with an area greater than 1 km2 is 2693, which are located in the 28 provinces, covering a total area of 81,414.6 km2 and accounting for nearly 0.9% of total national land areas [8]. Poyang Lake, the largest freshwater lake of China, is located at the middle of the Yangtze River basin. It was added to the “List of Ramsar wetlands of international importance” in 1992, and is also a national natural reserve in China. As an internationally significant wetland ecosystem, Poyang Lake provides a habitat for many Chinese rare and endangered aquatic mammals and birds [9,10]. For example, it is a major distribution area for the Yangtze finless porpoise (Neophocaena asiaeorientalis), which is the world’s only freshwater finless porpoise species and a first-class national key protected wildlife species in China, along with over 300 avian species and more than 130 fish species, including 14 species listed as first-class national key protected wildlife and 42 species listed as second-class national key protected wildlife [11]. Meanwhile, Poyang Lake is also an important wintering ground for waterfowl in China, especially for a large number of rare and endangered birds such as the white stork (Ciconia ciconia), Oriental stork (Ciconia boyciana), black stork (Ciconia nigra), swan goose (Anser cygnoides), greater white-fronted goose (Anser albifrons), great bustard (Otis tarda), tundra swan (Cygnus columbianus) and Eurasian Spoonbill (Platalea leucorodia) [12,13].
Global warming has caused climate anomalies in many places in the past decade [14,15]. In southeast China, an extreme drought occurred in the Yangtze River basin covering Poyang Lake in 2022. According to records of the Xingzi hydrographic station, at 4:00 a.m. on 19 August 2022, the water level of Poyang Lake retreated to 9.99 m, the lowest water level of the summer season since records started in 1951. This extreme drought would lead to a series of impacts on aquatic biodiversity and particularly fish diversity.
Against the background of global climate change, Poyang Lake has shown a tendency to transfer from water grass-dominated to algae-dominated vegetation, and its fish diversity, ultimately fed on the vegetation, has also changed accordingly [16]. Fishes are also the main food resources for finless porpoises and waterbirds [17,18]. Fish, as an important component of aquatic ecosystems and a core biological group in the food chain, can connect different trophic levels. The change in fish diversity will therefore directly affect the quantity and structure of terrestrial and other aquatic organisms within and around the lake. Investigations into the fish communities are thus fundamental for understanding the broad ecosystem variations. To potentially protect the fish diversity in Poyang Lake and its surrounding areas, the Chinese government has imposed a 10-year ban on fishing in areas of the lower Yangtze River basin, covering Poyang Lake, from 1 January 2021. Therefore, environmental DNA (eDNA), as a mature and non-invasive monitoring technique, was used for detecting fish diversity in this study.
2. Methods
2.1. Study Sites and Sampling
Poyang Lake is located in the middle Yangtze River, covering an area of 4070 square kilometers with a ~1200 km shoreline. The lake is divided into two parts, north and south, with Songmenshan Island as the geographical boundary [19]. The north part is long and narrow, forms a water passage 40 km long and 3 to 5 km wide connected to the main Yangtze River, and the water level substantially changes between the wet and dry seasons. The south part is the main lake body, a maximum of 133 km long and 74 km wide, which can maintain relatively deep water in the dry season. The water level of the lake is higher than that of the Yangtze River, and the lake drains north into the river.
Water samples were collected from different locations in Poyang Lake (116.03–116.44 E, 28.80–29.75 N) during 29–31 July 2019, 9–14 April and 25–30 June 2023. The two sampling time periods were chosen, respectively, before and after the extreme drought event at Poyang Lake. The sampling sites were chosen within the typical channel habitat in the north part, and the lake habitat is in the south part. Sampling sites were set up following certain lines every five kilometers, and the interval between each adjacent sampling site is ~1 km (Figure 1). A total of 266 samples were collected from 66 sites. Water samples were collected following established protocols [20]. Three replicated samples (each containing 500 mL or 1 L water, 500 mL water was chosen if the sample was overly turbid) were collected from the surface water (0–1 m) from the 66 sampling sites. Disposable latex gloves and medical facial masks were worn during sampling and replaced between each sampling site, to minimize potential contamination. The centrifuge tubes for holding filter membranes were kept in a portable refrigerator at −10 °C in the field and during transport to the laboratory and then preserved at −20 °C in the laboratory. Regular environmental indicators of each sampling site, including water temperature (Temp), potential of hydrogen (pH), dissolved oxygen (DO), oxidation reduction potential (ORP) and electrical conductivity (EC), were measured.
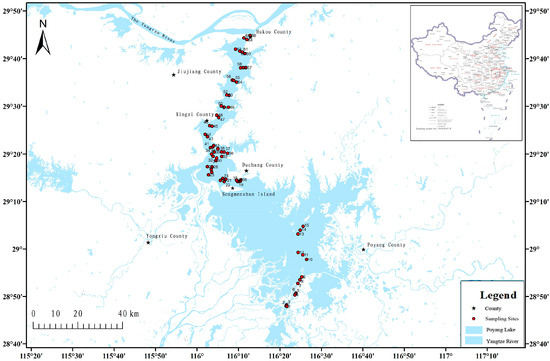
Figure 1.
Location of Poyang Lake and map of sampling sites.
2.2. eDNA Extraction
eDNA extracted from filter membranes was tested in a laboratory without vertebrate DNA contamination in the Institute of Zoology, Chinese Academy of Sciences. DNA was extracted using recommended protocols [20]. We used the Qiagen DNeasy® Blood and Tissue Kit, and we made following modifications compared to the spin column protocol: (a) added 720 μL ATL buffer and 80 μL proteinase K into filters; (b) supernatants were incubated for 3 h at 56 °C; (c) 800 μL AL buffer and 800 μL 96% ethanol were added after incubation, and (d) elution was performed in 50 μL × 2 Buffer AE for a final volume of 100 μL. For each round of extraction, we also made an extraction blank sample to monitor contamination, with smaller volumes added: 180 μL ATL buffer, 20 μL proteinase K, 200 μL AL buffer and 200 μL ethanol. Laboratory tables, aseptic operation tables and experimental equipment were regularly cleaned with 5% bleach and then 75% ethanol before DNA extraction, and nightly UV treatment was in place.
2.3. PCR Amplification
Pre- and post-PCR work was separated in different labs. PCR amplification was performed using “Vert-12SV5-F/R” primers developed by [21] (For-ACTGGGATTAGATACCCC; Rev-TAGAACAGGCTCCTCTAG) targeting a ~106 bp region and “MiFish-U-F/R” primers developed by [22] (For-GTCGGTAAAACTCGTGCCAGC; Rev-CATAGTGGGGTATCTAATCCCAGTTTG) targeting a ~170 bp region at the 3′ end of the mitochondrial 12S gene (mtDNA-12S). Both forward and reverse primers were tagged with oligos consisting of two to three random nucleotides, and tags were designed using OligoTag [23]. Each sample corresponded to a specific tag. The PCR system had a 25 μL volume, containing 2.5 μL 10 × PCR Buffer (without MgCl2), 1.5 μL MgCl2, 9.05 μL ddH2O, 1.5 μL of each primer (10 μM), 0.5 μL HL-dsDNase 5 U μL−1, 2 μL DNTPer (2.5 mM), 0.25 μL BSA, 0.2 μL TagGold (High-Fidelity DNA Polymerase), 1 μL DMSO and 5 μL extracted DNA. The PCR mix was incubated with the DNase for 15 min at 37 °C, and the DNase was then inactivated by incubation at 60 °C for 15 min before the DNA template was added. The target of adding DNase is to remove any contaminating double-stranded DNA potentially present in the PCR reagents. The PCR reaction conditions are the following: 10 min at 95 °C followed by 55 cycles of 94 °C for 30 s, 50 °C for 30 s, 72 °C for 1 min and, finally, 5 min at 72 °C. PCR reactions were replicated four times per sample in order to obtain at least one positive PCR product. In each PCR reaction, no less than two negative controls (PCR blank) and two positive controls (template DNA extracted from fish tissue) were included, to monitor man-made contamination and detect the accuracy of target fragments. Fragment sizes were verified on 1% agarose gels stained with GelRedTM. The PCR products were combined into four pools, where each PCR pool contained one replicate of every sample. PCR blank products were also pooled together as the negative control. PCR pools were purified using Qiagen’s MinElute PCR Purification Kit following the manufacturer’s protocol with the exception that samples were incubated with the elution buffer (2 × 20 μL EB) over two rounds of 37 °C for 10 min, and they included a purification blank.
2.4. Library Building and High-Throughput Sequencing
A total of 24 indexed sequencing libraries (6 pools per primer set) were built from each pool using approximately 250 ng of PCR product. The NEBNext DNA Library Prep Master Mix Set for 454 kit was used for library building. The concentration and distribution of the fragment size of the libraries were checked on an Agilent 2100 Bioanalyzer, and the libraries were then pooled, aiming for a final concentration of 4 nM in each pool. Libraries were then sequenced on an Illumina NovaSeq 6000 by BGI (Beijing, China) running 150 PE sequencing.
2.5. Bioinformatics Analysis
Three repetitions of same site were sequenced on the Illumina platform separately. Original quality control of raw reads was performed by Trimmomatic 0.32 for quality trimming and removal of adapter sequences from the raw reads [24],and only sequences with less than three unrecognized bases (N), a Phred quality score > 33 and >8 bp of adapter matched were retained for analysis. Raw reads were de-multiplexed using Qiime 2 [25] and Cutadapt [26], and a two-base mismatch was allowed for primer and tag removal. The minimum read length was 100 bp, and we removed reads with numbers less than 10. Pair-ended reads were aligned using Vsearch [27], and the length of the aligned read was between 100 and 120 bp. Quality controls of aligned reads were performed using Qiime 2 [25] to ensure a Phred quality score > 30. Filtered reads were clustered used Qiime 2 [25] into molecular operational taxonomic units (MOTUs) with a 99% similarity cutoff. Chimeras were identified and removed from the dataset using the Vsearch uchime-denovo command of Qiime 2 [25]. MOTUs with number less than 10 were also removed. The most sequences in each MOTU were chosen and assigned with the NCBI database (https://www.ncbi.nlm.nih.gov/ (accessed on 31 December 2024)) using NCBI-Blast to obtain the annotation taxon information of each MOTU. NCBI-Blast settings included an e-value ≤ 1 × 10⁻⁵, percent identity ≥ 97% and min_raw_gapped_score ≥ 100. The taxon information was retained if it existed in two or three duplicates of the same site, in order to ensure the accuracy of assignment. Sequences with an assigned taxon of ‘NA’ or assigned to humans and birds were also removed.
2.6. Diversity Index Analysis
With the increasing understanding of biodiversity, taxonomic diversity (TD) and functional diversity (FD) are recognized as two aspects or components, while they have different ecological significance. TD refers to the number and the relative abundance of species in a community [28], and it remains the main measurement of biodiversity [29]. However, TD cannot reveal changes in the biodiversity and ecological functions of the ecosystem [30,31]. FD is an important concept in community ecology, referring to the amount of inter-specific variation in functional traits that affect the ecosystem function [32,33].
Both abundance and presence/absence data were compiled. The abundance of each species at each sampling site was inferred by eDNA sequence counts, since previous studies proved that eDNA could be used for quantitative analysis when studying the abundance of the fish community [34,35]. Abundance data were used for α- and β-TD and FD calculations. Presence/absence data were applied to some beta-diversity calculations. We measured 13 functional traits (Table 1) related to the feeding habits, swimming, habitat preferences and reproductive habits of 62 detected fish based on eDNA. A maximum of 20 individuals by species, which were collected in the field by our research group in recent years, were randomly selected for measurement (Table S2). Morphological measures were performed with an electronic caliper (precision of 0.1 mm).

Table 1.
Functional traits applied for FD analysis.
When α-TD was analyzed, we calculated the species richness using the number of fish MOTUs based on previous research studies [44,45,46], and we applied the Shannon–Wiener (Shannon) index and Simpson’s index as the surrogate for TD, since the Shannon index is most commonly used and able to present the mix between diversity and heterogeneity of species in a certain region [28], and Simpson’s index reflects the evenness of biodiversity. The Shannon index was calculated using formula H = −∑ (Pi) (log2Pi), where Pi was calculated by the proportion of eDNA reads of a detected fish species versus the total reads of each sample. Simpson’s index was calculated by formula D = 1 − ∑ (Ni/N)2, where Ni refers to the number of eDNA reads of a detected fish species and N refers to total number of eDNA reads detected. The eDNA reads of fish species detected at each sampling site are shown in Table S1. Similarly, we chose Rao’s Quadratic Entropy (Rao’sQE) index and the Functional Evenness (FEve) index for FD analysis, because Rao’sQE index presents a mix between functional richness and functional divergence [33] and FEve is a measure of the species trait distributed regularly within the occupied trait space [47].
For β-diversity, the Bray–Curtis (βbray) dissimilarity coefficient was adopted, since it is widely used and could qualitatively and quantitatively measure the total taxonomical and functional dissimilarity between two communities or seasons, respectively [48].
2.7. Statistics Analysis
All statistical analyses were carried out in R v.4.5.0 (R Core Team 2025). α-diversity was analyzed using the “vegan v2.6-10” package of R v.4.5.0. Rao’sQE and FEve indices were calculated using “FD” [49] and “fundiversity” [50,51] in R v.4.5.0 [52]. β-TD and β-FD were calculated using the “vegan v2.6-10” package of R v.4.5.0 [52]. We used the z-score normalization method to standardize the data, converting it into a standard normal distribution with a mean of 0 and a standard deviation of 1. Normalized read counts were used as the input for the permutational multivariate analysis of variance (PERMANOVA) and Principal Coordinate Analysis (PCoA) plots for all markers. Before the beta-diversity analysis, sample outliers, as identified by PCoA plots, were removed. To study the spatial patterns of fish diversity, Poyang Lake was divided into two major groups, the north lake area and south lake area, and one-way PERMANOVA was used to compare the differences in species and FD index among different lake areas and across different seasons, respectively. The linear regression analysis, examining the biological acceptance or resistance, was employed to check the relationships between the species count and Shannon index. We use the t-test to verify whether there were significant differences in the results of the diversity index, and the statistical difference was determined at a threshold of p < 0.05. Before conducting a t-test, we use the Shapiro–Wilk test and Levene’s test to verify the normality and homogeneity of variance of the data, respectively, to ensure the reliability of the t-test results. The ggplot2 and ggpubr packages were used for graph plotting.
3. Results
3.1. eDNA Detection of Fish Species
We detected a total of 77 native fish species based on eDNA, belonging to 8 orders, 15 families and 53 genera (Table 2). The number of species belonging to Cypriniformes is the largest (n = 53), accounting for 68.83% of the total number of species detected. The second order is Perciformes (n = 11), accounting for 14.29%. The third order is Siluriformes (n = 7), accounting for 9.09%. Cyprinidae (n = 49) has the most species compared to other families, and its proportion of the total number of detected species is 63.64%. Ten of the total twelve subfamilies of Cyprinidae have been detected at Poyang Lake, and the numbers of species belonging to Cultrinae and Gobioninae are the highest (n = 13) when compared with other subfamilies (Figure 2). For the genus, the most species of Saurogobio are identified (n = 5), the second is Acheilognathus (n = 4), and the joint third are Rhodeus, Chanodichthys, Siniperca and Pelteobagrus (n = 3).
Table 2.
Fish taxa identified by eDNA in Poyang Lake.
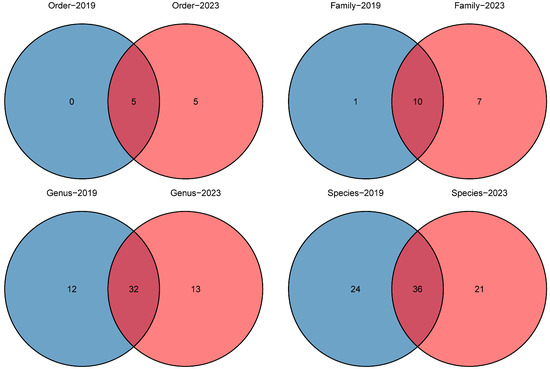
Figure 2.
Comparison of the number of different taxa in 2019 and 2023.
Along with the native fish species, a total of four alien species were also detected: Gambusia affinis, Oreochromis mossambicus, Sarotherodon galilaeus and Salvelinus fontinalis.
3.2. Temporal and Spatial Comparison of α- and β-TD
Fish species richness was calculated and compared before and after the drought (year 2019 vs. 2023, Figure 2; Table S3). A total of 5 orders, 11 families, 44 genera and 60 native fish species were detected using eDNA in 2019; by contrast, 10 orders, 17 families, 45 genera and 53 native fish species were detected in 2023. At the order level, Cypriniformes, Perciformes, Siluriformes, Beloniformes and Clupeiformes were detected in both years. However, five orders—Acipenseriformes, Cyprinodontiformes, Mugiliformes, Salmoniformes and Synbranchiformes—were only detected in 2023. At the family level, 10 families—Hemiramphidae, Engraulidae, Cobitidae, Cyprinidae, Channidae, Gobiidae, Odontobutidae, Serranidae, Bagridae and Siluridae—were detected in both years. Meanwhile, Mastacembelidae was only detected in 2019, and Acipenseridae, Poeciliidae, Mugilidae, Cichlidae, Eleotridae, Salmonidae and Synbranchidae were only detected in 2023. At the genus level, 32 genera were detected in both years, and 12 genera were only detected in 2019, while 13 genera were only detected in 2023. In addition, there was no alien fish species detected in 2019, while four alien species were detected in 2023.
The Shannon index indicated a trend consistent with species richness (R2 = 0.32, p < 0.001, Figure 3), that is, the Shannon index increases with the increase in the number of species, and the Shannon index was significantly higher in 2019 compared to in 2023 (p = 0.029 < 0.05, Figure 4). However, Simpson’s index showed no significant difference between the two investigated years (p = 0.56 > 0.05, Figure 4). We also applied PCoA of the βbray dissimilarity coefficient to infer the relationship in fish composition and abundance between 2019 and 2023 (Figure 5). The results indicated that the samples from the two years were divided into two groups. To determine which species were more critical for reflecting differences in fish communities between the two years, we calculated the contribution rate of all species (Table 3). Pelteobagrus fulvidraco, Ctenopharyngodon idella and Pseudorasbora parva were top three species with the highest contribution rate (accumulation rate was 46.28%). Among them, the average abundances of Pelteobagrus fulvidraco and Pseudorasbora parva in 2019 were 31 times and 85 times those of 2023, respectively. On the contrary, Ctenopharyngodon idella was only 8.3% in 2019 of that in 2023. In addition, Silurus asotus, Carassius auratus, Squalidus argentatus and Pelteobagrus nitidus displayed the higher average abundance in 2019, and Odontobutis potamophila, Cyprinus carpio, Hypophthalmichthys molitrix and Mylopharyngodon piceus had the higher average abundance in 2023.
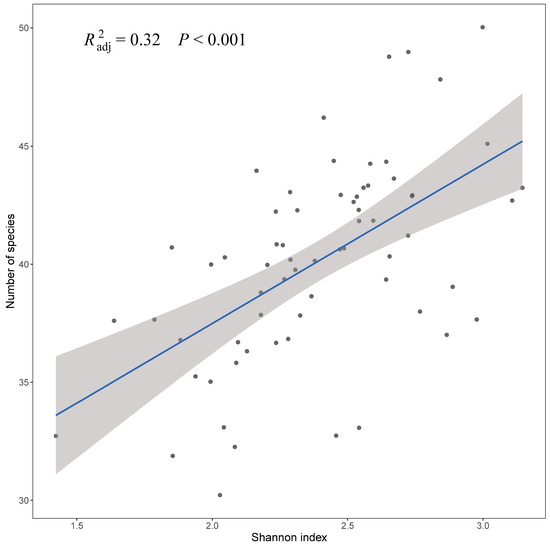
Figure 3.
Correlation between Shannon index and species richness of fish.
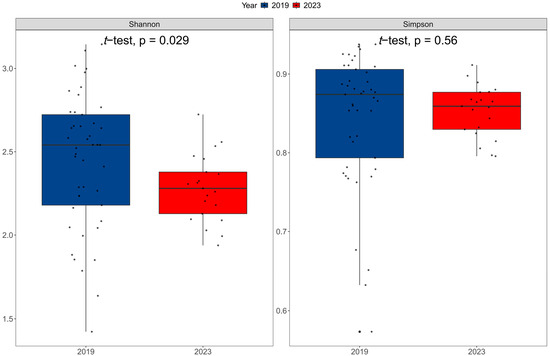
Figure 4.
Comparison of Shannon index and Simpson’s index between 2019 and 2023.

Figure 5.
Principal Component Analysis of βbray dissimilarity coefficient of fish composition and abundance between 2019 and 2023.
Table 3.
The key species and contribute rate (%) for the differences in fish community compositions between 2019 and 2023.
We also compared the species richness (Figure 6) and α- and β-TD of fish in the dry and rainy seasons of 2023. A total of 6 orders, 12 families, 33 genera and 36 fish species were detected in the dry season, as well as 7 orders, 13 families, 34 genera and 41 fish species in the rainy season. From the fauna composition, we found that Cypriniformes was predominant in both seasons, and Acipenseriformes and Synbranchiformes were only detected in the dry season, as well as Beloniformes, Clupeiformes and Mugiliformes in the rainy season. At the family level, Cyprinidae showed significant advantages compared to other families in both water periods. Furthermore, Acipenseridae, Channidae and Synbranchidae were only detected in the dry season, while Hemiramphidae, Engraulidae, Mugilidae and Eleotridae were only detected in the rainy season. At the genus level, in total, 22 genera were detected in both seasons. However, 11 genera were only detected in the dry season and 12 genera were only detected in the rainy season. Additionally, only one alien species, Gambusia affinis, was detected in the rainy season, and three alien fish species, Oreochromis mossambicus, Sarotherodon galilaeus and Salvelinus fontinalis, were detected in the dry season. Clearly, the species richness of fish was higher in the rainy season. The Shannon index (p = 0.13 > 0.05) and Simpson’s index (p = 0.45 > 0.05) did not display significant spatial differences in the north and south lake areas without distinguishing the dry and rainy seasons (Figure 7a). However, the Shannon index and Simpson’s index were significantly higher in the south lake area in the dry season and significantly higher in the north lake area in the rainy season, respectively (Figure 7b,c). β-TD indicated that there was a significant difference between the south and north lake areas (p = 2.3 × 10⁻⁶ < 0.01; Figure 8a; Table S4), and this difference exists in both the dry season (p = 0.0016 < 0.01) and the rainy season (p = 0.0032 < 0.01; Figure 8b,c).
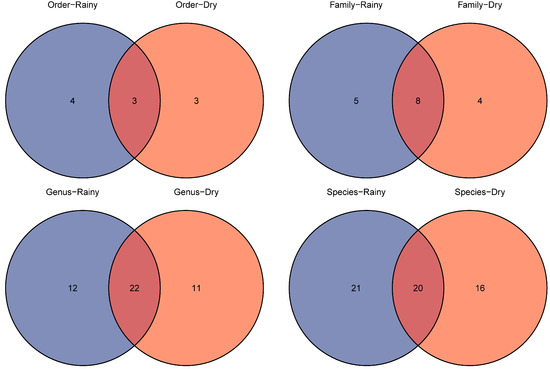
Figure 6.
Comparison of the number of different taxa in dry and rainy seasons.
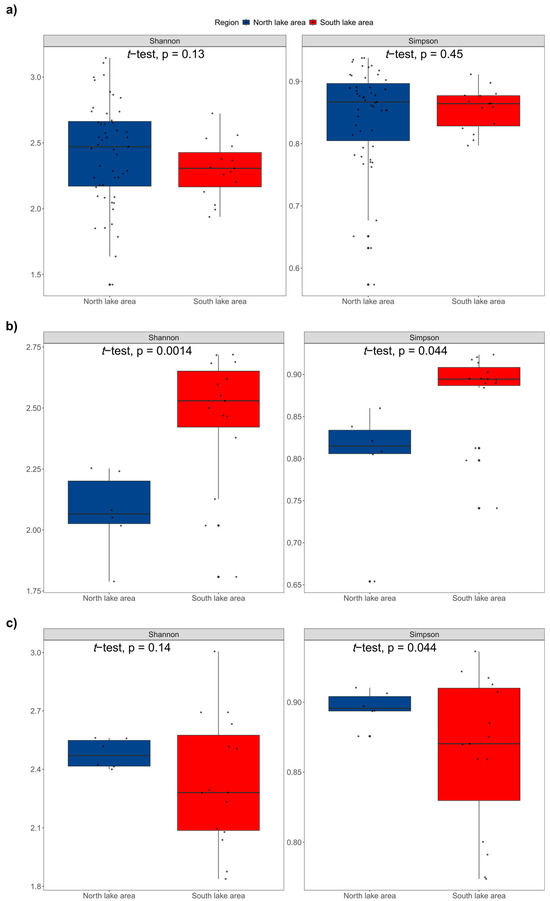
Figure 7.
Comparison of α-TD indices between north and south lake areas ((a): total dry and wet seasons; (b): dry season; (c): rainy season).
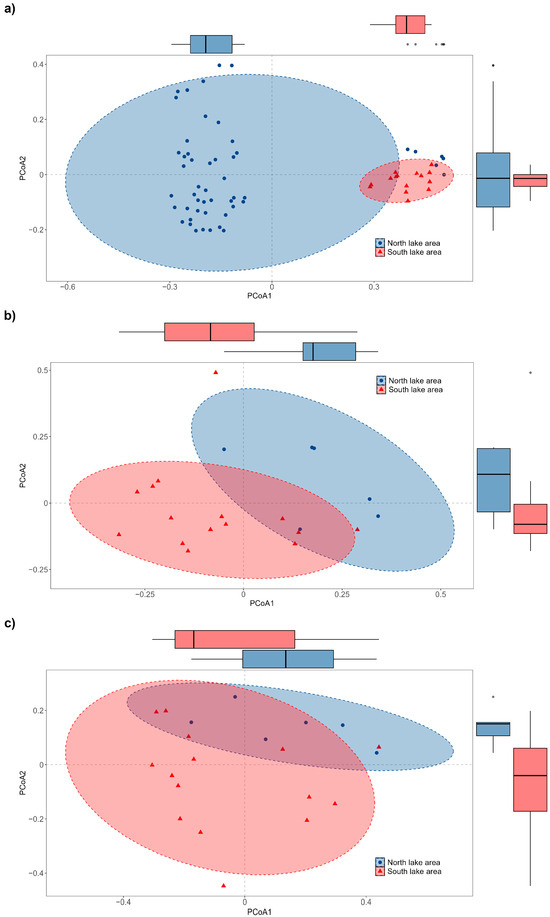
Figure 8.
Principal Coordinate Analysis of βbray dissimilarity coefficient of fish composition and abundance between north and south lake areas ((a): total dry and rainy seasons; (b): dry season; (c): rainy season).
3.3. Temporal and Spatial Comparison of α- and β-FD
The α-FD, indices of Rao’sQE and FEve, were compared between 2019 and 2023. Our results showed that Rao’sQE index in 2023 was significantly higher than that in 2019 (p = 2.2 × 10⁻¹⁶ < 0.01, Figure 9a), but the FEve index in 2023 was significantly lower than that in 2019 (p = 2.2 × 10⁻¹⁶ < 0.01, Figure 9b). Depending on different seasons, Rao’sQE index was significantly higher in the dry season than in the rainy season (p = 2.2 × 10⁻¹⁶ < 0.01, Figure 9c), but the FEve index had no significant difference between the two seasons (p = 0.39 > 0.05, Figure 9d).
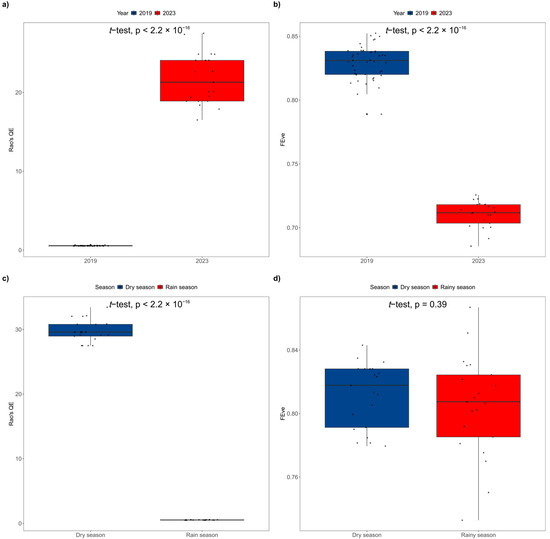
Figure 9.
Temporal comparison of FD indices ((a): Rao’sQE index in 2019 vs. 2023; (b): FEve index in 2019 vs. 2023; (c): Rao’sQE index in dry and rainy seasons; (d): FEve index in dry and rainy seasons).
We also compared the difference in Rao’sQE index and the FEve index between the south and north parts of Poyang Lake. The results show that there was no significant difference in Rao’sQE index between the north and south parts when the seasons were not distinguished or in the dry season (p = 0.21 > 0.05, Figure 10a; p = 0.061 > 0.05, Figure 10b). However, Rao’sQE index of the north part was significantly higher than that of the south part (p = 0.0091 < 0.01, Figure 10c) in the rainy season. On the contrary, the FEve index represented disparate results. The FEve index in the south part was significantly higher than that in the north part when the seasons were not distinguished or in the dry season (p < 0.05, Figure 10d,e), but there was no significant difference between the two lake parts in the rainy season (p = 0.73 > 0.05, Figure 10f).
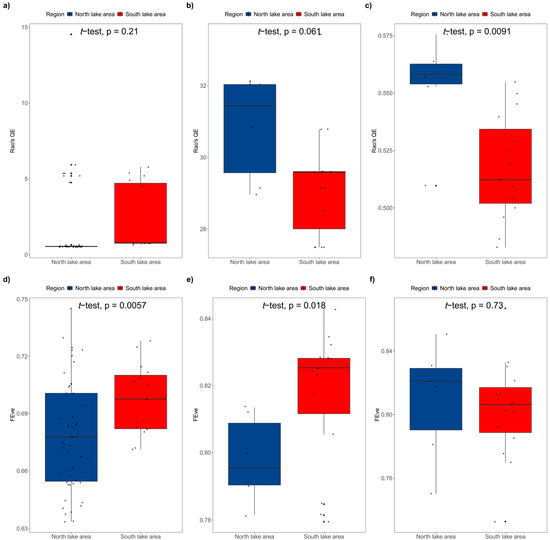
Figure 10.
Comparison of FD indices between north and south lake areas ((a): Rao’sQE index in dry and rainy seasons; (b): Rao’sQE index in dry season; (c): Rao’sQE index in rainy season; (d): FEve index in dry and rainy seasons; (e): FEve index in dry season; (f): FEve index in rainy season).
We calculated the βbray dissimilarity coefficient and PCoA between the community composition and functional traits of fish in different years and water seasons (Table S4). Results showed that there were no significant differences in FD between 2019 and 2023 (p = 1.00 > 0.05; Figure 11a), as well as between the dry and rainy seasons (p = 1.00 > 0.05; Figure 11b).
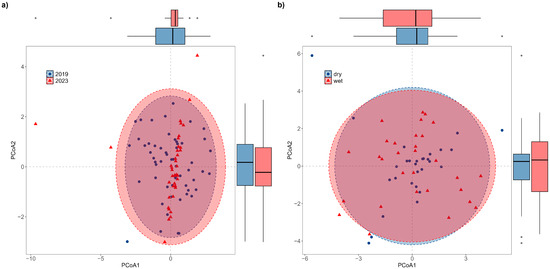
Figure 11.
Principal Coordinate Analysis of β-FD between 2019 and 2023 (a) and dry and rainy seasons (b).
4. Discussion
4.1. Comparison of Fish Diversity in Poyang Lake Based on eDNA with Historical Records
On the basis of the eDNA investigation results of Poyang Lake in 2019, there were 60 native fish species detected. According to the survey results of traditional fishing gear in Poyang Lake carried out in the same year, in total, 52 fish species were collected [53]. Therefore, the number of fish species obtained by fishing gear was slightly lower than that detected by eDNA, which was consistent with many similar comparative studies. In the annual surveys of Poyang Lake between 2020 and 2021, 57 fish species in total were collected by traditional methods [54]. Moreover, 55 species were found based on traditional surveys in 2010 [53]. The above studies all showed that the number of fish in Poyang Lake was essentially maintained at more than 50 species before the severe drought at the lake in 2022, which was supported both by our eDNA and previous traditional fishing methods.
4.2. Reestablishment of Fish Community After Extreme Drought in Poyang Lake
The water depth is one determinant in shaping lake ecosystems, and extreme drought can profoundly affect the water cycling and thus the biodiversity. Drought leads to a change in incoming water to the lake whereby it decreases incoming water, which causes a change in habitat conditions, resulting in a decrease in biomass and changes in species composition, followed by successions of biological communities [55,56,57,58]. Freshwater fishes are vulnerability and rapidly respond to droughts [59,60]. Our data demonstrate that the fish community of Poyang Lake remarkedly changed in both species diversity and community composition before and after the extreme drought in 2022. The fish species richness detected in 2023 was significantly lower than that in 2019. A study of the effects of extreme drought on zooplankton of Poyang Lake in 2022 also showed that drought caused a decline in the number and community structure stability of zooplankton, which displayed similar results to our study on fish [61]. Similar phenomena have also been proven to occur in Australia’s freshwater ecosystems, and drought has caused a decline in biodiversity and led to the invasion of non-native species [57]. Meanwhile, the Shannon Index was also lower in 2023 (Figure 4). However, Simpson’s index showed no difference between the two years (Figure 4). Based on the ecological significance of the two indices [28], it indicates that the decline in diversity post-drought may primarily be driven by a loss of rare species, while the evenness among the remaining common species was similar.
Regarding the composition of the fish community, the dominant fish species in Poyang Lake in 2023 changed drastically compared with that in 2019. Based on the contribute rates of each fish in 2019 and 2023 (Table 3), we analyzed the contribute rates of the top 20 species to compare the dominant species in the two investigated years (Figure 12), where the small-sized fish were dominant in 2019. This pattern is confirmed by other recent studies in Poyang Lake [62]. The small-sized species were replaced by the medium- and large-sized fish after the drought in 2023 (Figure 12a). We also noted that Barbinae and Gobiobotinae were not detected in 2023, which reflected the loss of bathyphilic fish due to drought. The fish species belonging to genera Acrossocheilus and Gobiobotia were only detected in 2019. These species have been proven to prefer deep water habitats [63,64], and are thus more pronounced in how they are affected by drought. Furthermore, there were significant differences in the number of species within Acheilognathinae, which displayed that seven species belonging to both Acheilognathus and Rhodeus were detected in 2019 and only one species of Acheilognathus was detected in 2023. Acheilognathinae is a type of fish that lays eggs in freshwater mussels. Long-term drought could therefore lead to a reduction in the area of Poyang Lake [65], resulting in the disappearance of benthic animals and eventually a decline in the diversity of Acheilognathinae. Moreover, four species of Cobitidae were detected in 2019, while only one species was detected in 2023, which is Misgurnus anguillicaudatus, a widely distributed species. These patterns indicate that the predominance of small-sized fish species of Poyang Lake has been declining, while the overall fish community in Poyang Lake is undergoing a reestablishment process after the extreme drought in 2022.
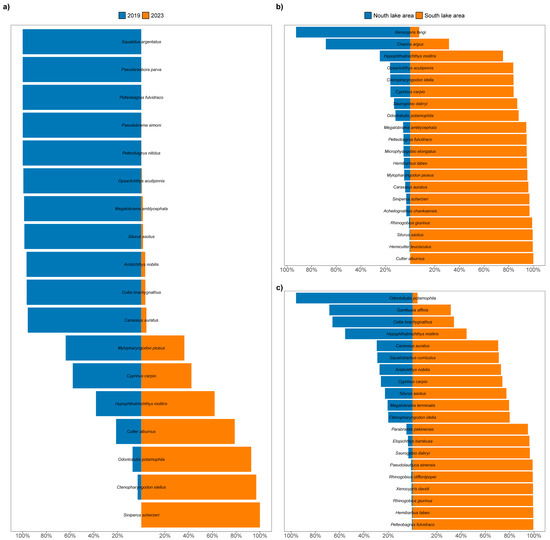
Figure 12.
Comparison of dominant fish species in Poyang ((a): 2019 vs. 2023; (b): north lake area vs. south lake area in dry season; (c): north lake area vs. south lake area in rainy season).
Poyang Lake has seasonal changes, where the water depth fluctuates periodically between the dry and rainy seasons [66], and due to the geographical differences, its south and north parts respond very differently to this fluctuation circle. During the rainy season, there is no clear difference in the spatial distribution of the water level, and the water depth is hence determined by the lake bottom elevation, which increases gradually from the upper to the lower reaches [67]. In the dry season, however, the water level is spatially different, where the water depth at the outer edge of the water channel is lower than that in the water channel in the north part [67]. Our data on dominant fish indicate that species such as Odontobutis potamophila, Hypophthalmichthys molitrix and Coilia brachygnathus, which were dominant in the rainy season in the north part of Poyang Lake, lost their dominance in the dry season (Figure 12b), when species such as Xenocypris fangi and Channa argus became dominant. Previous studies have also shown that the temporal and spatial distribution of fish diversity in the water channel of Poyang Lake are related to the water depth, particularly in areas connecting the river and the lake [62,68].
4.3. Response of Fish Community to Drought
Extreme droughts become more and more frequent under the current changing climate, and they pose a major threat to freshwater fish communities [69]. Our results on fish functional diversity add some insights into the response processes of fish communities to extreme droughts. The results of fish FD showed that Rao’sQE index increased with the drought, while the FEve index was no significant change with the drought (Figure 9). It is evident that FEve is rather independent of Rao’sQE, and the two indices do not necessarily show a consistent trend [33]. From the ecological implications of the two indices, we can surmise that Rao’sQE index has been shown to be associated with highly differentiated niches among species within a community, while the FEve index reflects a uniform distribution of species and abundance [33,70,71]. Our data confirmed that the niche of small-sized fish was replaced by medium- and large-sized fish, leading to changes in the community structure and thus an increase in Rao’sQE index. Meanwhile, the fish diversity and community composition in Poyang Lake showed an uneven distribution after the drought (Figure 8); specifically, the diversity in the south part became significantly higher than that in the north part during the dry season (Figure 7b).
4.4. Fish Community Recovery Is Affected by Human Intervention
Previous research studies showed that native biota in drought systems possess strong capacities in adaptation to habitats. There are two theories explaining the adaptations. The first is known as “sitting it out” (resistance traits) and the second one is known as “recolonizing and recruiting” (resilience traits) [57]. The first theory proposes that the main driver of adaptations comes from the population kept afloat by preservation in a small refuge [72], whereas the second theory, which is more accepted and better developed, argues that the rapid dispersal across suitable habitats allows for reintroduction and thus reestablishment. In our case, the small-sized fish have a greater capacity for adaptation and population resilience [73,74], and thus should be recovered earlier than large-sized fish species, yet our data disagree with this pattern. We suspect this is the result of human intervention. One major intervention in the area is to purposely release fish fries of desired species to restore fish diversity, aiming to sustain health populations of several critically endangered and endangered species. Four major Chinese carps, the black carp (Mylopharyngodon piceus), grass carp (Ctenopharyngodon idella), silver carp (Hypophthalmichthys molitrix) and silver carp (Aristichthys nobilis), are the main species released in the Yangtze River basin, with the original aim to supply food resources for predators such as the Yangtze finless porpoise. The increase in Ctenopharyngodon idella, Hypophthalmichthys molitrix and Aristichthys nobilis in Poyang Lake after the drought most likely resulted from these management efforts. In addition, artificial releases of herbivorous fish species will overconsume aquatic plants and will thus reduce the spawning habitat of fish producing sticky eggs, further resulting in a decrease in the number of these small-sized fish [75]. Despite these effects of human-induced fish diversity management, we note that fish diversity decreases caused by the 2022 drought were still not fully recovered in 2023, when the overall fish diversity was still significantly lower compared to that in 2019. This emphasizes that there are severe effects of climatic extremes in freshwater ecosystems, even under positive human interventions.
Although artificial release of fish has been proven to be an effective approach for fish protection, it potentially raises ecological issues due to the improper selection of a release location and discharge rate [76]. One potential consequence is that large-sized fish outcompete the original small-sized fish, as observed in our data, and an insufficient quantity of small fish might in turn limit the population expansion of the finless porpoise. The species to be released and the time and place of release are thus key in this conservation, as has been noted recently. Since 2022, the Ministry of Agriculture and Rural Affairs has issued a series of guidelines to regulate manual release, stipulating these management practices [77].
Another positive indication observed in our data, because of long-term regional fishery management, is the detection of rare species such as Planiliza affinis, a euryhaline inshore fish species that has not been found in Poyang Lake for many years. China has imposed a 10-year ban on fishing in the lower Yangtze River basin, including Poyang Lake, from 1 January 2021, aiming to protect the fish diversity of the Yangtze River basin and to keep the ecosystem in its natural state. Only after two years of this fishing ban policy, our data detected the presence of Planiliza affinis in Poyang Lake, which was not detected in 2019. Other recent studies have also demonstrated the positive effects of the fishing ban on fish recovery in Poyang Lake [78,79]. Combined, these data clearly indicate a positive effect in prompting the recovery of fish diversity under the Yangtze River fishing ban policy.
5. Conclusions
In conclusion, our study demonstrates that the fish community of Poyang Lake has been going through a post-drought reestablishment process. The species richness and α-TD were decreased after the drought, and β-TD showed a clear difference before and after the drought. α-FD indicated that Rao’sQE index increased after the drought, and β-FD did not show a significant difference. Interestingly, these changes in fish diversity are attributed to the reestablishing of fish communities, with small-sized fish decreasing and medium- and large-sized fish increasing, and the latter replacing the ecological niche of the former. This process of fish community reestablishment in Poyang Lake does not fit the model of natural restoration of biomes after drought, but is likely subject to human intervention such as fishing bans and artificial fish species release. Combining evidence, we recognize that human intervention potentially has a positive effect on the protection of the lake’s biodiversity, allowing some species that have long disappeared to reappear, under proper guidelines driven by scientific data.
Supplementary Materials
The following supporting information can be downloaded at https://www.mdpi.com/article/10.3390/d17110800/s1, Table S1: The eDNA reads of fish species detected at each sampling site, Table S2: The Functional traits values of each fish species, Table S3: Fish species composition based on eDNA in 2019 and 2023, Table S4: Principal Co-ordinates Analysis coordinate value of β bray dissimilarity coefficient of fish compostion.
Author Contributions
Y.X. and Y.Z. conceived this study, K.L. and T.J. conducted statistical analyses, Y.X. and K.L. wrote the manuscript, Y.X., W.G. and Y.W. performed the fieldwork, W.G. and R.X. conducted all laboratory work and sequence data analyses, H.L. drew the map of sampling. All authors have read and agreed to the published version of the manuscript.
Funding
Funding was provided by the National Natural Science Foundation of China (No. 32172975) and Central Public-interest Scientific Institution Basal Research Fund CAFS (No. 2023TD12) to Y.X., the Project of Conservation International Foundation (107802/6009164) and Sino BON-Inland Water Fish Diversity Observation Network to Y.Z. and the NSFC BSCTPES Project (No. 41988101), CAS Youth Interdisciplinary Team Fund, Carlsberg Foundation (CF18-0024), Danish National Research Foundation (DNRF174) and Novo Nordisk Foundation (NNF24SA0092560) to Y.W. Data analysis was supported by the National Key Scientific and Technological Infrastructure project “Earth System Numerical Simulation Facility” (EarthLab, 2023-EL-ZD-000111), National Supercomputer Center in Wuxi utilizing the computational resources of the Sunway TaihuLight Supercomputer, and SMU’s Center for Research Computing.
Data Availability Statement
The original contributions presented in this study are included in the article/Supplementary Materials. Further inquiries can be directed to the corresponding authors.
Acknowledgments
We appreciated the help from Xuejian Li in collecting water samples, Chen Tian and Yutian Fang in collecting water samples and providing original eDNA data, and Zhixian Sun in providing functional trait data of Microphysogobio elongatus.
Conflicts of Interest
The authors declare no conflicts of interest.
References
- Malmqvist, B.; Rundle, S.D.; Covich, A.P.; Hildrew, A.G.; Robinson, C.T.; Townsend, C.R. Prospects for streams and rivers: An ecological perspective. In Aquatic Systems: Trends and Global Perspectives; Polunin, N., Ed.; Cambridge University Press: Cambridge, UK, 2008; pp. 19–29. [Google Scholar]
- Woodward, G. Biodiversity, ecosystem functioning and food webs in fresh waters: Assembling the jigsaw puzzle. Freshw. Biol. 2009, 54, 2171–2187. [Google Scholar] [CrossRef]
- Sala, O.E.; Chapin, F.S., III; Armesto, J.J.; Berlow, E.; Bloomfield, J.; Dirzo, R.; Huber-Sanwald, E.; Huenneke, L.F.; Jackson, R.B.; Kinzig, A. Global biodiversity scenarios for the year. Science 2000, 287, 1770–1774. [Google Scholar] [CrossRef]
- Dudgeon, D.; Arthington, A.H.; Gessner, M.O.; Kawabata, Z.; Knowler, D.J.; Lévêque, C.; Naiman, R.J.; Prieur-Richard, A.; Soto, D.; Stiassny, M.L.J.; et al. Freshwater biodiversity: Importance, threats, status and conservation challenges. Biol. Rev. 2006, 81, 163–182. [Google Scholar] [CrossRef]
- Bradley, J.; Cardinale, J.; Duffy, E.; Gonzalez, A.; Hooper, D.U.; Perrings, C.; Venail, P.; Narwani, A.; Mace, G.M.; Tilman, D.; et al. Biodiversity loss and its impact on humanity. Nature 2012, 486, 59–67. [Google Scholar] [CrossRef]
- Duker, L.; Borre, L. Biodiversity Conservation of the World’s Lakes: A Preliminary Framework for Identifying Priorities; LakeNet Secretariat Monitor International: Annapolis, MD, USA, 2001. [Google Scholar]
- Vadeboncoeur, Y.; McIntyre, P.B.; Zanden, M.J.V. Borders of Biodiversity: Life at the Edge of the World’s Large Lakes. BioScience 2011, 61, 526–537. [Google Scholar] [CrossRef]
- Ma, R.; Yang, G.; Duan, H.; Jiang, J.; Wang, S.; Feng, X.; Li, A.; Kong, F.; Xue, B.; Wu, J.; et al. China’s lakes at present: Number, area and spatial distribution. Sci. China Earth Sci. 2011, 3, 394–401. [Google Scholar] [CrossRef]
- Wu, Y.H.; Ji, W.T. Researches on Poyang Lake National Nature Reserve, Jiangxi Province; China Forestry Publishing House: Beijing, China, 2002. [Google Scholar]
- Mei, Z.; Hao, Y.; Zheng, J.; Wang, Z.; Wang, K.; Wang, D. Population status and conservation outlooks of Yangtze finless porpoise in the Lake Poyang. J. Lake Sci. 2021, 33, 1289–1298. [Google Scholar] [CrossRef]
- National Forestry and Grassland Administration, Ministry of Agriculture and Rural Affairs (2021) National Classified Key Protected Wildlife List. [2021] No. 3. Available online: http://yyj.moa.gov.cn/gzdt/202102/t20210205_6361296.htm (accessed on 2 May 2021).
- Huang, Y.; Li, Y.; Ji, W.; Xu, P.; Wang, Z. Bird diversity and conservation status in Poyang Lake area. Wetl. Sci. 2016, 14, 311–327. [Google Scholar]
- Zhang, N.; Li, Y.; Shan, J.; Tu, X.; Zhang, Y.; Li, Y.; Wang, L.; Ying, Q. Community structure, abundance and spatial distribution of water birds wintering in Poyang Lake wetland. J. Lake Sci. 2019, 31, 183–194. [Google Scholar] [CrossRef]
- Thirumalai, K.; DiNezio, P.N.; Okumura, Y.; Deser, C. Extreme temperatures in Southeast Asia caused by El Niño and worsened by global warming. Nat. Commun. 2017, 8, 15531. [Google Scholar] [CrossRef]
- Zhang, C.; Zhang, S.; Ning, H. Trends of extreme weather and climate events in China in recent 60 years and their characteristics in China in recent 60 years and their characteristics in 2023. J. Arid. Meteorol. 2024, 4, 536–552. [Google Scholar]
- Li, W.; Jiang, M.; Xu, L.; Hu, S.; You, H.; Zhou, Q.; Chen, Z.; Zhang, L. Spatial and temporal characteristics of phytoplankton in Lake Poyang and its response to extreme flood and drying events. J. Lake Sci. 2024, 36, 1001–1013. [Google Scholar] [CrossRef]
- Zhang, X.; Jin, B.; Chen, J.; Wu, J.; Liu, G.; Ma, Z. Relationship between Habitat Use of Four Waterbird Species and Water Depth and Food Resource in Poyang Lake. Chin. J. Zool. 2014, 49, 657–665. [Google Scholar]
- Zhang, X.; Yu, D.; Wang, H.; Wan, A.; Jiang, Z.; Chen, S. Study of fish community structure in the main habitat of the finless porpoise, the Anqing section of Yangtze River. Acta Ecol. Sin. 2016, 36, 1–8. [Google Scholar] [CrossRef]
- Wang, S.; Dou, H. Lakes of China; Science Press: Beijing, China, 1998; pp. 215–218. [Google Scholar]
- Xing, Y.; Gao, W.; Shen, Z.; Zhang, Y.; Bai, J.; Cai, X.; Ouyang, J.; Zhao, Y. A review of environmental DNA field and laboratory protocols applied in fish ecology and environmental health. Front. Environ. Sci. 2022, 10, 725360. [Google Scholar] [CrossRef]
- Riaz, T.; Shehzad, W.; Viari, A.; Pompanon, F.; Taberlet, P.; Coissac, E. ecoPrimers: Inference of new DNA barcode markers from whole genome sequence analysis. Nucleic Acids Res. 2011, 39, e145. [Google Scholar] [CrossRef] [PubMed]
- Miya, M.; Sato, Y.; Fukunaga, T.; Sado, T.; Poulsen, J.Y.; Sato, K.; Minamoto, T.; Yamamoto, S.; Yamanaka, H.; Araki, H.; et al. MiFish, a set of universal PCR primers for metabarcoding environmental DNA from fishes: Detection of more than 230 subtropical marine species. R. Soc. Open Sci. 2015, 2, 1–33. [Google Scholar] [CrossRef]
- Coissac, E. OligoTag: A program for designing sets of tags for next-generation sequencing of multiplexed samples. Methods Mol. Biol. 2012, 888, 13–31. [Google Scholar]
- Bolger, A.M.; Lohse, M.; Usadel, B. Trimmomatic: A flexible trimmer for Illumina sequence data. Bioinformatics 2014, 30, 2114–2120. [Google Scholar] [CrossRef] [PubMed]
- Caporaso, J.G.; Kuczynski, J.; Stombaugh, J.; Bittinger, K.; Bushman, F.D.; Costello, E.K.; Fierer, N.; Peña, A.G.; Goodrich, J.K.; Gordon, J.I.; et al. QIIME allows analysis of high-throughput community sequencing data. Nat. Methods 2010, 7, 335–336. [Google Scholar] [CrossRef]
- Martin, M. Cutadapt Removes Adapter Sequences from High-Throughput Sequencing Reads. EMBnet J. 2011, 17, 10–12. [Google Scholar] [CrossRef]
- Rognes, T.; Flouri, T.; Nichols, B.; Quince, C.; Mahé, F. VSEARCH: A versatile open source tool for metagenomics. PeerJ 2016, 18, e2584. [Google Scholar] [CrossRef] [PubMed]
- Magurran, A.E. Measuring Biological Diversity; Blackwell Science Ltd.: Oxford, UK, 2004. [Google Scholar]
- Jarzyna, M.A.; Jetz, W. Taxonomic and functional diversity change is scale dependent. Nat. Commun. 2018, 9, 2565. [Google Scholar] [CrossRef]
- Safi, K.; Cianciaruso, M.V.; Loyola, R.D.; Brito, D.; Armour-Marshall, K.; Diniz-Filho, J.F. Understanding global patterns of mammalian functional and phylogenetic diversity. Philos. Trans. R. Soc. B 2011, 366, 2536–2544. [Google Scholar] [CrossRef] [PubMed]
- Cardoso, P.; Rigal, F.; Borges, P.A.V.; Carvalho, J.C. A new frontier in biodiversity inventory: A proposal for estimators of phylogenetic and functional diversity. Methods Ecol. Evol. 2014, 5, 452–461. [Google Scholar] [CrossRef]
- Poos, M.S.; Walker, S.C.; Jackson, D.A. Functional-diversity indices can be driven by methodological choices and species richness. Ecology 2009, 90, 341–347. [Google Scholar] [CrossRef] [PubMed]
- Mouchet, M.A.; Villeger, S.; Mason, N.W.H.; Mouillot, D. Functional diversity measures: An overview of their redundancy and their ability to discriminate community assembly rules. Funct. Ecol. 2010, 24, 867–876. [Google Scholar] [CrossRef]
- Hänfling, B.; Handley, L.; Read, D.S.; Hahn, C.; Li, J.; Nichols, P.; Blackman, R.C.; Oliver, A.; Winfield, I.J. Environmental DNA metabarcoding of lake fish communities reflects long-term data from established survey methods. Mol. Ecol. 2016, 25, 3101–3119. [Google Scholar] [CrossRef]
- Zhang, S.; Lu, Q.; Wang, Y.; Wang, X.; Zhao, J.; Yao, M. Assessment of Fish Communities Using Environmental DNA: Effect of Spatial Sampling Design in Lentic Systems of Different Sizes. Mol. Ecol. Resour. 2020, 20, 242–255. [Google Scholar] [CrossRef]
- Watson, D.J.; Balon, E.K. Ecomorphological analysis of fish taxocenes in rainforest streams of northern Borneo. J. Fish Biol. 1984, 25, 371–384. [Google Scholar] [CrossRef]
- Boyle, K.S.; Horn, M.H. Comparison of feeding guild structure and ecomorphology of intertidal fish assemblages from central California and central Chile. Mar. Ecol. Prog. Ser. 2006, 319, 65–84. [Google Scholar] [CrossRef]
- Karpouzi, V.S.; Stergiou, K.I. The relationships between mouth size and shape and body length for 18 species of marine fishes and their trophic implications. J. Fish Biol. 2003, 62, 1353–1365. [Google Scholar] [CrossRef]
- Toussaint, A.; Charpin, N.; Brosse, S.; Villeger, S. Global functional diversity of freshwater fish is concentrated in the Neotropics while functional vulnerability is widespread. Sci. Rep. 2016, 6, 2045–2322. [Google Scholar] [CrossRef]
- Webb, P.W. Form and function in fish swimming. Sci. Am. 1984, 25, 72–82. [Google Scholar] [CrossRef]
- Villeger, S.; Grenouillet, G.; Brosse, S. Decomposing functional-diversity reveals that low functional-diversity is driven by low functional turnover in European fish assemblages. Glob. Ecol. Biogeogr. 2013, 22, 671–681. [Google Scholar] [CrossRef]
- Gatz, A.J. Ecological morphology of freshwater stream fishes. Tulane Stud. Zool. Bot. 1979, 21, 91–124. [Google Scholar]
- Pool, T.K.; Grenouillet, G.; Villeger, S. Species contribute differently to the taxonomic, functional, and phylogenetic alpha and beta diversity of freshwater fish communities. Divers. Distrib. 2014, 20, 1235–1244. [Google Scholar] [CrossRef]
- Evans, N.T.; Olds, B.P.; Renshaw, M.A.; Turner, C.R.; Li, Y.; Jerde, C.L.; Mahon, A.R.; Pfrender, M.E.; Lamberti, G.A.; Lodge, D.M. Quantification of mesocosm fish and amphibian species diversity via environmental DNA metabarcoding. Mol. Ecol. Resour. 2016, 16, 29–41. [Google Scholar] [CrossRef]
- Lacoursière-Roussel, A.; Rosabal, M.; Bernatchez, L. Estimating Fish Abundance and biomass from eDNA Concentrations: Variability among capture methods and environmental conditions. Mol. Ecol. Resour. 2016, 16, 1401–1414. [Google Scholar] [CrossRef]
- Doi, H.; Uchii, K.; Matsuhashi, S.; Takahara, T.; Yamanaka, H.; Minamoto, T. Isopropanol precipitation method for collecting fish environmental DNA. Limnol. Oceanogr. Methods 2017, 15, 212–218. [Google Scholar] [CrossRef]
- Goswami, M.; Bhattacharyya, P.; Mukherjee, I.; Tribedi, P. Functional diversity: An important measure of ecosystem functioning. Adv. Microbiol. 2017, 7, 82–93. [Google Scholar] [CrossRef]
- Si, X.; Zhao, Y.; Chen, C.; Ren, P.; Zeng, D.; Wu, L.; Ding, P. Beta-diversity partitioning: Methods, applications and perspectives. Biodivers. Sci. 2017, 25, 464–480. [Google Scholar] [CrossRef]
- Laliberté, E.; Legendre, P. A Distance-Based Framework for Measuring Functional Diversity from Multiple Traits. Ecology 2010, 91, 299–305. [Google Scholar] [CrossRef]
- Grenié, M.; Gruson, H. Fundiversity: Easy Computation of Functional Diversity Indices, R Package Version 1.1.1. 2022. Available online: https://CRAN.R-project.org/package=fundiversity (accessed on 21 November 2022).
- Grenié, M.; Gruson, H. Fundiversity: A modular R package to compute functional diversity indices. Ecography 2023, 2023, e06585. [Google Scholar] [CrossRef]
- R Core Team. R: A Language and Environment for Statistical Computing. 2025. Available online: http://www.R.-project.org/ (accessed on 11 April 2025).
- Jiang, X.; Li, M.; Yang, S.; Wang, C.; Zhang, C.; Gao, X. Temporal Variation of Fish Metacommunity Structure in Poyang Lake. Resour. Environ. Yangtze Basin 2022, 31, 588–601. [Google Scholar]
- Yang, M.; Sheng, P.; Zhang, Y.; Guo, L.; Wang, H.; Gao, X.; Chen, Y. Characteristics of fish assemblages of Poyang Lake at the initial stage of the fishing ban. Acta Hydrobiol. Sin. 2022, 46, 1569–1579. [Google Scholar]
- Boulton, A.J. Parallels and contrasts in the effects of drought on stream macroinvertebrate assemblages. Freshw. Biol. 2014, 48, 1173–1185. [Google Scholar] [CrossRef]
- Lake, P.S. Ecological effects of perturbation by drought in flowing waters. Freshw. Biol. 2003, 48, 1161–1172. [Google Scholar] [CrossRef]
- Bond, N.R.; Lake, P.; Arthington, A.H. The impacts of drought on freshwater ecosystems: An Australian perspective. Hydrobiologia 2008, 600, 3–16. [Google Scholar] [CrossRef]
- Wang, Q.; Yang, D.; Weng, B.; Yuan, Y.; Yang, Z. Mechanism of influence of basin drought on freshwater lake wetland ecosystem. Wetl. Sci. 2012, 4, 396–403. [Google Scholar]
- Martinho, F.; Leitão, R.; Viegas, I.; Dolbeth, M.; Neto, J.M.; Cabral, H.N.; Pardal, M.A. The influence of an extreme drought event in the fish community of a southern Europe temperate estuary. Estuar. Coast. Shelf Sci. 2007, 75, 537–546. [Google Scholar] [CrossRef]
- Chessman, B.C. Identifying species at risk from climate change: Traits predict the drought vulnerability of freshwater fishes. Biol. Conserv. 2013, 160, 40–49. [Google Scholar] [CrossRef]
- Shen, Y.; Cheng, J.; Xu, L.; Li, R.; You, H.; Yang, H. Characteristics of zooplankton community structure in Poyang Lake and their influencing factors under extreme hydrological drought. Acta Ecol. Sin. 2023, 24, 10399–10412. [Google Scholar]
- Jiang, X.; Li, M.; Yang, S.; Lin, P.; Chang, T.; Wang, C.; Zhang, C.; Gao, X. Temporal variation of fish biodiversity in Poyang Lake. Acta Hydrobiol. Sin. 2023, 3, 376–388. [Google Scholar]
- Wang, S. Preliminary Studies on the Biology and Stock Biomass of Xenophysogobio boulengeri. Master’s Thesis, Southwest University, Chongqing, China, 2012. [Google Scholar]
- Zhu, Q. Habitat Selection of Acrossocheilus Fasciatus Based on Multidimensional Space and Temporal Scales. Master’s Thesis, Anhui Normal University, Wuhu, China, 2019. [Google Scholar]
- Dai, Z.; Xia, L.; Kong, P.; Zhan, M. Remote sensing monitoring and analysis of Poyang Lake water area changes over the past 20 years. Meteorol. Disaster Reduct. Res. 2021, 2, 127–132. [Google Scholar]
- Sun, F.; Ma, R. Hydrologic changes of Poyang Lake based on radar altimeter and optical sensor. Acta Geogr. Sin. 2020, 75, 544–557. [Google Scholar]
- Qi, L.; Huang, J.; Gao, J.; Guo, Y. Temporal and spatial simulation of water level and velocity during low water level statistical year in Lake Poyang. Resour. Environ. Yangtze Basin 2017, 26, 572–584. [Google Scholar]
- Yang, S.; Li, M.; Zhu, Q.; Wang, M.; Liu, H. Spatial and temporal variations of fish assemblages in Poyanghu Lake. Resour. Environ. Yangtze Basin 2015, 1, 54–64. [Google Scholar]
- Lennox, R.J.; Crook, D.A.; Moyle, P.B.; Struthers, D.P.; Cooke, S.J. Toward a better understanding of freshwater fish responses to an increasingly drought-stricken world. Rev. Fish Biol. Fish. 2019, 29, 71–92. [Google Scholar] [CrossRef]
- Botta-Dukát, Z. Rao’s quadratic entropy as a measure of functional diversity based on multiple traits. J. Veg. Sci. 2005, 16, 533–540. [Google Scholar] [CrossRef]
- Weigelt, A.; Schumacher, J.; Roscher, C.; Schmid, B. Does biodiversity increase spatial stability in plant community biomass? Ecol. Lett. 2008, 11, 338–347. [Google Scholar] [CrossRef]
- Magoulick, D.D.; Kobza, R.M. The role of refugia for fishes during drought: A review and synthesis. Freshw. Biol. 2003, 48, 1186–1198. [Google Scholar] [CrossRef]
- Unmack, P.J. Fish persistence and fluvial geomorphology in central Australia. J. Arid. Environ. 2001, 49, 653–669. [Google Scholar] [CrossRef]
- Graham, R.; Harris, J.H. Floodplain inundation and fish dynamics in the Murray-Darling Basin. In Current Concepts and Future Research: A Scoping Study; Cooperative Research Centre for Freshwater Ecology: Canberra, Australia, 2005; p. 52. [Google Scholar]
- Sun, J.; He, F.; Zhang, Y.; Liu, B.; Zhou, Q.; Wu, Z. The feeding behavior of grass carp (Ctenopharyngoden idellus) on different types of submerged plants. Acta Hydrobiol. Sin. 2015, 39, 997–1002. [Google Scholar]
- Yang, J.; Pan, X.; Chen, X.; Wang, X.; Zhao, Y.; Li, J.; Li, Z. Overview of the artificial enhancement and release of endemic freshwater fish in China. Zool. Res. 2013, 4, 267–280. [Google Scholar]
- Ministry of Agriculture and Rural Affairs Guiding Opinions on Doing a Good Job in the Restocking and Release of Aquatic Organisms During the 14th Five-Year Plan Period. Agriculture and Fishery Development [2022] No. 1. Available online: https://cjyzbgs.moa.gov.cn/tzgg/201912/t20191227_6334009.htm (accessed on 27 December 2019).
- Jiang, T.; Yang, J.; Xuan, Z.; Chen, X.; Liu, H. Preliminary report on the effects of resource recovery on anadromous Coilia nasus in Poyang Lake under the national 10-year fishing ban. Prog. Fish. Sci. 2022, 1, 24–30. [Google Scholar]
- Yang, S.; Ye, S.; Xu, J.; Li, M.; Liu, H. Evaluation of the effects on “10-year fishing ban” in Poyang Lake ecosystem based on ecopath model. Acta Hydrobiol. Sin. 2024, 48, 1402–1413. [Google Scholar]
Disclaimer/Publisher’s Note: The statements, opinions and data contained in all publications are solely those of the individual author(s) and contributor(s) and not of MDPI and/or the editor(s). MDPI and/or the editor(s) disclaim responsibility for any injury to people or property resulting from any ideas, methods, instructions or products referred to in the content. |
© 2025 by the authors. Licensee MDPI, Basel, Switzerland. This article is an open access article distributed under the terms and conditions of the Creative Commons Attribution (CC BY) license (https://creativecommons.org/licenses/by/4.0/).