Article

The Relationship Between Abundance and Actual Spatial Distribution of Terrestrial Isopods (Oniscidea)

by
Martin Martinka
1,2 and
Ivan Hadrián Tuf
1,*
1
Department of Ecology and Environmental Sciences, Faculty of Science, Palacký University Olomouc, 779 00 Olomouc, Czech Republic
2
East Bohemia Regional Branch, Nature Conservation Agency of the Czech Republic, 530 02 Pardubice, Czech Republic
*
Author to whom correspondence should be addressed.
Diversity 2025, 17(11), 790; https://doi.org/10.3390/d17110790
Submission received: 7 October 2025 / Revised: 4 November 2025 / Accepted: 7 November 2025 / Published: 11 November 2025
(This article belongs to the Section Animal Diversity)

Abstract

(1) Studying the spatial distribution of wingless arthropods restricted to the Earth’s surface presents numerous challenges. In this study, we focused on the spatial distribution of terrestrial isopods (Oniscidea) within a managed forest ecosystem, examining relationships among abundance, variance, occupancy, and clumpiness (i.e., aggregation) to highlight their significant roles in the observed phenomena. (2) Terrestrial isopods were collected using pitfall traps along a gradient spanning deforested and forested areas. For analysis, we employed summary statistics to describe the community using 18 different coefficients. Abundance–variance and abundance–occupancy models, together with Taylor’s power law and ordination symbol plots were performed. (3) Nearly 1000 individuals representing 8 species were identified and analyzed. All species exhibited a clumped distribution; however, Ligidium hypnorum displayed the highest degree of clumpiness, which resulted in notably low frequency and constancy despite its high overall abundance. Shrubs were the habitat with the highest rate of aggregation. Most species concentrated their individuals in just up to 5 of the 75 pitfall traps, with the remaining traps typically containing fewer or no individuals. (4) Species that are highly abundant on a local scale can be surprisingly limited in their spatial distribution, making their assumed dominance questionable and causing them to deviate from established trends. Awareness of species-specific traits and attention to such details can progressively improve the interpretation of observed ecological patterns.

1. Introduction

It is widely recognized that the spatial scale of observation and investigation is crucial to consider when interpreting ecological phenomena [1,2,3,4]. This necessity arises in part from the fact that the distribution of arthropods is typically not random but clumped (aggregated), depending on resources and suitable environmental conditions. Such clumpiness (i.e., clumped distribution) may arise from: (a) individuals that are not directly associated with one another but simply seek similar conditions, and (b) aggregations within suitable environmental conditions, that is, the formation of closer relationships which confer various advantages to individuals in such organizations [4].
Both environmental condition dependency and subsequent aggregation are well-known phenomena in terrestrial isopod communities, most often resulting in a clumped (aggregated) distribution [5,6]. One of the main advantages of forming aggregations for these animals is the reduction in individual water loss, thus conferring greater resistance to drought [7]. Drought resistance is a key trait used to predict species distribution and differs greatly between species [8,9,10,11,12,13]. The complexity of influencing factors is, of course, broader, and these factors coexist with humidity—for example, the availability of suitable food resources [12]. This makes the natural spatial structure of assemblages (and, by extension, communities [14]) dependent on a mosaic of suitable and unsuitable conditions for each species. The complexity of the major biological traits of terrestrial isopods is also considerable and includes morphological, physiological, ecological, and behavioral features [6,15,16]. Some traits differ not only between species, but also between populations and even among individuals of the same species. An example of such a trait is reproductive biology. The underlying mechanisms driving intraspecific differences in reproduction arise from the life history of the population or individual, as a result of biotic and abiotic factors [16].
It is well-established practice to examine the spatial variance of an investigated community. This variance is, once again, scale-dependent, and several mathematical approaches have been developed in the past. The basis of these indices is the variance-to-mean ratio, which numerically expresses clumpiness (i.e., aggregation) in the distribution of species. For most of these methods, values less than 1 indicate a uniform or even distribution, whereas values greater than 1 imply a clumped distribution. The higher the value, the more clumped the distribution. This applies to the simplest method—the variance-to-mean ratio, also known as the index of distribution (VMR) [3,17] and for more robust method—Taylor’s power law as well [18].
He and Gaston [19] and Gaston et al. [20] highlighted the relationship between abundance, variance, and occupancy. These patterns are usually presented separately as bivariate abundance–variance and abundance–occupancy relationships, both showing a positive effect—that is, higher average local abundances are associated with an increase in the number of occupied sites and in spatial variance. This pattern is observed both interspecifically and intraspecifically and appear across taxa and spatial scales [19,20]. Gaston et al. [20] also successfully applied a trivariate abundance–variance–occupancy model, which appears to integrate these key distribution characteristics, making it a highly useful tool for population and community ecologists.
The main aim of this study was to investigate the relationships among abundance, variance, occupancy, and clumpiness in the terrestrial isopod community within three dominant habitats, and to discuss possible ecological traits responsible for the observed trends, such as desiccation resistance and ecomorphological classification for each investigated species.

2. Materials and Methods

2.1. Study Area

Sampling was conducted in the southernmost part of the Javorníky Mountains in Slovakia (Figure 1) across a landscape mosaic of forested and deforested areas (49.0906386 N, 18.3747328 E). Managed forest was dominated by Sessile Oak (Quercus petraea), Scots pine (Pinus sylvestris) and European beech (Fagus sylvatica); deforested area was dominated by Wood small-reed grass (Calamagrostis epigejos) and bramble shrubs (Rubus spp.) We selected three proximate study locations to increase the robustness of our results by providing spatial replication. These locations exhibited nearly identical vegetation characteristics and management history of transmission line corridor (mulching by forestry mower). The slopes of locations 2 and 3 had an eastern aspect, while the slope of location 1 had a western aspect.

2.2. Sampling Design

To sample terrestrial isopods, we installed 75 pitfall traps across abovementioned area during April–June and September–October of 2021, with intervals between the eight sampling periods being two weeks. Each separate location contained 25 pitfall traps; the traps were distributed non-randomly in order to cover all dominant habitat types. In total, 30 traps were placed in the forest, while 45 traps were positioned in the forest clearing, with equal distribution between herbaceous and shrubby sites (22 and 23, respectively). This design enabled us to estimate the dispersion of each species within the studied system. There were no absolute barriers (such as motorways or built-up areas) that would entirely prevent movement between locations; rather, the sites were linked by natural or semi-natural habitats.

2.3. Statistical Analyses

Analyses were conducted in Python 3.12, Canoco 5.0 and PAST: Paleontological Statistics 4.12b [21,22,23]. For summarizing the dataset with basic information, the descriptive statistics in the form of summary statistics in PAST was used. We applied 18 coefficients to characterize the terrestrial isopod community. The “All individuals” coefficient represents the total number of trapped individuals. “Dominance” reflects the proportion of caught individuals of a particular species within the composition of the entire community. “Frequency” indicates the percentage of sites (traps) occupied by a particular species. “Constancy” refers to the percentage of samples in which a particular species was present (i.e., the temporal presence of a species). “Min. per trap” and “Max. per trap” represent the minimum and maximum numbers of trapped individuals in a single trap, respectively. “Mean” is specifically used in the “VMR” coefficient together with the “Variance”. “Standard error” reflects the uncertainty of the estimate, while “Standard deviation” shows the variability within samples. The VMR index (index of distribution) reflects the clumpiness of the distribution: the variance/mean ratio representing clumpiness can be less than 1 for a non-clumped distribution, or greater than 1 for a clumped distribution. VMRt represents total ratio, VMRh represents ratio in herbaceous habitat, VMRs represent ratio in shrubs and VMRf represents ratio in the forest.
We also used supplementary univariate tests performed in PAST such as the Kruskal–Wallis test and Dunn’s post hoc tests to assess whether the distribution of species differed among the three investigated localities.
For a more specific examination of species distribution, we applied abundance–variance and abundance–occupancy models in CANOCO 5 to explore the relationships between these population characteristics. These models were applied for whole system and separately for herbaceous, shrubby and forest habitats.
For investigation of spatial distribution of terrestrial isopods in regard to clumpiness in all three dominant habitats, Taylor’s power law [18] was performed in Python for whole system, as well as separately for three dominant habitats. ANCOVA was used to detect statistically significant differences between habitats in tendency of terrestrial isopods to aggregate.
XY(Z) diagrams performed in CANOCO 5 were used to visualize the abundance–variance and abundance–occupancy models. An ordination symbol plot was then employed to visualize the clumpiness of species’ individuals, i.e., to show the precise spatial distribution of individuals in herbaceous, shrubby and forest habitats. We also graphically compared the total number of individuals with their percentage activity/density attribute by highlighting the three most effective pitfall traps—that is, the three traps with the highest numbers of individuals captured for each species.

3. Results

Altogether, 987 individuals of eight species of terrestrial isopods were collected in 460 samples. The eudominant species were Protracheoniscus politus, Trachelipus ratzeburgii, Ligidium hypnorum and Trachelipus rathkii. Hyloniscus riparius was a dominant species, while Porcellium conspersum, Trichoniscus pusillus and Porcellium collicola were also detected. Porcellium collicola was absent from localities 2 and 3, and T. rathkii was significantly less numerous at locality 2 compared with locality 3 (Kruskal–Wallis test: p = 0.03), but otherwise, the species were distributed across all three localities.
The most abundant species (Table 1) exhibited the highest frequency coefficient, and this coefficient decreased towards the rarest species. However, L. hypnorum did not fit this trend, as its frequency was lower than that of two other, less abundant species. This species also did not follow the trend in constancy; otherwise, this coefficient was highest in the most abundant species and lowest in the rarest one. Ligidium hypnorum showed the maximum number of individuals trapped per trap (see also Figure 2). Both “Standard error” and “Standard deviation” were highest in L. hypnorum and lowest in the rarest species. “Median”, “25 (75) percentile”, and “Mode” did not provide much information in this context. The VMR index indicated a clumped distribution for all species, with the highest value in L. hypnorum, followed by T. rathkii, and the lowest in the rarest species (see also Figure 3). Taylor’s power law revealed the highest clumpiness of whole community in the shrubs (b = 1.8) and weaker, but still clumped distribution in other two habitats (1.5 and 1.5). Difference in clumpiness between habitats was not significant, as was showed by ANCOVA (F = 1.61, p = 0.228). VMR indexes for particular habitats differed substantially between species, but not significantly, as well as differences between habitats in clumpiness for each species separately (Kruskal–Wallis; p > 0.05).
The percentage of individuals trapped by the three most effective traps increased as the total abundance of the species decreased (Figure 2), ranging from approximately 24% of P. politus individuals to 80% of P. collicola individuals. Only L. hypnorum and T. rathkii deviated from this trend. Nearly 60% of all L. hypnorum individuals were captured in just two similarly effective traps, and more than 73% of individuals of this species were caught by only three traps. Only the rarest species, P. collicola, reached higher values.
Ordination space (Figure 3) revealed visible clumps (the largest bubbles) for almost all species except the last two. There were typically up to five large clumps (sites rich in individuals), while the remaining sites contained smaller numbers or none at all. The degree of this pattern was not consistent across species, which also differed in their affinity for habitat. Protracheoniscus politus was the most ubiquitous species, occurring and aggregating across the entire environmental gradient (80% of the traps), whereas T. ratzeburgii was more restricted to certain environmental conditions, aggregating only in the forest and the shrubs, although it was still relatively widespread (57% of the traps). Ligidium hypnorum was clearly limited to specific patches (particularly two or three of them, respectively) where it reached high abundance, but was absent from most other patches (present in 24% of the traps), and its occurrence was also highly time-restricted (as indicated by the constancy coefficient). Clumps were created only in the forest and the shrubs. Trachelipus rathkii exhibited a reverse preference for environmental conditions compared with the first three species and was found in 40% of the traps. This species created clumps only in herbaceous and shrubby sites. Hyloniscus riparius, despite its lower abundance, was detected at more patches than the much more abundant L. hypnorum (28% of the traps) and was present across a broader environmental gradient. Porcellium conspersum showed smaller clumps across whole gradient (17% of the traps).
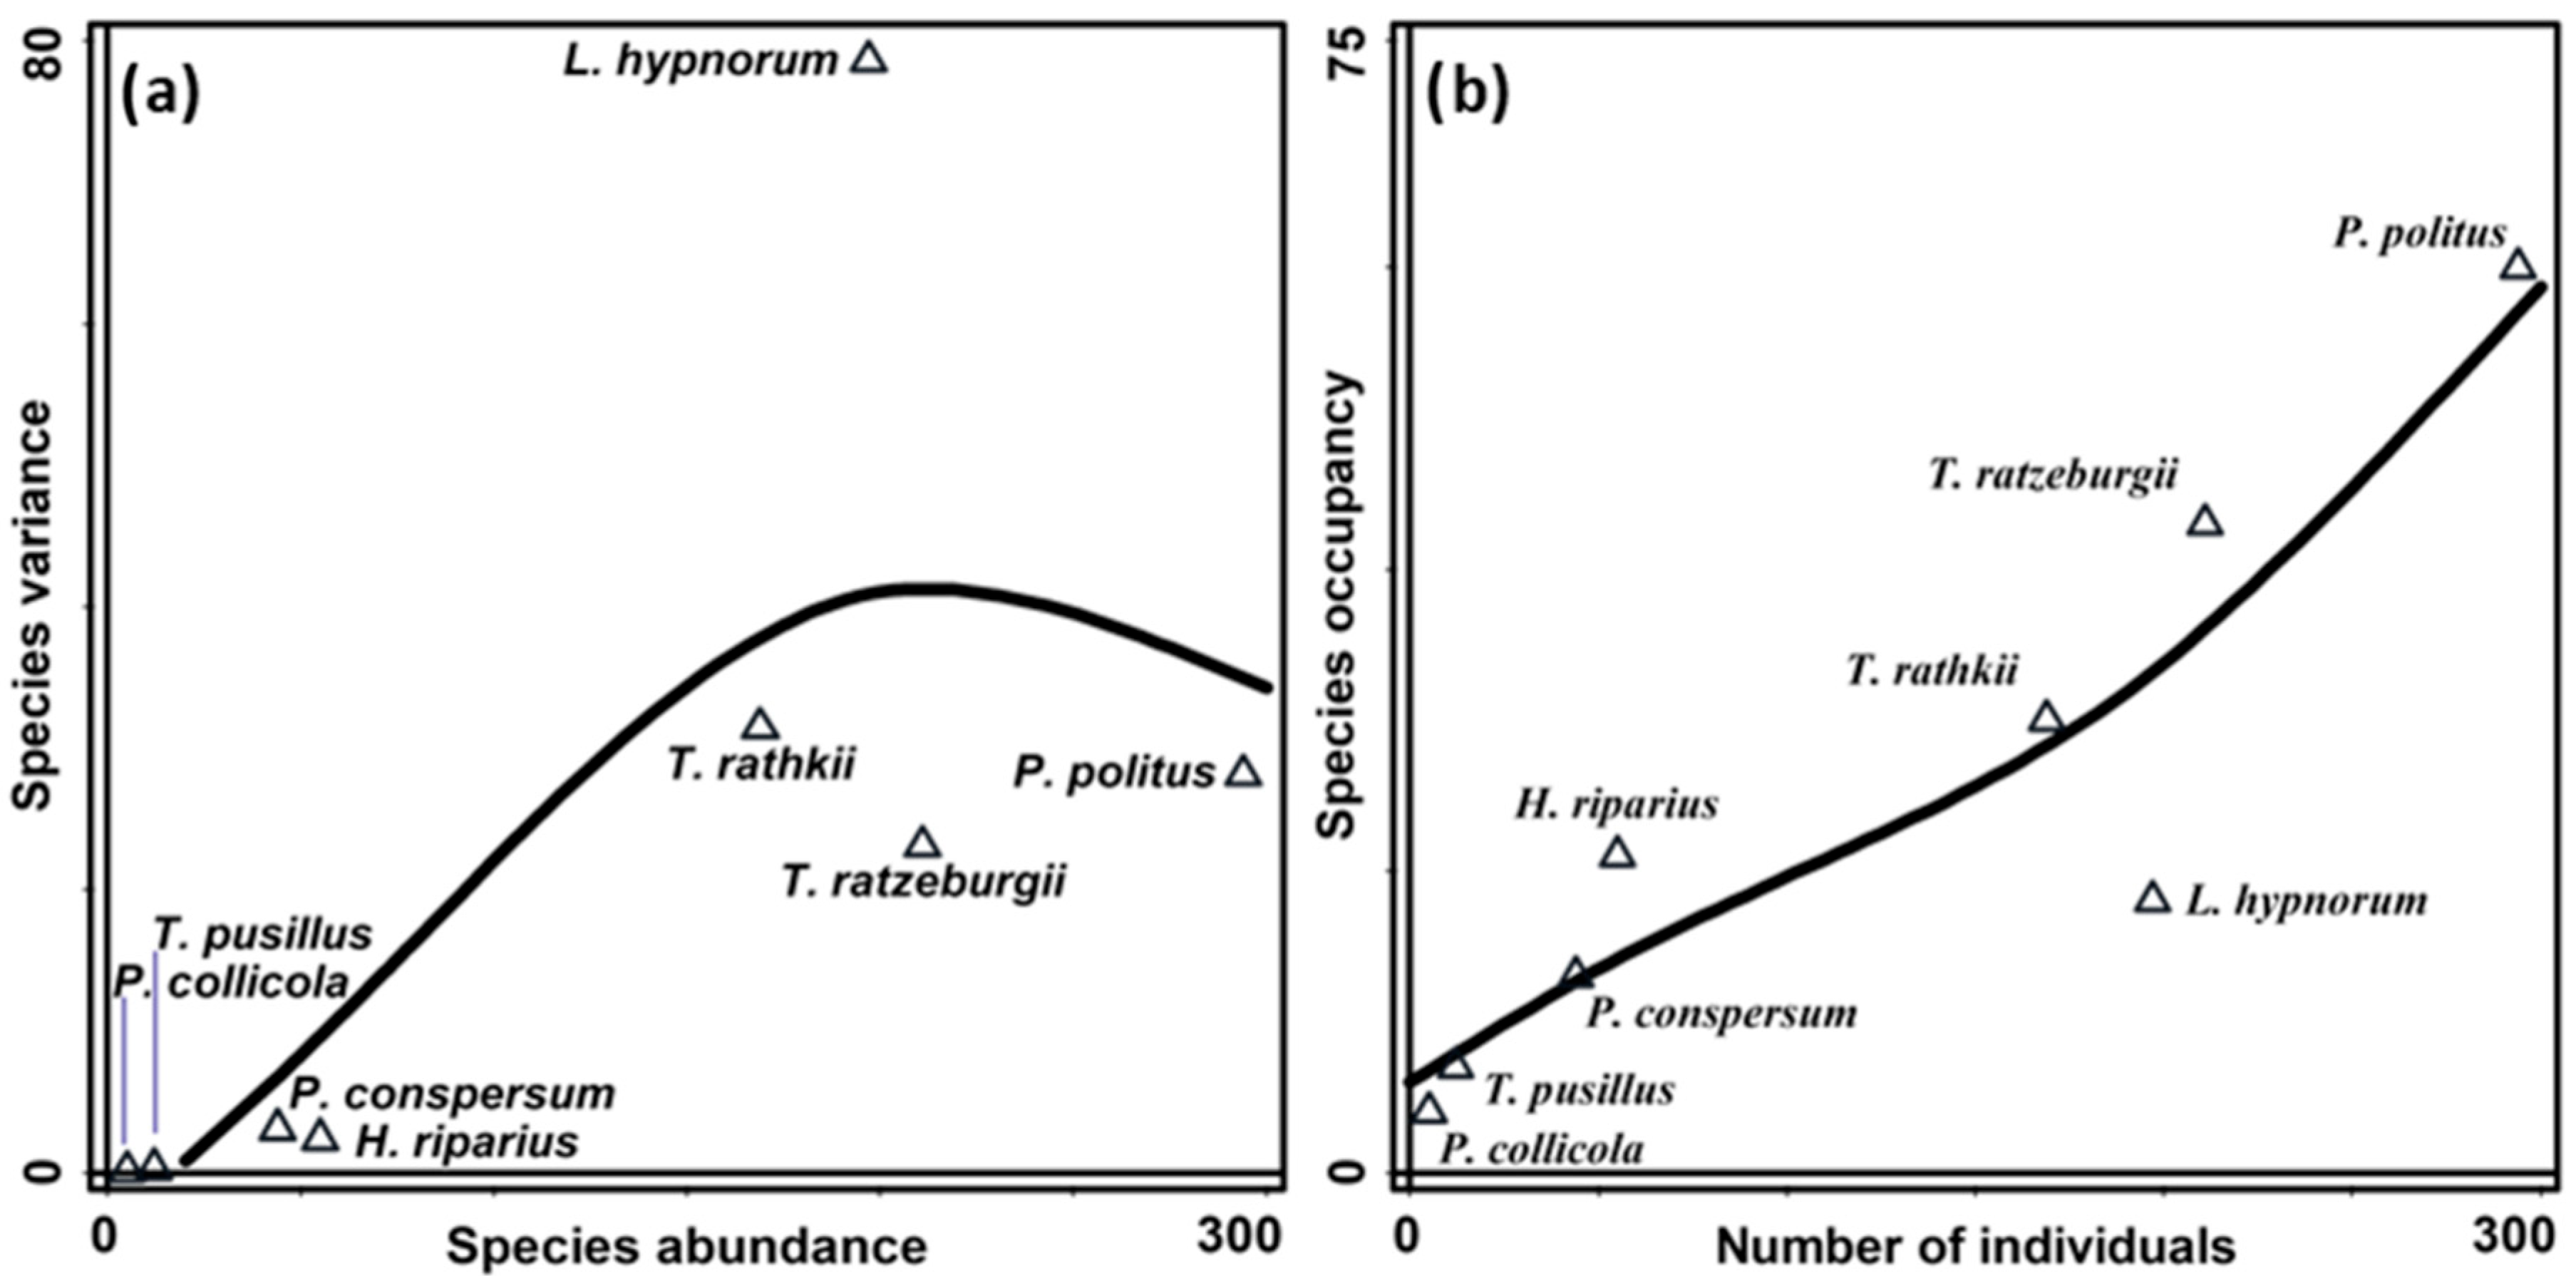
The abundance–variance model for whole system (Figure 4) showed a pattern of increasing variance with increasing abundance, although this relationship was not statistically significant (F = 4.1, p = 0.08989). All but one species followed this trend, progressing from the rarest to the most common. Ligidium hypnorum did not follow the trend and exhibited distinctly higher variance than all other species. Weak, statistically not significant pattern was observed in shrubby (F = 4.2, p = 0.08468) and forest (F = 3.2, p = 0.12914) habitats. Conversely, this positive trend was statistically strong in herbaceous habitat (F = 276.2, p < 0.00001).
The abundance–occupancy model for whole system (Figure 4) was significant (F = 16.0, p = 0.00672) and demonstrated a positive relationship between abundance and occupancy. Once again, only L. hypnorum deviated from the trend, occurring less frequently than would be expected based on the overall pattern. Trend was strong in herbaceous habitat (F = 140.0, p = 0.00004) and significant in forest, too (F = 10.8, p = 0.01523). Model was not significant in shrubby habitat (F = 5.3, p = 0.05823).

4. Discussion

The aim of this study was to characterize distributional properties—abundance, variance, occupancy, and aggregation (clumping)—in the examined terrestrial isopod community, and to relate species-specific traits to the observed trends and deviations.
Several community-wide trends emerged. Most notably, all species exhibited clumped distributions, ranging from weak (in rare species) to very strong (in L. hypnorum). This pattern is supported by the VMR and Taylor’s power law [18,19]. Clumped distributions are well documented in terrestrial isopods, reflecting both dependence on favorable environmental conditions and aggregation behavior, which reduces desiccation risk and confers other benefits [4,7]. The strength of this trend varied markedly among species, likely owing to differences in traits and, consequently, species-specific responses to habitat filtering and dispersal limitation [6,15].
Another clear pattern was observed in shrubland—the only habitat in which species with differing habitat preferences formed substantial aggregations—making it a shared habitat for P. politus, T. ratzeburgii, L. hypnorum, T. rathkii, and others. Community-level clumping was also highest in this habitat. Shrubland, however, was the most spatially restricted habitat. We speculate that the conditions sought by the focal species were more concentrated there than in the more extensive herbaceous and forest habitats, resulting in elevated activity/density around pitfall traps within shrub stands. This may be informative for understanding the relationship between aggregation and the habitat-filtering hypothesis. A similar pattern was reported by Tajovský et al. [24], who found greater activity/density of terrestrial isopods in smaller forest fragments than in larger ones.
We observed the well-known positive abundance–variance and abundance–occupancy relationships, the latter being strongly significant. However, highly clumped species with narrow ecological valence (e.g., L. hypnorum) may disrupt these patterns by combining environmental sensitivity with high local abundance. This raises the question of actual versus putative dominance and how it should be defined across spatial scales [2,18,19]. Even without a full trivariate abundance–variance–occupancy model, the very low occupancy and extremely high local abundance of L. hypnorum likely exerted a strong influence on the variance parameter, producing the observed deviation in abundance–variance–occupancy space as well [19,20]. Moreover, despite substantial differences in clumping across habitats and species, the pronounced variance in L. hypnorum may explain the non-significant results in tests of those differences.
Protracheoniscus politus is an abundant forest or eurytopic species [25,26,27,28,29,30]. It was the most abundant species in this study, both in absolute counts and in frequency of occurrence (i.e., the number of traps in which it was present). Unlike most other species, it occurred—albeit unevenly—across the entire environmental gradient. As expected, both variance and occupancy were highest relative to other species, except for L. hypnorum, which exceeded P. politus in variance [19,20]. Although P. politus is not considered highly resistant to desiccation [10], its considerable activity/density across studies and environments may be explained by peak activity during periods of higher relative humidity (twilight, night, early morning) [28,31]. It is also fairly agile and mobile and has been classified as an eco-morphological “runner” [15]. Species with such distributions may be less susceptible to the “double jeopardy” of extinction risk arising from low local abundance and low occupancy [32,33].
Trachelipus ratzeburgii, the second most abundant species, showed relatively consistent occurrence across the three localities, but in ordination space it exhibited a stronger habitat affinity than P. politus. Its distribution also appeared more clumped, likely reflecting this affinity. The species is widely associated with at least semi-natural forests containing dead and decaying wood and may also be found in drier parts of such environments [34,35,36]. Its absence from the herbaceous portion of the ordination space may therefore reflect food preference rather than climate per se—although the species’ desiccation resistance, an important trait shaping macro-detritivore distributions along with food availability, remains unknown [12]. Gerlach [37] reported that T. ratzeburgii consumed twice as much leaf litter as its open-habitat relative T. rathkii, suggesting that forests may provide richer conditions and that individuals may be more selective in where they are active or densely aggregated, as observed here.
Ligidium hypnorum, although highly abundant in absolute numbers, occurred in a much smaller fraction of traps (24%), and its VMR was by far the highest among all species, indicating pronounced aggregation. This aspect of its spatial distribution is evident in ordination space and manifests as a deviation in the abundance–variance and abundance–occupancy relationships. The species is strongly hygrophilous and is known from damp habitats [38,39,40]. As a member of Ligiidae, it lacks true pleopodal lungs; instead, the pleopods function more like gills, rendering the species vulnerable to water loss [6,41,42]. This vulnerability has been confirmed experimentally, with high water-loss rates and remarkably low desiccation resistance [9]. In our study, L. hypnorum thrived in certain patches where it was highly abundant or active, but the probability of encountering such patches across the three localities was relatively low. Moreover, its occurrence was temporally restricted, likely reflecting increased activity under suitable conditions. Thus, its apparent dominance in the study area is questionable. Similar outliers were noted by Gaston et al. [20] in the Azores among highly specialized, often endemic, species. Although L. hypnorum is neither endemic nor rare in Slovakia, its strong moisture dependence yields patterns similar to variously restricted species. It is unlikely that the species would go extinct locally due to a stochastic event as discussed by Rigal et al. [33], but local populations may be substantially weakened by such events. Crucially, this inference is scale-dependent, once again underscoring the scale dependence of these trends [2] and highlighting the importance of ecological traits and species identity in ecological prediction.
Trachelipus rathkii exhibited the second-highest degree of clumping in the community, with nearly one third of all individuals captured in just two adjacent traps. It was the only eudominant species that was significantly less common at one of the three localities. The preceding three species are well-known forest inhabitants, which makes their relatively homogeneous distributions across localities unsurprising given the continuous, largely undisturbed forest studied. By contrast, T. rathkii avoided forest at these sites and likely faced more substantial soft barriers among localities, such as steep ravines, dirt roads, wetlands, and extensive short-stemmed meadows [36]. The species typically occupies open habitats with a relatively broad ecological valence and may occur in forests, mainly in sparse woodlands or at edges; its presence can depend on season, being less common in grasslands during summer. Trachelipus rathkii is also recognized as a pioneer species, often among the first colonizers of disturbed habitats in the initial stages of succession [30,36,43]. This may confer an advantage in periodically maintained semi-natural habitats, such as beneath transmission power lines where vegetation is regularly and patchily removed. Consistent with metapopulation theory [44], T. rathkii can rapidly colonize disturbed patches from source populations with large numbers of individuals, potentially explaining its dominance at sites lacking forest species because those sites were located within a power-line clearing.
Hyloniscus riparius occurred across much of the environmental gradient, avoiding only its extremes, and appeared more frequently on the open-habitat side of the gradient. Despite its relatively low total abundance, the three most effective traps captured proportionally fewer individuals than in the two dominant species, L. hypnorum and T. rathkii. Together with its ordination pattern, this suggests that H. riparius is less clumped than expected given its abundance and environmental requirements. Hyloniscus riparius is considered hygrophilous [25,45]. In this system, however, it occurred on the same side of the gradient as T. rathkii, where L. hypnorum was extremely scarce. This may reflect differences in pleopodal morphology, as discussed above, and the smaller body size of H. riparius may also facilitate use of moist microhabitats in open sites by allowing individuals to fit into smaller shelters. Notably, H. riparius was not particularly abundant overall at the study localities.
Porcellium conspersum showed a clear affinity for the shadier portion of the gradient, although it was also found at open sites. Tuf and Jeřábková [28] observed this species to be most active in forests and, importantly, during daylight hours. They concluded that its desiccation resistance may therefore be considerable, a view supported by Dias et al. [9], who reported a relatively slow loss of water during the first hour of experiments on this species. The increased activity observed in shaded areas further supports its daytime activity.
Trichoniscus pusillus, represented by only 12 individuals, was present at all three localities but very rare at the first two, with just two individuals captured in a single trap at each. It was distributed mainly in the middle of the gradient and, similar to H. riparius, may be restricted to moist microsites that provide shelter, as the species is highly sensitive to desiccation—even more so than L. hypnorum [9,11,43]. Among all trapped species, T. pusillus is the most endogeic, and its pattern in pitfall traps may be influenced by soil compaction. Similarly, Tuf and Jeřábková [28] found this species not in floodplain forest but in clear-cuts where the soil had been compacted by forestry machinery.
Interpretation of system-level characteristics is constrained by the use of pitfall traps. Pitfall trapping is selective, and species differ in their probability of capture (trappability). The resulting metric is activity/density; consequently, more agile and active species are more likely to be caught than less active species. The results should therefore be interpreted with these limitations in mind, and species are best discussed individually rather than directly compared. We accounted for these limitations, although comparisons could not be avoided entirely; where made, they were approached cautiously and in light of species-specific ecological traits [46,47].

5. Conclusions

The investigation of terrestrial isopods in their natural environment always raises a range of questions and uncertainties. Today, we have a detailed understanding of particular species and their unique morphological, physiological, ecological, and behavioral traits, which, combined with proven statistical models, allow us to reveal not only general trends but also individual deviations from these patterns. In this study, we analyzed the distribution patterns of woodlice.
All species exhibited unique distributional patterns. Although all were aggregated, the species highly sensitive to drought (L. hypnorum) was extremely clumped, and a high overall abundance may not in itself be a meaningful feature when the so-called dominant species is restricted to only a few microhabitats within the area. Well-established positive relationships of abundance–variance and abundance–occupancy are relevant in terrestrial isopod communities across habitats as well, but ecological traits of particular species can cause deviations from these trends and may weaken them. Species-specific knowledge is therefore necessary to successfully interpret such deviations. Species, according to their ecological preferences, are not evenly distributed across the environmental gradient. The widespread T. rathkii may be dominant at particular locations but may have difficulty dispersing between fragmented habitats if surrounded by forest. The eurytopic P. politus and H. riparius may disperse and aggregate across the entire gradient, while L. hypnorum, T. ratzeburgii, T. rathkii, and P. conspersum show affinity for more specific zones of the gradient. Species of the whole environmental gradient aggregated substantially in the shrubby habitat. The chosen spatial scale is essential, ranging from small patches—where highly clumped species can be either eudominant or entirely absent—to the level of particular locations, between which some species can disperse easily while others struggle to do so, and up to the overall scale, where the real distribution can be observed with all its aspects, such as abundance, variance, occupancy, or clumpiness.

Author Contributions

Conceptualization, M.M. and I.H.T.; methodology, M.M.; formal analysis, M.M.; investigation, M.M.; resources, I.H.T.; writing—original draft preparation, M.M.; writing—review and editing, M.M. and I.H.T.; supervision, I.H.T. All authors have read and agreed to the published version of the manuscript.

Funding

This research was funded by the Internal Grant Agency of the Faculty of Science of Palacký University Olomouc, grants number IGA_PrF_2023_013, IGA_PrF_2024_014 and IGA_PrF_2025_017.

Institutional Review Board Statement

Not applicable.

Data Availability Statement

The raw data supporting the conclusions of this article will be made available by M.M. on request.

Acknowledgments

We thank anonymous reviewers for their careful reading of our manuscript and their comments and suggestions.

Conflicts of Interest

The authors declare no conflicts of interest.

References

  1. Whittaker, R.H. Evolution and measurement of species diversity. Taxon 1972, 21, 213–251. [Google Scholar] [CrossRef]
  2. Levin, S.A. The problem of pattern and scale in ecology: The Robert H. MacArthur award lecture. Ecology 1992, 73, 1943–1967. [Google Scholar] [CrossRef]
  3. Horne, J.K.; Schneider, D.C. Spatial variance in ecology. Oikos 1995, 74, 18–26. [Google Scholar] [CrossRef]
  4. Nielsen, U.N. Soil Fauna Assemblages: Global to Local Scales; Cambridge University Press: Cambridge, UK, 2019. [Google Scholar] [CrossRef]
  5. Sutton, S. Woodlice; Pergamon Press: Oxford, UK, 1980. [Google Scholar]
  6. Hornung, E. Evolutionary adaptation of oniscidean isopods to terrestrial life: Structure, physiology and behavior. Terr. Arthropod Rev. 2011, 4, 95–130. [Google Scholar] [CrossRef]
  7. Allee, W.C. Studies in animal aggregations: Causes and effects of bunching in land isopods. J. Exp. Zool. 1926, 45, 255–277. [Google Scholar] [CrossRef]
  8. David, J.-F.; Handa, I.T. The ecology of saprophagous macroarthropods (millipedes, woodlice) in the context of global change. Biol. Rev. 2010, 85, 881–895. [Google Scholar] [CrossRef] [PubMed]
  9. Dias, A.T.C.; Krab, E.J.; Mariën, J.; Zimmer, M.; Cornelissen, J.H.C.; Ellers, J.; Wardle, D.A.; Berg, M.P. Traits underpinning desiccation resistance explain distribution patterns of terrestrial isopods. Oecologia 2013, 172, 667–677. [Google Scholar] [CrossRef] [PubMed]
  10. Csonka, D.; Halasy, K.; Buczkó, K.; Hornung, E. Morphological traits—Desiccation resistance—Habitat characteristics: A possible key for distribution in woodlice (Isopoda, Oniscidea). ZooKeys 2018, 801, 481–499. [Google Scholar] [CrossRef] [PubMed]
  11. De Smedt, P.; Baeten, L.; Berg, M.P.; Gallet-Moron, E.; Brunet, J.; Cousins, S.A.O.; Decocq, G.; Diekmann, M.; Giffard, B.; De Frenne, P.; et al. Desiccation resistance determines distribution of woodlice along forest edge-to-interior gradients. Eur. J. Soil Biol. 2018, 85, 1–3. [Google Scholar] [CrossRef]
  12. De Smedt, P.; Baeten, L.; Proesmans, W.; Berg, M.P.; Brunet, J.; Cousins, S.A.O.; Decocq, G.; Deconchat, M.; Diekmann, M.; Gallet-Moron, E.; et al. Linking macrodetritivore distribution to desiccation resistance in small forest fragments embedded in agricultural landscapes in Europe. Landsc. Ecol. 2018, 33, 407–421. [Google Scholar] [CrossRef]
  13. Sfenthourakis, S.; Hornung, E. Isopod distribution and climate change. ZooKeys 2018, 801, 25–61. [Google Scholar] [CrossRef]
  14. Stroud, J.T.; Bush, M.R.; Ladd, M.C.; Nowicki, R.J.; Shantz, A.A.; Sweatman, J. Is a community still a community? Reviewing definitions of key terms in community ecology. Ecol. Evol. 2015, 5, 4757–4765. [Google Scholar] [CrossRef]
  15. Schmalfuss, H. Eco-morphological strategies in terrestrial isopods. Symp. Zool. Soc. Lond. 1984, 53, 49–63. [Google Scholar]
  16. Kight, S. Reproductive ecology of terrestrial isopods (Crustacea: Oniscidea). Terr. Arthropod Rev. 2009, 1, 95–110. [Google Scholar] [CrossRef]
  17. Upton, G.J.G.; Cook, I. A Dictionary of Statistics: The Invaluable Guide to All Aspects of Statistics, 2nd ed.; Oxford University Press: Oxford, UK, 2011. [Google Scholar]
  18. Taylor, L.R. Aggregation, variance and the mean. Nature 1961, 189, 732–735. [Google Scholar] [CrossRef]
  19. He, F.; Gaston, K.J. Occupancy, spatial variance, and the abundance of species. Am. Nat. 2003, 162, 366–375. [Google Scholar] [CrossRef]
  20. Gaston, K.J.; Borges, P.A.V.; He, F.; Gaspar, C. Abundance, spatial variance and occupancy: Arthropod species distribution in the Azores. J. Anim. Ecol. 2006, 75, 646–656. [Google Scholar] [CrossRef]
  21. Python Software Foundation. Python: A Programming Language for Statistical and Scientific Computing, Version 3.12; Python Software Foundation: Wilmington, DE, USA, 2025; Available online: https://www.python.org/ (accessed on 25 October 2025).
  22. Hammer, O.; Harper, D.; Ryan, P. PAST: Paleontological Statistics Software Package for Education and Data Analysis. Palaeontol. Electron. 2001, 4, 1–9. [Google Scholar]
  23. Šmilauer, P.; Lepš, J. Multivariate Analysis of Ecological Data Using Canoco 5, 2nd ed.; Cambridge University Press: Cambridge, UK, 2014. [Google Scholar]
  24. Tajovský, K.; Schlaghamerský, J.; Pižl, V.; Kučerová, A. Assemblages of Terrestrial Isopods (Isopoda, Oniscidea) in a Fragmented Forest Landscape in Central Europe. ZooKeys 2012, 176, 171–188. [Google Scholar] [CrossRef] [PubMed]
  25. Tajovský, K. Terrestrial isopods (Isopoda: Oniscidea) of the Kokořínsko PLA. Bohemia Cent. 2006, 27, 189–197. [Google Scholar]
  26. Tajovský, K. Terrestrial isopods (Isopoda: Oniscidea) of the Křivoklátsko PLA and BR. Bohemia Cent. 2011, 32, 275–283. [Google Scholar]
  27. Tajovský, K. Terrestrial isopods (Isopoda: Oniscidea) of the Brdy Protected Landscape Area. Bohemia Cent. 2018, 39, 205–218. [Google Scholar]
  28. Tuf, I.H.; Jeřábková, E. Diurnal epigeic activity of terrestrial isopods (Isopoda: Oniscidea). In Proceedings of the International Symposium of Terrestrial Isopod Biology—ISTIB-07; Zimmer, M., Charfi-Cheikhrouha, F., Taiti, S., Eds.; Shaker Verlag: Aachen, Germany, 2008; pp. 167–172. [Google Scholar]
  29. Antonović, I.; Brigić, A.; Sedlar, Z.; Bedek, J.; Šoštarić, R. Terrestrial isopod community as indicator of succession in a peat bog. ZooKeys 2012, 176, 171–188. [Google Scholar] [CrossRef]
  30. Tajovský, K.; Štrichelová, J.; Tuf, I.H. Terrestrial isopods (Oniscidea) of the White Carpathians (Czech Republic and Slovakia). ZooKeys 2018, 801, 305–321. [Google Scholar] [CrossRef]
  31. Ilosvay, G. A talajfelszínen mozgó állatok napszakos aktivitásának vuzsgálata a farkasgyepüi bükkösben. Folia Musei Hist. Nat. Bakony. 1982, 1, 171–180. [Google Scholar]
  32. Lawton, J.H. Range, population abundance and conservation. Trends Ecol. Evol. 1993, 8, 409e413. [Google Scholar] [CrossRef] [PubMed]
  33. Rigal, F.; Whittaker, R.J.; Triantis, K.A.; Borges, P.A.V. Integration of non-indigenous species within the interspecific abundance-occupancy relationship. Acta Oecologica—Int. J. Ecol. 2013, 48, 69–75. [Google Scholar] [CrossRef]
  34. Korsós, Z.; Hornung, E.; Szlávecz, K.; Kontschán, J. Isopoda and Diplopoda of urban habitats: New data to the fauna of Budapest. Ann. Hist.-Nat. Musei Natl. Hung. 2002, 94, 193–208. [Google Scholar]
  35. Hornung, E.; Tóthmérész, B.; Magura, T.; Vilisics, F. Changes of isopod assemblages along an urban–suburban–rural gradient in Hungary. Eur. J. Soil Biol. 2007, 43, 158–165. [Google Scholar] [CrossRef]
  36. Tomescu, N.; Teodor, L.; Ferenti, S.; Covaciu-Marcov, S.-D. Trachelipus species (Crustacea, Isopoda, Oniscidea) in Romanian fauna: Morphology, ecology, and geographic distribution. North-West. J. Zool. 2015, 11 (Suppl. 1), S1–S106. [Google Scholar]
  37. Gerlach, A.; Russell, D.J.; Jaeschke, B.; Römbke, J. Feeding preferences of native terrestrial isopod species (Oniscoidea, Isopoda) for native and introduced leaf litter. Appl. Soil Ecol. 2014, 83, 95–100. [Google Scholar] [CrossRef]
  38. Harding, P.T.; Sutton, S.L. Woodlice in Britain and Ireland: Distribution and Habitat; Biological Records Centre, Institute of Terrestrial Ecology: Huntingdon, UK, 1985. [Google Scholar]
  39. Oliver, P.G.; Meechan, C.J. Woodlice; Field Studies Council: Shrewsbury, UK, 1993. [Google Scholar]
  40. Judas, M.; Hauser, H. Patterns of isopod distribution: From small to large scale. Isr. J. Zool. 1998, 44, 333–343. [Google Scholar]
  41. Orsavová, J.; Tuf, I.H. Woodlice: Distribution Atlas in the Czech Republic and Bibliography 1840–2018; Muzeum Regionu Valašsko & Muzeum Jihovýchodní Moravy: Zlín, Czech Republic, 2018. [Google Scholar]
  42. Inui, N.; Kimbara, R.; Yamaguchi, H.; Miura, T. Pleopodal lung development in a terrestrial isopod, Porcellio scaber (Oniscidea). Arthropod Struct. Dev. 2022, 71, 101210. [Google Scholar] [CrossRef]
  43. Boeraeve, P.; Arijs, G.; Segers, S.; De Smedt, P. Habitat and seasonal activity patterns of the terrestrial isopods (Isopoda: Oniscidea) of Belgium. Belg. J. Entomol. 2021, 116, 1–95. [Google Scholar]
  44. MacArthur, R.H.; Wilson, E.O. The Theory of Island Biogeography; Princeton University Press: Princeton, NJ, USA, 2001. [Google Scholar]
  45. Vilisics, F.; Elek, Z.; Lövei, G.L.; Hornung, E. Composition of terrestrial isopod assemblages along an urbanisation gradient in Denmark. Pedobiologia 2007, 51, 45–53. [Google Scholar] [CrossRef]
  46. Adis, J. Problems of interpreting arthropod sampling with pitfall traps. Zool. Anz. 1979, 202, 177–184. [Google Scholar]
  47. Topping, C.J.; Sunderland, K.D. Limitations to the use of pitfall traps in ecological studies exemplified by a study of spiders in a field of winter wheat. J. Appl. Ecol. 1992, 29, 485–491. [Google Scholar] [CrossRef]
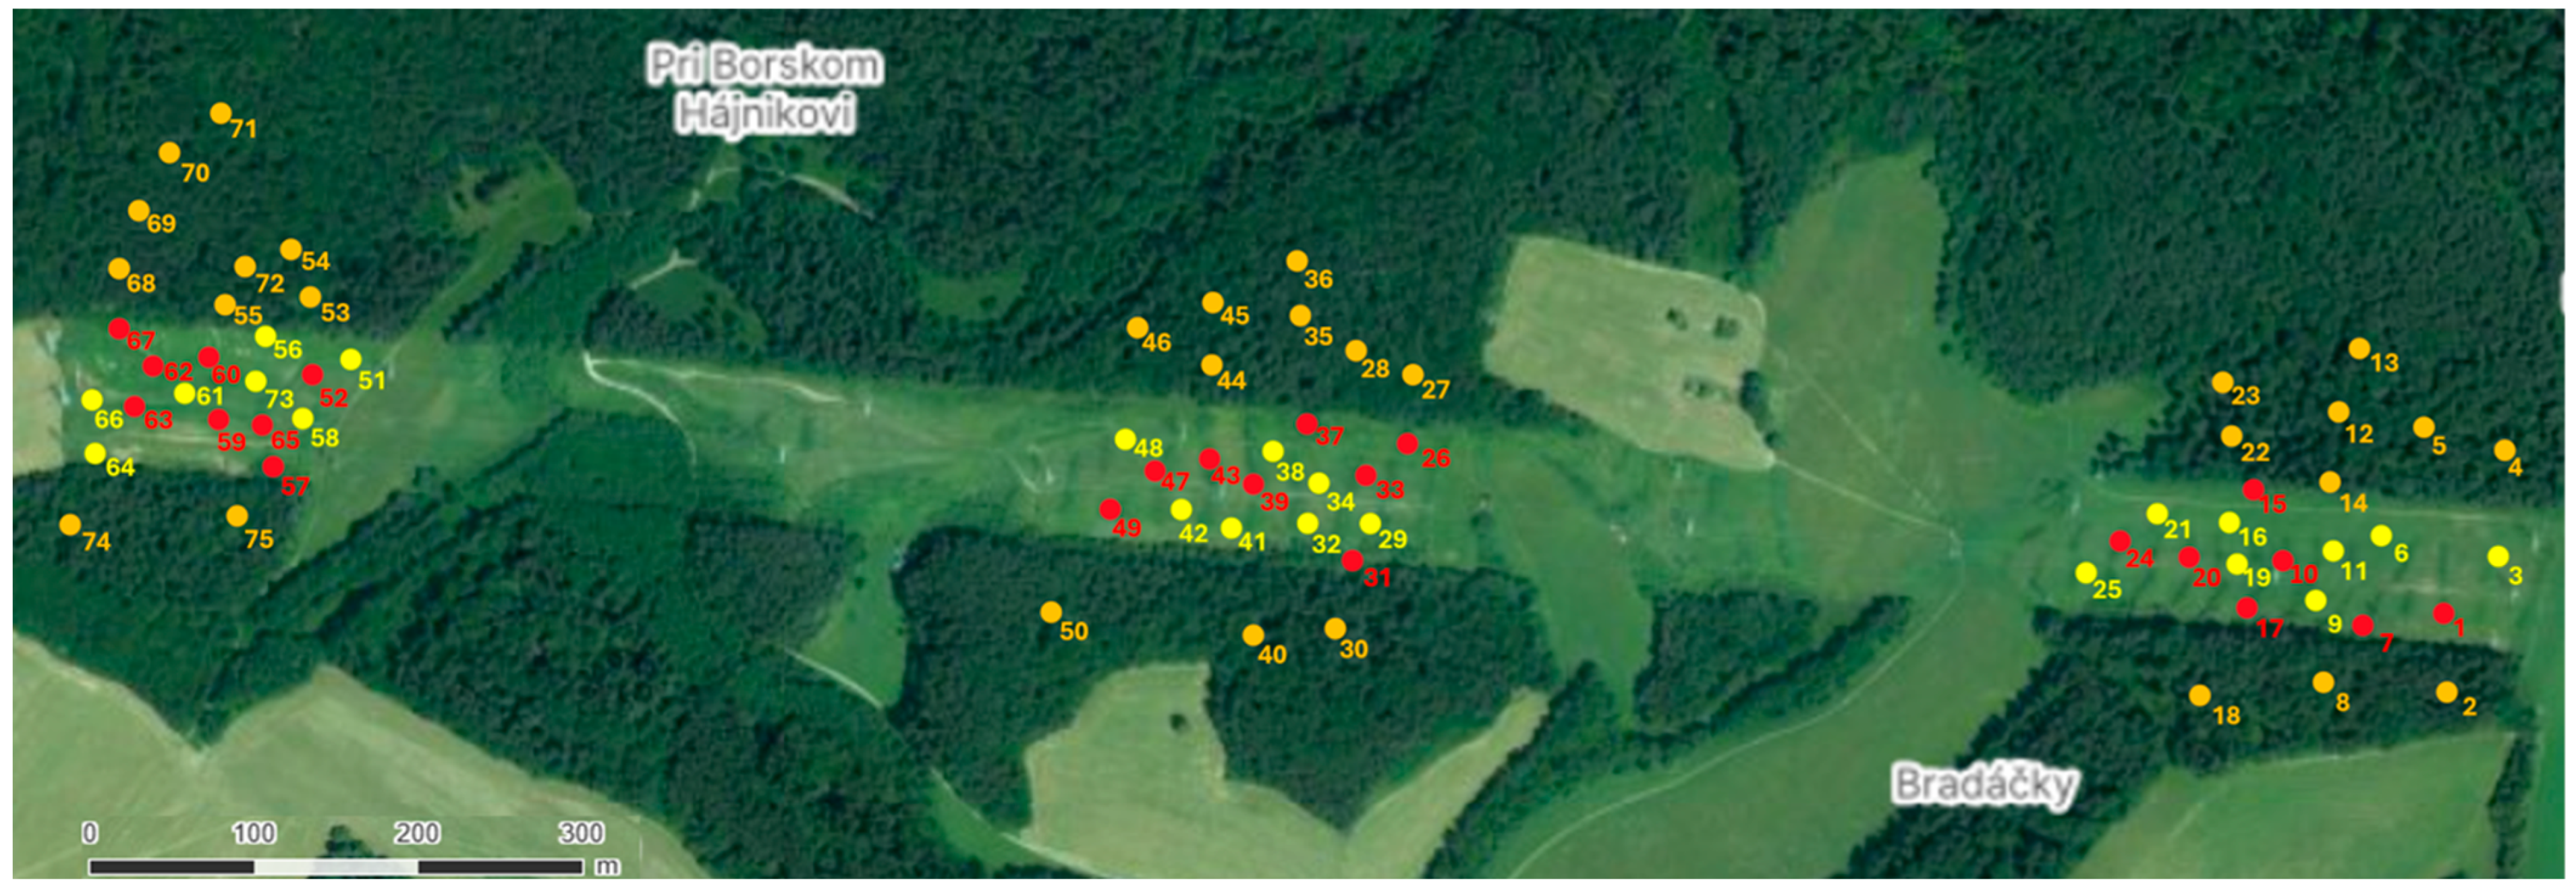
Figure 1. Study area with 75 pitfall traps. Yellow dots represent traps in herbaceous areas, red dots represent traps in bramble shrubs and orange dots represent traps in the forest. Yellow colour for traps in herbaceous area was used here instead of later green color for better visibility. Photo taken from mapy.com (accessed on 23 October 2025).
Diversity 17 00790 g001
Figure 2. Quantity of individuals (main axis with species columns) and percentage of individuals captured by the three most effective traps (secondary axis and MAX1, MAX2, MAX3 dots). The effectiveness of each trap is evaluated for each species separately, not for the whole community.
Diversity 17 00790 g002
Figure 3. Ordination symbol plot: Each point represents a trap. Green points represent the position of traps in herbaceous sites, red points represent traps in shrubs and orange points represent traps in the forest. Green colour for traps in herbaceous area was used here instead of the previous (Figure 1) yellow colour for better visibility. The distance between the points approximates the dissimilarity of their species composition as measured by their chi-squared distance. The size of the points, together with the number, indicates the quantity of individuals found in the trap during the entire duration of this research. The size of the points corresponds between species. The + symbol represents traps in which the particular species was absent.
Diversity 17 00790 g003
Figure 4. Generalized additive models of relationships between abundance and (a) species variance and (b) species occupancy. Variance reflects whether species are consistently present across samples (low variance) or whether their presence varies significantly between samples (high variance). Occupancy is proportion of sites where species occur. The triangles for each species are positioned according to their abundance–variance and abundance–occupancy relationships.
Diversity 17 00790 g004
Table 1. Summary statistics of the community: 15 coefficients used to describe the distributional characteristics of each species individually. VMR = Variance/mean ratio representing clumpiness in distribution: values < 1 indicate a non-clumped distribution; values ≥ 1 indicate a clumped distribution.
P. politusT. ratzeburgiiL. hypnorumT. rathkiiH. ripariusP. conspersumT. pusillusP. collicola
All individuals2942111971695544125
Dominance302120176411
Frequency80572440281795
Constancy25197137521
Min. per trap00000000
Max. per trap3225513091132
Mean3.92.82.62.30.70.60.20.1
Standard Error0.60.61.00.60.20.20.10.0
Variance28.223.178.631.52.43.10.30.1
Standard Dev.5.34.88.95.61.51.80.50.3
Median21000000
25 percentile10000000
75 percentile53021000
Mode10000000
VMRt7.28.229.914.03.35.31.91.4
VMRh11.83.22.910.54.66.822
VMRs5.911.634.716.41.83.81.80.1
VMRf4.55.628.312.74.311
Disclaimer/Publisher’s Note: The statements, opinions and data contained in all publications are solely those of the individual author(s) and contributor(s) and not of MDPI and/or the editor(s). MDPI and/or the editor(s) disclaim responsibility for any injury to people or property resulting from any ideas, methods, instructions or products referred to in the content.