Article

Establishment of a COI Haplotype Baseline and Genetic Diversity Evaluation of Vespa soror (Hymenoptera: Vespidae) in Southern China Based on Mitochondrial Gene Sequences

1
College of Agronomy, Chuxiong Normal University, Chuxiong 675000, China
2
College of Forestry, Southwest Forestry University, Kunming 650224, China
*
Authors to whom correspondence should be addressed.
These authors contributed equally to this work.
Diversity 2025, 17(11), 756; https://doi.org/10.3390/d17110756
Submission received: 16 September 2025 / Revised: 16 October 2025 / Accepted: 22 October 2025 / Published: 28 October 2025
(This article belongs to the Special Issue Diversity, Biodiversity, Threats and Conservation of Arthropods)

Abstract

Vespa soror, is an important resource insect that is widely distributed in China. However, there have been few reports on the genetic diversity of this species so far. We based our study on Cytochrome c Oxidase Subunit I (COI) gene as a molecular marker, to estimate the genetic diversity of V. soror. The length of the COI gene is 614 base pairs (bp), and a total of 26 haplotypes were obtained. Among these haplotypes, Hap_3 and Hap_13 are the dominant haplotypes. Overall, V. soror exhibits high genetic diversity, with a haplotype diversity (Hd) of 0.941 ± 0.010 and a nucleotide diversity (Pi) of 0.01068 ± 0.00079. Significant genetic differentiation has occurred among populations, with pairwise Fixation Index (Fst) values greater than 0.25 accounting for over two-thirds of all comparisons. The overall FST value was 0.47872. Despite fluctuations in the degree of genetic differentiation among different populations (−0.076 to 1.00), the overall level of genetic differentiation remained within a relatively high range. For most populations, the Tajima’s D and Fu’s Fs test results were positive, and both were non-significant (p > 0.10). AMOVA attributed 15.82%, 36.37%, and 47.81% of total variation to among-group, among-population within-group, and within-population variation, respectively. Overall, it exhibits high genetic diversity, significant genetic differentiation.

1. Introduction

The Vespa soror, belonging to the subfamily Vespinae, family Vespidae, infraorder Aculeata, suborder Apocrita, and order Hymenoptera [1]. V. soror is an important insect with significant ecological and economic values. It is a large, predatory insect with a robust physique. It primarily preys on a variety of insects, including lepidopteran larvae, locusts, crickets, and houseflies [2,3]. Most of the insects it preys on are considered pests in agriculture, forestry, and sanitation. By selectively targeting these agricultural and forestry pests, it helps form a multi-level ecological regulation mechanism. This approach decreases chemical pesticide usage and its associated pollution, thereby promoting the development of eco-friendly control technologies [4,5]. Additionally, the larvae and pupae of V. soror are high-quality, protein-rich foods that are highly esteemed by the people of Yunnan. Wasp larvae are low in fat and high in protein, providing essential nutrients for human health [6,7,8]. Furthermore, V. soror possesses medicinal value, as its venom, honeycombs, and body can be utilized as medicinal materials. In the traditional folk medicine of ethnic minorities in Yunnan Province, wasp wine, which is made from the bodies and venom of adult wasps, has been employed in the treatment of diseases such as rheumatoid arthritis [4].
V. soror is mainly distributed in Southeast Asian countries such as Thailand, Myanmar, Vietnam, and the northeastern part of India. In China, its natural habitats primarily include provinces and regions such as Hunan, Jiangxi, Fujian, Hong Kong, Guizhou, Guangdong, Guangxi, Yunnan, and Hainan [9,10]. With the increasing frequency of global trade, species have been introduced to new regions, leading to biological invasions. Initially confined to Asia, V. soror specimens have also been recorded in Canada and the United States in North America [11,12]. However, in China, where V. soror is native, the species maintains a stable population size and activity range due to mutual restrictive relationships among various species in the ecosystem. Consequently, it does not have significant negative impacts on local agricultural, forestry, or other economic activities [13]. In the 19th century, V. soror was classified as a subspecies of Vespa ducalis (Smith, 1852) based on traditional morphological characteristics. However, later comparative studies of their external morphological features revealed a key distinguishing trait: the propodeum of the V. soror is orange-yellow, while that of V. ducalis is black. This result led to the V. soror being elevated to a distinct species. Their distributions overlap; this is a further reason to consider them separate species [9,10]. Traditional morphological identification relies on the identifier’s professional knowledge and extensive experience. However, V. soror and V. ducalis are highly similar in appearance; they are easily confused, resulting in a relative scarcity of research related to V. soror.
Currently, research on wasps primarily focuses on their biological characteristics and their edible and medicinal values, whereas studies on their genetic diversity remain relatively scarce [14]. However, there are few reports on the research regarding the genetic diversity of V. soror. Whether from the perspective of economic value or the aspect of invasive alien species, it is of great necessity to clarify the genetic diversity of V. soror. Genetic diversity is the foundation for species to adapt to environmental changes and maintain their ecological functions [15]. Understanding the genetic diversity of V. soror is conducive to revealing its adaptive characteristics in different geographical regions and its potential economic value. Additionally, as a potential invasive species, studying its genetic diversity can provide a scientific basis for evaluating its invasive capacity, risk of diffusion, and formulating effective prevention and control strategies. Furthermore, genetics of V. soror may contribute to clarifying the relationship with V. ducalis.
With the rapid development of high-throughput sequencing and modern molecular biology technology, molecular markers have been increasingly applied in population genetic studies of wasps. Insect mitochondrial DNA (mtDNA) is characterized by its simple structure, rapid evolutionary rate, and high mutation rate. It thus has been widely applied in studies on species genetic differentiation, phylogeny, and other related research fields [16,17,18]. Among them, the COI gene is particularly valuable in mitochondrial DNA, due to its relatively long length, rich genetic information content, and relatively rapid evolutionary rate. Therefore, COI is currently widely applied in insect species identification and genetic research [19,20]. In 2022, Canadian researcher Bass conducted a molecular biological identification of collected V. ducalis samples using the COI gene as a molecular marker. This research showed that samples initially identified as V. ducalis based on morphological features exhibited up to 98.09% sequence similarity with V. soror in the GenBank database, suggesting that these samples should actually be classified as V. soror [11]. Sun investigated the genetic diversity of Apis cerana in the Austral-Pacific region using the COI gene. The results showed that a total of 26 haplotypes from the COI gene were identified, and all A. cerana in the invaded regions shared a single haplotype. A. cerana in Indonesia exhibited relatively high genetic diversity, with a haplotype diversity (Hd) of 0.41 and a nucleotide diversity (Pi) of 0.01104 [21]. Therefore, conducting research on the genetic diversity of V. soror based on the mitochondrial COI gene is deemed feasible.
In previous molecular biology studies on V. soror, most researchers have only utilized the COI gene as a molecular marker for taxonomic identification of this species [22]. However, there has been no investigation into the genetic diversity of V. soror using molecular markers. This study examines the genetic diversity of V. soror by analyzing mitochondrial COI gene sequences. A large-scale sampling was conducted to calculate the genetic diversity indices of V. soror, infer its phylogeny, and reveal the genetic structure of its populations. Through this analysis, we explored the genetic diversity levels among different geographical populations of V. soror, providing a scientific basis for the conservation and utilization of this species. This study represents the first investigation into the genetic diversity of V. soror in southern China and provides molecular data support for subsequent research on this species. It also serves as a reference for studies on the genetic diversity of other wasp populations, which is of great significance.

2. Materials and Methods

2.1. Sample Collection

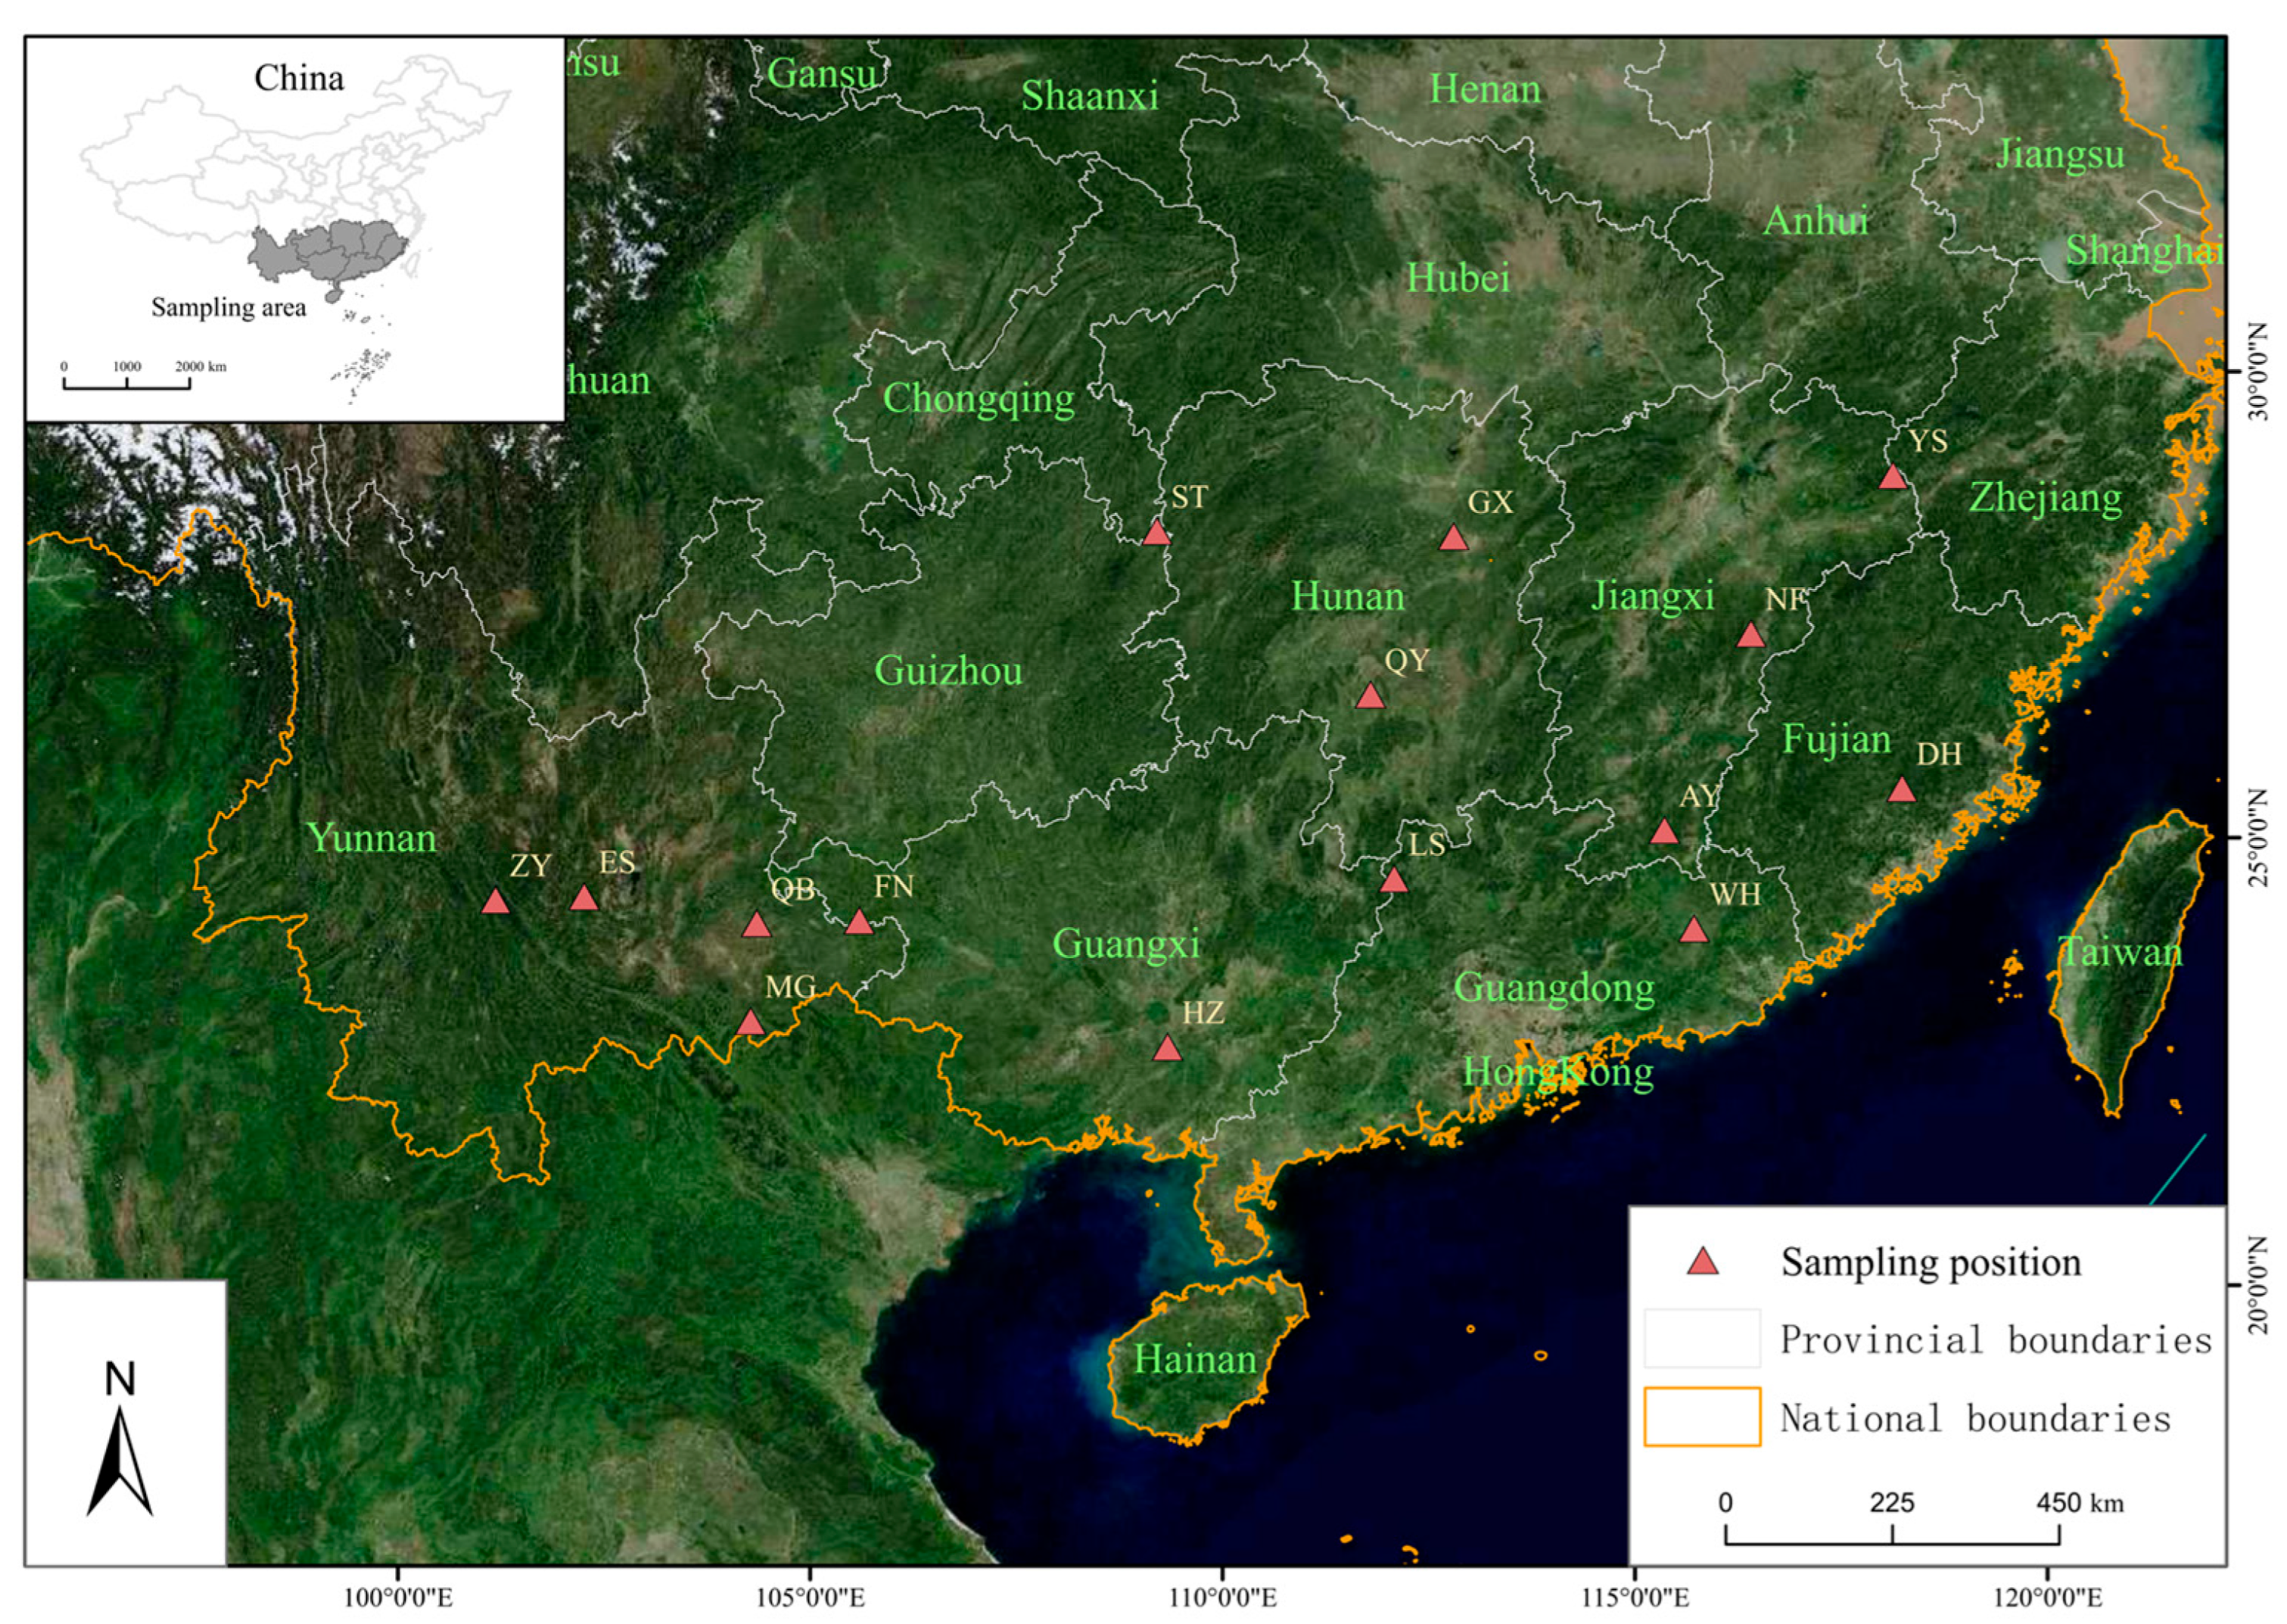
A total of 90 samples of V. soror were collected from 15 sites (Figure 1). These sampling sites cover their distribution range in southern China. All of the collected V. soror samples were placed in sealed centrifuge tubes and immersed in absolute ethanol and then stored in a refrigerator at −20 °C for subsequent research. Species identification was conducted based on morphological characteristics and verified by molecular markers. The samples collected in this experiment did not involve protected or endangered species.
Sampling localities are distributed across seven provinces: Yunnan Province (Eshan County (ES), Funing County (FN), Maguan County (MG), Qiubei County (QB), Zhenyuan County (ZY)); Jiangxi Province (Anyuan County (AY), Nanfeng County (NF), Yushan County (YS)); Hunan Province (Qiyang City (QY), Gaoxin District (GX)); Guangdong Province (Wuhua County (WH), Lianshan County (LS)); Guangxi Zhuang Autonomous Region (Hengzhou City (HZ)); Guizhou Province (Songtao County (ST)); Fujian Province (Dehua County (DH)) (Figure 2, Table S1).

2.2. DNA Extraction

Samples were randomly selected from centrifuge tubes stored at −20 °C and allowed to keep room temperature for 10 min to ensure complete evaporation of residual ethanol. For DNA extraction, the right middle and hind legs of each hornet specimen were collected as experimental materials, which were placed in 2 mL sterile microcentrifuge tubes, flash-frozen with liquid nitrogen, and homogenized to a powdered consistency using a sterile pestle [23]. The DNA of V. soror was extracted using the Magen HiPure Insect DNA Kit (Guangzhou Magen Biotechnology Co., Ltd., Guangzhou, China), following the manufacturer’s instructions. After extraction, the DNA concentration and purity were measured using an ultra-micro spectrophotometer (KAIAO, K5600C, Beijing KAIAO Technology Development Co., Ltd. Beijing, China). The extracted DNA was stored at −20 °C for subsequent use [24].

2.3. Amplification and Sequencing of the COI Gene

The mitochondrial COI gene is amplified by PCR using universal primers. In this study, the mitochondrial COI gene was selected as the target gene to explore the genetic diversity of different geographical populations of V. soror. The forward primer of the COI gene was: primer-F: (5′-TGTAAAACGACGGCCAGTGGTCAACAAATCATAAAGATATTGG3′), and reverse primer, primer-R: (5′-CAGGAAACAGCTATGACTAAACTTCAGGGTGACCAAAAAATCA3′) [25]. In this experiment, a reaction system total of 25 μL was used, which included: 1 μL of DNA template, 1 μL of the forward primer and 1 μL of the reverse primer, respectively, 12 μL of 2 × Tap PCR Mix (KT201-02, TIANGEN Biotech Co., Ltd., Beijing, China), and finally, 10 μL of ddH2O was added to make up the 25 μL reaction system [26]. Put them into the PCR instrument for the reaction. The PCR reaction conditions were as follows: pre-denaturation at 94 °C for 0.5 min; denaturation at 94 °C for 0.5 min; annealing at 49.5 °C for 0.5 min, for 35 cycles; extension at 72 °C for 0.75 min; and further extension at 72 °C for 10 min [25]. Take 5 μL of the PCR amplification product and perform electrophoresis on a 1% agarose gel [27]. Use a gel imager to determine its purity, size, and brightness. Observing a bright and single band proved that the PCR amplification band was successful. The products were then sent to the Beijing Qingke Biotech Co., Ltd. for sequencing (Beijing, China).

2.4. Data Analysis

After completing Sanger sequencing of the COI gene, we first performed sequence alignment and preliminary quality control using BioEdit software (Version 7.2.6) [28]. The standard fragment was then formatted into a FASTA file. The sequencing results were subjected to a homology comparison using the BLAST tool in the NCBI (Version 2.16.0+, https://www.ncbi.nlm.nih.gov, accessed in November–December 2024) database. Sequences with a similarity greater than 97% confirmed that the amplified sequence in this experiment was the COI gene sequence of V. soror. For the partial populations where colony information could not be reconstructed, we employed PAST software (Version 5.3) to perform rarefaction analysis for standardizing the sample size across all sites [29]. Fixed K-value sampling was adopted at each site, and R studio software (Version 4.5.1) was used to perform 1000 iterations to standardize the sample size across all sites for subsequent diversity comparison and analysis [30]. After organizing the compared sequences into a FASTA-formatted text document, we used the Clustal W tool in MEGA-X software (Version 10.2.6) to conduct a comparative analysis of the genes from all samples and calculate the base composition (A, T, C, G) [31]. We utilized DnaSP software (Version 6.12.03) to calculate genetic diversity indices. Specifically, these indices included the number of variable sites, haplotype numbers (H), haplotype diversity (Hd), nucleotide diversity (Pi), and the average number of nucleotide differences (K). During the calculation, we used the default parameters of DnaSP 6.12.03 [32,33]. Files in .rap format were exported using DnaSP 6.12.03 software. We performed analysis of molecular variance (AMOVA) and calculated inter-population Fst values using Arlequin 3.5.2.2 software, with the “No. of permutations” parameter set to 1000 [34,35]. The pre-prepared .nex file was imported into popArt-1.7 software. For network construction, the haplotype TCS network was selected, with all other parameters set to their default values [36].

3. Results

3.1. Analysis of the Sequence Characteristics of the Mitochondrial COI Gene

The COI gene fragments of 15 geographical populations were sequenced, and a total of 90 COI gene sequences were obtained. After multiple sequence alignment and trimmed alignment, the length of the COI gene fragment was 615 base pairs (bp) (Table S2). The similarity with the COI gene sequence of V. soror published on GenBank could be as high as 97%. (Accession number: OQ892186.1), indicating that the amplified band was the target gene band. The sequenced region contained 587 conserved sites and generated 28 variable sites. Accounting for 4.6% of the sequencing length. Among them, there were 24 parsimony informative sites and 4 singleton variable sites. No insertions or deletions of bases were found in the aligned sequences, and the types of variations originated from base transversions and transitions. The average frequencies of bases A, T, C, and G in the COI gene sequence were 29.6%, 39.4%, 18.9%, and 12.1%, respectively. Among them, the content of A+T (69%) was higher than that of G+C (31%), indicating that the COI gene sequence of the V. soror had an obvious preference for A/T bases. This was consistent with the base composition of insect mitochondrial gene sequences, and the V. soror showed an obvious bias towards the T base.

3.2. Haplotype and Genetic Diversity Analysis Based on the Mitochondrial COI Gene

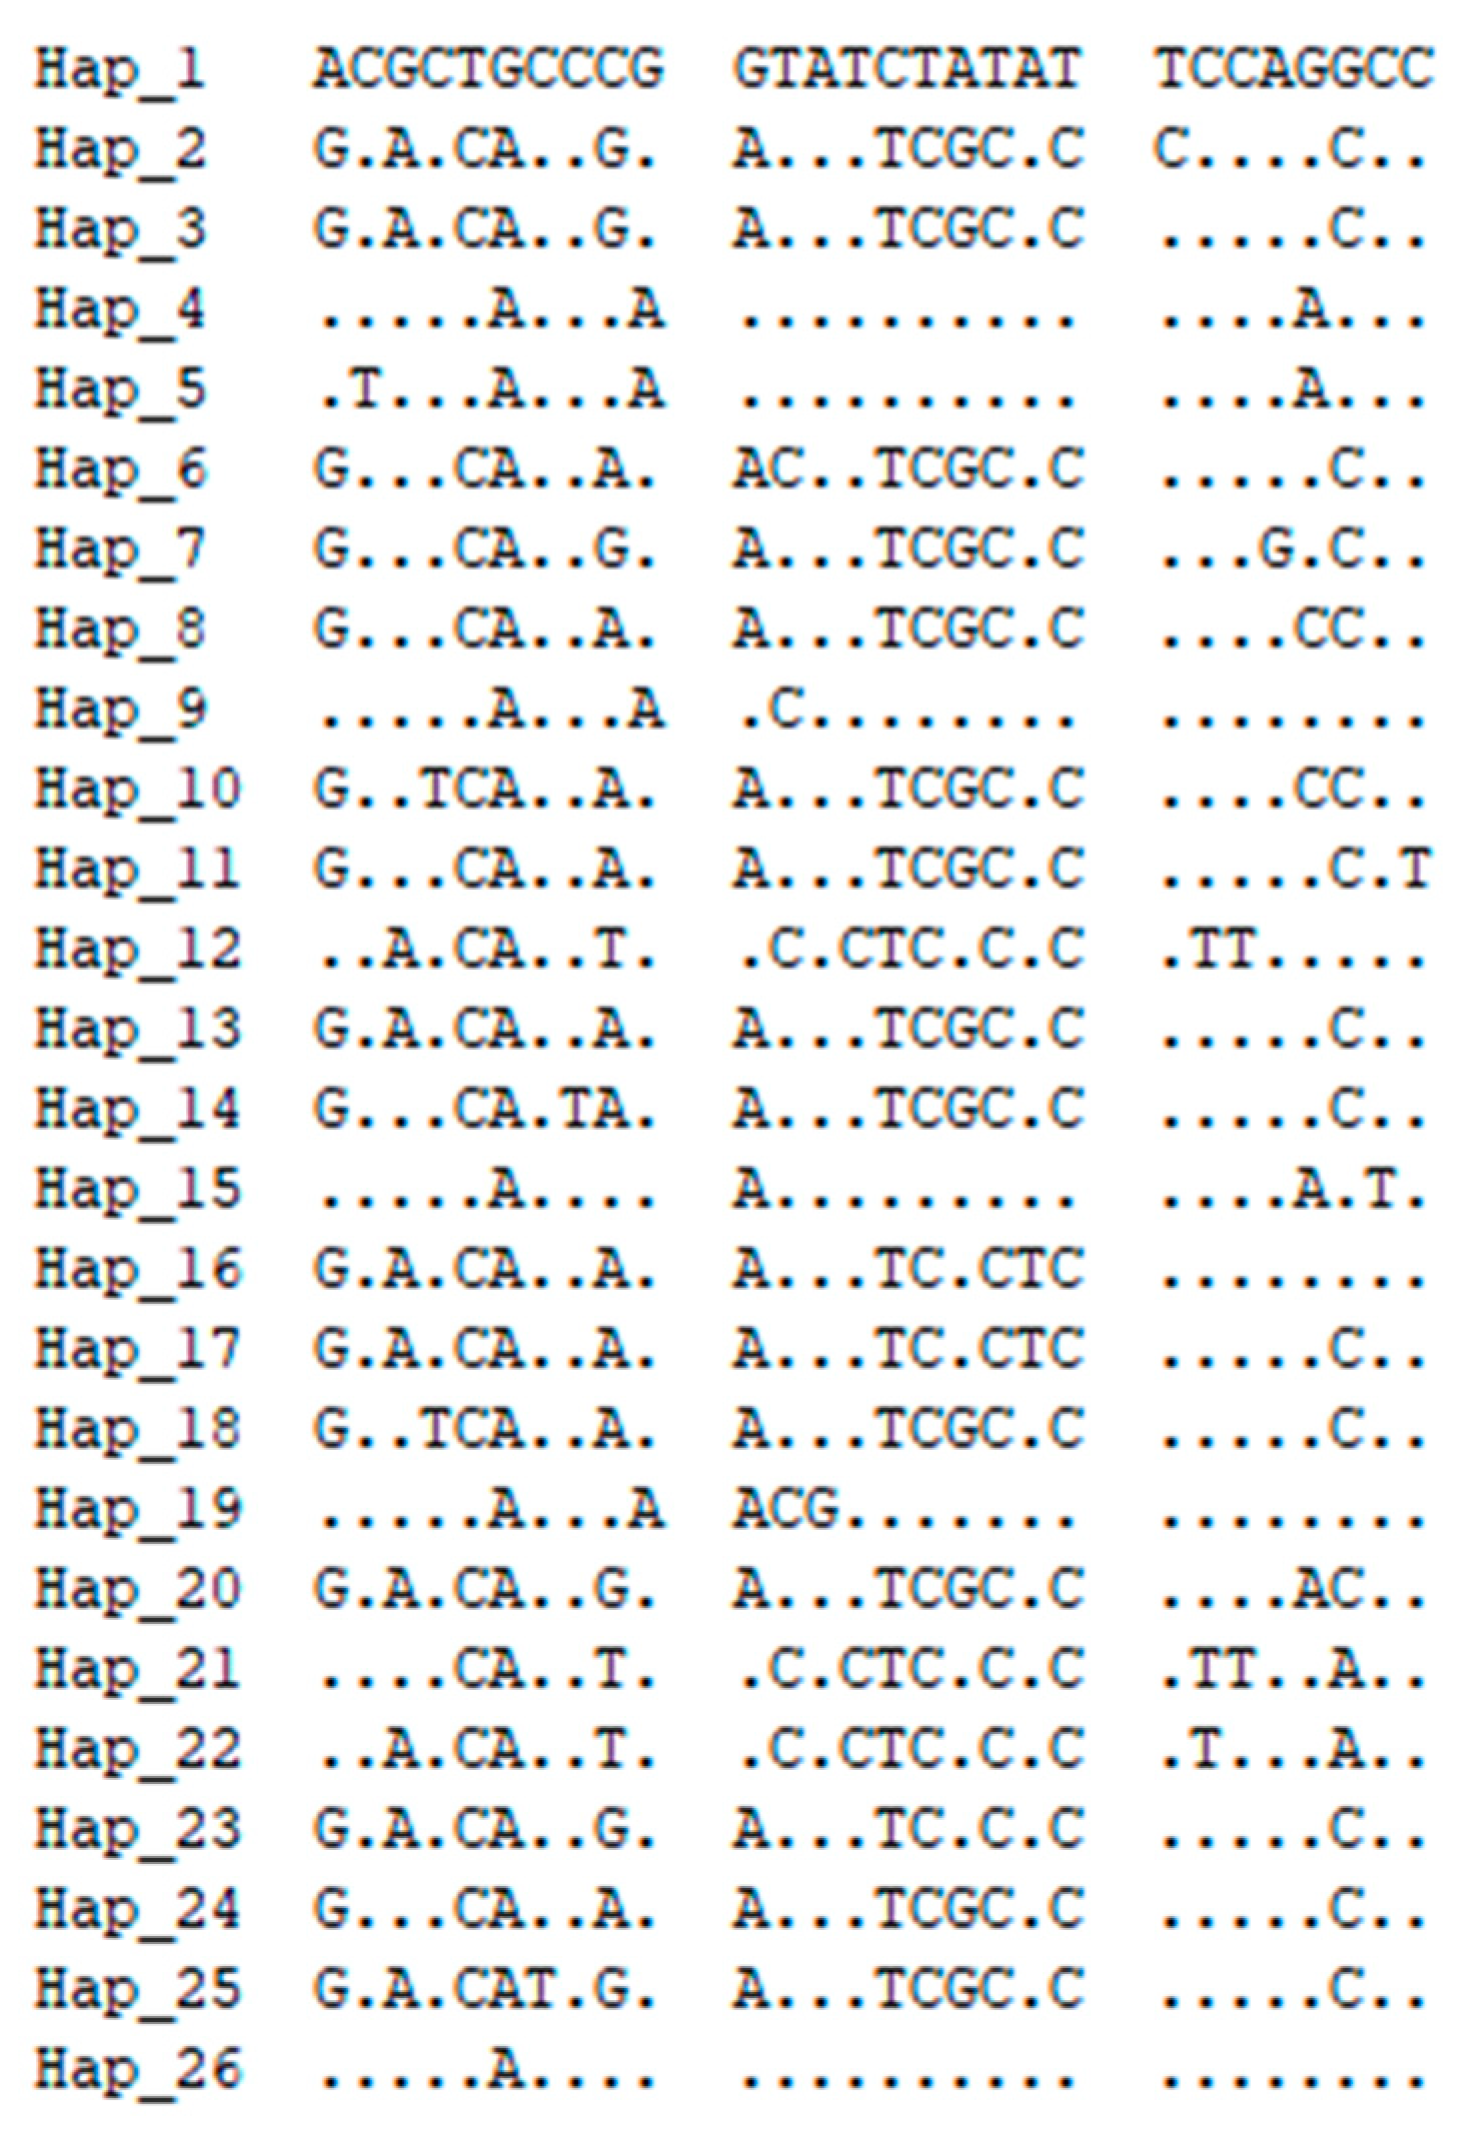
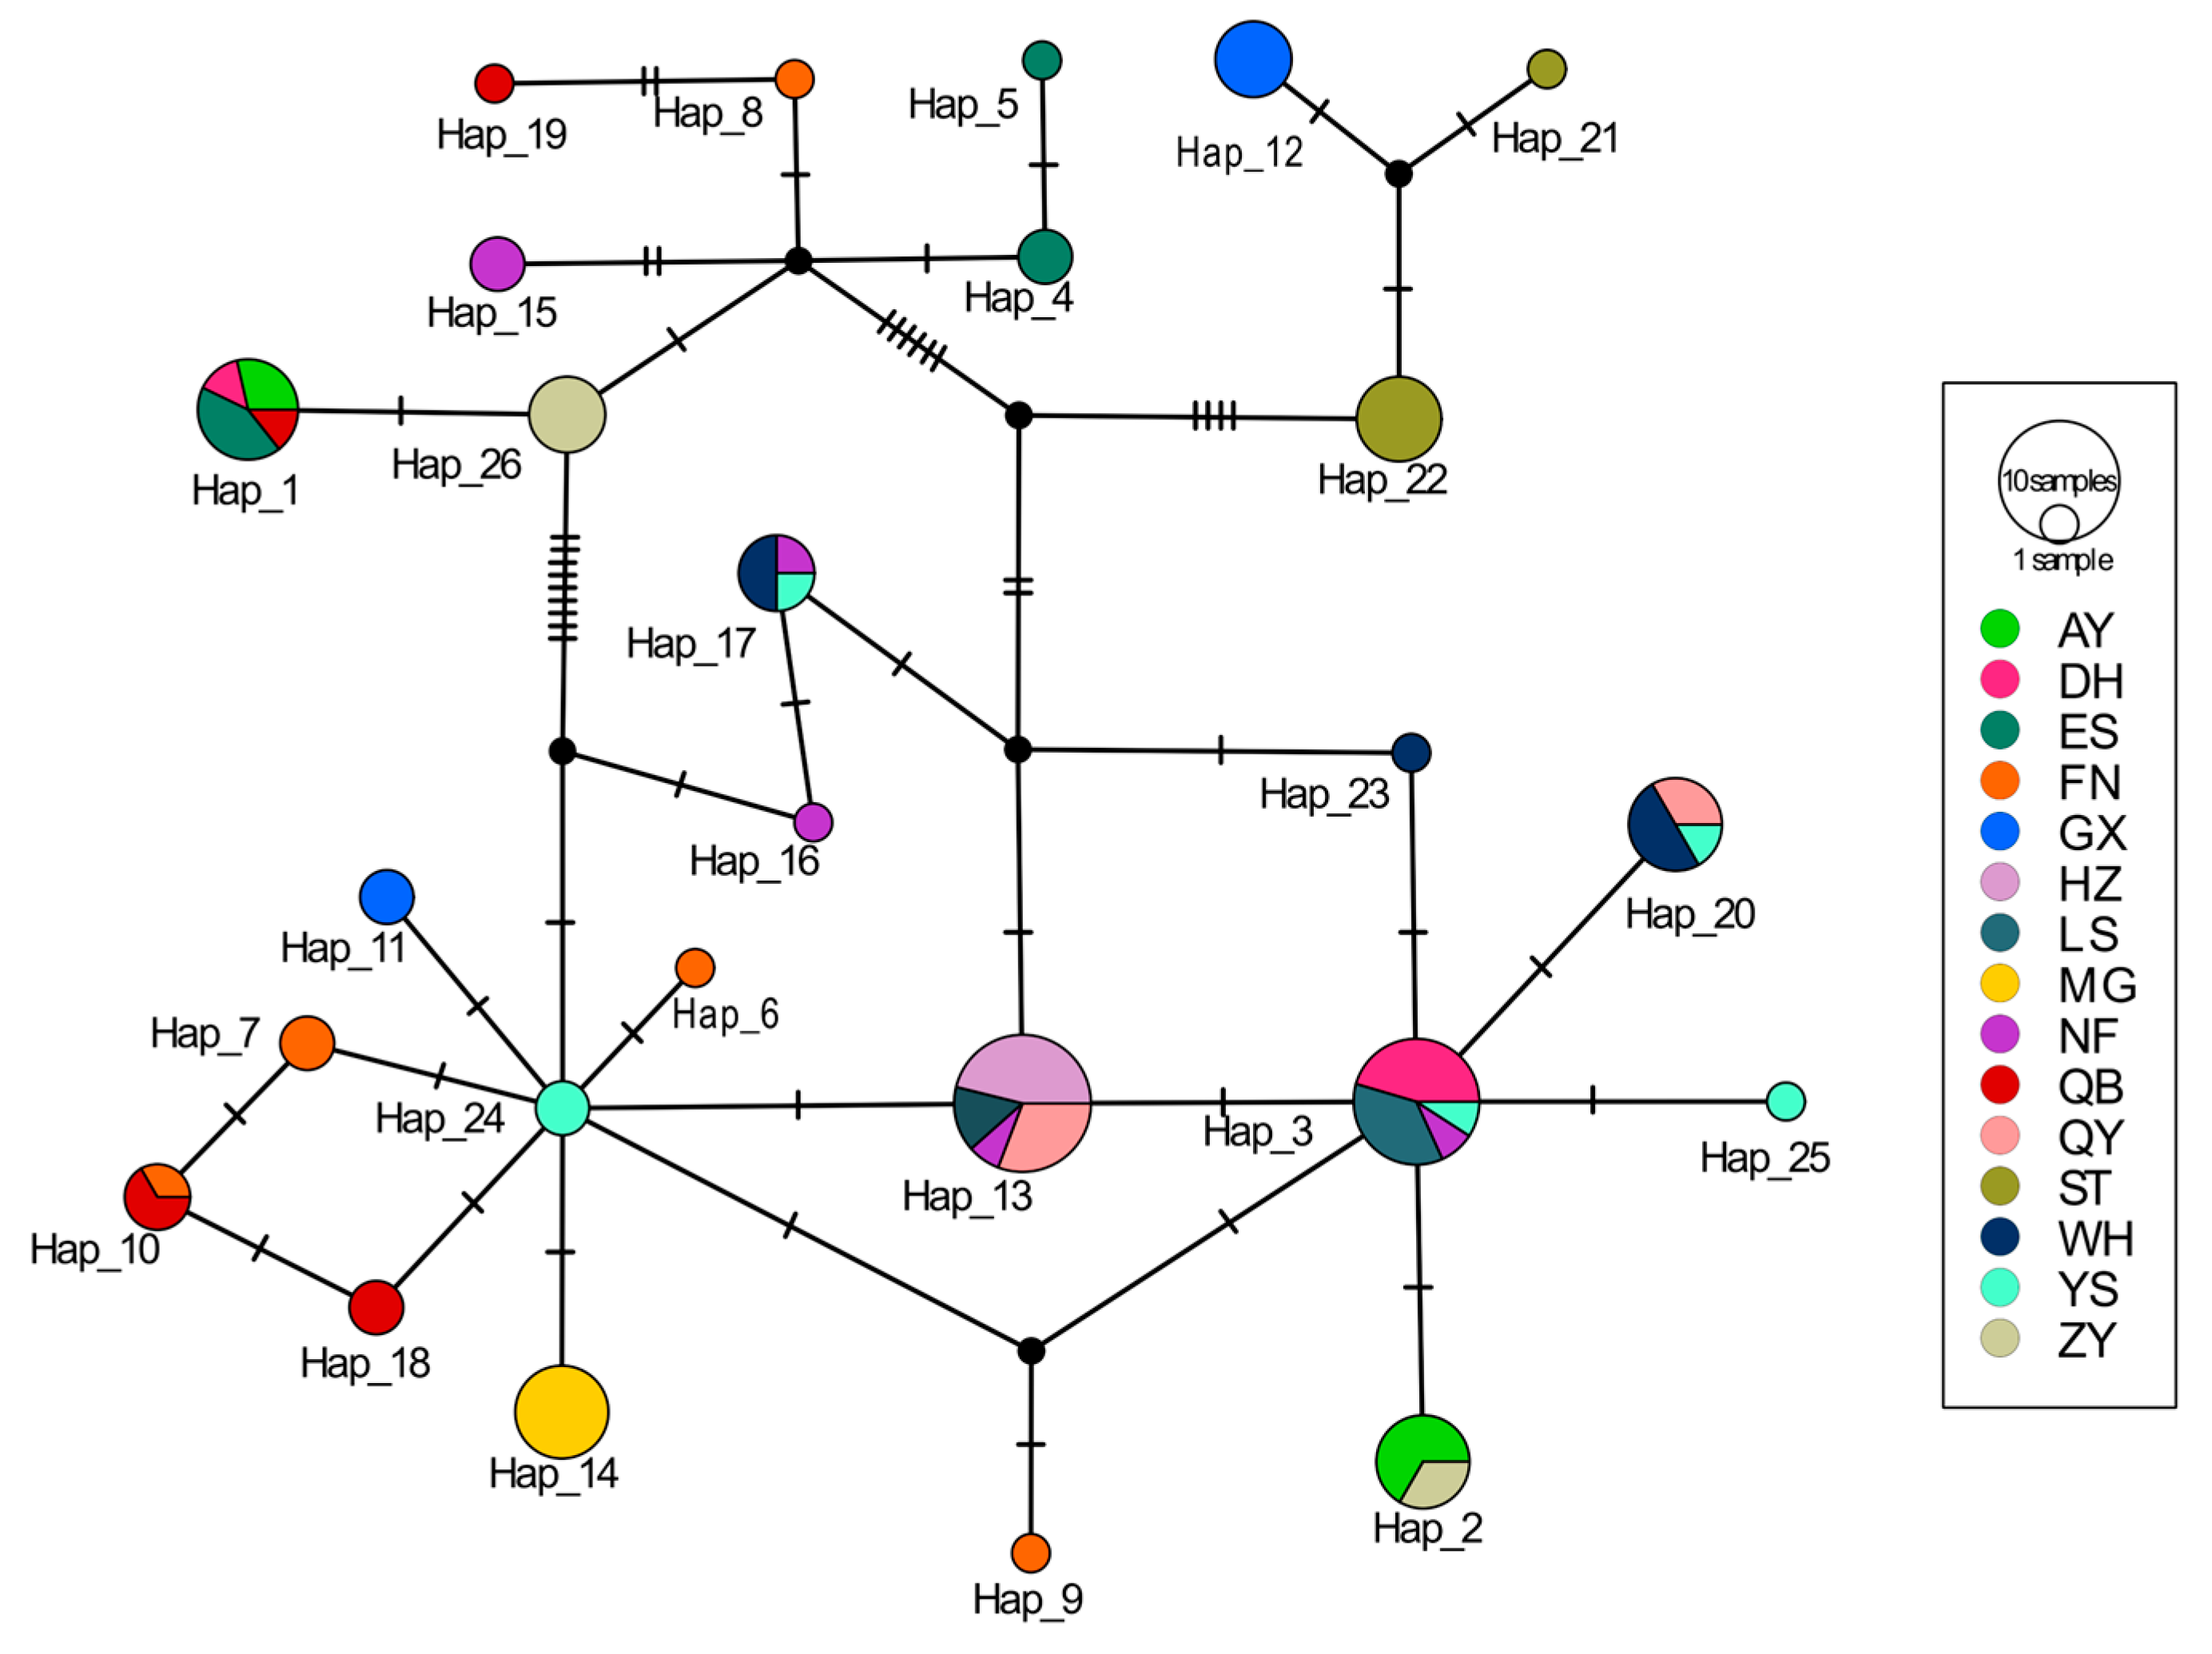
Based on the analysis of haplotypes of different geographical populations of the V. soror using the COI gene. A total of 26 haplotypes were generated, including haplotypes Hap_1, Hap_2, Hap_3, Hap_4, Hap_7, Hap_10, Hap_11, Hap_12, Hap_13, Hap_14, Hap_15, Hap_17, Hap_18, Hap_20, Hap_22, Hap_24 and Hap_26 (Table 1 and Figure A1). These 17 haplotypes were shared haplotypes of the COI gene of V. soror. The remaining haplotypes, namely Hap_5, Hap_6, Hap_8, Hap_9, Hap_16, Hap_19, Hap_21, Hap_23 and Hap_25, were distinctive haplotypes. Among them, haplotype Hap_13 appeared the most frequently, occurring in 13/90 individuals, accounting for 14.44% of the individuals tested, and four populations shared it. Additionally, haplotype Hap_3 was detected 11 times (accounting for 12.22% of the tested individuals, based on a total of 90 samples) and was shared among 4 populations. Haplotypes Hap_13 and Hap_3 were identified as the dominant haplotypes of the COI gene. In terms of sampling locations, the populations from Nanfeng (NF), Jiangxi Province; Funing (FN), Yunnan Province; and Yushan (YS), Jiangxi Province each harbored 5 haplotypes. Interestingly, the populations from Guangxi Province (HZ) and Yunnan Province (MG) each harbor only one haplotype. Each of the remaining populations harbored 2 to 4 haplotypes.
Haplotype diversity (Hd) and nucleotide diversity (Pi) were the main indicators for evaluating the degree of mtDNA variation in a population. The greater the values of Hd and Pi, the richer the genetic diversity of the population. The analysis of the genetic diversity of the V. soror based on the mitochondrial COI gene showed that: the overall haplotype diversity was 0.941 ± 0.010. The haplotype diversity of the 15 geographical populations ranged from 0 to 0.933 ± 0.122. The haplotype diversity of the populations from Nanfeng, Jiangxi (NF), Funing, Yunnan (FN), and Yushan, Jiangxi (YS) was the highest, reaching 0.933 ± 0.122. Followed by the population from Qiubei, Yunnan (QB), with a value of 0.867 ± 0.129. The overall nucleotide diversity was 0.01068 ± 0.00079. The nucleotide diversity of each geographical population ranged from 0 to 0.01225 ± 0.00374. The population from Qiubei, Yunnan (QB) had the highest nucleotide diversity (0.01225 ± 0.00374), and the population from Nanfeng County, Jiangxi (NF) ranked second with a value of 0.01171 ± 0.00270. The overall average number of nucleotide differences was 6.57104. The average number of nucleotide differences among each geographical population ranged from 0 to 7.53333. The highest value, which was 7.53333, was also found in the population from Qiubei, Yunnan (QB). The haplotype diversity (Hd), nucleotide diversity (K), and average nucleotide difference (Pi) of the population from Hengzhou, Guangxi (HZ) and Maguan, Yunnan (MG) were all the lowest, with the values all being 0.000. In this study, the haplotype diversity (Hd > 0.5) and nucleotide diversity (Pi > 0.005) at more than half of the sampling sites were relatively high, indicating that the V. soror had a high level of genetic diversity (Table 1).

3.3. Genetic Differentiation Analysis of the COI Gene

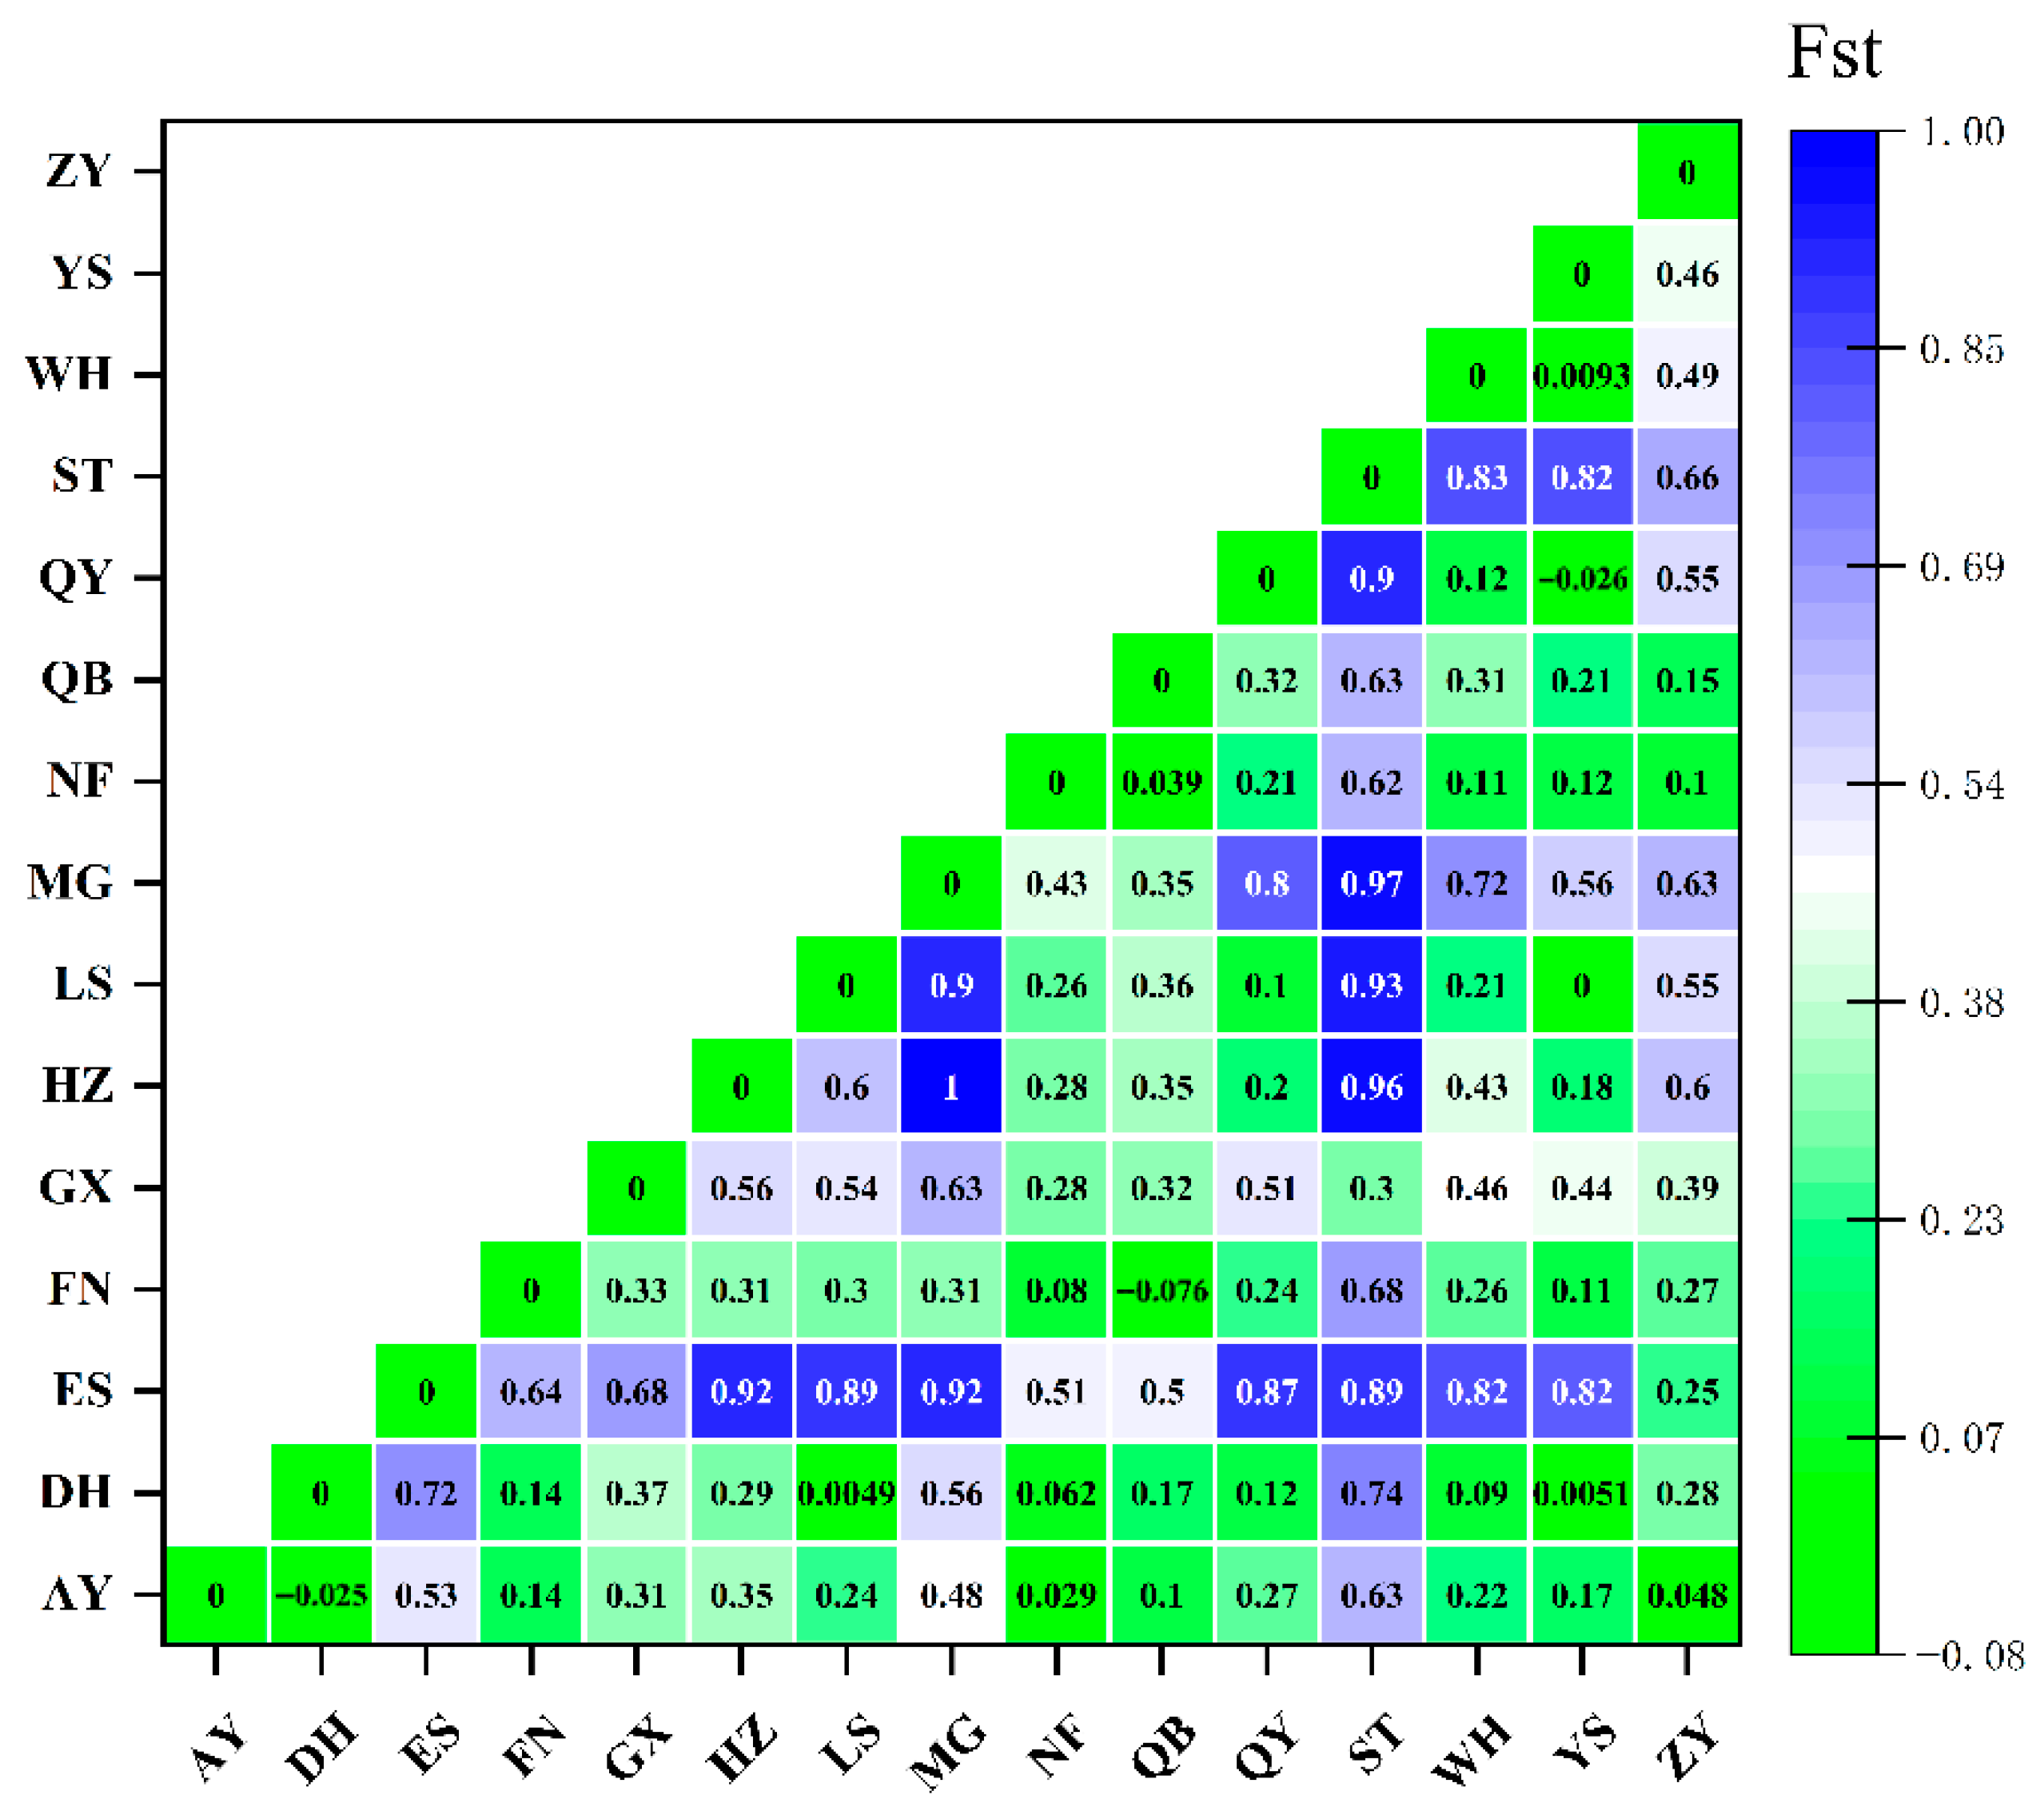
Genetic differentiation analysis (Fst) of V. soror was performed using Arlequin 3.5 software (Figure 3, Table S3). A total of 105 pairwise genetic differentiation coefficients (pairwise Fst) were obtained across all populations, with the Fst values ranging from −0.076 to 1.00. Of these pairwise Fst values, 10 groups exhibited Fst < 0.05, accounting for 9.52% of the total pairwise comparisons. This result indicates weak genetic differentiation between the corresponding populations. Specifically, 25 pairwise comparisons exhibited Fst values between 0.05 and 0.25, accounting for 23.80% of the total pairwise combinations, indicating moderate genetic differentiation among these populations. In contrast, 80 pairwise comparisons had Fst values greater than 0.25, representing 76.19% of the total, which reflects a high level of genetic differentiation between the corresponding populations. Notably, the pairwise Fst value between the Maguan (MG) population in Yunnan and the Hengzhou (HZ) population in Hunan reached 1.00, indicating that these two populations are in an extremely differentiated genetic state. Notably, the Eshan (ES) population in Yunnan and Songtao (ST) population in Guizhou showed remarkably high genetic differentiation from all other geographical populations. The overall FST value of the 15 geographical populations was 0.47872, with a 95% confidence interval (0.43054, 0.52616) obtained via 1000 Bootstrap resampling. This result indicates that despite fluctuations in genetic differentiation among different populations (FST ranging from −0.076 to 1.00), the overall genetic differentiation level of the 15 populations falls within a relatively high range.

3.4. Tajima’s D and Fu’s Fs Analysis of Populations

For the total population, the Tajima’s D statistic from the neutrality test was 0.12833, which did not reach the significance threshold (p > 0.10). Across all populations, the Tajima’s D values ranged from −1.13197 to 1.33148. Notably, the Hengzhou (HZ) population in Guangxi and the Maguan (MG) population in Yunnan failed to meet the analytical criteria for significance testing due to a haplotype diversity index of 0; consequently, the neutrality tests for these two populations were not conducted. Among all populations, the Tajima’s D values were negative for the Dehua (DH) population in Fujian, Funing (FN) population in Yunnan, Songtao (ST) population in Guizhou, and Yushan (YS) population in Jiangxi; the remaining populations exhibited positive Tajima’s D values. Notably, none of the populations reached the significance threshold for the neutrality test (p > 0.10). For the total population, the value of the Fu’s Fs statistic from the statistical significance test was −4.001. Across all populations, the Fu’s Fs values ranged from −1.672 to 6.639. The Fu’s Fs values were −0.114 and −1.672 for the Funing (FN) population in Yunnan and the Yushan (YS) population in Jiangxi, respectively. The remaining populations all exhibited positive Fu’s Fs values. Similarly, the Hengzhou (HZ) population in Guangxi and the Maguan (MG) population in Yunnan failed to meet the analytical criteria for significance testing, and thus the relevant tests were not conducted (Table 2).
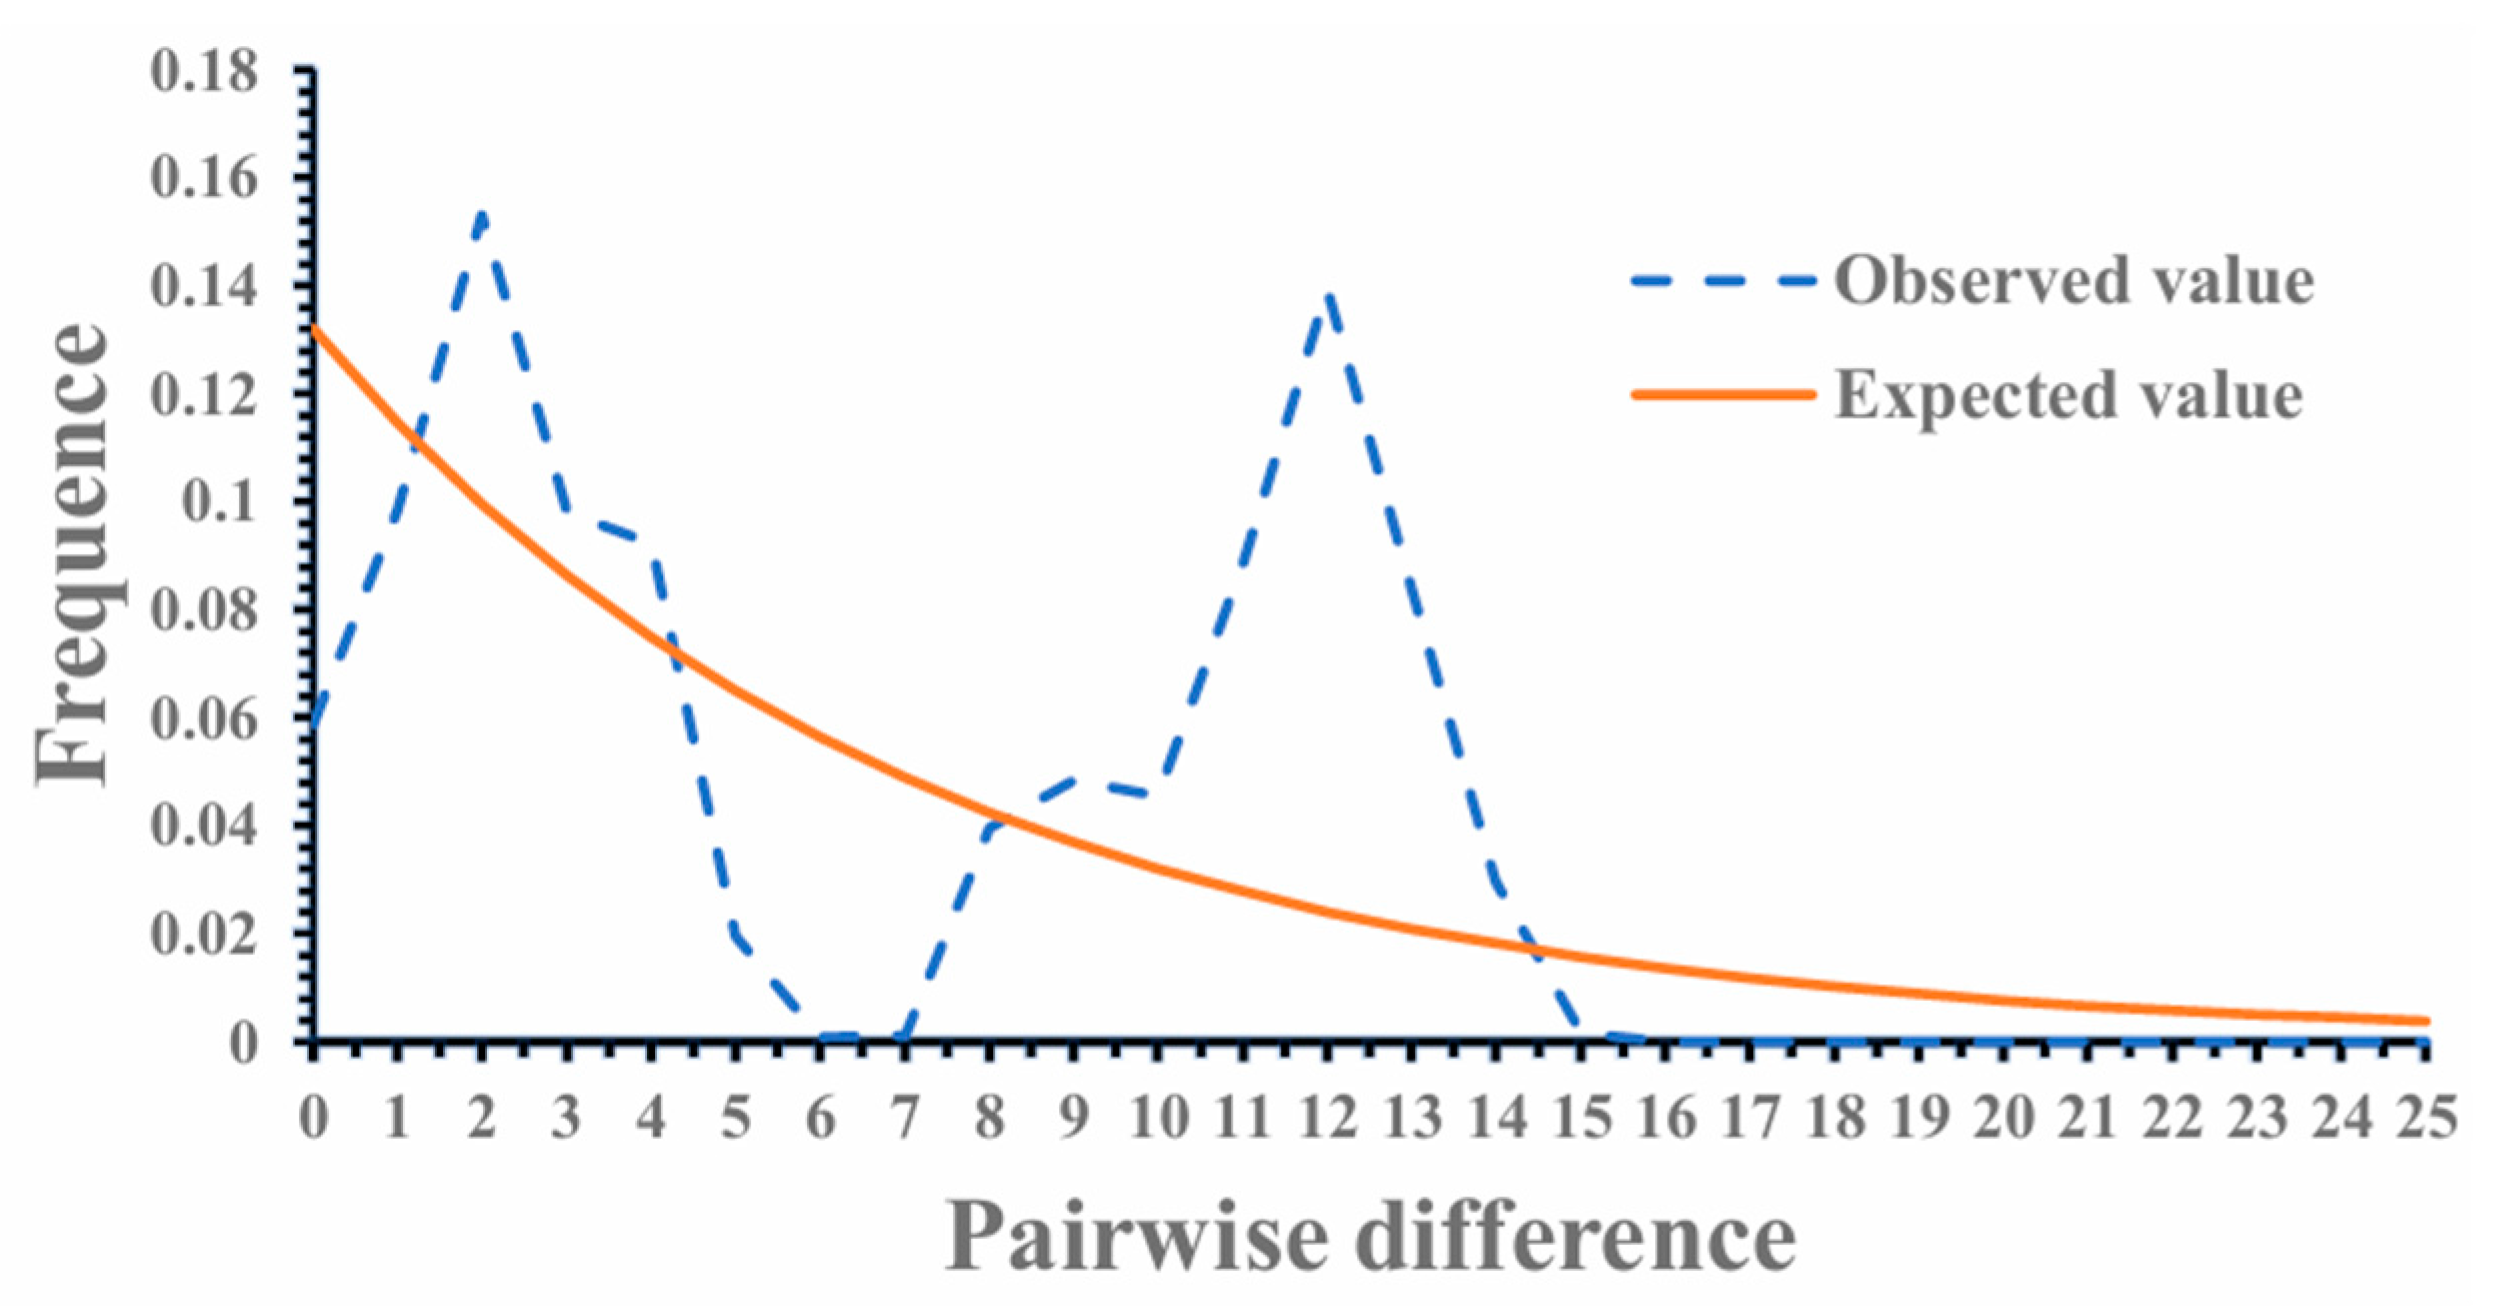
The mismatch distribution reflected the historical dynamics of population development. When a population was a recently formed or expanding population, its mismatch distribution curve showed a single peak; while when a population was a long-existing and stable population, the mismatch distribution curve showed multiple peaks. Based on the mismatch distribution analysis of the COI gene (Figure 4, Table S4), the mismatch distribution curve of the total population exhibits a multimodal pattern. This pattern indicates that the V. soror population is in a relatively stable state and has undergone no expansion in the recent period.
Based on the results of the Analysis of Molecular Variance (AMOVA) of V. soror using the COI gene (Table 3, Table S5), the genetic variation among populations was 47.87%. In contrast, the genetic variation within populations was slightly lower than that among populations, accounting for 52.13%. When analyzing the 5 populations from Yunnan and the 10 populations from other sampling regions, Analysis of Molecular Variance (AMOVA) attributed 15.82%, 36.37%, and 47.81% of the total variation to among-group variation, among-population variation within groups, and within-population variation, respectively (Table 4, Table S6). The overall fixation index (FST) after grouping (0.52193) was slightly higher than that without grouping (0.47872). Additionally, significant genetic differentiation was detected both among groups (FCT = 0.15823, p < 0.001) and among populations within groups (FSC = 0.43206, p < 0.001). These results indicate that the current grouping strategy effectively improves the partitioning of partial genetic variation.

3.5. Haplotype TCS Network Graph Based on the COI Gene

As can be seen from the TCS network diagram, the COI gene exhibits a star-like distribution, and there is a remarkable differentiation of haplotypes throughout the entire network (Figure 5, Table S7). Among them, haplotypes Hap_13 and Hap_3 are shared haplotypes. Hap_13 is located at the center of the network diagram and is connected to other haplotypes. However, the overall occurrence frequency of these two shared haplotypes is relatively low. Low-frequency haplotypes are distributed on the periphery of high-frequency haplotypes and are connected to high-frequency haplotypes through one or multiple mutation steps. The distribution of each haplotype is somewhat scattered, and no distinct geographical distribution pattern can be identified. A total of six mutation sites is generated in the entire haplotype network diagram, which may contribute to the differentiation of haplotypes.

4. Discussion

Analyzing the genetic diversity of a species is a crucial step in the conservation and management of biological resources. In this study, we utilized the mitochondrial COI gene as a molecular marker to investigate the genetic diversity of V. soror populations from 15 geographical locations in southern China. The analysis of the COI gene sequence revealed a strong adenine (A) and thymine (T) base bias, which is consistent with the high A/T base preference characteristic of the Hymenoptera order. The relative content of A and T varies depending on the gene orientation, direction of replication origin, and codon position. The base composition bias is valuable for understanding the mechanisms of mitochondrial genome replication and transcription [37]. Genetic diversity is a vital component of biodiversity, as it provides insights into the origin, evolution, and adaptive capacity of species in different environments. Higher genetic diversity can enhance a species’ adaptability, thereby improving its survival capacity [38,39]. In this study, 26 haplotypes were identified based on the mitochondrial COI gene of V. soror, which is notably higher than the 11 haplotypes reported in the study by Takeuchi et al. This discrepancy may be attributed to differences in sampling locations and sample sizes [25]. In our study, we had both more sampling sites and a larger sample size (15 regions and 90 individuals) compared to Takeuchi’s study (10 regions and 72 individuals). Furthermore, haplotypes Hap_13 and Hap_3, which not only exhibit relatively high frequencies but also show associations with other haplotypes, are inferred to be potential ancestral haplotypes of the COI gene. Additionally, the occurrence of several private haplotypes indicates that V. soror transmits genetic materials normally, while variations have emerged due to environmental changes and geographical differences, resulting in the formation of new haplotypes. The biogeography of a species can be inferred from the distribution of these haplotypes [40].
Haplotype diversity and nucleotide diversity reflect the frequency distribution of haplotypes and the degree of site variation, respectively. They are important indicators for evaluating the genetic diversity within populations [41]. Haplotype diversity (Hd) reflects the frequency distribution of haplotypes, while nucleotide diversity (Pi) indicates the degree of variation at the nucleotide level. Generally, an Hd value greater than 0.5 signifies high genetic diversity, whereas a value below 0.5 indicates low genetic diversity. Similarly, a nucleotide diversity value greater than 0.005 is associated with high genetic diversity, while a value below 0.005 indicates low genetic diversity [42]. Arca et al. investigated the genetic diversity of V. velutina invading Europe using the COI gene and microsatellites. Their results indicated that the haplotype diversity of V. velutina in its native range ranged from 0.216 to 1, with nucleotide diversity ranging from 0.001 to 0.038. However, the diversity indices were found to be 0 in the invaded regions of Europe [13]. In our study, we found the overall haplotype diversity (Hd) of the COI gene in V. soror from southern China to be 0.941 ± 0.010, with a nucleotide diversity (Pi) of 0.01068 ± 0.00079. These results indicate that V. soror exhibits high genetic diversity. Compared to V. velutina in Europe, V. soror exhibits a higher level of genetic diversity. High genetic diversity allows it to rapidly adapt to environmental changes, which enhances its survival capacity. This result may be attributed to the fact that the V. soror samples were collected from their native habitat under wild conditions, derived from breeding populations of multiple queens, rather than originating from the propagation of a single or a few populations. The unrestricted transmission of genetic information has thus ensured a high level of genetic diversity. Genetic diversity can be lost from populations through multiple mechanisms. A key factor that may contribute to low genetic diversity involves founder events and bottleneck events, which may be followed by recent population expansion. Genetic bottlenecks can amplify the effects of genetic drift, leading to a general loss of genetic diversity. The extent of this loss is influenced by the severity and duration of the bottlenecks [43]. Jeong et al. [44] investigated the genetic status of V. velutina, an invasive wasp species in South Korea, by analyzing the COI, Cytb, and lrRNA genes. The finding revealed that the genetic diversity of V. velutina in South Korea is significantly lower than that of native wasp populations. In the invasive populations of South Korea, only one haplotype was detected in each sampling group, whereas 2-3 haplotypes were identified in populations within the native range. The results of Jeong’s study align with the COI, Cytb, and lrRNA genes to investigate the genetic status of V. velutina invading South Korea [44]. The genetic diversity of V. velutina in South Korea is significantly lower than that of native wasp populations. In the invasive populations within South Korea, only one haplotype was detected in each sampling group, whereas 2-3 haplotypes were identified in populations within the native range. Both the haplotype diversity and nucleotide diversity of the population from Hengzhou (HZ) city in Hunan province and Maguan county (MG) in Yunnan province are 0, as each of these two populations harbors only one unique haplotype. This suggests that both the HZ and MG populations may have experienced genetic bottlenecks or genetic drift events, leading to their low genetic diversity. Furthermore, workers from the same wasp colony share identical mitochondrial DNA (mtDNA) haplotypes, which reduces the genetic diversity at the target locus. It is plausible that the samples from these two populations were derived from a single colony; this may have resulted in the failure to detect mutation sites that could potentially exist in these geographical populations. In addition, the study found that V. soror populations with a greater number of haplotypes exhibit higher genetic diversity, and conversely. For instance, populations from Funing (FN) county in Yunnan Province, Nanfeng (NF) county and Yushan (YS) county in Jiangxi Province harbor more than five haplotypes, with their calculated haplotype diversity (Hd) all exceeding 0.9. In contrast, the populations HZ and MG, which contain only one haplotype, exhibit 0 for all genetic diversity indices.
The fixation index (Fst) is a key indicator for evaluating population genetic differentiation. Fst reflects the extent of genetic differentiation among various populations [45]. Its values range from −1 to 1. An Fst value of less than 0.05 indicates a low degree of genetic differentiation among populations with frequent gene flow. Fst values range between 0.05 and 0.15, it suggests a certain level of genetic differentiation with moderately reduced gene flow. Fst values between 0.15 and 0.25 imply substantial genetic differentiation among populations with significant differences. When the Fst value exceeds 0.25, it indicates high genetic differentiation among populations, implying that the populations are nearly mutually independent [46]. Herrera et al. investigated the genetic differentiation of V. velutina invading the westernmost islands by using the COI gene and STRs. They found the pairwise Fst values among populations to range from 0.0001 to 0.6366, indicating significant variations in genetic differentiation between populations [47]. In this study, over 70% of pairwise Fst values based on the COI gene are greater than 0.25, indicating a high degree of genetic differentiation among the various populations. Wasps possess two pairs of membranous wings and are capable of short-distance migration. Sauvard, using a flight simulator to assess the flight capacity of V. velutina workers, found that these wasps can fly up to 25 km per day [48]. At present, no research has yet been conducted on the flight capacity of V. soror. Taking V. velutina as a reference, given the relatively large distances between the sampling sites of V. soror, it is almost impossible that they can migrate between distant populations for mating based solely on their flight ability. Further, massive mountain ranges and ocean currents may prevent V. soror’s ability to expand into new habitats [49]. The geographical isolation due to such long distances, combined with the relatively weak dispersal ability of V. soror, has impeded gene flow among its populations and reinforced their genetic differentiation. As a neutrality test for detecting natural selection, Tajima’s D test is also capable of offering insights into the recent population dynamics of a species [50]. The Tajima’s D values of most populations were positive, and none of these values reached the significance level (p > 0.10). Additionally, neutrality tests could not be conducted for another 2 populations due to data constraints. Meanwhile, the mismatch distribution curve exhibited a multimodal pattern, which indicates that the population is likely in a stable state currently.
In this study, the mitochondrial COI gene fragment was employed as a molecular marker to investigate the genetic diversity of V. soror populations in southern China. Although the COI gene is a widely used genetic marker for exploring species diversity, its application is confined to a single gene locus. For in-depth investigations into the genetic diversity of V. soror, it is recommended to incorporate additional genetic data, such as complete mitochondrial genomes and even nuclear gene data. This research strategy will help enhance the comprehensiveness and reliability of the study results. Furthermore, when analyzing genetic diversity across different geographical sites, this study was limited by the lack of colony origin information for some samples collected during the initial phase, which prevented a complete reconstruction of the colony information for each site. This limitation may introduce uncertainties into the calculation of intra-colony genetic diversity and the inference of gene flow. To mitigate the impact of this limitation, prior to comparing genetic indices among sites, we performed a rarefaction analysis to standardize the sample size of each site (uniformly set to n = 6), and a fixed K = 6 sampling strategy was applied to populations with a sample size greater than 6. This measure ensures that all sites are compared based on the same sample size, thereby reducing biases caused by differences in sample size. For future studies, optimizing the sampling protocol (by recording detailed information related to all collected samples) and improving the reconstruction of colony information will provide more accurate baseline data for the analysis of population genetic structure.

5. Conclusions

This study is the first investigation into the genetic diversity of V. soror in southern China based on the mitochondrial COI gene, providing molecular data to support future research on the genetic diversity of this species. The COI gene of V. soror shows a significant preference for A/T base and contains two major haplotypes. V. soror exhibits high levels of haplotype diversity and nucleotide diversity overall, indicating a relatively favorable genetic status. There is a strong genetic differentiation among populations. Within the scope of this study, the population genetic structure of V. soror did not show fluctuations, and no population expansion phenomenon has been observed in southern China.

Supplementary Materials

The following supporting information can be downloaded at: https://www.mdpi.com/article/10.3390/d17110756/s1, Table S1. Statistical table of collection information of Vespa soror. Table S2. Files aligned and trimmed using MEGA. Table S3. Fixation index (Fst) values and their corresponding confidence intervals were obtained via Arlequin software. Table S4. Mismatch distribution analysis of the COI gene. Table S5. Overall Analysis of Molecular Variance (AMOVA). Table S6. Analysis of Molecular Variance (AMOVA) for 10 populations from Yunnan and other regions. Table S7. Input files for constructing haplotype TCS network using PopART software. Raw sequence files of the COI gene in Vespa soror.

Author Contributions

Conceptualization, J.C., J.Z., J.Y. and Z.W. (Zhenji Wang).; methodology, J.C.; software, J.C. and J.L.; validation, J.C. and J.Z.; formal analysis, J.C.; investigation, J.C., Z.W. (Zian Wang) and Y.G.; resources, J.C.; data curation, J.C. and J.Z.; writing—original draft preparation, J.C. and J.Z.; writing—review and editing, J.Y. and Z.W. (Zhenji Wang); visualization, J.C.; supervision, J.Y. and Z.W. (Zhenji Wang); project administration, J.Y. and Z.W. (Zhenji Wang); funding acquisition, J.Y. and Z.W. (Zhenji Wang). All authors have read and agreed to the published version of the manuscript.

Funding

This work was funded by grant from the Young Top-Notch Talent of Yunnan Outstanding Talent Program (YNWR-QNBJ-2020-104); Yunnan Fundamental Research Projects (NO. 202101BA070001-188, 202401AT070301); Open Research Program of State Key Laboratory for Conservation and utilization of Bio-Resource in Yunnan (gzk2022005); Chuxiong Normal University-level scientific research team (B05); Chuxiong Prefecture will self-fund science and technology projects (cxzc2025034, cxzc2025039). Open Research Program of Laboratory in Chuxiong Normal University (NO. 31).

Institutional Review Board Statement

The Vespa soror used in this experiment is a common non-protected species. Species identification was conducted with reference to <A Color Atlas of the Chinese Vespid Wasp> and <Potentially Lethal Social Wasps Fauna of the Chinese Vespinae (Hymenoptera: Vespida)>. No species listed as endangered in the IUCN Red List were involved in the experimental process.

Data Availability Statement

The data presented in this study are available on request from the corresponding author.

Acknowledgments

We sincerely thank Yuang Zhang (College of Forestry, Southwest Forestry University) for his ideas and suggestions for revision, and sincerely acknowledge the valuable assistance rendered by Zhixing Xia, Jun Liu, and others in the process of samples collection.

Conflicts of Interest

The authors declare no conflicts of interest.

Abbreviations

The following abbreviations are used in this manuscript:
COIcytochrome c oxidase subunit I
Cytbcytochrome b
mtDNAmitochondrial DNA
V. sororVespa soror
V. velutinaVespa velutina
A. ceranaApis cerana
DNADeoxyribonucleic Acid
PCRPolymerase Chain Reaction
ddH2Odouble-distilled water
BlastBasic Local Alignment Search Tool
NCBINational Center for Biotechnology Information
A, T, C, GAdenine, Thymine, Cytosine, Guanine
AMOVAAnalysis of Molecular Variance
FstFixation Index
NmNumber of migrants per generation
HapHaplotype
HdHaplotype Diversity
Tajima’s DTajima’s D statistic
Fu’s FsFu’s Fs statistic

Appendix A

Figure A1. Variable sites of mitochondrial DNA COI gene haplotypes in V. soror.
Diversity 17 00756 g0a1

References

  1. Carpenter, J.; Kojima, J.-I.; Villemant, C. Phylogeny of hornets: A total evidence approach (Hymenoptera, Vespidae, Vespinae, Vespa). J. Hymenopt. Res. 2013, 32, 1. [Google Scholar] [CrossRef]
  2. Dehghani, R.; Kassiri, H.; Mazaheri-Tehrani, A.; Hesam, M.; Valazadi, N.; Mohammadzadeh, M. A study on habitats and behavioral characteristics of hornet wasp (Hymenoptera: Vespidae: Vespa orientalis), an important medical-health pest. Biomed. Res. 2019, 30, 61–66. [Google Scholar] [CrossRef]
  3. Taylor, B.A.; Tembrock, L.R.; Sankovitz, M.; Wilson, T.M.; Looney, C.; Takahashi, J.; Gilligan, T.M.; Smith-Pardo, A.H.; Harpur, B.A. Population genomics of the invasive Northern Giant Hornet Vespa mandarinia in North America and across its native range. Sci. Rep. 2024, 14, 10803. [Google Scholar] [CrossRef] [PubMed]
  4. Mattila, H.R.; Otis, G.W.; Billen, J.; Nguyen, L.T.; Shimano, S. Comparison of the external morphology of the sternal glands for hornets in the genus Vespa. Biology 2022, 11, 245. [Google Scholar] [CrossRef]
  5. Kim, C.-J.; Choi, M.B. First discovery of Vespa velutina nigrithorax du Buysson (Hymenoptera: Vespidae), an invasive hornet in the feces of the yellow-throated marten in South Korea. Insects 2021, 12, 296. [Google Scholar] [CrossRef]
  6. Jeong, H.; Kim, J.M.; Kim, B.; Nam, J.-O.; Hahn, D.; Choi, M.B. Nutritional value of the larvae of the alien invasive wasp Vespa velutina nigrithorax and amino acid composition of the larval saliva. Foods 2020, 9, 885. [Google Scholar] [CrossRef]
  7. Mozhui, L.; Kakati, L.; Kiewhuo, P.; Changkija, S. Traditional knowledge of the utilization of edible insects in Nagaland, North-East India. Foods 2020, 9, 852. [Google Scholar] [CrossRef]
  8. Kiewhuo, P.; Mozhui, L.; Kakati, L.; Meyer-Rochow, V. Traditional rearing techniques of the edible Asian giant hornet (Vespa mandarinia Smith) and its socio-economic perspective in Nagaland, India. J. Insects Food Feed 2022, 8, 325–336. [Google Scholar] [CrossRef]
  9. Mattila, H.R.; Nguyen, L.T.; Perrard, A.; Bain, M.; Otis, G.W. Biology of the southern giant hornet, Vespa soror: Nest architecture, morphological differences among castes, and the genetic structure of colonies. Front. Insect Sci. 2023, 3, 1136297. [Google Scholar] [CrossRef]
  10. Kumar, P.G.; Srinivasan, G. New record of Vespa soror du Buysson (Hymenoptera: Vespidae) from India. Rec. Zool. Surv. India 2009, 109, 111–112. [Google Scholar] [CrossRef]
  11. Bass, A.; Needham, K.; Bennett, A.M. First record of Vespa crabro Linnaeus (Hymenoptera: Vespidae) in western North America with a review of recorded species of Vespa Linnaeus in Canada. Zootaxa 2022, 5154, 305–318. [Google Scholar] [CrossRef] [PubMed]
  12. Smith-Pardo, A.H.; Carpenter, J.M.; Kimsey, L. The diversity of hornets in the genus Vespa (Hymenoptera: Vespidae; Vespinae), their importance and interceptions in the United States. Insect Syst. Divers. 2020, 4, 2. [Google Scholar] [CrossRef]
  13. Arca, M.; Mougel, F.; Guillemaud, T.; Dupas, S.; Rome, Q.; Perrard, A.; Muller, F.; Fossoud, A.; Capdevielle-Dulac, C.; Torres-Leguizamon, M. Reconstructing the invasion and the demographic history of the yellow-legged hornet, Vespa velutina, in Europe. Biol. Invasions 2015, 17, 2357–2371. [Google Scholar] [CrossRef]
  14. Granato, A.; Negrisolo, E.; Bonomi, J.; Zulian, L.; Cappa, F.; Bortolotti, L.; Mutinelli, F. Recent confirmation of a single haplotype in the Italian population of Vespa velutina. Biol. Invasions 2019, 21, 2811–2817. [Google Scholar] [CrossRef]
  15. Wang, W.; Ma, C.; Chen, W.; Jin, Z.; Zhao, M.; Zhang, F.; Liu, Z.; Ma, L. Population genetic diversity of mud crab (Scylla paramamosain) from southeast coastal regions of China based on mitochondrial COI gene sequence. Gene 2020, 751, 144763. [Google Scholar] [CrossRef]
  16. Wang, H.; Wen, Q.; Wang, T.; Ran, F.; Wang, M.; Fan, X.; Wei, S.; Li, Z.; Tan, J. Next-generation sequencing of four mitochondrial genomes of Dolichovespula (Hymenoptera: Vespidae) with a phylogenetic analysis and divergence time estimation of Vespidae. Animals 2022, 12, 3004. [Google Scholar] [CrossRef]
  17. Chen, P.-Y.; Wei, S.-J.; Liu, J.-X. The mitochondrial genome of the Vespa mandarinia Smith (Hymenoptera: Vespidae: Vespinae) and a phylogenetic analysis of the Vespoidea. Mitochondrial DNA Part A 2016, 27, 4414–4415. [Google Scholar] [CrossRef]
  18. Euo, S.-S.; Choi, J.-H.; Choi, M.B.; Kim, I.-K.; Kim, C.-J. The mitochondrial genome of a social wasp, Vespula rufa (Linnaeus, 1758) (Hymenoptera: Vespidae). Mitochondrial DNA Part B 2024, 9, 1024–1028. [Google Scholar] [CrossRef]
  19. Wu, H.; Qi, S.; Fan, S.; Li, H.; Zhang, Y.; Zhang, Y.; Xu, Q.; Chen, G. Analysis of the Mitochondrial COI Gene and Genetic Diversity of Endangered Goose Breeds. Genes 2024, 15, 1037. [Google Scholar] [CrossRef]
  20. Xia, L.; Cai, F.; Chen, S.; Cai, Y.; Zhou, K.; Yan, J.; Li, P. Phylogenetic Analysis and Genetic Structure of Schlegel’s Japanese Gecko (Gekko japonicus) from China Based on Mitochondrial DNA Sequences. Genes 2022, 14, 18. [Google Scholar] [CrossRef] [PubMed]
  21. Sun, Z.; Chapman, N.C.; Raffiudin, R.; Putra, R.E.; Roberts, J.; Widjaya, C.; Buchmann, G.; Holmes, M.; Gloag, R. Loss of mitochondrial diversity in invasive populations of Asian honey bees, Apis cerana (Hymenoptera: Apidae), in the Austral-Pacific. Austral Entomol. 2022, 61, 97–103. [Google Scholar] [CrossRef]
  22. Wang, M.M.; Yin, P.K.; Tang, Y.N.; Yang, Z.Z.; Xiao, H.; Zhang, C.G.; Yang, Y.H.; Yang, D.S. Utility of DNA barcoding for identification of common Vespa species (Hymenoptera: Vespidae) from Yunnan, China. Entomol. Res. 2022, 52, 111–117. [Google Scholar] [CrossRef]
  23. Kim, J.S.; Jeong, J.S.; Jeong, S.Y.; Kim, M.J.; Kim, I. Complete mitochondrial genome of the black-tailed hornet, Vespa ducalis (Hymenoptera: Vespidae): Genomic comparisons in Vespoidea. Entomol. Res. 2017, 47, 129–136. [Google Scholar] [CrossRef]
  24. Sertić Kovačević, M.; Baričević, A.; Kružić, P.; Maurić Maljković, M.; Hamer, B. Barcoding (COI) Sea Cucumber Holothuria mammata Distribution Analysis: Adriatic Rare or Common Species? Genes 2023, 14, 2059. [Google Scholar] [CrossRef]
  25. Takeuchi, T.; Takahashi, R.; Kiyoshi, T.; Nakamura, M.; Minoshima, Y.; Takahashi, J. The origin and genetic diversity of the yellow-legged hornet, Vespa velutina introduced in Japan. Insectes Sociaux 2017, 64, 313–320. [Google Scholar] [CrossRef]
  26. Abd-El-Samie, E.M.; Elkafrawy, I.; Osama, M.; Ageez, A. Molecular phylogeny and identification of the Egyptian wasps (Hymenoptera: Vespidae) based on COI mitochondrial gene sequences. Egypt. J. Biol. Pest Control 2018, 28, 36. [Google Scholar] [CrossRef]
  27. Zhou, C.j.; Feng, M.x.; Tang, Y.t.; Yang, C.x.; Meng, X.l.; Nie, G.x. Species diversity of freshwater shrimp in Henan Province, China, based on morphological characters and COI mitochondrial gene. Ecol. Evol. 2021, 11, 10502–10514. [Google Scholar] [CrossRef]
  28. Hall, T.A. BioEdit: A user-friendly biological sequence alignment editor and analysis program for Windows 95/98/NT. In Proceedings of the Nucleic Acids Symposium Series; Oxford University Press: Oxford, UK, 1999; pp. 95–98. [Google Scholar]
  29. Hammer, O. PAST: Paleontological statistics software package for education and data analysis. Palaeontol. Electron. 2001, 4, 9. [Google Scholar]
  30. Bloch, N.A.; Runyan, C.L.; Speshock, J.L.; Lambert, B.D.; Wellmann, K.B.; Tifft, K.; Brady, J.A. Investigating Bovine Blood Prokaryotic Microbial Populations Through 16S V4 Sequencing, qPCR, and dPCR, with a Specific Focus on Hemotrophic Mycoplasma wenyonii. Ruminants 2025, 5, 45. [Google Scholar] [CrossRef]
  31. Kumar, S.; Stecher, G.; Li, M.; Knyaz, C.; Tamura, K. MEGA X: Molecular evolutionary genetics analysis across computing platforms. Mol. Biol. Evol. 2018, 35, 1547–1549. [Google Scholar] [CrossRef]
  32. Zhang, X.; He, Y.; Zhang, W.; Wang, Y.; Liu, X.; Cui, A.; Gong, Y.; Lu, J.; Liu, X.; Huo, X. Development of microsatellite marker system to determine the genetic diversity of experimental chicken, duck, goose, and pigeon populations. BioMed Res. Int. 2021, 2021, 8851888. [Google Scholar] [CrossRef] [PubMed]
  33. Rozas, J.; Ferrer-Mata, A.; Sánchez-DelBarrio, J.C.; Guirao-Rico, S.; Librado, P.; Ramos-Onsins, S.E.; Sánchez-Gracia, A. DnaSP 6: DNA sequence polymorphism analysis of large data sets. Mol. Biol. Evol. 2017, 34, 3299–3302. [Google Scholar] [CrossRef] [PubMed]
  34. Excoffier, L.; Lischer, H.E. Arlequin suite ver 3.5: A new series of programs to perform population genetics analyses under Linux and Windows. Mol. Ecol. Resour. 2010, 10, 564–567. [Google Scholar] [CrossRef] [PubMed]
  35. Excoffier, L.; Smouse, P.E.; Quattro, J.M. Analysis of molecular variance inferred from metric distances among DNA haplotypes: Application to human mitochondrial DNA restriction data. Genetics 1992, 131, 479–491. [Google Scholar] [CrossRef]
  36. Leigh, J.W.; Bryant, D.; Nakagawa, S. POPART: Full-feature software for haplotype network construction. Methods Ecol. Evol. 2015, 6, 1110–1116. [Google Scholar] [CrossRef]
  37. Wei, S.-J.; Shi, M.; Chen, X.-X.; Sharkey, M.J.; van Achterberg, C.; Ye, G.-Y.; He, J.-H. New views on strand asymmetry in insect mitochondrial genomes. PLoS ONE 2010, 5, e12708. [Google Scholar] [CrossRef]
  38. Cen, X.; Zhang, G.; Liu, H.; Yao, G.; Xiong, P.; He, M.; Liu, W. Analysis of genetic diversity in two different shell colors of the giant triton snail (Charonia tritonis) based on mitochondrial COI sequences. Front. Mar. Sci. 2023, 9, 1066750. [Google Scholar] [CrossRef]
  39. Wang, S.-H.; Zhang, C.; Shang, M.; Wu, X.-G.; Cheng, Y.-X. Genetic diversity and population structure of native mitten crab (Eriocheir sensu stricto) by microsatellite markers and mitochondrial COI gene sequence. Gene 2019, 693, 101–113. [Google Scholar] [CrossRef]
  40. Yi, C.H.; Yoon, M.; Kim, J.M.; Kim, I.-H.; Cho, I.-Y.; An, H.S. Genetic analysis and population genetic structure of hard-shelled mussel, Mytilus coruscus Gould 1861 (Mytiloida: Mytilidae) from the coasts of South Korea based on mitochondrial cytochrome oxidase (COI) gene sequences. Genes Genom. 2021, 43, 577–585. [Google Scholar] [CrossRef]
  41. Budge, G.E.; Hodgetts, J.; Jones, E.P.; Ostojá-Starzewski, J.C.; Hall, J.; Tomkies, V.; Semmence, N.; Brown, M.; Wakefield, M.; Stainton, K. The invasion, provenance and diversity of Vespa velutina Lepeletier (Hymenoptera: Vespidae) in Great Britain. PLoS ONE 2017, 12, e0185172. [Google Scholar] [CrossRef]
  42. Liu, W.; Duan, Z.; Wang, D.; Zhao, W.; Liu, P. Phylogenetic relationships and genetic differentiation of two Salamandrella species as revealed via COI gene from Northeastern China. PLoS ONE 2024, 19, e0298221. [Google Scholar] [CrossRef]
  43. Jiang, S.; Li, Z.; Li, J.; Xu, K.; Ye, Y. Analysis of genetic diversity and structure of eight populations of Nerita yoldii along the Coast of China based on mitochondrial COI gene. Animals 2024, 14, 718. [Google Scholar] [CrossRef]
  44. Jeong, J.S.; Kim, M.J.; Park, J.S.; Lee, K.H.; Jo, Y.H.; Takahashi, J.-i.; Choi, Y.S.; Kim, I. Tracing the invasion characteristics of the yellow-legged hornet, Vespa velutina nigrithorax (Hymenoptera: Vespidae), in Korea using newly detected variable mitochondrial DNA sequences. J. Asia-Pac. Entomol. 2021, 24, 135–147. [Google Scholar] [CrossRef]
  45. Wright, S. Evolution in Mendelian populations. Genetics 1931, 16, 97. [Google Scholar] [CrossRef]
  46. Rousset, F. Genetic differentiation and estimation of gene flow from F-statistics under isolation by distance. Genetics 1997, 145, 1219–1228. [Google Scholar] [CrossRef] [PubMed]
  47. Herrera, C.; Ferragut, J.F.; Leza, M.; Jurado-Rivera, J.A. Invasion genetics of the yellow-legged hornet Vespa velutina in the Westernmost Mediterranean archipelago. J. Pest Sci. 2024, 97, 645–656. [Google Scholar] [CrossRef]
  48. Sauvard, D.; Imbault, V.; Darrouzet, É. Flight capacities of yellow-legged hornet (Vespa velutina nigrithorax, Hymenoptera: Vespidae) workers from an invasive population in Europe. PLoS ONE 2018, 13, e0198597. [Google Scholar] [CrossRef] [PubMed]
  49. Wilson, T.M.; Takahashi, J.; Spichiger, S.-E.; Kim, I.; Van Westendorp, P. First reports of Vespa mandarinia (Hymenoptera: Vespidae) in North America represent two separate maternal lineages in Washington state, United States, and British Columbia, Canada. Ann. Entomol. Soc. Am. 2020, 113, 468–472. [Google Scholar] [CrossRef]
  50. Tajima, F. The effect of change in population size on DNA polymorphism. Genetics 1989, 123, 597–601. [Google Scholar] [CrossRef]
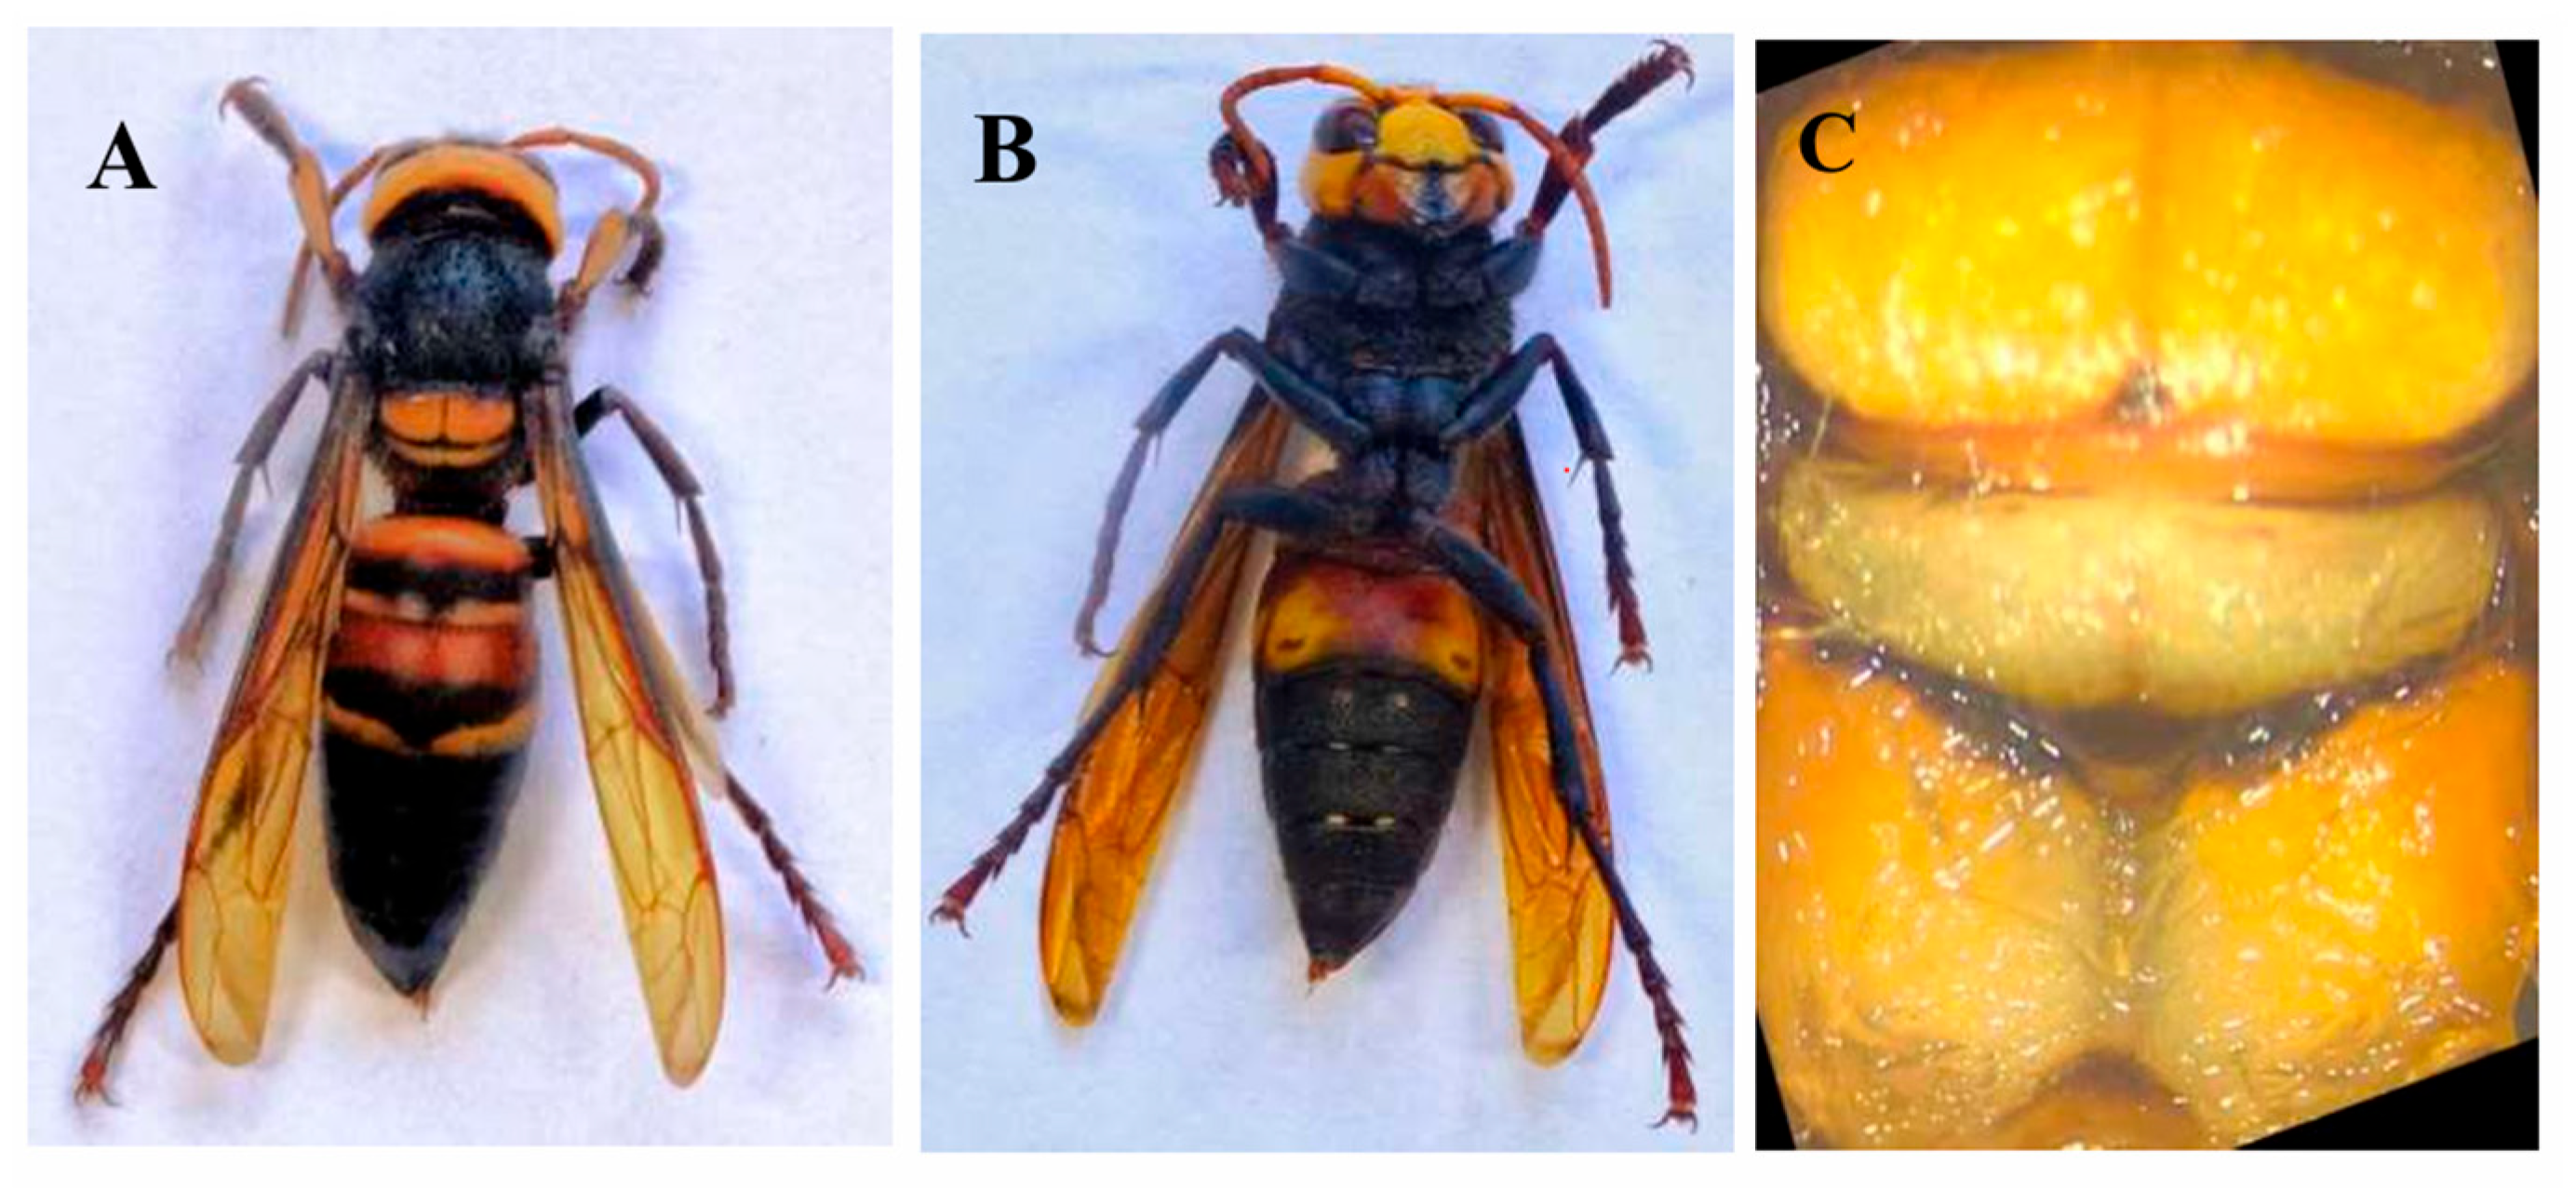
Figure 1. Dorsal (A), ventral (B) and parallel abdominal segment (C) images of Vespa soror.
Diversity 17 00756 g001
Figure 2. Locations of sampling sites of V. soror.
Diversity 17 00756 g002
Figure 3. The genetic differentiation coefficient (Fst) of the V. soror calculated based on the COI gene.
Diversity 17 00756 g003
Figure 4. Analysis of the mismatch distribution of 15 populations of V. soror based on COI gene.
Diversity 17 00756 g004
Figure 5. Haplotype TCS network of V. soror based on COI gene.
Diversity 17 00756 g005
Table 1. Genetic diversity index based on COI genes.
PopulationHaplotypes (Hap)Segregating
Site (S)
Haplotype
Diversity (Hd)
Nucleotide
Diversity (Pi)
Average Number
of Difference (K)
AYH1(2), H2(4)130.533 ± 0.1720.01127 ± 0.003646.93333
DHH1(1), H3(5)120.333 ± 0.2150.00650 ± 0.004204.00000
ESH1(3), H4(2), H5(1)40.733 ± 0.1550.00347 ± 0.000742.13333
FNH6(1), H7(2), H8(1), H9(1), H10(1)150.933 ± 0.1220.00932 ± 0.003835.73333
GXH11(2), H12(4)110.533 ± 0.1720.00954 ± 0.003085.86667
HZH13(6)0000
LSH3(4), H13(2)10.533 ± 0.1720.00087 ± 0.000280.53333
MGH14(6)0000
NFH3(1), H13(1), H15(2), H16(1), H17(1)130.933 ± 0.1220.01171 ± 0.002707.20000
QBH1(1), H10(2), H18(2), H19(1)160.867 ± 0.1290.01225 ± 0.003747.53333
QYH13(4), H20(2)20.533 ± 0.1720.00173 ± 0.000561.06667
STH21(1), H22(5)20.333 ± 0.2150.00108 ± 0.000700.66667
WHH17(2), H20(3), H23(1)40.733 ± 0.1550.00369 ± 0.000802.26667
YSH3(1), H17(1), H20(1), H24(2), H25(1)60.933 ± 0.1220.00401 ± 0.000752.46667
ZYH2(2), H26(4)120.533 ± 0.1720.01041 ± 0.003366.40000
TotalHap-1~Hap-26280.941 ± 0.0100.01068 ± 0.000796.57104
Note: Uniform samples of 6 were used for all 15 populations, i.e., 6 COI gene sequences were utilized per population.
Table 2. Analysis of the historical population dynamics of V. soror.
PopulationTajima’s Dp Value Fu’s Fsp Value
AY 1.33148p > 0.106.639/
DH −1.453260.10 > p > 0.054.828/
ES1.18059p > 0.101.141/
FN−1.12437p > 0.10−0.114/
GX1.31709p > 0.106.057/
HZ--00
LS0.85057p > 0.100.625/
MG--00
NF1.07021p > 0.100.271/
QB0.46426p > 0.101.986/
QY1.03194p > 0.101.723/
ST−1.13197p > 0.100.952/
WH1.59319p > 0.101.256/
YS−0.35084p > 0.10−1.672/
ZY1.32483p > 0.106.357/
Total0.12833p > 0.10−4.001/
Table 3. Analysis of Variance (AMOVA) of molecular variation in 15 geographic populations of V. soror based on COI genes. Degrees of freedom (d.f.).
Source of
Variation
DfSum of SquaresVariance ComponentsPercentage of VariationFixation Indicesp-Value
Among populations14160.4111.61632 Va 47.87%
Within populations75132.0001.76000 Vb 52.13%
Total89292.4113.37632100%FST:0.478720.00000
Note: Va denotes genetic variation among groups (e.g., among 15 geographical populations), Vb: represents genetic variation among populations within the same group.
Table 4. Analysis of Molecular Variance (AMOVA) for V. soror Populations Based on the COI Gene: Comparison Between Populations from Yunnan (ES, FN, MG, QB, ZY) and the Remaining 10 Populations.
Source of
Variation
DfSum of SquaresVariance ComponentsPercentage of VariationFixation Indicesp-Value
Among groups133.0940.58252 Va15.82%FCT:0.158230.00000
Among populations
Within groups
13127.3171.33893 Vb36.37%FSC:0.432060.00000
Within populations75132.0001.76000 Vc47.81%
Total89292.4113.68145100%FST:0.521930.00978
Note: Va: denotes genetic variation among groups (e.g., among 15 geographical populations). Vb: represents genetic variation among populations within the same group. Vc: signifies genetic variation among individuals within a single population.
Disclaimer/Publisher’s Note: The statements, opinions and data contained in all publications are solely those of the individual author(s) and contributor(s) and not of MDPI and/or the editor(s). MDPI and/or the editor(s) disclaim responsibility for any injury to people or property resulting from any ideas, methods, instructions or products referred to in the content.