Article

Genetic Differences Between Wild Transplanted and Farmed Populations of Banggai Cardinalfish Pterapogon kauderni Based on Mitochondrial Control Region and SNP Polymorphism

Aquatic Molecular Genetics and Biotechnology Research Team, National Center for Genetic Engineering and Biotechnology (BIOTEC), National Science and Technology Development Agency (NSTDA), Khlong Nueng, Khlong Luang, Pathum Thani 12120, Thailand
*
Authors to whom correspondence should be addressed.
These authors contributed equally to this work.
Diversity 2025, 17(11), 754; https://doi.org/10.3390/d17110754
Submission received: 9 September 2025 / Revised: 20 October 2025 / Accepted: 22 October 2025 / Published: 28 October 2025

Abstract

Genetic diversity and population differentiation of an aquaculture population of Banggai cardinalfish (Pterapogon kauderni) introduced and maintained in Phang Nga province, Southern Thailand (A1, N = 45) was examined using control region (CR) polymorphism in comparison with three wild transplanted populations from Gilimanuk Bay (Bali), collected in 2019 (W1, N = 25), Banyuwangi (East Java), collected in 2024 (W2, N = 22), and Gilimanuk Bay (Bali), collected in 2024 (W3, N = 39). In total, 14 haplotypes were identified. Haplotype 3 was found in all populations, while haplotype 4 was found in wild transplanted but not in aquaculture populations. The remaining (12) haplotypes were private haplotypes. Of these, five private haplotypes (H5, H6, H7, H8 and H9) were found only in the A1 population. Moreover, genome-wide single nucleotide polymorphisms (SNPs) in P. kauderni from A1 (N = 21), W2 (N = 15) and W3 (N = 15) populations were also analyzed by Specific Locus Amplified Fragment-Sequencing (SLAF-Seq). In total, 648,378 SNPs were identified. By analyzing both mitochondrial DNA and SNP markers, significant genetic differences were clearly found between farmed and wild transplanted populations of P. kauderni. Reduced genetic diversity was found in a farmed population from genome-wide SNPs but not mtDNA analyses.

1. Introduction

Among members of the family Apogonidae, the Banggai cardinalfish (Pterapogon kauderni) is the most well-known ornamental species [1]. It is an endemic species of the Banggai Islands, Sulawesi, Indonesia. The narrow range of natural distribution of P. kauderni (approximately 5000 km2) is mainly owing to their lack of planktonic larval stages [2]. The banggai cardinalfish is listed as an endangered species by the Convention on the International Trade in Endangered Species of Wild Flora and Fauna (CITES) Appendix II [3] and the International Union for the Conservation of Nature (IUCN) Red List [4]. The reduction in Banggai cardinalfish populations in their native habitats has brought about the development of their restocking through aquaculture in several areas [1,5,6,7,8]. The species has been introduced (transplanted) to the Bali Strait [1,5] and other areas in Sulawesi, including Manado in North Sulawesi, Kendari in Southeast Sulawesi, and Palu in Central Sulawesi. In addition, it has been transplanted to Banyuwangi in East Java and other areas in Indonesia [6,7,8].
Natural populations of P. kauderni have been heavily harvested for the aquarium trade. It was estimated to have been traded by local people in the Banggai Islands at a rate of approximately 118,000 fish/month from 1992 to 2000 [9]. The trade volume of this species was quite high, but its limited distribution resulted in a continuous decrease in wild P. kauderni stock. Currently, the capture of wild P. kauderni has shifted from the endemic populations to the newly transplanted populations in Manado, Kendari, and Palu in Sulawesi, Banyuwangi in East Java, and Gilimanuk Bay in Bali. In 2024, the Ministry of Fisheries, upon recommendation from the National Research and Innovation Agency (BRIN), established a quota for permitted exports of P. kauderni at a maximum of 13,000 fish from Gilimanuk Bay (Bali), 2000 from Banyuwangi (East Java), 10,000 from Palu (Central Sulawesi), 10,000 from Kendari (Southeast Sulawesi), and 3000 from Manado (North Sulawesi).
A previous study based on CR polymorphism indicated that 14 mtDNA haplotypes were found in P. kauderni from 16 Islands within the Banggai Archipelago (N = 3–10 per population). The population structure of its endemic populations was examined for the southwestern population (southwest of Bangkulu Island) and all the remaining populations from the northern and eastern Banggai Archipelago [10]. Subsequently, population genetic differentiation of transplanted P. kauderni was examined from four locations in Gilimanuk Bay, Bali strait (N = 5–8 from each location) Moreover, a strong genetic structure of endemic P. kauderni from seven sites in the Banggai Archipelago was found in microgeographic scales of 2–5 km distances [11]. Similar circumstances were observed in small-scale areas in Bangkulu Island based on the same set of microsatellites [12].
Trading of marine ornamental fish relies mainly on wild fish from tropical coral reef ecosystems [13]. Although the value of marine ornamental species is extremely high, the number of cultured marine species is limited (<1%). The ability to supply the market with ornamental fish produced through closed-cycle aquaculture is crucial for the sustainability of this sector [14]. In addition, marine ornamental aquaculture is an effective approach to increase the supply, leading to reduced pressure on wild populations [13,14].
In Thailand, the collection of wild marine ornamental fish and invertebrates is prohibited, and only aquaculture stocks are allowed to be exported under strict government control. In 2009, Nautilus Park, an aquaculture farm located in Phang Nga Province (Southern Thailand) introduced P. kauderni from Indonesia in collaboration with the Department of Fisheries of Thailand with the objective of substituting wild catches with aquaculture production. The introduced fish has been selected for its resistance to Banggai iridovirus and has been continuously re-propagated since then, resulting in an average standing stock of around 15,000 Banggai broodstock for many years up to now. However, the genetic status of this aquaculture population has not yet been characterized in comparison with wild (original and/or transplanted) populations in Indonesia. Therefore, genetic diversity, population structure, and admixture of the aquaculture population in comparison with wild native (or transplanted) populations of P. kauderni needs to be investigated.
Population genomics based on a large number of nuclear single nucleotide polymorphism (SNP) markers have not been reported in ornamental fish. Specific Locus Amplified Fragment-Sequencing (SLAF-Seq) is a GBS-based approach that can be applied for isolation of genome-wide SNPs [15]. SLAF-Seq can be used for de novo discovery of SNPs, whether the genome sequences under study are known or not [16]. This method could allow differentiation among wild and farmed populations.
The main objective of this study was to illustrate the genetic differences between naturalized P. kauderni populations (hereafter called wild transplanted fish) in Indonesia and farmed P. kauderni in Thailand. Here, the genetic diversity of the aquaculture population introduced and maintained at Phang Nga (southern Thailand) by Nautilus Park was examined using polymorphism of the control region (CR) and genome-wide SNPs identified by SLAF-Seq. Levels of genetic diversity and differentiation of the aquaculture population were compared with the wild transplanted populations W1 (Gilimanuk Bay, Bali, collected in 2019) [1], W2 (Banyuwangi, East Java, collected in 2024), and W3 (Gilimanuk Bay, Bali, collected in 2024). Clear genetic differences between the aquaculture and wild transplanted P. kauderni were found. The results confirm that the aquaculture stock examined in this study was not a wild, captured population of an endangered species, but instead a hatchery-propagated population.

2. Materials and Methods

2.1. Sources of Specimens

Collection of Pterapogon kauderni in the Banggai Marine Protected Area (Indonesia) requires a special permit. Accordingly, wild transplanted P. kauderni specimens were sourced in 2024 (Figure 1) from the transplanted populations W2 (Banyuwangi, East Java, N = 22) and W3 (Gilimanuk Bay, Bali, N = 39). Samples of A1 (aquaculture Banggai cardinalfish, N = 45) were collected from an aquaculture farm, Nautilus Park located in Phang Nga Province (Southern Thailand, Supplementary Table S1). In addition, nucleotide sequences of transplanted fish from W1 (Gilimanuk Bay, Bali, collected in 2019, N = 25), kindly provided by Dr. Nyoman Giri Putra [1], were also included in this study. The W1 fish were originally collected from four proximal locations in Gilimanuk Bay within a few kilometers from one another. However, the exact geographic origins of the provided sequences are not known. Therefore, data were pooled as a single population (Supplementary Table S1 and Figure 1).

2.2. Genomic DNA Extraction

Genomic DNA was extracted from a dorsal spine of each fish using a GF-1 Tissue DNA Extraction Kit following the protocol recommended by the manufacturer (Vivantis Technologies, Selangor, Malaysia). The extracted DNA was analyzed by agarose gel electrophoresis (1.0%). DNA concentrations were estimated using a Nanodrop 2000 spectrophotometer (Thermo Fisher Scientific Inc., Waltham, MA, USA) and stored at 4 °C until analyzed.

2.3. PCR and DNA Sequencing

PCR was carried out to amplify the CR segment using primers CRA (5′-TTCCACCTCTAACTCCCAAAGCTAG-3′) and CRE (CCTGAAGTAGGAACCAGATG) [17]. The amplification conditions were initial denaturation at 94 °C for 3 min followed by 35 cycles of denaturation at 94 °C for 45 s, annealing at 53 °C for 1 min and extension at 72 °C for 45 s. The final extension was carried out at 72 °C for 10 min. The PCR products were verified against a standard 100 bp marker (SIBENZYME US, LLC, West Roxbury, MA, USA) using 1.5% agarose gel electrophoresis. Further purification was performed on the PCR products to remove unincorporated dNTPs and single-stranded primer residues. The purified PCR product of each fish was sequenced in both directions using an automated DNA sequencer (Macrogen Inc., Seoul, Republic of Korea).

2.4. CR Data Analysis

The CR sequences [1] were kindly provided and included in the analysis. Sequences were searched against previously deposited sequences in GenBank using BlastN [18]. The nucleotide sequence of CR of each fish in the present study and those of W1 [1] were multiple aligned by ClustalW [19]. Haplotypes were generated from identical sequences. Nucleotide sequence divergence between pairs of mitotypes was calculated. Haplotype diversity (Hd) and nucleotide diversity (π) within samples and pairwise nucleotide divergence between populations (k) were calculated [20] using DnaSP v6.12.03 [21]. Haplotypes and their relationships (i.e., representation of gene genealogies based on a maximum parsimony approach) were organized in a network with the PopART software v1.7 [22] on the basis of the minimum spanning network (MSN) inference method [23]. Neighbor-joining trees [24] were constructed from nucleotide divergence between pairs of CR sequences of P. kauderni based on the two-parameter method [25] using MEGA11 [26]. F-statistics [27] were applied to test statistically significant differences between pairs of populations using Arlequin 3.5 [28].

2.5. SLAF-Seq Analysis

SLAF libraries were prepared as described previously [15]. Briefly, genomic DNA was digested with RsaI and HaeIII and subjected to preparation by the SLAF libraries. Dual-index sequencing adapters were added at the 3′ and 5′ ends of the digested DNA products. PCR was performed and the products were purified using an E.Z.N.A. Cycle Pure Kit (Omega, Tift County, GA, USA). The purified products were mixed and incubated with RsaI and HaeIII. Paired-end Solexa adaptors (Solexa Inc., Hayward, CA, USA) were added and ligated. The resulting products were purified using a Quick Spin column (Qiagen, Venlo, The Netherlands) and analyzed by 2.0% agarose gel electrophoresis. Electrophoresed fragments (364–464 bp in length) were gel-eluted using a Gel Extraction Kit (Tiangen Biotech, Beijing, China). PCR was carried out to add barcodes. The resulting products were re-amplified. Paired-end sequencing was performed on an Illumina HiSeq sequencing platform (Illumina, San Diego, CA, USA) by Biomarker Technologies Co., Ltd. (Beijing, China).

2.6. SLAF-Seq Data Analysis

Clean reads were generated by removing the adaptor sequences, poly N and low-quality sequence reads using fastp software version 0.21.0 [29]. Q30 ( Q s c o r e = 10 log 10 P ) and GC-content (%) were calculated. SNP/INDEL calling was performed using GATK v3.8 [30] and SAMtools v1.9.1 packages [31]. SNPs with a minor allele frequency (MAF) > 0.05 and locus integrity > 0.5 were retained for subsequent analyses. A bootstrapped neighbor-joining tree (1000 replicates) was generated using a p-distance model in MEGAX [32]. Principal component analysis (PCA) was conducted to determine the clustering status of examined samples [33] using the smartPCA program version 6.0 in the EIGENSOFT package [34]. The first three PCs were used to explain the variation. Population differentiation analysis was examined using unbiased pairwise FST analyzed by Arlequin v3.5 [28]. The P. kauderni samples investigated were divided into two hierarchical groups, including W2-Banyuwangi and Gilimanuk (group A), and the aquaculture population at Nautilus Park (group B). Analysis of molecular variance (AMOVA) among hierarchical groups was estimated using ARLECORE (https://cmpg.unibe.ch/software/arlequin35/Arl35Downloads.html (accessed on 10 August 2025)), the console version of Arlequin v3.5 [28]. Population admixture analysis was examined using ADMIXTURE v1.22 [35] with the putative number of predefined populations (K values) ranging from 1 to 10. The Q matrix for each K value resulted in stacked assignment bar plots generated using the R package Pophelper (http://royfrancis.github.io/pophelper (accessed on 12 August 2025)).

3. Results

3.1. Genetic Diversity and Differentiation Based on CR Polymorphism

A single discrete band of the amplification product was observed in each fish from every population. Nucleotide sequences of the amplified CR segment from 131 individuals of P. kauderni from the wild transplanted and aquaculture populations were examined. Of these, 45 fish were from the A1-aquaculture farm (Phang Nga, Thailand, collected from nine cages, N = 5 each, in 2024). The obtained sequences were compared with the sequences from the wild transplanted population of P. kauderni W1-Gilimanuk Bay (collected in 2019 [1], W2-Banyuwangi (East Java, collected in 2024) and W3-Gilimanuk Bay (Bali, collected in 2024).
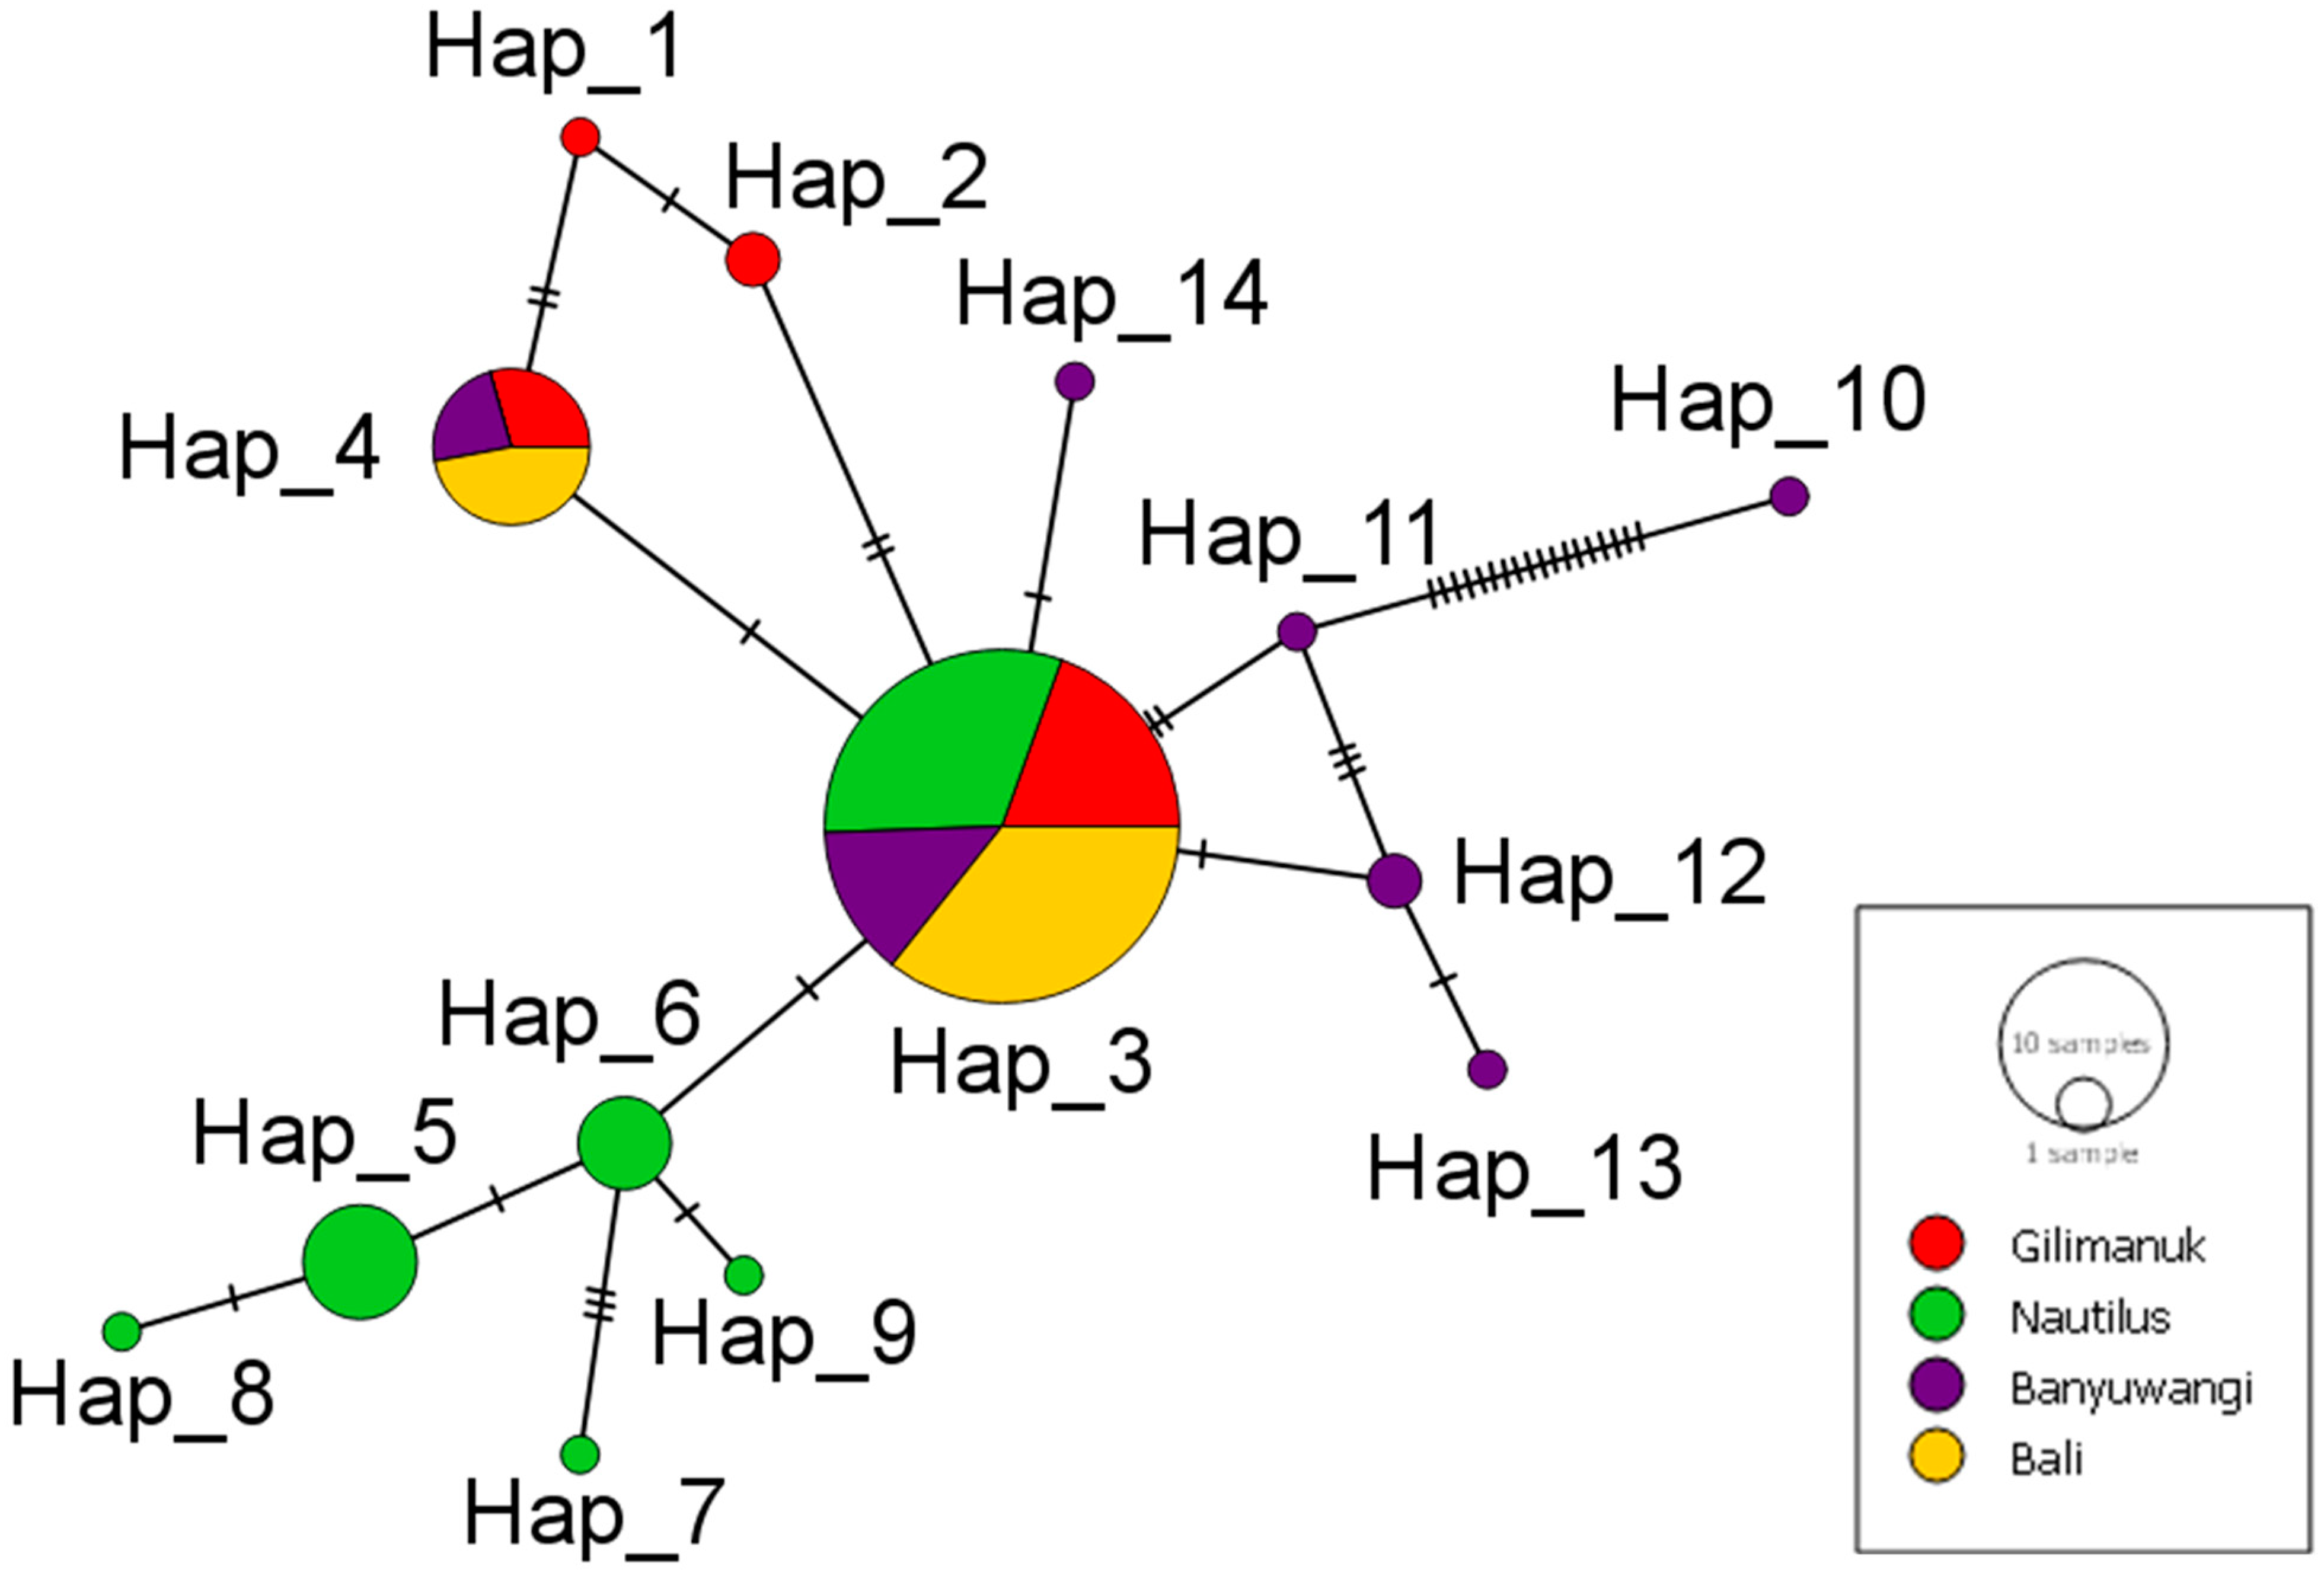
In total, 14 haplotypes were identified: 6 haplotypes from the aquaculture population A1, 4 haplotypes from wild transplanted population W1, 7 haplotypes from wild transplanted population W2, and 2 haplotypes from wild transplanted population W3 (Table 1, Figure 2 and Supplementary Table S2). Haplotype 3 was found in all populations while haplotype 4 was not distributed in aquaculture populations. The remaining haplotypes were private haplotypes (found in only one population). Of these, five private haplotypes (H5, H6, H7, H8 and H9) were specifically found in the A1 population while five (H10–H14) and two (H1 and H2) private haplotypes were distributed in W2 and W3 populations, respectively.
Moderate levels of haplotype diversity (Hd = 0.510–0.688) were found in all populations. The average number of pairwise nucleotide differences (k) and the level of nucleotide diversity (π) in the aquaculture population A1 (1.156 and 0.00257) was greater than those the wild transplanted populations W1 (0.820 and 0.00186) and W3 (0.335 and 0.00074), but lower than those in the wild transplanted population W2 (3.143 and 0.00721).
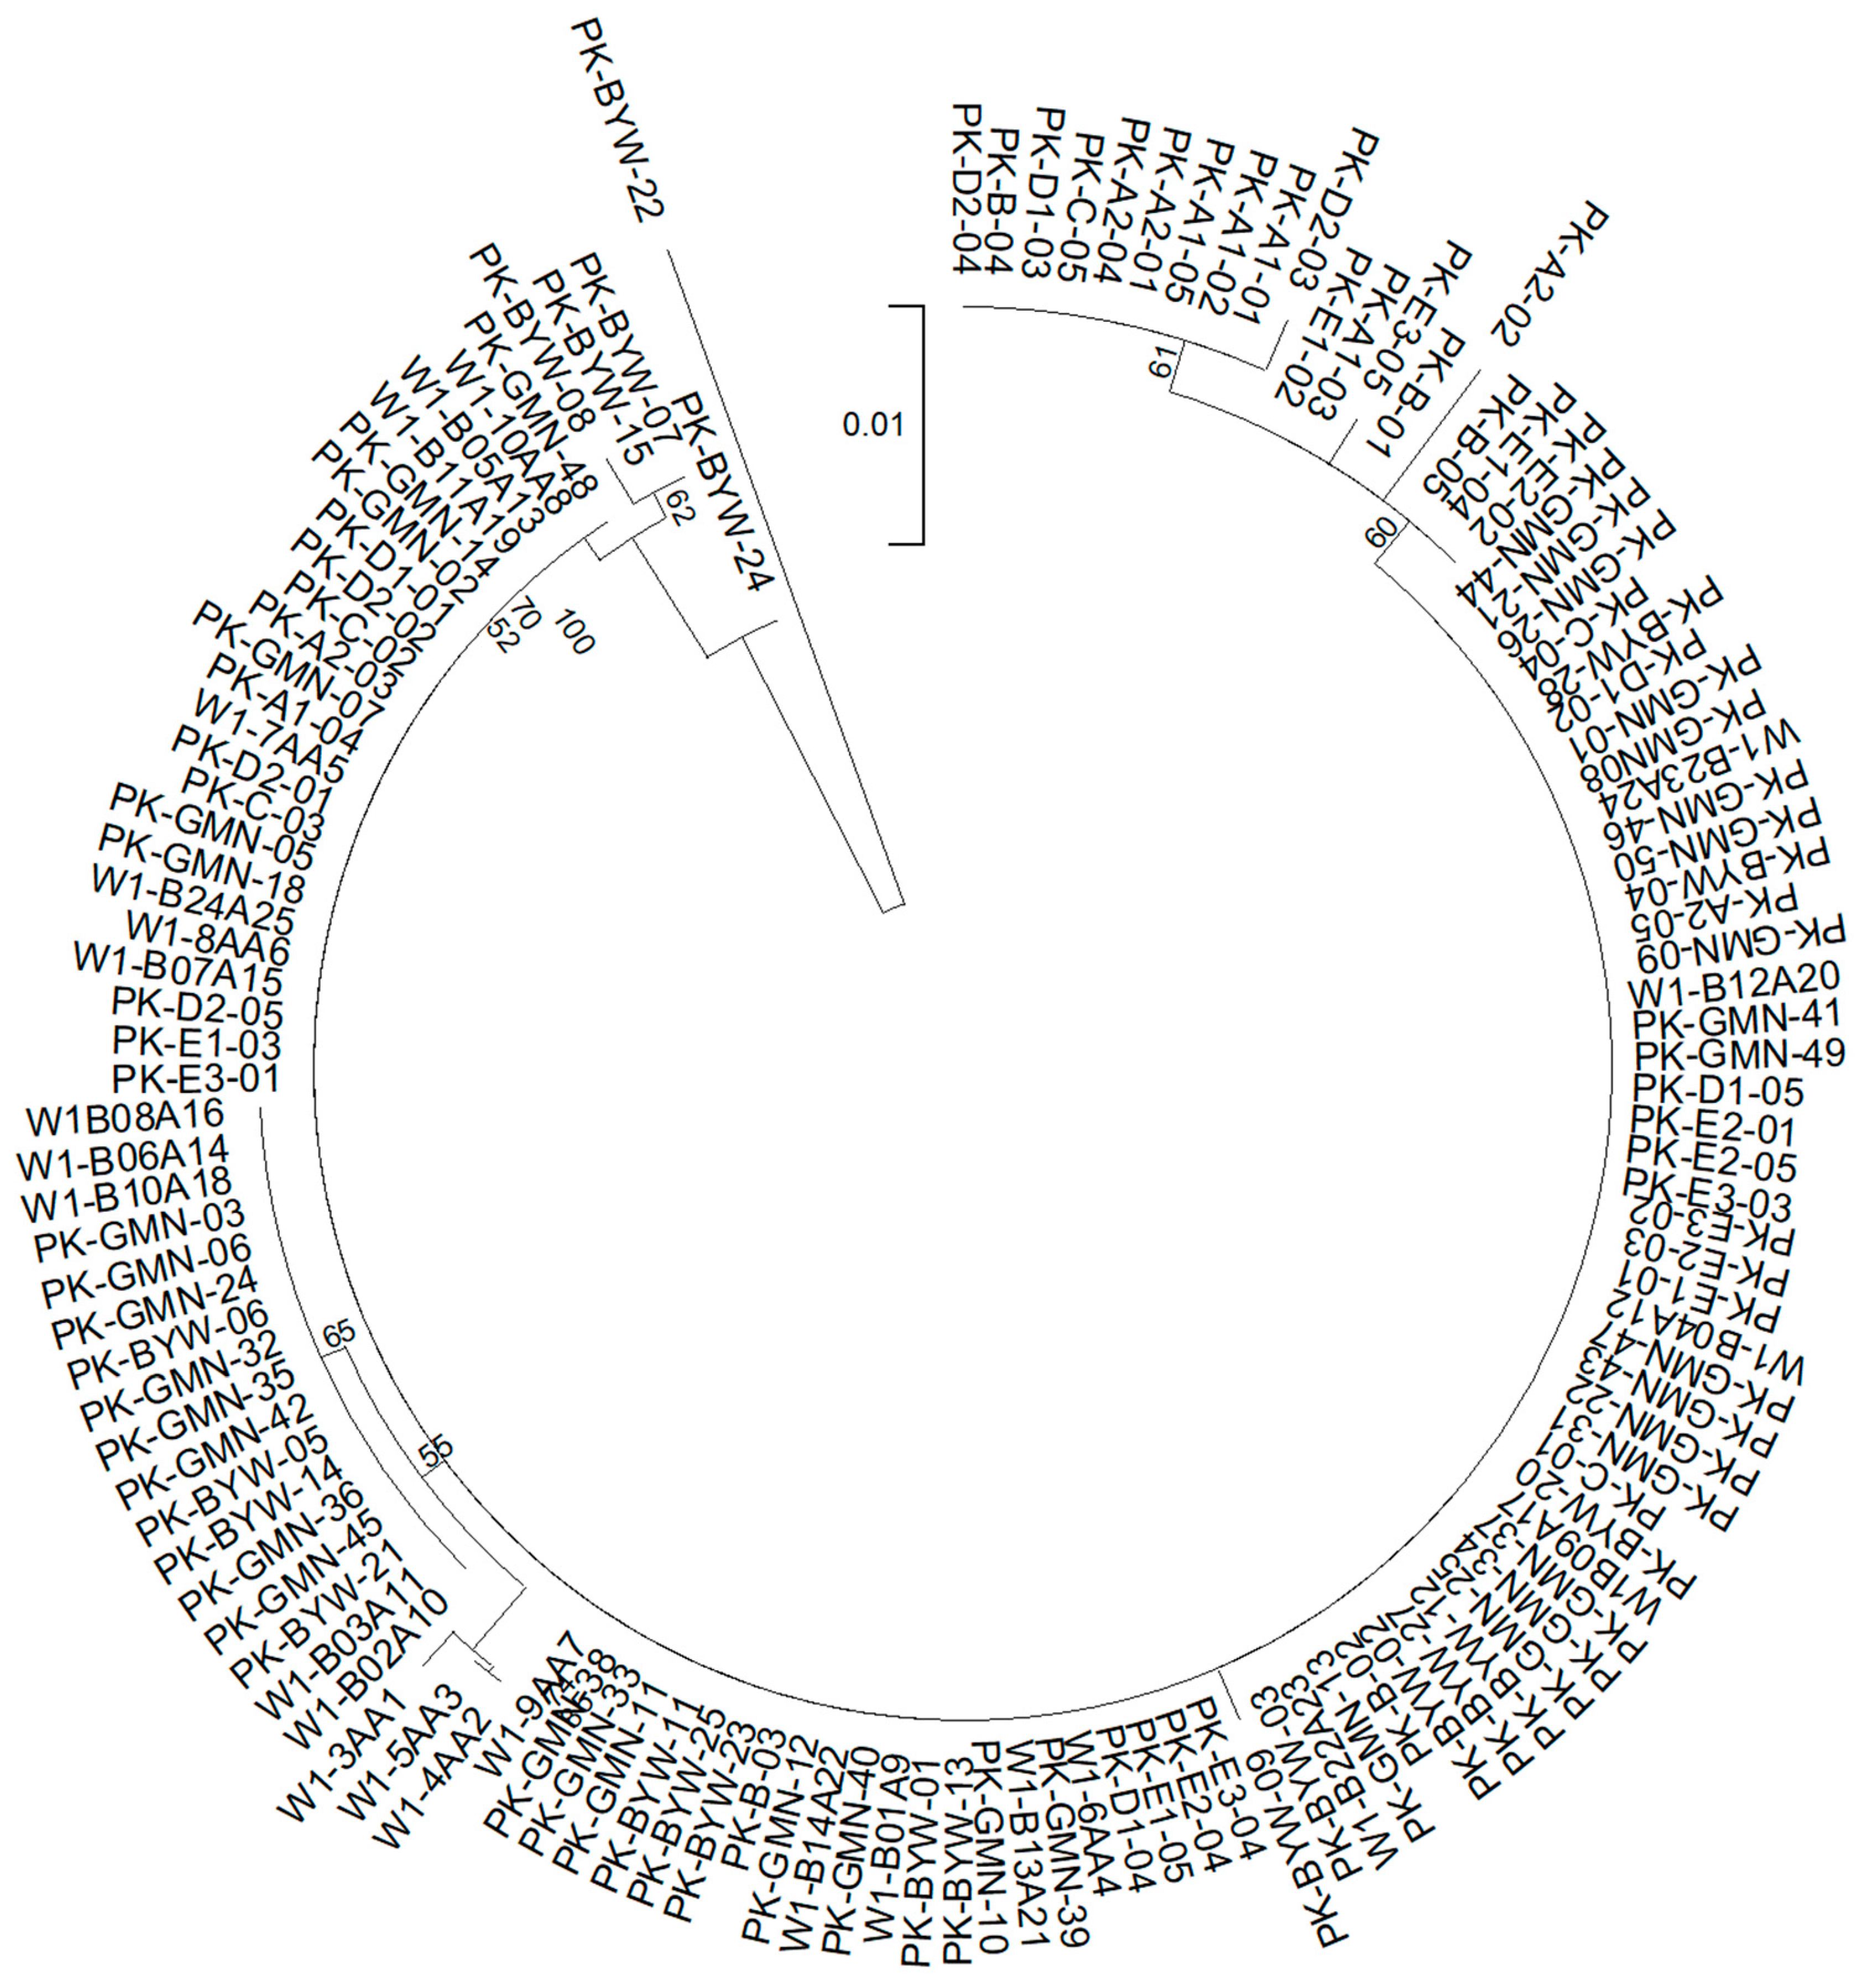
Phylogenetic analysis between paired CR sequences indicated large genetic differences between several fish individuals in the aquaculture population A1 and the wild transplanted populations W1, W2, and W3. Generally, fish from the wild transplanted population were in the same phylogenetic group (Figure 3). Only two individuals from W2 (PK-BYW-22 and PK-BYW-24) were in a different clade from other fish populations (A1, W1, W2, and W3).
Interpopulation genetic distance was calculated, and a close genetic distance was observed between the wild transplanted populations W1 and W3 (dA = 0.00002), W2 and W3 (dA = 0.00006), and W1 and W2 (dA = 0.00011). A greater value of genetic distance was found between the aquaculture population A1 and each of the wild populations W1, W2, and W3 (dA = 0.00053–0.00061, Table 2).
Pairwise FST estimates revealed significant genetic differences between most pairwise population comparisons. This statistical parameter indicated genetic differentiation between the A1 population and populations W2 & W3, with the strongest degree of population differentiation between A1 and W2 (FST = 0.2454, p < 0.0001), and with no difference observed between A1 and W1 (FST = 0.0240, p > 0.05) or between W1 and W3 (FST = 0.0292, p > 0.05) (Table 3).

3.2. Genetic Diversity and Differentiation Based on SNPs

In total, 705,377 SLAF tags were obtained. The mean sequencing depth was 10.05× the genome size of closely related species. Of these, 7115 SLAF tags were polymorphic. Overall, 949 Mb reads were sequenced. Mean ratios of Q30 were 95.91, 95.89, and 95.93% for A1-Nautilus Park, W2-Banyuwangi, and W3-Gilimanuk Bay, respectively. The average Q30 for all populations in this study was 95.91%. The percentage of GC content for the respective populations was 41.10, 41.48, and 41.48% with a mean value of 41.29% (Table 4). For downstream analysis of the SNPs, a minor allele frequency (MAF) > 0.05 and a locus integrity > 0.5 were obtained for the 648,378 SNP loci.
The average MAF across the examined populations was 0.217, 0.222, and 0.219 for the A1 (Nautilus Park), W2 (Banyuwangi), and W3 (Gilimanuk) populations, respectively. The number of polymorphic SNPs in each population was comparable (11,137, 11,132, and 11,147, respectively). The observed number of alleles (Ao) was greater than the expected number of alleles (Ae) for all populations (1.879 and 1.417 for A1, 1.862 and 1.438 for W2, and 1.863 and 1.434 for W3). The Ao value in the aquaculture population was greater than those in wild populations, but the Ae value was in the opposite direction.
In contrast, observed heterozygosity (Ho) was slightly lower than expected heterozygosity (He) across all populations. The Ho values varied from 0.262 in the A1 (Nautilus Park) population to 0.282 and 0.288 in W3 and W2 populations. The PIC and Nei diversity index in the A1 population (0.243 and 0.307) was slightly lower than those in the W2 (0.255 and 0.328) and W3 (0.253 and 0.325) populations. Likewise, the W2 and W3 populations exhibited slightly higher Shannon Wiener indices (0.480 and 0.477) than that of the A1 population (0.460, Table 5).
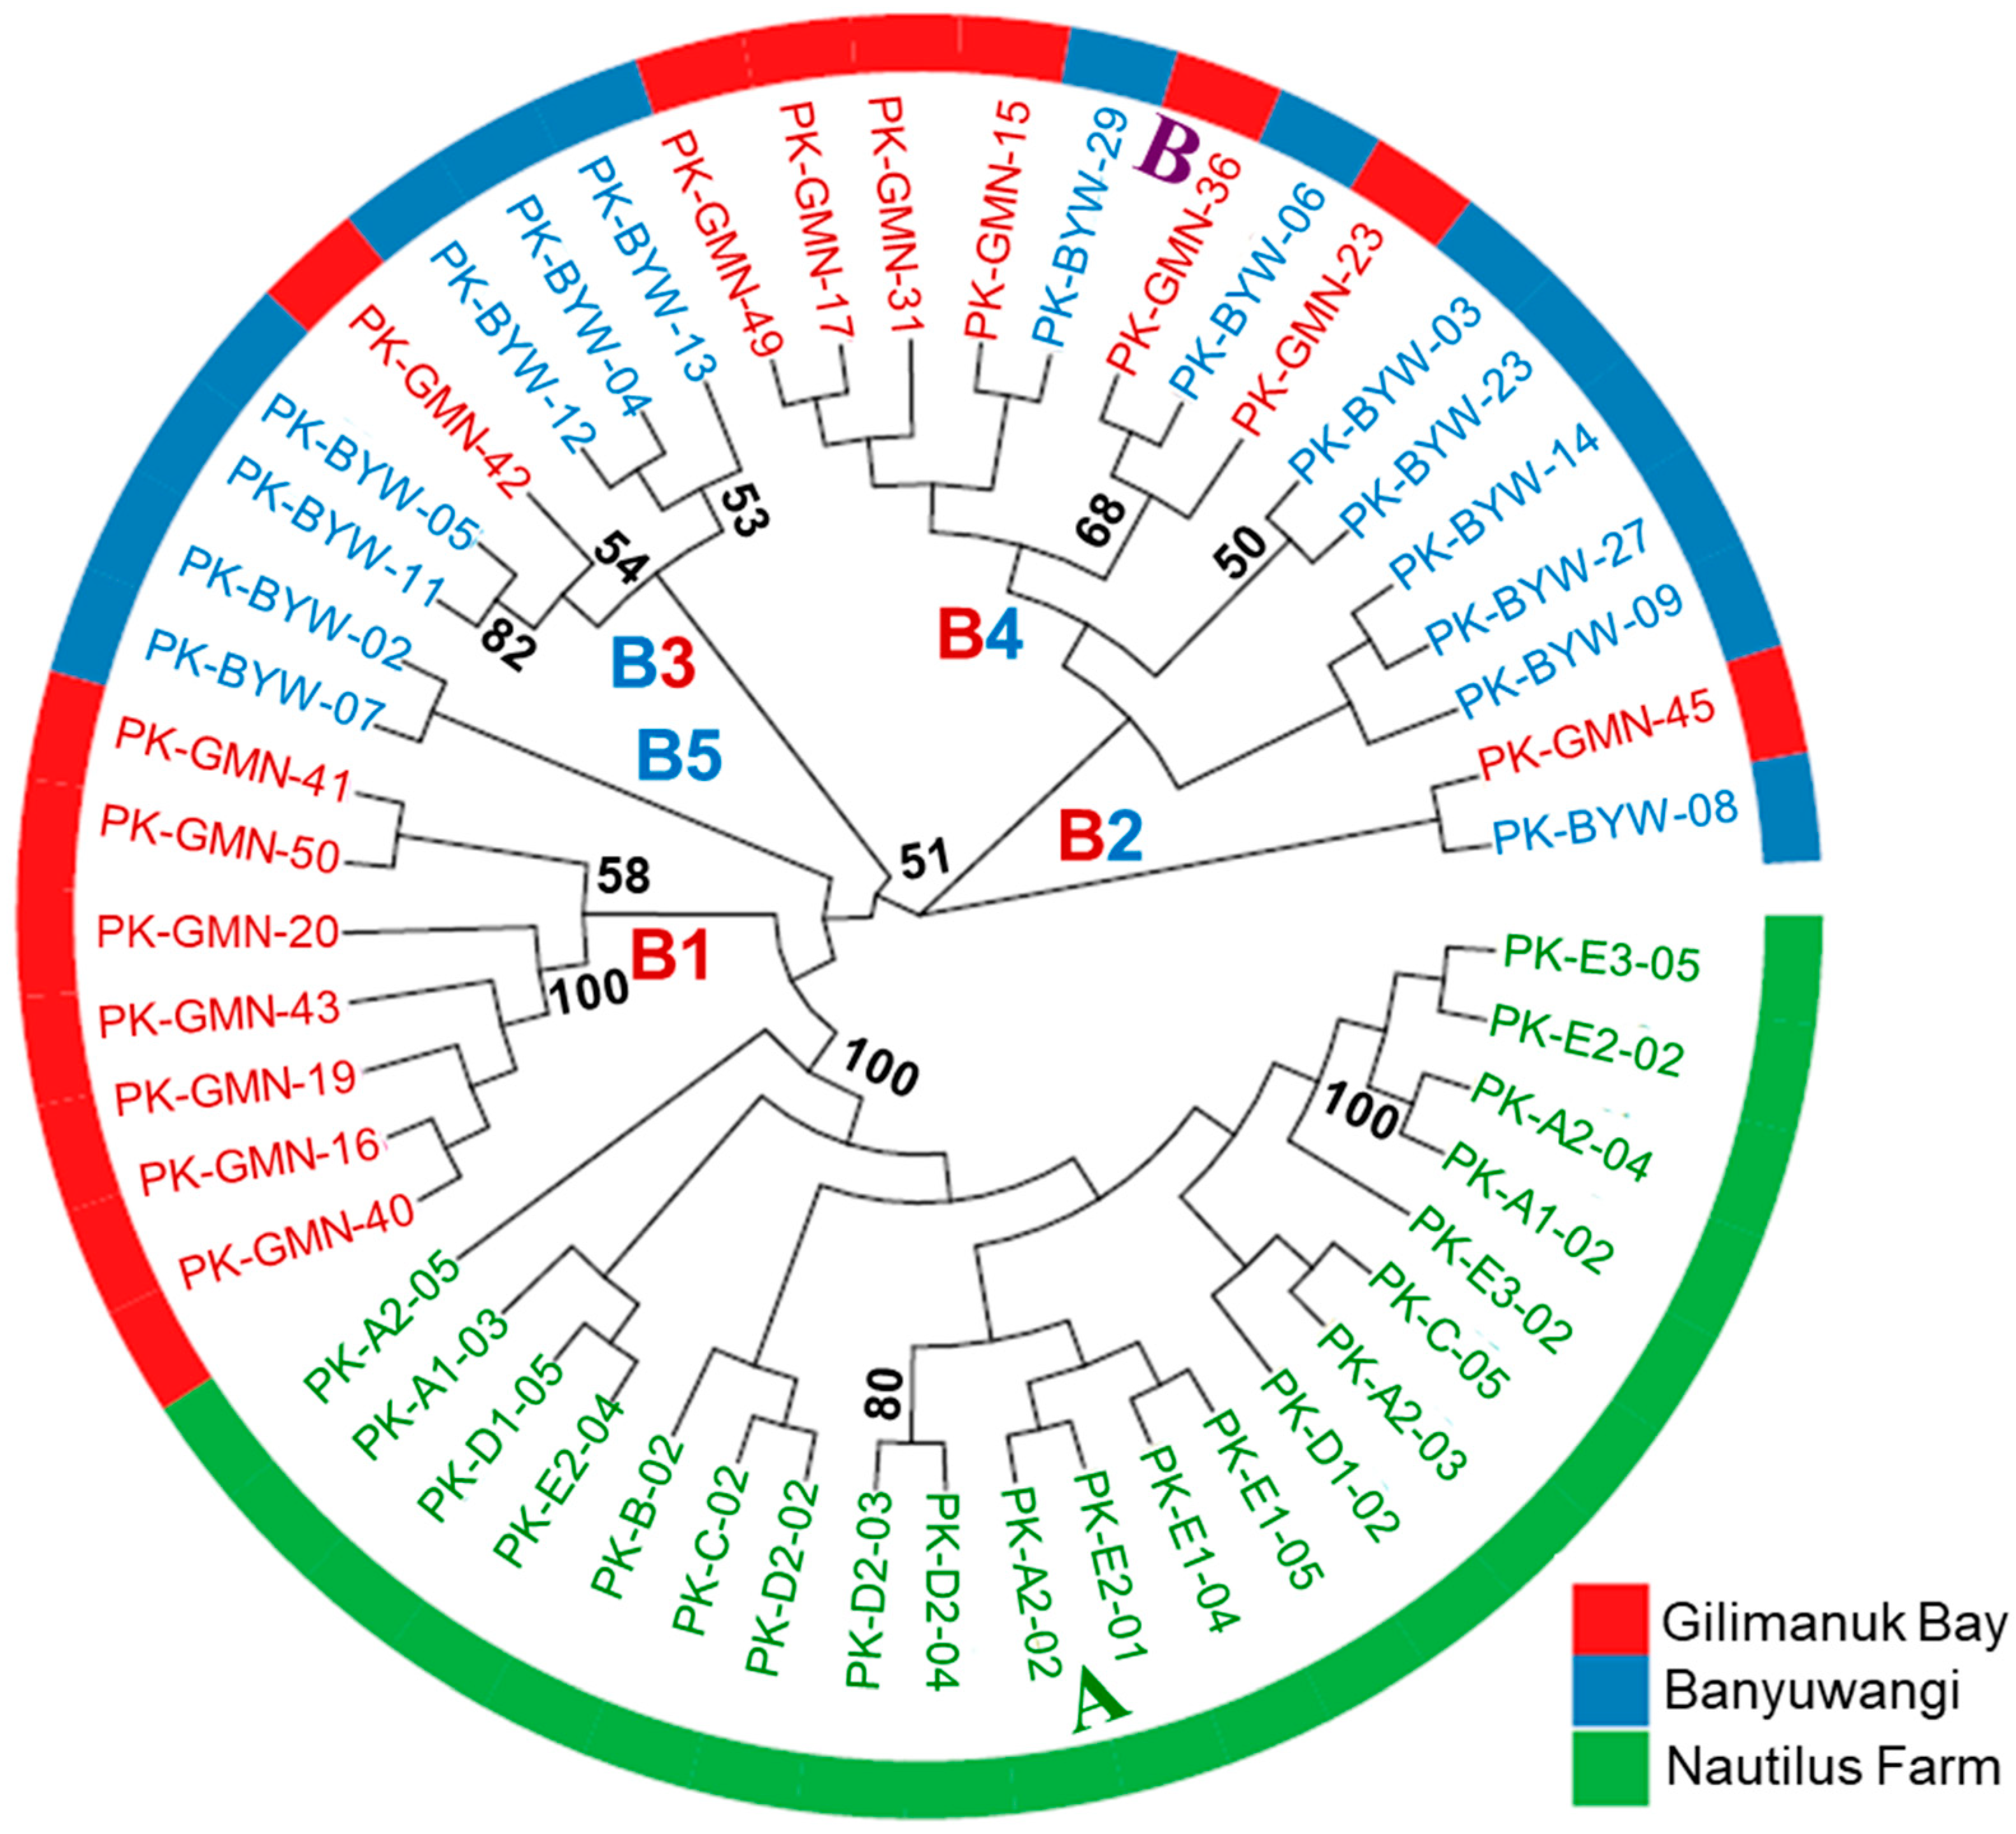
A phylogenetic tree based on genome-wide SNPs revealed two major groups among P. kauderni in the present study. A phylogenetic difference between the wild transplanted (W2 and W3) and aquaculture populations (A1) was statistically supported (bootstrapping value = 100%). Close relationships were observed between the wild transplanted populations from Banyuwangi (W2) and Gilimanuk (W3). The W2–W3 group contained five subgroups (B1–B5). The branch topology of B1 (N = 7 from W3-Gilimanuk) and B2 (N = 1 each from W2- Banyuwangi and W2) subgroups were supported by the majority rule (bootstrapping values > 50%). Some internal branches of B3 and B4 subgroups also showed bootstrap values > 50% (Figure 4).
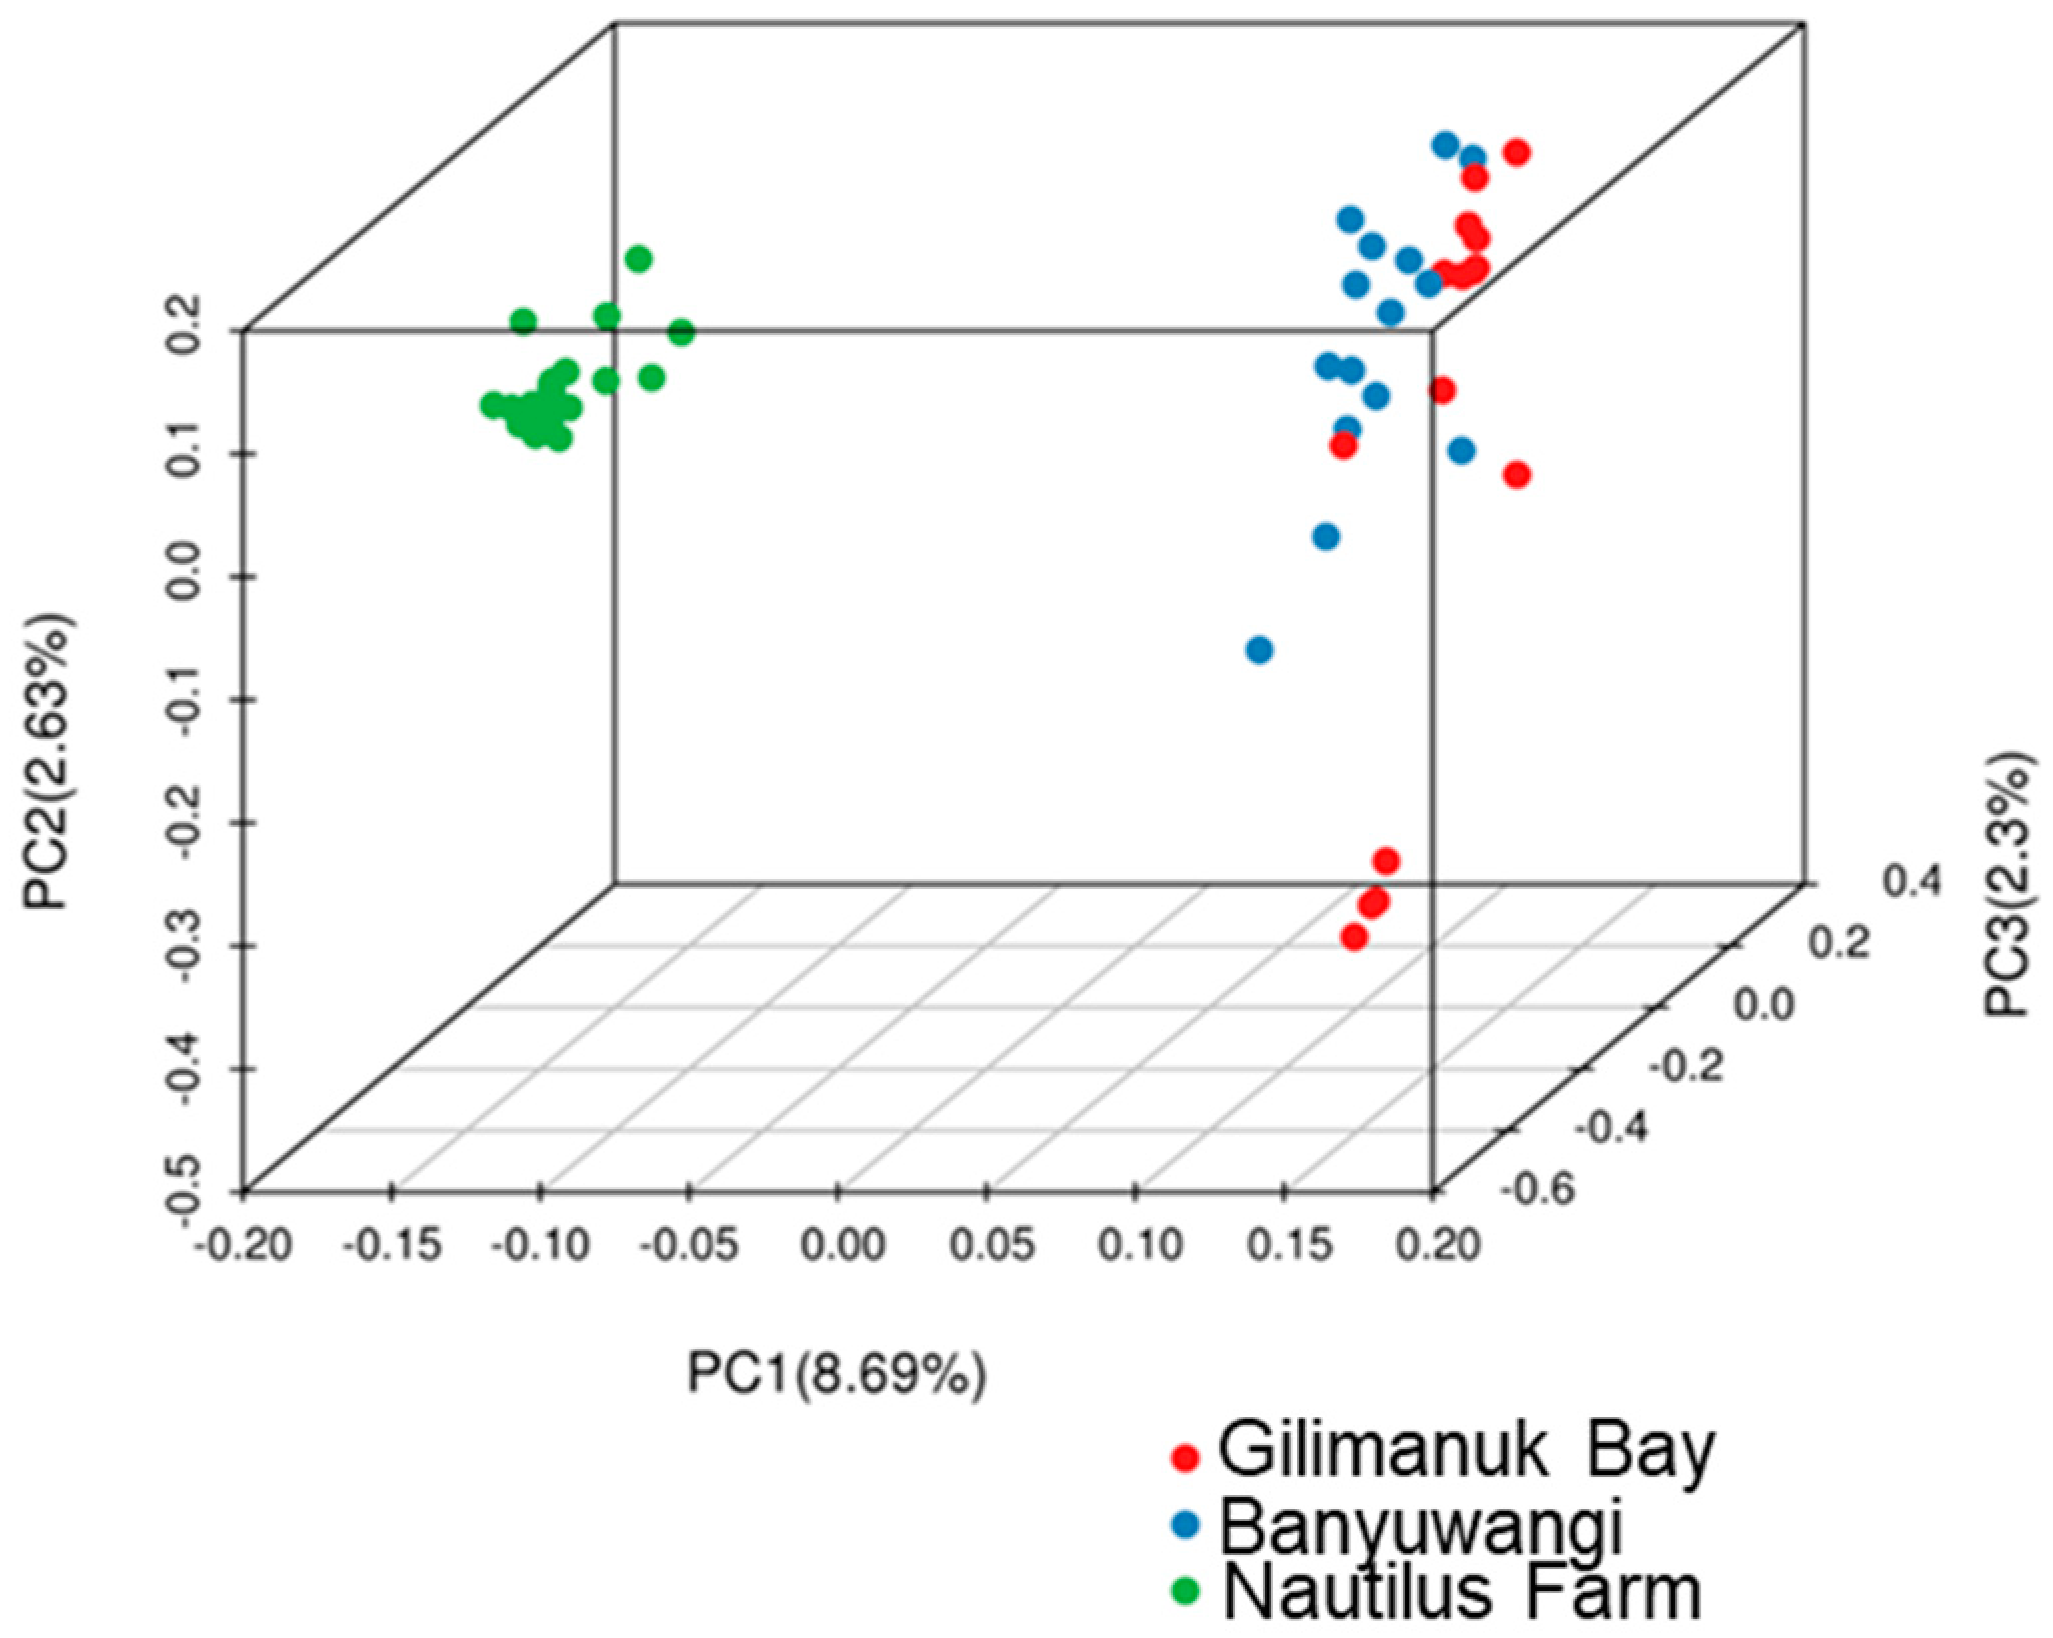
Results from PCA further supported genetic differentiation of the aquaculture stock (Nautilus Park) from both wild transplanted populations, while overlapping relationships were found between the wild transplanted populations (Figure 5).
FST estimate between the A1-Aquaculture and wild transplanted populations (0.1261 and 0.1234 when compared with W2-Banyuwangi and W3-Gilimanuk) was clearly greater than that between W2-Banyuwangi and W3-Gilimanuk (0.0035). Significant genetic differences were found between these populations (p < 0.0001, Table 3).
Wright’s fixation indices (FIT, FIS, and FST) are useful for estimating genetic variation within and among populations. AMOVA revealed significant genetic differences in variance components between populations (FST = 0.1256, p < 0.0001; Table 6) but not within individuals (FIT = −0.0121, p = 0.9863) or among individuals within populations (FST = −0.1576, p = 1.0000). This further indicated clear genetic differentiation between the A1-Nautilus Park and wild transplanted populations (W2-Banyuwangi and W3-Gilimanuk).
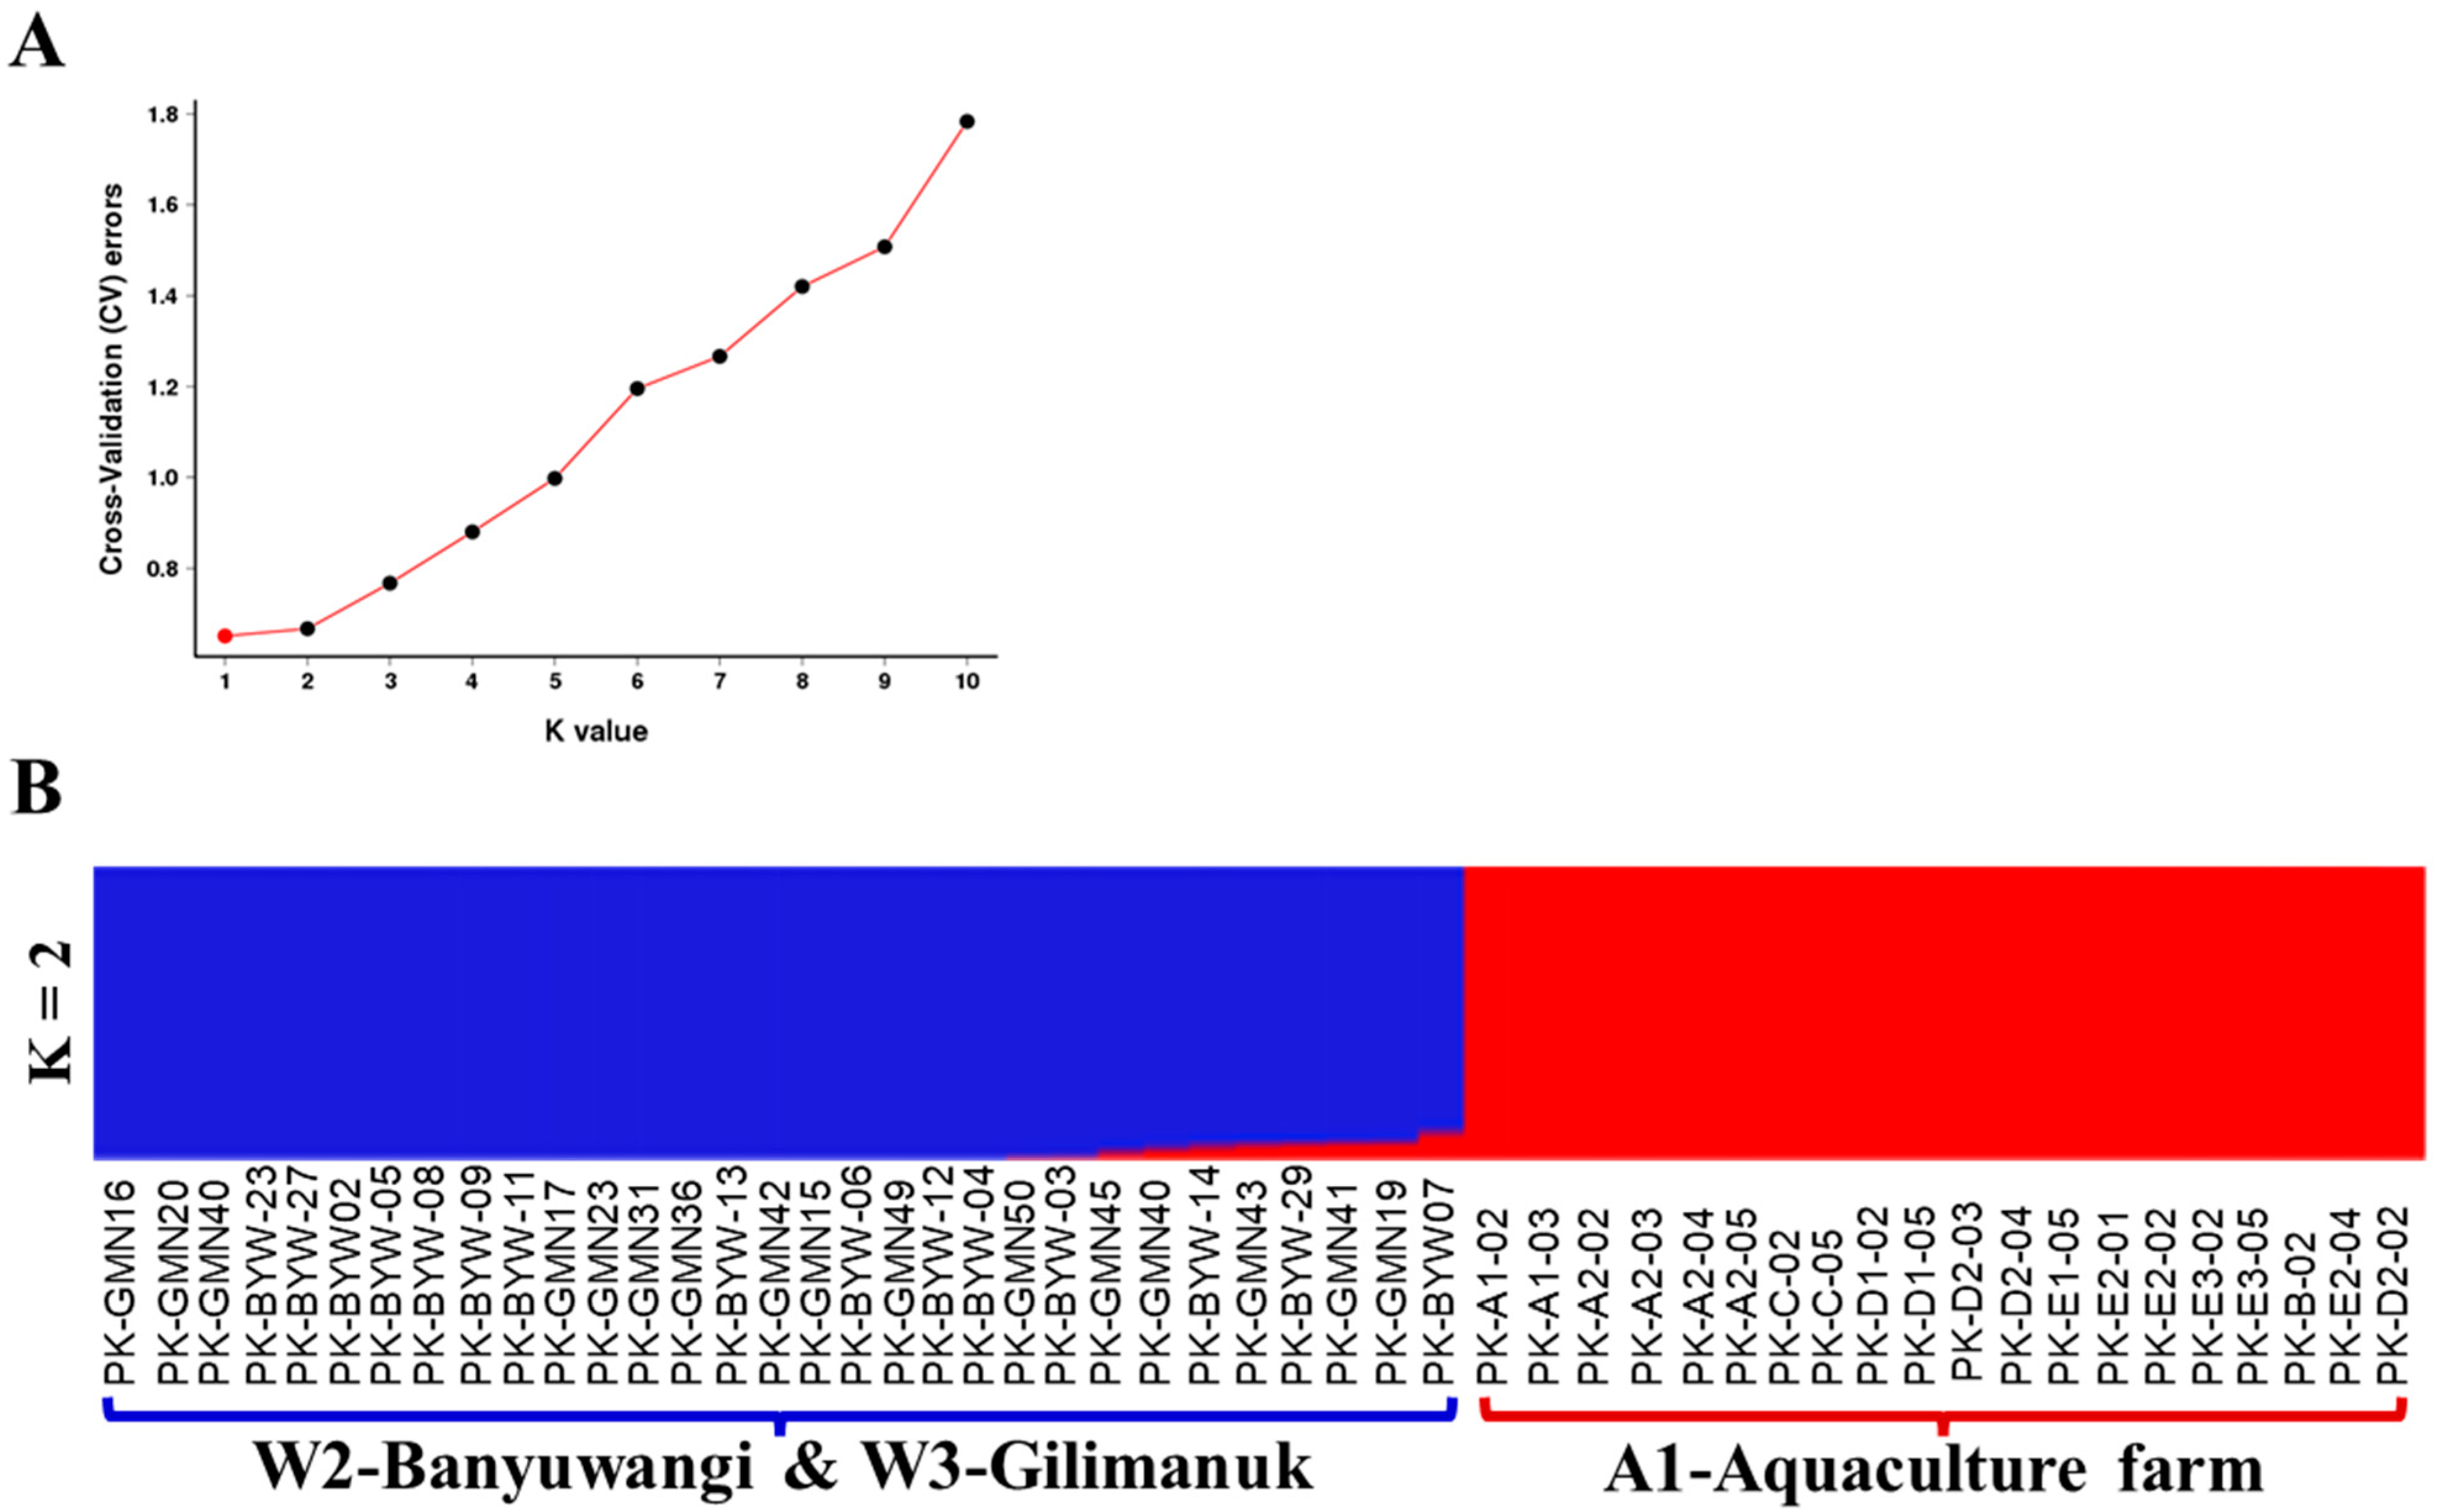
For admixture analysis the optimum K calculated from the SNP data was K = 1 (calculated K value = 0.65109, Figure 6A). It was not possible to validate K = 1 [36]. Therefore, the inferred K value = 2 (calculated K value = 0.66713) were selected. With the assumption of two genotype clusters, clear differences between wild transplanted (W2- Banyuwangi and W3- Gilimanuk Bay) and aquaculture (A1-Nautilus Park) populations were found. Two groups of Banggai cardinalfish were found. Group I exhibited pure cluster I genotypes (N = 11 and 9 from W2- Banyuwangi and W3-Gilimanuk Bay) and those exhibiting lineage I genotype cluster admixed with low levels of lineage II genotypes (N = 4 and 6 from W2 and W3 populations). Group II exhibited cluster II genotypes (all fish from A1-Nautilus Park) (Figure 6B).

4. Discussion

The conservation of endangered fish species is crucial for the preservation of the biodiversity of natural resources. Information on intraspecific population subdivision of wild and aquaculture populations is important for distinguishing fish from different supplying methods and implementing appropriate resource management plans [10,11,12]. Nevertheless, limited information is available on the within-species genetic diversity of natural populations across their species-range distribution and aquaculture-produced stocks of ornamental fish [13,37].
Typically, aquaculture fish often show a reduction in genetic diversity compared to their wild counterparts [37]. This circumstance results from founder effects during initial breeding activity and stock selection, and consequently, genetic drift occurs following the limited gene pool in hatchery-propagated stocks. In Thailand, P. kauderni was introduced and hatchery propagated. The fish have been selected for resistance to Banggai iridovirus. Accordingly, population genetic studies to evaluate whether farm practice and disease selection may cause a severe reduction in the genetic diversity of the established population or not should be examined.
Genetic diversity based on CR polymorphism revealed that haplotype and nucleotide diversity of the A1-Nautilus Park was greater than those in W1-Gilimanuk Bay [1] and W3-Gilimanuk Bay (2024) but slightly lower than in the W2-Banyuwangi (2024) population. For SNP analysis, the diversity parameters (i.e., observed heterozygosity, PIC, Nei diversity index and Shannon Wiener index) of A1 were slightly lower than those of the W2 and W3 populations. Moderate levels of haplotype and nucleotide diversity for CR polymorphism and diversity parameters for genome-wide SNPs found in the aquaculture A1 population suggested that this population was established from a reasonable number of founders.
The concept of Evolutionarily Significant Unit (ESU) was proposed from fine scale genetic population structure (at 2–5 km distance) of P. kauderni inferred from microsatellite analysis [11,12]. Genetic and morphometric data revealed that each small island in the Banggai Archipelago is regarded as an ESU while the larger islands hosted several ESUs of P. kauderni [1,10,11,12,38]. At least 21 ESUs are considered. Of these, 18 ESUs are located within the Banggai Archipelago. The capture and release of P. kauderni both within and outside of the endemic distribution range have resulted in the mixing of genetic strains and the establishment of introduced populations both within the Banggai Archipelago and across the Indonesian Archipelago (e.g., Gilimanuk and Banyuwangi in this study) [11,12,38].
Introduced populations of P. kauderni outside its endemic range were established along trade routes including, for example, North, Central, and South-East Sulawesi, Bali, and Molluca [39]. However, genetic diversity was only examined in the population from Gilimanuk Bay (Bali). Previously, 14 mtDNA haplotypes were reported in endemic P. kauderni originating from 20 populations covering 16 islands in the Banggai Archipelago [10]. Comparable levels of genetic diversity (no. of haplotypes/population: 1–5, Hd: 0.00–0.82, mean = 0.47 and π: 0.0000–0.0037, mean = 0.0053) were found [10]. Six CR haplotypes were found in fish from the A1-aquaculture population, implying that this stock was propagated from a reasonably diverse collection of founding females. Moving on from right there, the respective wild transplanted populations likely originated from different founder populations. Limited numbers of W1 and W3 female founders may have been bred, and their offspring introduced into the Bali Strait, since approximately 2- and 3.5-times lower levels of nucleotide diversity were observed compared with the A1 population. In contrast, diverse female founders were included for the stocking of P. kauderni in Banyuwangi (East Java). Strong population differentiation of all examined populations may be alternatively promoted by founder effects and genetic drifts. In addition, natural and artificial (for disease resistance) selection might further contribute to the A1 aquaculture population.
Overfishing could lead to reduced genetic diversity of exploited species. For clown anemonefish (Amphiprion ocellaris) in Indonesia, there is reduced genetic diversity (numbers of alleles, private alleles, and allelic richness) (p = 0.005), in the Barrang Lompo population, which has a high fishing pressure, when compared with the Samalona population, which is under less pressure [40]. For P. kauderni, an appropriate catch limit should be considered. The permitted quota for the export of P. kauderni from Gilimanuk and Banyuwangi recommended by BRIN was 13,000 and 2000 fish in 2024. In this study, reduced mtDNA diversity of P. kauderni from Gilimanuk Bay collected in 2019 (no. of haplotypes = 4, Hd = 0.510 and π = 0.00186) [1] and 2024 (no. of haplotypes = 2, Hd = 0.335 and π = 0.00074, this study) was found. This circumstance implies that the fishing pressure may result in reduced genetic diversity in the Bali population. Accordingly, the catch quota of Banggai cardinalfish from Gilimanuk (Bali strait) should be reduced, while that from Banyuwangi (East Java), exhibiting a greater genetic diversity, might be increased.
Evaluation of genetic diversity and population subdivisions using genome-wide SNPs has been reported in several marine fish species. Genetic diversity of gilthead sea bream (Sparus aurata) and European seabass (Dicentrarchus labrax) revealed a slightly greater expected heterozygosity in wild (mean = 0.379 and 0.382) than farmed (mean = 0.372 and 0.376) populations. In addition, the observed homozygosity was lower than the expected heterozygosity in both species [41]. Strong population differentiation was found between wild and farmed populations, but weak population differentiation was noticed among wild populations of both S. aurata and D. labrax [41]. Similar circumstance on strong genetic differentiation of five farmed from Greece (N = 362) and twenty-three wild populations from the Mediterranean region (N = 956) of gilthead seabream were also reported (FST = 0.024–0.049, p < 0.005) [42]. Likewise, moderate levels of genetic diversity but weak degrees of genetic differentiation were found in Atlantic cod (Gadus morhua) from the Baltic Sea [43].
A moderate level of diversity index was observed in P. kauderni (0.307–0.325). Observed heterozygosity was slightly lower than expected heterozygosity for A1, W2 and W3 populations (0.262 & 0.296, 0.288 & 0.312 and 0.282 & 0.310, respectively) indicating heterozygote deficiency in these populations. The observed and expected heterozygosity in P. kauderni in this study (estimated from 648,378 SNPs) is greater than that in wild (from Japan, China and Australia; Ho = 0.072–0.090 and He = 0.077–0.096) and farmed (from China and Australia; Ho = 0.083–0.094 and He = 0.081–0.093) yellowtail kingfish (Seriola aureovittata) [44].
For intraspecific genetic structure based on CR polymorphism, phylogenetic analysis revealed branch-sharing between fish of from different populations of P. kauderni. This indicated the possible sharing of female lineages of founders. In contrast, SNPs of a subset of the same sample illustrated a clear subdivision of the A1-Nautilus population from both W2-Banyuwangi and W3-Gilimanuk Bay, while partial branch-sharing between wild transplanted populations was found. This indicated that the W1 and W3 populations were bred from genetically close stocks while founders of the A1-Nautilus Park were probably bred from distantly related populations. However, endemic populations of P. kauderni from the Banggai marine protected area (MPA) should be collected and genetically analyzed to confirm whether population differentiation of W2 and W3 populations represent different samplings of the original wild populations of this endangered species or not.
Both FST and AMOVA revealed significant differentiation between aquaculture and wild transplanted populations in this study. The A1-Nautilus Park population showed significant differentiation from wild transplanted populations W2-Banyuwangi and W3-Gilimanuk Bay for both CR and SNPs but not W1 [1] when analyzed by CR. Interestingly, W1-Gilimanuk [1] and W3-Gilimanuk (2024) collected from different periods also did not differ significantly (p > 0.05).
The optimal K = 1 was obtained from SNP data. This admixture parameter was contradictory to other tests, including phylogenetic analysis, FST statistics and Wright’s AMOVA, which indicated that A1, W2, and W3 are different genetic populations. It is not possible to validate K = 1 using the typical ΔK method [36]. Therefore, the inferred K value = 2 was selected, and a clear differentiation between the A1-Nautilus Park and wild transplanted populations W2 and W3 was readily observed.
The level of population structure as measured by various methods (phylogenetic analysis, PCA, and population admixture) was able to differentiate a farmed population from wild transplanted populations. Since the Nautilus Park population was selected for disease-resistance after being introduced from original sources, founder effects, genetic drift, and artificial selection may promote degrees of difference between this aquaculture and wild transplanted populations [45].
In conclusion, genetic differences between the A1 aquaculture-propagated fish from Nautilus Park and the wild transplanted populations of W1-Gilimanuk Bay [1], W-2-Banyuwangi (2024), and W3-Gilimanuk Bay (2024), were clearly revealed based on the polymorphism of the CR. In addition, 51 fish individuals from the A1, W2, and W3 populations previously analyzed by CR polymorphism were genetically analyzed by genome-wide SNPs, and concordant results for clear genetic differences between the wild transplanted and farmed populations of P. kauderni in this study were found. The molecular genetic methods developed in this study demonstrate the ability to manage the ornamental fish trade, which has a significant impact on wild fish populations due to overfishing and the potential introduction of non-native species.

Supplementary Materials

The following supporting information can be downloaded at: https://www.mdpi.com/article/10.3390/d17110754/s1, Table S1: Sample collection periods, location and coordinates of Pterapogon kauderni in this study; Table S2: Haploype distribution frequencies of mtDNA CR of examined specimens in various populations in this study.

Author Contributions

Conceptualization, B.K. and S.K.; Methodology, S.P., S.K., and B.K.; Formal Analysis, S.P., S.J., S.T., and O.R.; Investigation, S.P., S.J., O.R., and W.I.; Data Curation, S.T. and S.K.; Writing—Original Draft Preparation, B.K.; Writing—Review and Editing, S.K.; Supervision, B.K. and S.K. All authors have read and agreed to the published version of the manuscript.

Funding

This research received no external funding.

Institutional Review Board Statement

Not applicable.

Data Availability Statement

Data are available from the corresponding author on request.

Acknowledgments

We thank Nautilus Park (Phang Nga province, Thailand) for providing their fish specimens and facilitating the import of the fish specimen from Indonesia. In addition, the authors would also like to thank the National Center for Genetic Engineering and Biotechnology (BIOTEC), National Science and Technology Development Agency (NSTDA) for providing facilities. We would like to thank T.W. Flegel for assistance in editing the manuscript.

Conflicts of Interest

The authors declare that they have no known competing financial interests or personal relationships that could have appeared to influence the work reported in this paper.

References

  1. Putra, I.N.G.; Puspitha, N.L.P.R.; Suryaningtyas, E.W. Spread beyond the border: Small Scale genetic structure of the introduced Banggai cardinalfish (Pterapogon kauderni) population in the Bali Strait. Indonesian J. Mar. Sci. 2021, 26, 163–172. [Google Scholar] [CrossRef]
  2. Allen, G.R. Threatened fishes of the world: Pterapogon kauderni Koumans, 1933 (Apogonidae). Environ. Biol. Fishes 2000, 57, 142. [Google Scholar] [CrossRef]
  3. CITES. Convention on the International Trade in Endangered Species. COP 14 Prop. XX. Consideration of Proposals for Amendment of Appendices I and II. Proposal: Inclusion of the Banggai cardinalfish (Pterapogon kauderni, Koumans 1933) in Appendix II of CITES. In Proceedings of the Fourteenth Meeting of the Conference of the Parties, The Hague, The Netherlands, 3–15 June 2007. Available online: www.cites.org (accessed on 1 August 2025).
  4. Allen, G.R.; Donaldson, T.J. Pterapogon kauderni. The IUCN Red List of Threatened Species 2007: E.T63572A12692964., The IUCN Red List of Threatened Species 2007. Available online: https://doi.org/10.2305/IUCN.UK.2007.RLTS.T63572A12692964.en (accessed on 1 August 2025).
  5. Allen, G.; Erdmann, M. Reef Fishes of the East Indies; Tropical Reef Research: Perth, Australia, 2012; Volume I–III. [Google Scholar]
  6. Erdmann, M.V.; Vagelli, A. Banggai cardinalfish invade Lembeh Strait. Coral Reefs 2001, 20, 252–253. [Google Scholar] [CrossRef]
  7. Moore, A.; Ndobe, S. Discovery of an introduced Banggai Cardinalfish population in Palu Bay, Central Sulawesi, Indonesia. Coral Reefs 2007, 26, 569. [Google Scholar] [CrossRef]
  8. Moore, A.M.; Ndobe, S.; Jompa, J. A site based conservation approach to promote the recovery of Banggai cardinalfish (Pterapogon kauderni) endemic populations. Coast. Ocean J. 2017, 1, 63–72. [Google Scholar] [CrossRef]
  9. Lunn, K.E.; Moreau, M.A. Unmonitored trade in marine ornamental fishes: The case of Indonesia’s Banggai cardinalfish (Pterapogon kauderni). Coral Reefs 2004, 23, 344–351. [Google Scholar] [CrossRef]
  10. Bernardi, G.; Vagelli, A. Population structure in Banggai cardinalfish, Pterapogon kauderni, a coral reef species lacking a pelagic larval phase. Mar. Biol. 2004, 145, 803–810. [Google Scholar] [CrossRef]
  11. Hoffman, E.A.; Kolm, N.; Berglund, A.; Arguello, J.R.; Jones, A.G. Genetic structure in the coral-reef-associated Banggai cardinalfish, Pterapogon kauderni. Mol. Ecol. 2005, 14, 1367–1375. [Google Scholar] [CrossRef] [PubMed]
  12. Vagelli, A.; Burford, M.; Bernardi, G. Fine scale dispersal in Banggai Cardinalfish, Pterapogon kauderni, a coral reef species lacking a pelagic larval phase. Mar. Genom. 2009, 1, 129–134. [Google Scholar] [CrossRef] [PubMed]
  13. Pouil, S.; Tlusty, M.; Rhyne, A.; Metian, M. Aquaculture of marine ornamental fish: Overview of the production trends and the role of academia in research progress. Rev. Aquac. 2020, 12, 1217–1230. [Google Scholar] [CrossRef]
  14. Lal, K.K.; Kumar, T.T.A. Marine Ornamental Aquaculture: Measure Towards Biodiversity Conservation and Livelihood Promotion. J. Indian Soc. Coastal Agric. Res. 2021, 39, 49–54. [Google Scholar] [CrossRef]
  15. Sun, X.; Liu, D.; Zhang, X.; Li, W.; Liu, H.; Hong, W.; Jiang, C.; Guan, N.; Ma, C.; Zeng, H.; et al. SLAF-seq: An efficient method of large-scale de novo SNP discovery and genotyping using high-throughput sequencing. PLoS ONE 2016, 8, e58700. [Google Scholar] [CrossRef]
  16. Khamnamtong, B.; Chaimongkol, A.; Prasertlux, S.; Janpoom, S.; Chaimongkol, J.; Tang, S.; Ittarat, W.; Songsangjinda, P.; Sakamoto, T.; Sae-Lim, P.; et al. Population genomics and application for growth improvement of domesticated Asian seabass Lates calcarifer from Thailand. Diversity 2025, 17, 383. [Google Scholar] [CrossRef]
  17. Lee, W.J.; Conroy, J.; Howell, W.H.; Kocher, T.D. Structure and evolution of teleost mitochondrial control regions. J. Mol. Evol. 1995, 41, 54–66. [Google Scholar] [CrossRef] [PubMed]
  18. Altschul, S.F.; Gish, W.; Miller, W.; Myers, E.W.; Lipman, D.J. Basic local alignment search tool. J. Mol. Biol. 1990, 215, 403–410. [Google Scholar] [CrossRef]
  19. Thompson, J.D.; Higgins, D.G.; Gibson, T.J. Clustal W: Improving the sensitivity of progressive multiple sequence weighting, position-specific gap penalties and weight metric choices. Nucleic Acids Res. 1994, 22, 4673–4680. [Google Scholar] [CrossRef]
  20. Nei, M. Molecular Evolutionary Genetics; Columbia University Press: New York, NY, USA, 1987. [Google Scholar]
  21. Rozas, J.; Ferrer-Mata, A.; Sánchez-DelBarrio, J.C.; Guirao-Rico, S.; Librado, P.; Ramos-Onsins, S.E.; Sánchez-Gracia, A. DnaSP 6: DNA Sequence Polymorphism Analysis of Large Data Sets. Mol. Biol. Evol. 2017, 34, 3299–3302. [Google Scholar] [CrossRef]
  22. Leigh, J.W.; Bryant, D. PopART: Full-feature software for haplotype network construction. Met. Ecol. Evol. 2015, 6, 1110–1116. [Google Scholar] [CrossRef]
  23. Clement, M.; Posada, D.; Crandall, K.A. TCS: A computer program to estimate gene genealogies. Mol. Ecol. 2000, 9, 1657–1659. [Google Scholar] [CrossRef]
  24. Saitou, N.; Nei, M. The neighbor-joining method: A new method for reconstructing phylogenetic trees. Mol. Biol. Evol. 1987, 4, 406–425. [Google Scholar] [CrossRef]
  25. Kimura, M. A simple method for estimating evolutionary rate of base substitutions through comparative studies of nucleotide sequences. J. Mol. Evol. 1980, 16, 111–120. [Google Scholar] [CrossRef]
  26. Tamura, K.; Stecher, G.; Kumar, S. MEGA11: Molecular Evolutionary Genetics Analysis version 11. Mol. Biol. Evol. 2021, 38, 3022–3027. [Google Scholar] [CrossRef]
  27. Weir, B.S.; Cockerham, C.C. Estimation F-statistics for the analysis of population structure. Evolution 1984, 38, 1358–1370. [Google Scholar] [CrossRef]
  28. Excoffier, L.; Lischer, H.E. Arlequin suite ver 3.5: A new series of programs to perform population genetics analyses under Linux and Windows. Mol. Ecol. Resour. 2010, 10, 564–567. [Google Scholar] [CrossRef]
  29. Chen, S.; Zhou, Y.; Chen, Y.; Gu, J. fastp: An ultra-fast all-in-one FASTQ preprocessor. Bioinformatics 2018, 34, i884–i890. [Google Scholar] [CrossRef]
  30. McKenna, A.; Hanna, M.; Banks, E.; Sivachenko, A.; Cibulskis, K.; Kernytsky, A.; Garimella, K.; Altshuler, D.; Gabriel, S.; Daly, M.; et al. The genome analysis toolkit: A MapReduce framework for analyzing next-generation DNA sequencing data. Genome Res. 2010, 20, 1297–1303. [Google Scholar] [CrossRef]
  31. Li, H.; Handsaker, B.; Wysoker, A.; Fennell, T.; Ruan, J.; Homer, N.; Marth, G.; Abecasis, G.; Durbin, R.; 1000 Genome Project Data Processing Subgroup. The sequence alignment/Map format and SAMtools. Bioinformatics 2009, 25, 2078–2079. [Google Scholar] [CrossRef] [PubMed]
  32. Kumar, S.; Stecher, G.; Li, M.; Knyaz, C.; Tamura, K. MEGA X: Molecular evolutionary genetics analysis across computing platforms. Mol. Biol. Evol. 2018, 35, 1547–1549. [Google Scholar] [CrossRef]
  33. Price, A.; Patterson, N.; Plenge, R.; Weinblatt, M.E.; Shadick, N.A.; Reich, D. Principal components analysis corrects for stratification in genome-wide association studies. Nat. Genet. 2006, 38, 904–909. [Google Scholar] [CrossRef]
  34. Abraham, G.; Inouye, M. Fast principal component analysis of large-scale genome-wide data. PLoS ONE 2014, 9, e93766. [Google Scholar] [CrossRef]
  35. Alexander, D.H.; Novembre, J.; Lange, K. Fast model-based estimation of ancestry in unrelated individuals. Genome Res. 2009, 19, 1655–1664. [Google Scholar] [CrossRef]
  36. Janes, J.K.; Miller, J.M.; Dupuis, J.R.; Malenfant, R.M.; Gorrell, J.C.; Cullingham, C.I.; Andrew, R.L. The K = 2 conundrum. Mol. Ecol. 2017, 26, 3594–3602. [Google Scholar] [CrossRef]
  37. Clark, R.D.; Pinsky, M.L. Global patterns of nuclear and mitochondrial genetic diversity in marine fishes. Ecol. Evol. 2024, 14, e11365. [Google Scholar] [CrossRef] [PubMed]
  38. Ndobe, S.; Moore, A.; Yasir, I.; Jompa, J. Banggai cardinalfish conservation: Priorities, opportunities, and risks. IOP Conf. Ser. Earth Environ. Sci. 2019, 253, 012033. [Google Scholar] [CrossRef]
  39. Arbi, U.Y.; Vimono, I.B.; Kusumawardhani, N.R.; Anshari, L. Population status and microhabitat preferences of endemic Banggai cardinalfish (Pterapogon kauderni) in the introduced habitat in Kendari Bay, Indonesia. IOP Conf. Ser. Earth Environ. Sci. 2022, 1119, 012015. [Google Scholar] [CrossRef]
  40. Madduppa, H.H.; Timm, J.; Kochzius, M. Reduced genetic diversity in the clown anemonefish Amphiprion ocellaris in exploited reefs of Spermonde Archipelago, Indonesia. Front. Mar. Sci. 2018, 5, 80. [Google Scholar] [CrossRef]
  41. Villanueva, B.; Fernández, A.; Peiró-Pastor, R.; Peñaloza, C.; Houston, R.D.; Sonesson, A.K.; Tsigenopoulos, C.S.; Bargelloni, L.; Gamsız, K.; Karahan, B.; et al. Population structure and genetic variability in wild and farmed Mediterranean populations of gilthead seabream and European seabass inferred from a 60K combined species SNP array. Aquac. Rep. 2022, 24, 101145. [Google Scholar] [CrossRef]
  42. Gkagkavouzis, K.; Papakostas, S.; Maroso, F.; Karaiskou, N.; Carr, A.; Nielsen, E.E.; Bargelloni, L.; Triantafyllidis, A. Investigating genetic diversity and genomic signatures of hatchery-induced evolution in gilthead seabream (Sparus aurata) populations. Diversity 2021, 13, 563. [Google Scholar] [CrossRef]
  43. Wenne, R.; Bernaś, R.; Kijewska, A.; Poćwierz-Kotus, A.; Strand, J.; Petereit, C.; Plauška, K.; Sics, I.; Árnyasi, M.; Kent, M.P. SNP genotyping reveals substructuring in weakly differentiated populations of Atlantic cod (Gadus morhua) from diverse environments in the Baltic Sea. Sci Rep. 2020, 10, 9738. [Google Scholar] [CrossRef]
  44. Cui, A.; Xu, Y.; Kikuchi, K.; Jiang, Y.; Wang, B.; Koyama, T.; Liu, X. Comparative analysis of genetic structure and diversity in five populations of yellowtail kingfish (Seriola aureovittata). J. Mar. Sci. Eng. 2023, 11, 1583. [Google Scholar] [CrossRef]
  45. Glover, K.A.; Dahle, G.; Jørstad, K.E. Genetic identification of farmed and wild Atlantic cod, Gadus morhua, in coastal Norway. ICES J. Mar. Sci. 2011, 68, 901–910. [Google Scholar] [CrossRef]
Figure 1. Maps illustrating sample collection sites in this study, including transplanted areas of Banyuwangi, East Java (W2), Gilimanuk Bay, Bali (W1 composing of W1-1, W1-2, W1-3, W1-4, W3), and (A1)-Aquaculture farm, Phang Nga (Thailand). An endemic distribution area (approximately 5000 km2) is also indicated. Haplotypes found in each population are shown (see Table S2 for haplotype distribution frequencies). W = wild transplanted populations, A = aquaculture population.
Diversity 17 00754 g001
Figure 2. A minimum spanning network (MSN) illustrating relationships between identified CR haplotypes of Banggai cardinalfish in this study. The size of the pie charts is proportional to the corresponding haplotype frequency, while the color indicates the geographical origin. Gilimanuk = W1-Gilimanuk Bay [1], Nautilus = A1-Nautilus Park, Banyuwangi = W2-Banyuwangi (2024), Bali = W3-Gilimanuk Bay (2024).
Diversity 17 00754 g002
Figure 3. An NJ tree illustrating genetic relationships among wild transplanted and aquaculture Pterapogon kauderni (N = 131) based on CR polymorphism at individual levels. Specimens beginning with PK followed by A-E are aquaculture fish from A1-Nautilus Park (2024), PK-BYW = W2-Banyuwangi (2024), and PK-GMN = W3-Gilimanuk Bay (2024). Specimen codes beginning with W1 are from W1-Gilimanuk [1]. Bootstrap values >50% are given.
Diversity 17 00754 g003
Figure 4. Neighbor-joining tree of P. kauderni individuals including W2-Banyuwangi (N = 15, Blue), W3-Gilimanuk Bay (N = 15, Red), and A1-Nautilus Park (N = 21, Green). Bootstrap values > 50% are given.
Diversity 17 00754 g004
Figure 5. PCA of individuals of P. kauderni. Samples include W2-Banyuwangi (N = 15), W3-Gilimanuk Bay (N = 15), and A1-Nautilus Park (N = 21) populations.
Diversity 17 00754 g005
Figure 6. The optimal K (predefined values) between 1 and 10 was analyzed (A). Population admixture analysis of wild transplanted and aquaculture populations of P. kauderni using K (predefined values) = 2 (B). Different genotype clusters are represented by different colors.
Diversity 17 00754 g006
Table 1. Names of populations, sample size, numbers of haplotypes, haplotype diversity, and nucleotide diversity of Pterapogon kauderni in this study.
PopulationSampling YearSample Size (N)NHHdπkReferences
Wild transplanted stocks
W1-Gilimanuk Bay20192540.5100.001860.820[1]
W2-Banyuwangi (2024)20242270.6880.007213.143This study
W3-Gilimanuk Bay (2024)20243920.3350.000740.335This study
Cultured stock
A1-Nautilus Park20244560.6020.002571.156This study
Total samples 131140.5380.002831.227This study
NH = number of haplotypes, Hd = haplotype diversity, π = nucleotide diversity, k = average number of pairwise nucleotide differences.
Table 2. Genetic distance between farmed and wild transplanted populations of P. kauderni analyzed by CR polymorphism.
W1-Gilimanuk [1]A1-Aquaculture (2024)W2-Banyuwangi (2024)W3-Gilimanuk (2024)
W1-Gilimanuk [1]-
A1-Aquaculture (2024)0.00061-
W2-Banyuwangi (2024)0.000110.00059-
W3-Gilimanuk (2024)0.000020.000530.00006-
Table 3. Pairwise FST between farmed and wild transplanted populations of P. kauderni analyzed by CR (below diagonal) and SNP (above diagonal) polymorphism.
W1-Gilimanuk [1]A1-Aquaculture (2024)W2-Banyuwangi (2024)W3-Gilimanuk (2024)
W1-Gilimanuk [1]-NDNDND
A1-Aquaculture (2024)0.0240 ns-0.1261 ***0.1234 ***
W2-Banyuwangi (2024)0.2147 ***0.2454 ***-0.0035 ***
W3-Gilimanuk (2024)0.0292 ns0.0416 ***0.1474 ***-
*** = p < 0.0001; ns = not significant; ND = not determined.
Table 4. Sequencing reads and depth, Q30, GC content, and SLAF number of wild transplanted P. kauderni from Banyuwangi (East Java), Gilimanuk Bay (Bali), and aquaculture P. kauderni (Nautilus Park).
ParameterA1-Nautilus ParkW2-BanyuwangiW3-Gilimanuk Bay
Total reads342,000,000289,000,000320,000,000
Average reads/sample16,269,33719,236,88021,318,605
Q30 (%)94.86–96.2795.31–96.2995.29–96.28
(95.91)(95.89)(95.93)
GC (%)40.32–42.7740.65–42.4540.62–42.93
(41.10)(41.38)(41.48)
Average nucleotide sequenced/sample5,908,0636,212,3486,379,631
Average depth9.7410.1510.38
Total SLAF number12,672,8709,108,0199,168,429
Average SLAF number603,470607,201.3611,228.6
N211515
Table 5. Genetic diversity of experimental samples (wild transplanted P. kauderni from Banyuwangi and Gilimanuk Bay, and aquaculture P. kauderni from Nautilus Park) based on SNPs.
Parameters/GroupA1-Nautilus ParkW2-BanyuwangiW3-Gilimanuk Bay
Average MAF0.2170.2220.219
No. of polymorphic markers111371113211147
Observed no. of allele (Ao)1.000–2.000 (1.879)1.000–2.000 (1.862)1.000–2.000 (1.863)
Expected no. of allele (Ae)1.000–2.000 (1.417)1.000–2.000 (1.438)1.000–2.000 (1.434)
Observed heterozygosity (Ho)0.048–1.000 (0.262)0.067–1.000 (0.288)0.067–1.000 (0.282)
Expected heterozygosity (He)0.038–0.500 (0.296)0.007–0.500 (0.312)0.007–0.500 (0.310)
PIC0.045–0.375 (0.243)0.062–0.375 (0.255)0.062–0.375 (0.253)
Nei diversity index0.048–0.667 (0.307)0.067–0.667 (0.328)0.067–0.667 (0.325)
Shannon Wiener index0.113–0.693 (0.460)0.146–0.693(0.480)0.146–0.693(0.477)
Table 6. Analysis of molecular variance (AMOVA) for P. kauderni from wild transplanted and aquaculture populations based on genome-wide SNP analysis.
Sources of VariationdfSum of SquareVariance
Component
Percentage of
Variation
F-Statisticsp-Values
Within individuals5118254.00357.92101.21FIT = −0.01210.9863
Among individuals
Within populations
4912763.72−48.72−13.78FIS = −0.15761.0000
Among populations12455.7144.4312.56FST = 0.1256<0.0001
Disclaimer/Publisher’s Note: The statements, opinions and data contained in all publications are solely those of the individual author(s) and contributor(s) and not of MDPI and/or the editor(s). MDPI and/or the editor(s) disclaim responsibility for any injury to people or property resulting from any ideas, methods, instructions or products referred to in the content.