Article

Home Range Size and Habitat Usage of Hatchling and Juvenile Wood Turtles (Glyptemys insculpta) in Iowa

by
Jeffrey W. Tamplin
1,*,
Joshua G. Otten
1,†,
Samuel W. Berg
1,‡,
Nadia E. Patel
1,§,
Jacob B. Tipton
1 and
Justine M. R. Radunzel
2
1
Department of Biology, University of Northern Iowa, Cedar Falls, IA 50614, USA
2
Statistical Consulting Center, Department of Mathematics, University of Northern Iowa, Cedar Falls, IA 50614, USA
*
Author to whom correspondence should be addressed.
Current Address: Department of Biology, Cornell College, Mount Vernon, IA 52314, USA.
Current Address: Creighton University Medical Center-Bergen Mercy, Omaha, NE 68124, USA.
§
Current Address: Division of Biology and Medicine, Brown University, Providence, RI 02912, USA.
Diversity 2025, 17(10), 733; https://doi.org/10.3390/d17100733
Submission received: 19 September 2025 / Revised: 15 October 2025 / Accepted: 16 October 2025 / Published: 18 October 2025
(This article belongs to the Section Biodiversity Conservation)

Abstract

The Wood Turtle (Glyptemys insculpta) is an endangered species in the state of Iowa and a species of conservation concern across their entire range. The Iowa population is characterized by high levels of adult and egg predation, displays little or no annual recruitment, and harbors an extremely low number of juveniles (7.3%). Home range and habitat usage studies of hatchling and juvenile Wood Turtles are limited to a few studies, and only one study of juveniles exists from the state of Iowa. Over a 10 yr period, we conducted a radiotelemetry study in Iowa on seven juvenile wood turtles for 32–182 weeks, and a 6-week study on six head-started hatchlings to determine home range sizes and habitat usage patterns and to provide comparisons with similar studies on adult Wood Turtles. Mean home range sizes of hatchling Wood Turtles were significantly smaller than the mean home range of older juvenile turtles for 100%, 95%, and 50% minimum convex polygons (MCPs), for 95% and 50% kernel density estimators (KDEs), and for linear home range (LHR) and stream home range (SHR). Habitat usage patterns of hatchlings and juveniles also differed. During periods of terrestrial activity, older juveniles utilized grass and forb clearings significantly more frequently than did hatchlings, and hatchlings used riverbank habitat more frequently than did juvenile turtles. In addition, juveniles were, on average, located significantly farther from the stream than were hatchlings. Our study provides important data on the home range size and habitat usage patterns of two under-represented age classes of this endangered species. These data will inform conservation agencies regarding relevant habitat protection and age-class management strategies of riparian areas that are necessary for the continued survival and protection of this imperiled species.

1. Introduction

The Wood Turtle (Glyptemys insculpta; LeConte, 1830) is a species of conservation concern across their range. In Iowa, they are exceedingly rare and have been state-listed as endangered since 1997 [1]. They are considered globally endangered by the International Union for the Conservation of Nature (IUCN) and are listed under the Convention on International Trade in Endangered Species of Wild Fauna and Flora (CITES) schedule II [2,3]. The Iowa population is a peripherally isolated population of this species on the southwestern edge of its range, exhibits no evidence of gene flow with adjacent state populations, has low population density, is impacted by an extensive conversion of land to agriculture, and is the only population of this species to inhabit the prairie-forest ecotone that lies in the Western Corn Belt Plains ecoregion [4,5,6]. In addition, the Iowa population is characterized by low levels of adult survivorship, high levels of nest destruction with little or no annual recruitment and exhibits an extremely low percentage of juveniles (7.3%). Over 45% of the 150 individuals encountered in Iowa over the past 22 years were estimated to be adults over 30 yrs old [4,7,8]. Although studies on the spatial ecology of adult wood turtles are emerging from across their range, home range and habitat usage studies of hatchling and juvenile Wood Turtles are limited to a handful of studies [9,10,11,12,13,14], and only one study assessing juvenile home range size exists from the state of Iowa [5]. Behavioral patterns that influence home range size and habitat usage may differ between age classes of turtles, including in Glyptemys insculpta and other Emydid turtles [5,15,16]. As such, determining habitat usage patterns and home range sizes in subadult wood turtles is especially crucial to inform species and habitat management policies in the state of Iowa. Revealing patterns of habitat selection and space use in peripherally isolated populations is especially valuable, because peripheral populations can exhibit variation from local adaptation and their behavioral responses may differ from individuals in larger, contiguous populations [17]. This can be particularly impactful for cryptic species that require multiple habitat types and exhibit large home ranges, such as the Wood Turtle [5,18,19].
Home range estimation methods vary between species and studies, and the most suitable methods are often selected based on the vagility and movement patterns of study species, habitat types, and to facilitate effective comparisons with previous studies. The most frequently used methods for determining home range size in reptiles are minimum convex polygons (MCPs) and kernel density estimators (KDEs) [20]. KDEs may provide more useful visual interpretations of space use, but they are highly sensitive to the number of sampling points and the type of smoothing factor involved. For turtles and other reptiles with low vagility, KDEs may produce inconsistencies in home range size and lead to estimates that are overly large, although this may partially be addressed by autocorrelation [21,22,23,24]. The MCP method creates a polygon with all interior angles less than 180º encompassing a defined percentage of individual location points [25]. Most commonly, three measures of MCP are determined: 100% MCP (integral home range; utilizes all recorded location points) [26,27]; 95% MCP (statistical home range; excludes specific, possibly exploratory, outlier locations that contribute most to expanding the home range) [28,29]; and, 50% MCP (core home range; includes locations in which an individual spends 50% of its time [30]. MCP methods are widely used for turtle studies; however, this method produces cruder outlines of home range and may encompass areas that are not used by the study individuals.
We conducted an over 10 yr radio telemetry study in Iowa on seven juvenile Wood turtles for 32–182 weeks at three sites in three counties, and a 6-week study on six head-started hatchlings at a single site, to determine home range sizes for each age class, and to provide comparisons between these groups and with similar studies on adult Wood Turtles. We also recorded the habitat type of each turtle location. Broad habitat categories were defined as either aquatic [subcategorized as lotic (flowing) water or lentic (still) water] or terrestrial (subcategorized as deciduous forest, open canopy grass and forb areas, or riverbank based on canopy cover and dominant vegetation type). Based on prior observations from adult Wood Turtles during long-term (>20 yr) monitoring at these field sites, limited data on hatchling behavior from other studies, and the smaller body sizes of hatchling turtles, we predicted that (1) hatchling Wood Turtles would delay entering lotic habitat upon release; (2) hatchling Wood Turtles would use aquatic habitats more frequently than older juvenile turtles during active periods; (3) hatchling Wood Turtles would remain closer to water than older juvenile turtles; and (4) hatchling Wood Turtles would have smaller home ranges than older juvenile turtles.

2. Materials and Methods

2.1. Study Species

The Wood Turtle ranges from the Canadian Maritimes south to eastern West Virginia and northern Virginia and west through Michigan, Wisconsin, and Minnesota, with an isolated population in northeastern Iowa [31,32]. It is a semi-aquatic species of the Family Emydidae that utilizes both terrestrial and aquatic habitats and alters its habitat preferences seasonally based on temperature and precipitation cycles [33]. The Wood Turtle is a stream-obligate species whose home ranges center on fluvial habitat and include a mosaic of riparian areas and adjacent forests and clearings that are only occupied during warm periods [33,34]. Aquatic habitats are used for winter dormancy, avoiding predators and maintaining hydration state during the summer, and mating in spring and fall; terrestrial habitats are used primarily for foraging, nesting, and thermoregulation [29,30]. Wood Turtles inhabit a range of stream sizes, but they are found most often in slow-moving sections of mid-sized streams between 3 and 20 m wide, although they occasionally occur in larger streams [34,35,36,37]. In stream habitats, Wood Turtles frequent areas near banks and utilize features such as deep pools, logjams and individual logs, and the root masses of downed trees to mitigate the potential negative effects of high current flow [37,38,39]. In Iowa, and a few other regions, they are facultative users of ephemeral pools and confined wet depressions [34,40,41]. In terrestrial habitats, Wood Turtles utilize riparian areas with dense vegetation, swales, and floodplain wetlands, and in summer are often located in floodplain deciduous forests and their associated clearings containing a mixture of grasses and forb species, or in upland habitats [31,34].
Sex influences habitat and space usage among adult Wood Turtles in Iowa and several other regions. Female Wood Turtles have smaller home ranges, shorter linear ranges, and shorter stream ranges than males [5,18,42,43,44] and use aquatic habitats less frequently than males during periods of activity [40,44].
Annual behavioral cycles of the Wood Turtle encompass five different seasonally-based activity periods in Iowa: brumation (winter dormancy; November–March; exclusively aquatic), prenesting (April–May; emergence from brumation, primarily terrestrial), nesting (early to mid-June; primarily terrestrial), postnesting (mid-June–September; primarily terrestrial), and prebrumation (October–early November; primarily aquatic). The latter four periods generally occur from mid-April to early November in Iowa, and Wood Turtle behavior and habitat usage among adults generally differ between periods [8,33].

2.2. Study Sites

The study was conducted at three sites in Iowa, one in Black Hawk County (BHC), one in Butler County (BC) and one in Mitchell County (MC). Eight Wood Turtles were monitored at BHC: six hatchlings for six weeks from 17 September to 29 October 2015, and two juveniles from 8 May 2014 to 26 May 2016 (107 weeks) and 7 May 2015 to 8 July 2016 (61 weeks). Four juveniles were monitored in BC from 7 May 2014 to 22 December 2014 (32 weeks), 17 June 2014 to 14 December 2017 (182 weeks), 19 August 2014 to 2 June 2015 (41 weeks), and 23 June 2015 to 14 December 2017 (129 weeks), respectively. A single 10–11-yr-old juvenile turtle was monitored for 78 weeks at the MC site from 23 May 2023 to 25 November 2024.
The BHC and BC field sites are approximately 45 river channel km apart (23 km straight-line distance). The MC site is approximately 100 km north of the BHC site and 120 km north (by stream channel; 70 km straight-line distance) of the BC site. All sites are separated terrestrially by agricultural fields, county highways, and gravel roads, but are connected by a continuous waterway. There were no observed movements of turtles between sites. The BHC site contains a 3.5 km stretch of lotic aquatic habitat with a sand and mud substrate, which during normal flow generally ranges from a depth of 0.5–2.0 m and a width of approximately 10–50 m. The BC site encompasses a 3.5 km stretch of lotic aquatic habitat with a gravel, sand, and mud substrate, which usually ranges within a depth of 0.5–2.5 m with a width of approximately 10–60 m [2,33]. The MC site contains a 3.75 km stretch of lotic aquatic habitat with a rock and cobble substrate, which during normal flow generally ranges from a depth of 1.0–3.0 m and a width of approximately 30–60 m [5].
The BHC site is near a suburban area and contains mature riparian floodplain forest that is dominated by tree species such as Acer saccharinum Linneaus (Silver Maple), Populus deltoides Bartram (Eastern Cottonwood), Ulmus americana Linneaus (American Elm), Juglans nigra Linneaus (Black Walnut), and Morus spp. Linneaus (Mulberry). The BC site’s landscape is a rural, agricultural area with nearly 60% of the site containing moderately mature to mature riparian floodplain forest with shrubby young woodland species found along the periphery. The dominant tree species include Silver Maple, Eastern Cottonwood, American Elm, Acer negundo Linneaus (Box Elder), and Quercus spp. Linneaus (Oak) trees. The MC site is near a small town and is surrounded by a rural, agricultural area. Dominant tree species at the MC site are American Elm, Black Walnut, Mulberry, and Silver Maple with Oak trees scattered in upland areas. All three sites are mosaics of floodplain forest containing open-canopy grassland forb areas, both inland and along the riverbanks. The majority of the grassland areas are dominated by Phalaris arundinacea Linneaus (Reed Canary Grass), Securigera varia Linneaus (Crown Vetch), and Dactylis glomerta Linneaus (Orchard Grass) and a wide variety of forb species. All three sites contain human infrastructure, including houses, barns, hayfields and row crops, and paved and gravel roads. Bridges (BHC, BC), rail lines (BHC), and a hydroelectric dam (MC) are also included within the site boundaries. The river channel at the MC site is surrounded by limestone bluffs, which are generally not a barrier to Wood Turtle movements.

2.3. Radio-Telemetry and Head-Starting

We tracked six hatchling wood turtles at BHC three to four times per week for six weeks until transmitter failure during the fall of 2015. Each hatchling was sampled once per field site visit. The hatchlings came from a single nest of nine eggs, laid approximately 8 m from the stream in open sand by an >35-yr-old female (mass = 1072.0 g; straight line maximum carapace length [CL] = 187.40 mm; straight line maximum plastron length [PL] = 172.68) on 9 June 2015. Eggs were excavated and incubated in moist sand at 27.5 ± 1.0 °C. Mean egg mass was 11.75 g ± 0.10 standard error [SE]; mean egg length was 36.33 mm ± 0.26 SE; mean maximum egg width was 23.36 mm ± 0.14 SE. Hatching of the eight fertile eggs occurred after 53 d on 1 August 2015. Mean mass of the hatchings was 8.27 g ± 0.09 SE; mean CL was 34.43 mm ± 0.14 SE and mean PL was 29.89 mm ± 0.13 SE. Straight-line CL and PL were measured with a Marathon digital caliper (model 030300; ± 0.1 mm; MSI-Viking, Duncan, SC, USA). Body mass (±0.1 g) was determined with a Libror digital scale (model EB-4300 DW; 4300.00 g; Shimadzu, Columbia, MD, USA).
To facilitate carapace hardening for radio attachment and to ensure that hatchlings were large enough to bear a transmitter, hatchlings were head-started in the laboratory for seven weeks and fed Reptomin floating food sticks (Tetra Fish Products, Inc.; Blacksburg, VA, USA) and Hikari Cichlid Gold pellets (Kyorin Food Industries, Ltd., Hayward, CA, USA) ad libitum and provided with ultraviolet (UV) A and UVB lighting 12 h per day. Head-started hatchlings were then released at the nest site on 17 September 2015. At release, the mean mass of the six hatchlings used in the analysis was 9.50 g ± 0.25 SE; mean CL was 34.37 ± 0.32 SE; mean PL was 29.89 ± 0.16 SE.
We tracked two juvenile wood turtles (8- and 9 yrs old) at the same BHC site during 2014–2015, four juvenile turtles (8–14 yrs old) from BC during 2014–2017, and one 10–11-yr-old juvenile from MC during 2023–2024. Juvenile turtles lacked secondary sex characteristics, and age, based on counts of growth annuli, was less than 15 yrs old during the sampling period. The mean mass of juvenile turtles at first encounter was 622.76 g ± 70.04 SE; mean CL was 169.02 mm ± 5.39 SE and mean PL was 156.84 mm ± 6.66 SE. Cumulatively, juvenile turtles were tracked approximately biweekly (twice a week during active period months) to bimonthly (twice a month during winter dormancy) with radio telemetry from May 2014 through November 2024. Juvenile turtles were sampled once per field site visit.
We measured, photographed, and marked each turtle with a non-toxic marker (hatchlings) or a unique pattern of drilled holes (juveniles) along the edge of the carapace [45]. We attached an Advanced Telemetry System (ATS; Isanti, MN, USA), a very high frequency (VHF) model R1614 transmitter (0.3 g), to the carapace of each hatchling turtle and a model R1930 transmitter (29.0 g) to the carapace of each juvenile turtle with PC-7 epoxy (Protective Coatings, Inc.; Allentown, PA, USA). The weight of the transmitter and epoxy combined did not exceed 4% of hatchling body mass or 6% of the body mass of juvenile turtles. We used an ATS R410 radio receiver and Yagi antennae to radio-track and locate the turtles during the sampling period.

2.4. Home Range Size and Habitat Usage

At each turtle location, we recorded turtle identification number, date and time, Universal Transverse Mercator (UTM) coordinates (GARMIN MAP 60CSX, MAP 62CSX, or Rino 755t; each with <3 m accuracy; Olathe, KS, USA), and habitat type [aquatic: lotic (channel of the main stream and any connected tributaries and flowing backwaters) or lentic (ephemeral pools, disconnected backwaters and oxbows, ponds and marshes); terrestrial: deciduous forest, grass and forb clearing, or riverbank].

2.4.1. Categorical Habitat Usage

To quantify and compare habitat usage, we designated each turtle location observation as one of four categories: (1) aquatic (lotic or lentic habitat), (2) riverbank (including open sand/mud areas adjacent to a stream, the banks of ephemeral pools, and heavily vegetated riparian areas within 10 m of the water’s edge); (3) deciduous forest (areas dominated by woody vegetation over 3 m in height producing more than 40% canopy cover); (4) grass and forb clearings (inland areas often with dense ground cover, a lack of woody vegetation over 3 m in height, and less than 40% canopy cover). We determined canopy cover with a spherical crown densiometer (convex model A43887, Forestry Suppliers, Inc.; Jackson, MS, USA). We recorded habitat type for each turtle location during the annual period of turtle activity only (locations associated with winter dormancy were omitted from the habitat analysis).

2.4.2. Distance from Water

We measured the distance (m) between each turtle location and the nearest body of water that was deep enough for the turtle to fully submerge during periods of turtle activity. We used ground-truthing for each distance measurement by walking a straight line from each turtle location to the edge of the nearest water body. For distances that were over 20 m, we also verified the straight-line measurement with the ‘path tool’ in Google Earth Pro (version 7.3.3.7699; Google, LLC., Mountain View, CA, USA) based on stream levels synchronized with the period of data collection.

2.5. Statistical Analyses

We used Microsoft Excel (version 16.99; Redmond, WA, USA) and the statistical program R (version 4.4.2) to generate summary statistics (mean, standard deviation [SD], SE and minimum [min] and maximum [max] values) and used the ‘lme4’ package (version 1.1-35.1) in R to run single factor ANOVAs with repeated measures (because the same individual turtles were sampled multiple times) to determine if age class significantly affected home range size or distance from water [46,47]. We estimated home range using the functions of ‘mcp’ and ‘kernelUD’ in the ‘adehabitatHR’ package (version 0.4.22) in R [48]. Multiple estimation methods were used to estimate home range including 100%, 95%, and 50% MCPs and 95% and 50% KDEs. The reference default smoothing parameter ‘href’ was employed for the KDEs because it is recommended for turtles [43,49]. We used multiple two-sample t-tests as post-hoc analyses to compare the home range estimates between hatchling and juvenile turtles using the R function ‘t.test,’ and we used ‘var.test’ to test for homogeneity of variance in R. Based on Levene’s test, the assumption of homogeneity of variance was violated for all home range estimates and all distances from water measurements between the two groups. Therefore, each measure was log-transformed in the t-test comparisons to meet the assumption of homogeneity of variance.
We used ArcGIS Pro (version 3.5; ESRI, Redlands, CA, USA) to generate maps of 100%, 95%, and 50% MCPs for each individual turtle in the analysis. We used the path tool in Google Earth Pro to measure linear distances between the two most widely separated points for each individual turtle (i.e., the Euclidian distance) and the distance along the stream channel between the most widely separated points within the primary stream to calculate linear home range [LHR] and stream home range [SHR], respectively. We analyzed categorial habitat data with two-factor Pearson Chi-squared [χ2] tests using the R function ‘chisq.test’ to determine if habitat usage was independent between hatchlings and juveniles. The alpha value (α) for significance was set at 0.05 for all statistical tests.

Comparison Groups

Because each hatchling was relocated 21–22 times during a six-week period and juveniles were tracked over longer time periods, we estimated MCP, KDE and LHR home ranges for all juvenile observations as well as for the first 22 juvenile locations only. We used repeated measures single-factor ANOVAs and multiple two-sample t-tests used as post-hoc analyses to determine which LHR, SHR, and distance from water measurements differed between hatchlings and juveniles. For the SHR analysis, comparison groups included all hatchling observations, all juvenile observations, and to produce a more relevant comparison to hatchling data, the first 12 juvenile locations in the primary stream only, a value equivalent to the mean number of hatchling locations within the stream. For more relevant comparisons, we calculated mean, SD, SE, min, and max values for all hatchling and all juvenile distances from water and for observations of juveniles during the Postnesting and Prebrumation periods only, equivalent to the activity periods in which hatchlings were tracked. Because Wood Turtles use both aquatic and terrestrial habitats individually and sporadically, we analyzed distance from water, including all locations (both terrestrial and aquatic) and for terrestrial locations only, separately. Categorial habitat usage was calculated for all hatchling observations, all juvenile observations, and juvenile observations during the Postnesting and Prebrumation periods only. Habitat usage was analyzed separately as simply aquatic or terrestrial and also with each of the four habitat categories included.

3. Results

3.1. Radiotelemetry

Six hatchling turtles were relocated 131 times between 17 September 2015 and 29 October 2015; 18 hatchling locations occurred during the summer Postnesting period, the remaining 113 locations occurred during the fall Prebrumation period. Mean (±SD) number of days for hatchlings to enter the stream was 15.33 ± 8.57 (3.50 SE; range = 0–22 days). One hatchling was killed by a predator approximately one week after release, and although we replaced the transmitter on another hatchling from the same clutch, both were dropped from the analysis because we had fewer than 20 locations for each. All hatchlings became inactive and were exclusively found in aquatic habitat locations suitable for overwintering by 30 October 2015. Seven juvenile turtles were relocated 329 times between 7 May 2014 and 25 November 2024; 307 of these locations occurred during the active periods of the annual cycle (Prenesting: n = 85; Nesting: n = 19; Postnesting: n = 134; Prebrumation: n = 69). Because Wood Turtles occasionally move during the overwintering period, the first and last locations (n = 22) of each turtle during any single Brumation period were included in the home range analyses. Total number of juvenile locations for home range analyses was 329. However, all Brumation period observations were omitted from the habitat usage and distance from water analyses.

3.2. Home Range Size

Mean home range size of hatchling Wood Turtles was significantly smaller than the mean home range of older juvenile turtles for all MCP and KDE home range metrics (Table 1). Mean (±SD) home range size of hatchlings ranged from 0.18 ± 0.05 ha (100% MCP) to 0.06 ± 0.04 ha (50% MCP). Mean (±SD) home range size of juveniles ranged from 5.76 ± 3.19 ha (100% MCP) to 1.16 ± 0.99 (50% MCP). Home range measures for the KDE method produced larger values than the MCP method for both hatchlings and juveniles. Mean (±SD) estimates for hatchling KDE were 0.92 ± 0.41 ha (95% KDE) and 0.22 ± 0.08 ha (50% KDE). For juveniles, mean (±SD) KDEs were 13.16 ± 8.12 ha (95% KDE) and 2.87 ± 1.79 ha (50% KDE). Mean (±SD) values for juveniles using only the first 22 locations ranged from 3.96 ± 2.61 ha (100% MCP) to 0.82 ± 0.87 ha (50% MCP). For the first 22 juvenile locations only, mean (±SD) KDEs were 14.06 ± 10.78 ha (95% KDE) and 3.41 ± 3.03 ha (50% KDE). For visual comparison, Figure 1 presents representative 100%, 95%, and 50% MCP home range sizes of hatchling and juvenile individuals with small, moderate, and large home ranges (using all juvenile locations).
Linear home ranges of hatchlings ranged from 75.8 to 176.0 m. Mean [±SD] LHR of hatchlings was 100.62 ± 38.96 m. Linear home ranges for all juvenile observations ranged from 247.0 to 630.0 m (mean = 459.57 ± 129.96 SD m); for the reduced data set, mean juvenile linear home ranges was 440.00 ± 125.44 SE m (range = 247.0–630.0) m.
Mean (±SD) SHR of hatchlings was 39.38 ± 17.34 SD m (range = 15.0–68.8 m). For all juvenile observations, mean (±SD) SHR was 487.29 ± 175.97 m (range = 294.0–853.0 m); for the reduced data set, mean (±SD) juvenile SHR was 445.86 ± 189.52 m (range = 285.0–828.0 m).

3.3. Categorical Habitat Usage

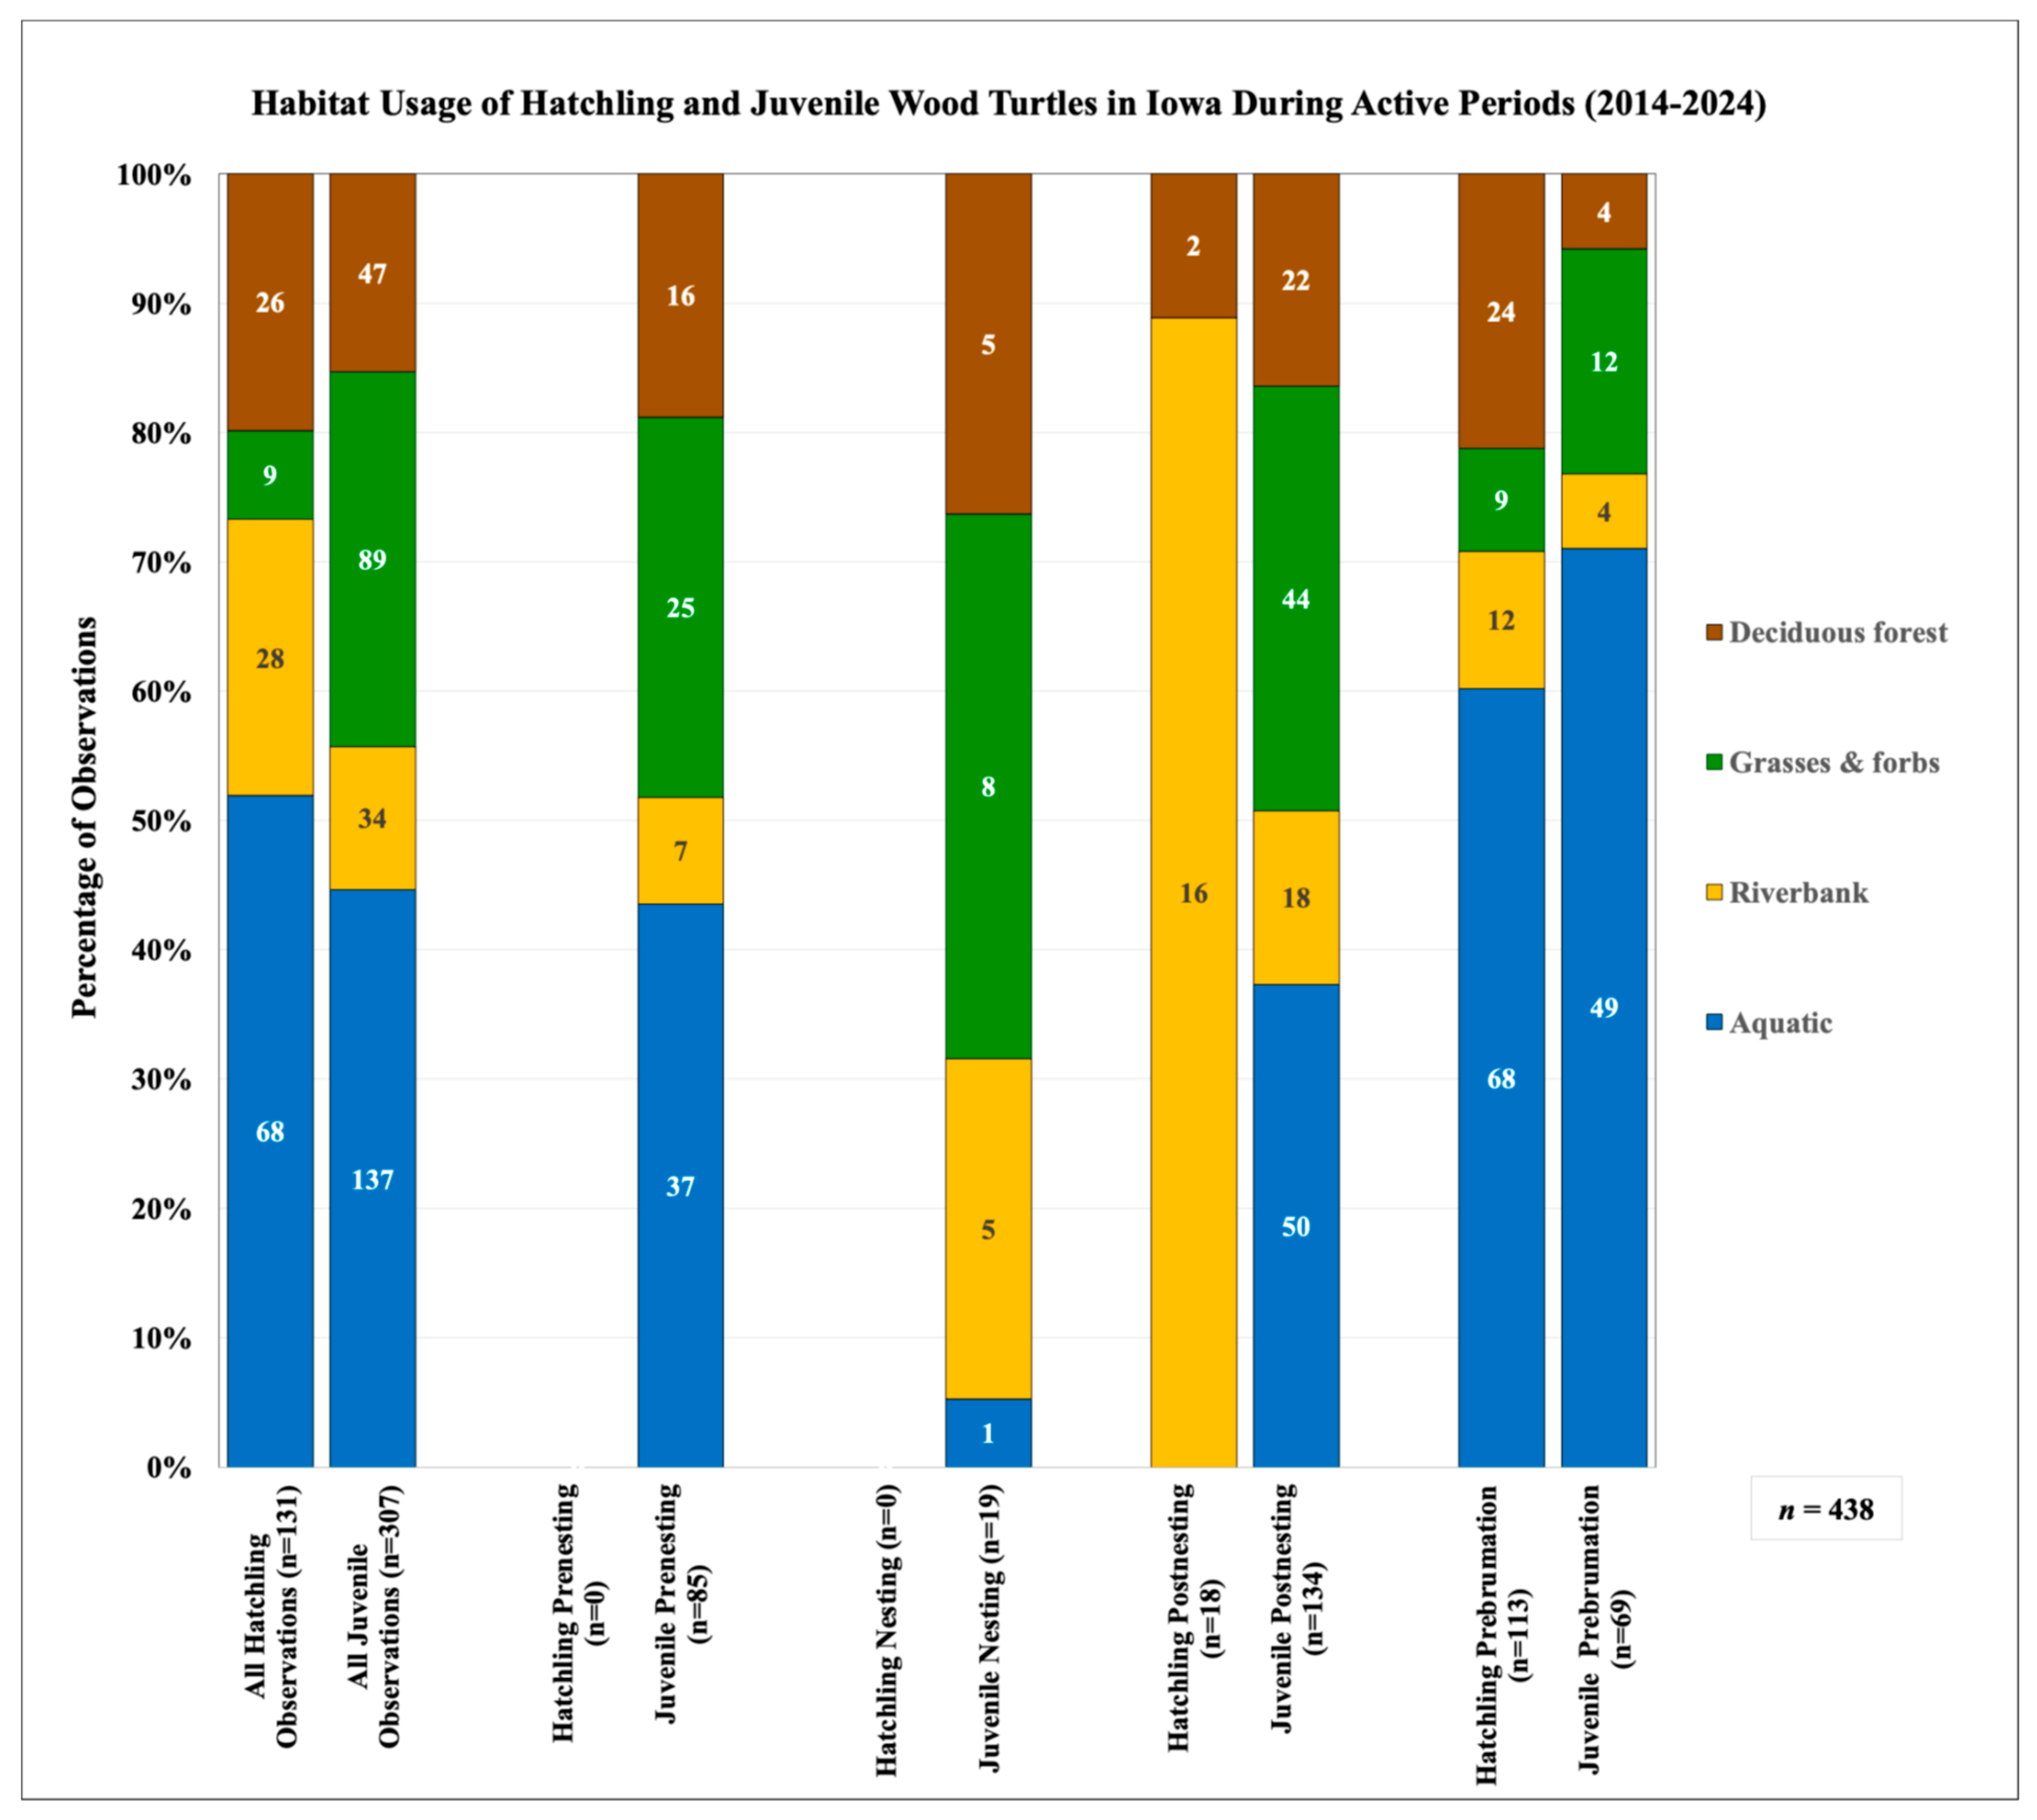
Combined, 205 (46.8%) of the hatchling and juvenile locations during active periods were in aquatic habitats (Figure 2). A small minority of these locations (n = 9; 4.4%) occurred in lentic habitat that was exclusively used by juveniles. The remaining aquatic locations (n = 196; 95.6%) were in lotic water. Of the total 131 hatchling locations, 68 (51.9%) were in aquatic habitats (Figure 3). Because hatchlings did not venture far from the original nest site, none of the hatchlings utilized the lentic habitat and all their aquatic locations were near the banks in the primary stream, and within 150 m of the release site. Of the 63 terrestrial locations of hatchlings, 28 (44.4%) occurred in riverbank habitat, 26 (41.3%) were in deciduous forest, and only 9 (14.3%) were in a grass and forb clearing (Figure 4). Of the 307 juvenile locations, 137 (44.6%) were in aquatic habitats, 89 (29.0%) were in grass and forb clearings, 47 (15.3%) were in deciduous forest, and 34 (11.1%) were in riverbank habitats. Both hatchlings and juveniles primarily used aquatic habitats during the fall prebrumation period. During this period, hatchlings were in the stream in 60.2% of the observations, and juveniles were in aquatic habitats in 71.1% of the observations.

3.4. Distance from Water

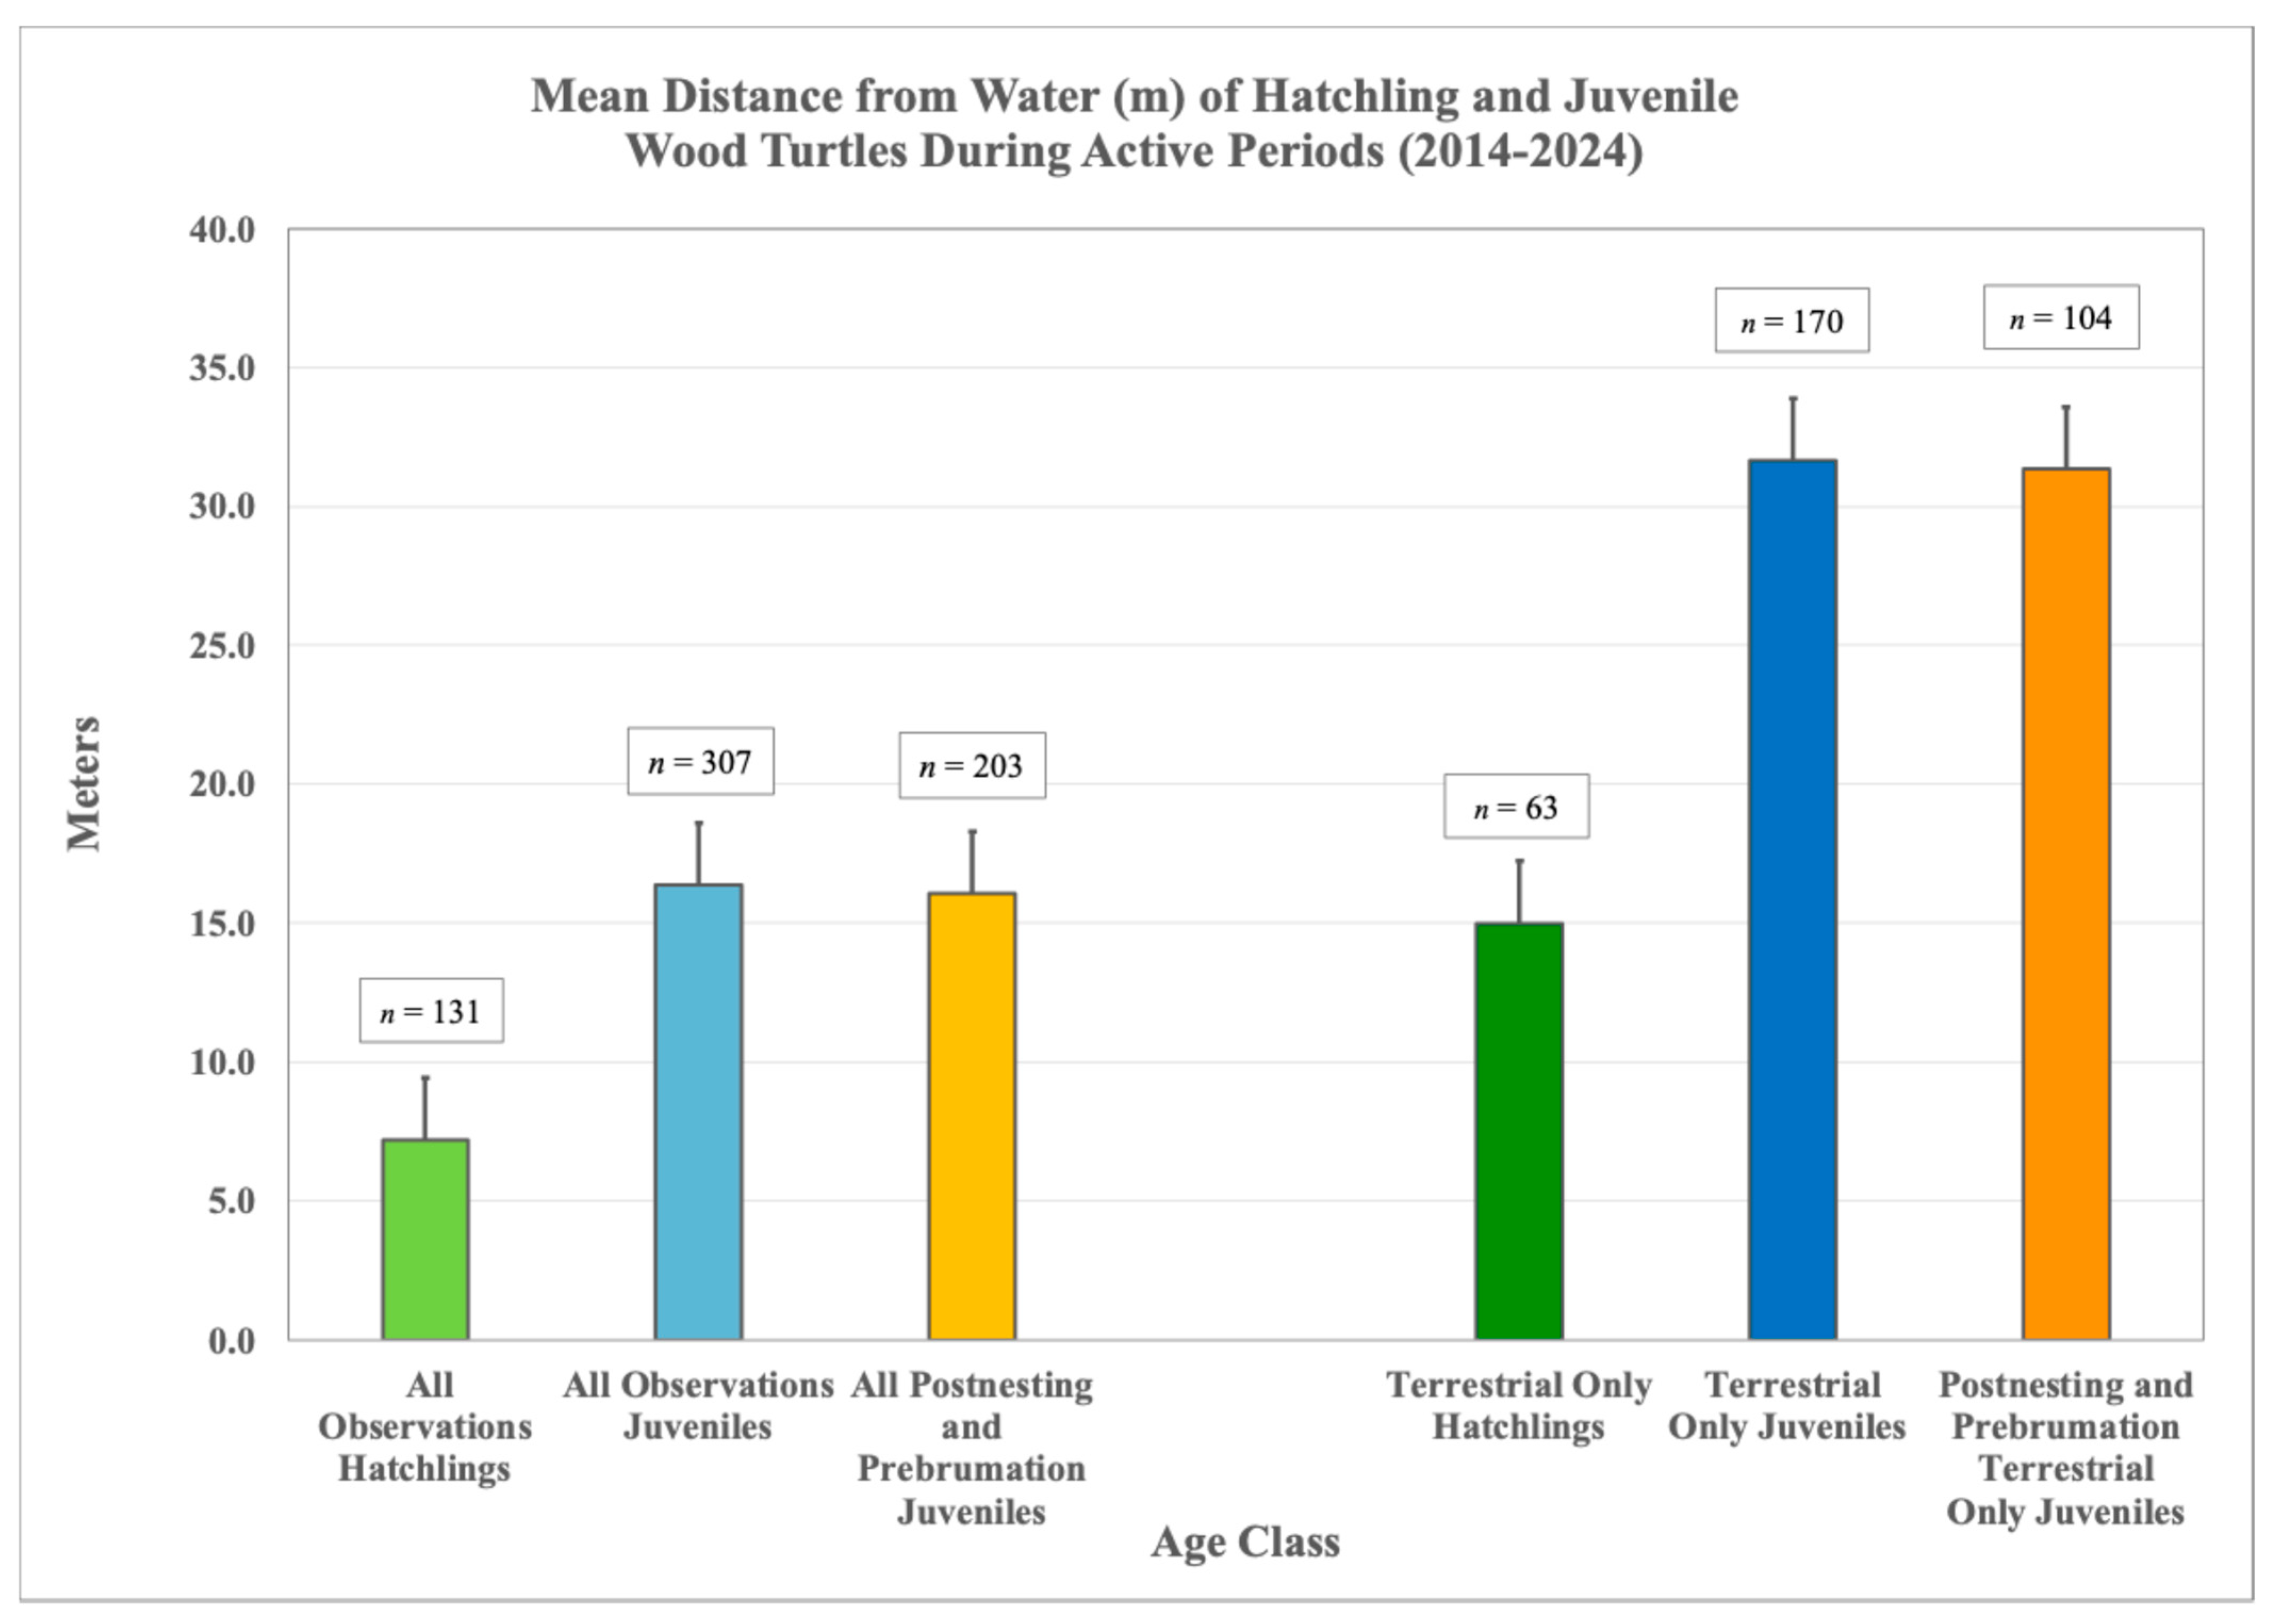
Across all observations, mean (±SE) distance from water by hatchling Wood Turtles in Iowa was 7.20 m ± 0.85 m (± 9.76 SD; n = 131) and mean (±SE) distance from water by juveniles was 16.36 ± 1.62 m (± 28.37 SD; n = 307) (Figure 5). Mean (±SE) distance from water by juveniles during the postnesting and prebrumation periods only was 16.06 ± 1.99 m (±28.28 SD; n = 203). For terrestrial observations only, mean (±SE) distance from water by hatchling Wood Turtles in Iowa was 14.98 ± 1.14 m (±9.03 SD; n = 131) and mean (±SE) distance from water by juveniles was 31.66 ± 2.24 m (±29.15 SD; n = 170) (Figure 5). Mean (± SE) distance from water by juveniles during the postnesting and prebrumation periods only was 16.06 ± 1.99 m (±28.28 SD; n = 203). Among terrestrial observations, mean (±SE) distance from water by juveniles during the postnesting and prebrumation periods only was 31.35 ± 3.23 m (±32.94 SD; n = 104). The maximum distance from water by a hatchling was 37.0 m and occurred on 2 October 2015 during the prebrumation period; maximum distance from water by a juvenile was 148.0 m at the BHC site during the postnesting period (25 August 2015).

3.5. Statistical Analyses

3.5.1. Home Range Size

The repeated measures single-factor ANOVAs indicated that hatchling and juvenile home range sizes were significantly different for each metric analyzed. Age class significantly affected 100% MCP for all hatchling and all juvenile observations (df = 1,11; F = 18.1032; p = 0.0014), and for all hatchling and the first 22 locations of each juvenile only (df = 1,11; F = 18.1624; p = 0.0013). Similarly, 95% MCPs were significantly different for all hatchling and all juvenile observations (df = 1,11; F = 8.8530; p = 0.0126), and for all hatchling and the first 22 locations of each juvenile only (df = 1,11; F = 5.3047; p = 0.0418). Comparisons between 50% MCPs were significantly different for all observations (df = 1,11; F = 7.3978; p = 0.0199) but the reduced data set was marginally nonsignificant (df = 1,11; F = 4.5807; p = 0.0556).
Repeated measures single-factor ANOVA of KDEs was also significantly different for the 95% KDE comparisons (all observations: df = 1,11; F = 13.4580, p = 0.0037; reduced juvenile observations: df = 1,11; F = 8.7873, p = 0.0129) and for both 50% KDE comparisons (all observations: df = 1,11; F = 12.9824; p = 0.0041; reduced juvenile observations: df = 1,11; F = 6.5671, p = 0.0264).
The two-sample t-tests on log-transformed measures revealed that all estimates of home range size were significantly different between hatchlings and juveniles, including comparisons between hatchlings and all juvenile observations and comparisons using only the first 22 locations of each juvenile (Table 2).
Repeated measure single factor ANOVA also revealed that age class significantly affected LHR for all hatchling and all juvenile observations (df = 1,11; F = 42.0390; p < 0.0001), and for all hatchling and the first 22 locations of each juvenile only (df = 1,11; F = 40.1283; p < 0.0001). Comparisons between all juveniles and the first 22 juvenile locations only were not significantly different for LHR (df = 1,12; F = 0.0822; p = 0.7792). Two-sample t-tests also revealed significant differences between the mean values of hatchling and juvenile LHR (all hatchling and all juvenile observations: df = 7, t = −6.9523, p = 0.0002; all hatchling and the first 22 juvenile locations only: df = 7, t = −6.7863, p = 0.0003).
Repeated measure single factor ANOVA also revealed that SHR was significantly different between all hatchling and all juvenile observations (df = 1,11; F = 38.0645; p = 0.0001) and for all hatchling and the first 22 locations of each juvenile only (df = 1,11; F = 27.0567; p = 0.0001). For SHR, comparisons between all juveniles and first 22 juvenile locations only were not significantly different (df = 1,12; F = 0.1796; p = 0.6792). Two-sample t-tests also revealed significant differences between the mean values of hatchling and juvenile SHR (all hatchling and all juvenile observations: df = 6, t = −6.6964, p = 0.0005; all hatchling and the first 22 juvenile locations only: df = 6, t = −5.6469, p = 0.0013).

3.5.2. Categorical Habitat Usage

The χ2 tests were highly significantly different (p < 0.0001) for each comparison, indicating that hatchlings and juveniles utilized habitat types independently. Comparisons included all aquatic versus terrestrial observations of hatchlings and juveniles (df = 1, χ2 = 154.2, p < 0.0001), all observations of hatchlings and all observations of juveniles during the postnesting and prebrumation periods only (df = 1, χ2 = 101.7, p < 0.0001). In addition, χ2 tests between all observations of hatchlings and juveniles for all four habitat categories revealed independence (df = 3, χ2 = 29.1, p < 0.0001) as well as all observations of hatchlings and observations of juveniles only during the postnesting and prebrumation periods only for all four habitat categories (df = 3, χ2 = 414.7, p < 0.0001).

3.5.3. Distance from Water

The repeated measures single factor ANOVAs revealed that mean distance from water was significantly different between hatchlings and juveniles for all observations (df = 1,436; F = 15.8194; p < 0.0001), for terrestrial observations only (df = 1,231; F = 15.8357; p < 0.0001), for all hatchling observations and all juvenile observations during the postnesting and prebrumation periods only (df = 1,332; F = 11.9168; p < 0.0006), and for terrestrial hatchling observations only and terrestrial juvenile observations during the postnesting and prebrumation periods only (df = 1,165; F = 14.8475; p = 0.0002).
All mean distance from water t-test post-hoc comparisons between hatchlings and juveniles were highly significantly different (p < 0.0001) and met the Bonferroni adjustment criteria, except for the mean differences between all juvenile observations and all juvenile observations during the postnesting and prebrumation periods only (p = 0.5690) and terrestrial only juvenile observations and terrestrial only juvenile observations during the postnesting and prebrumation periods only (p = 0.9387).

4. Discussion

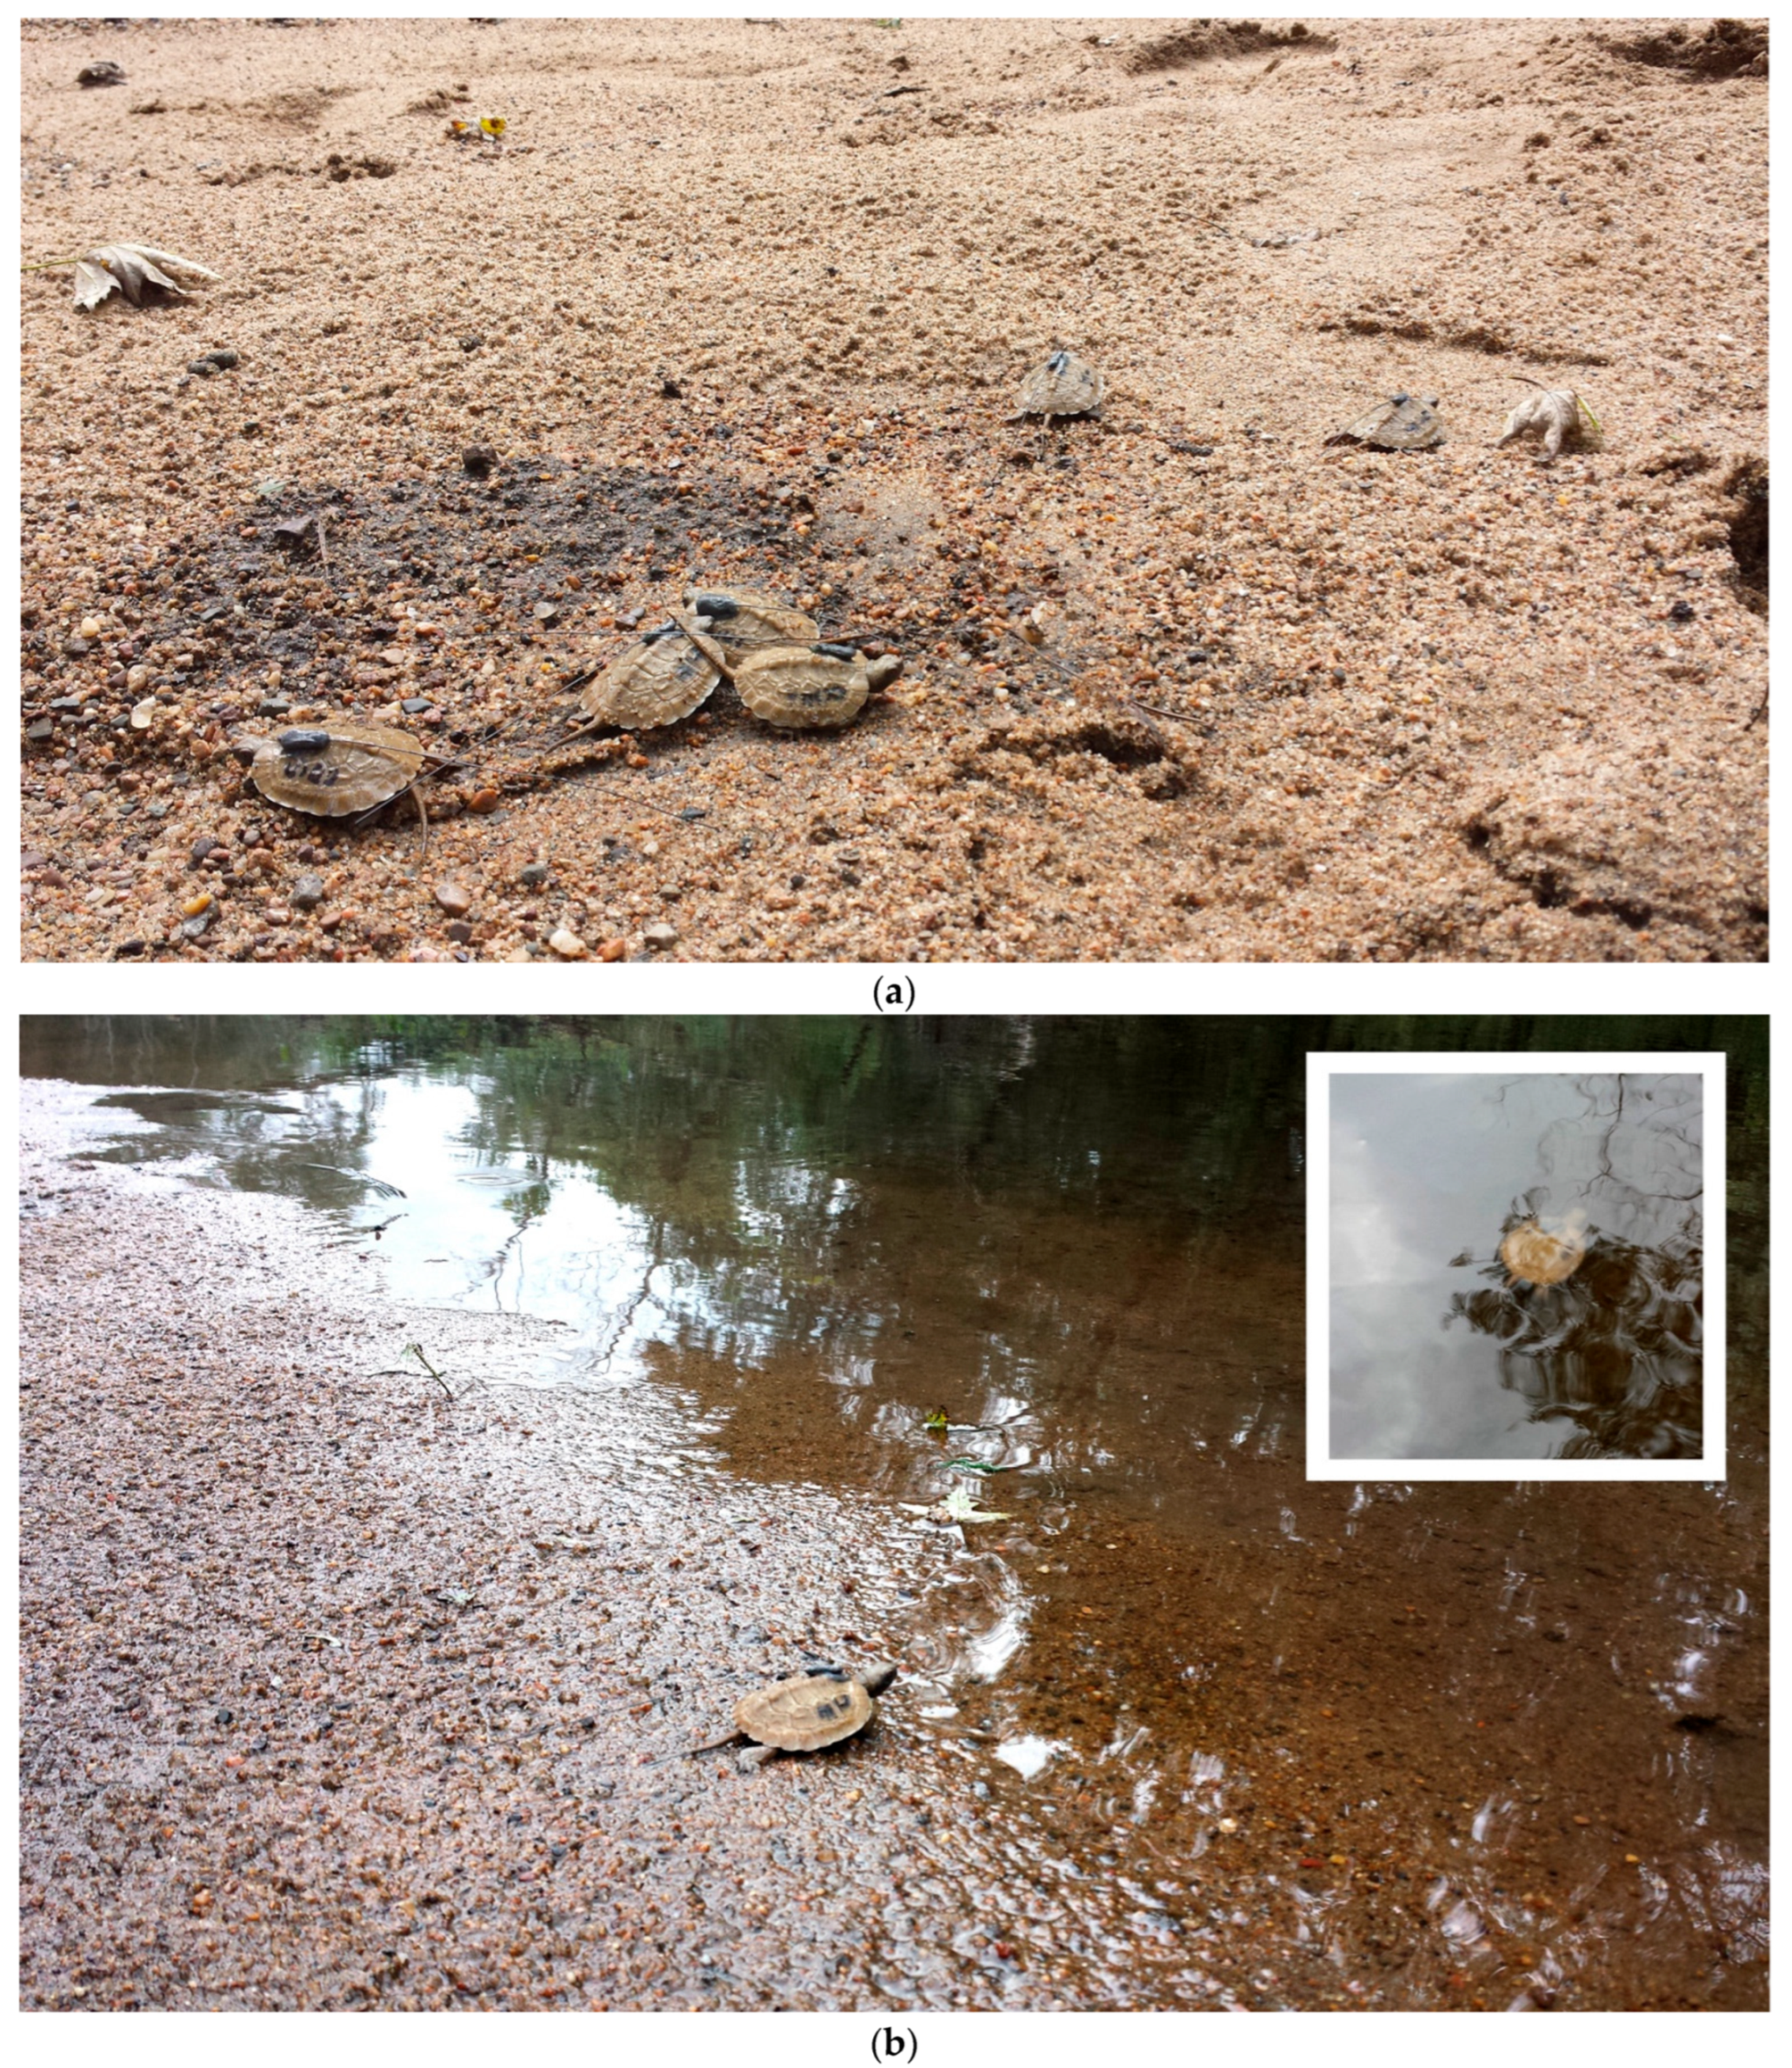
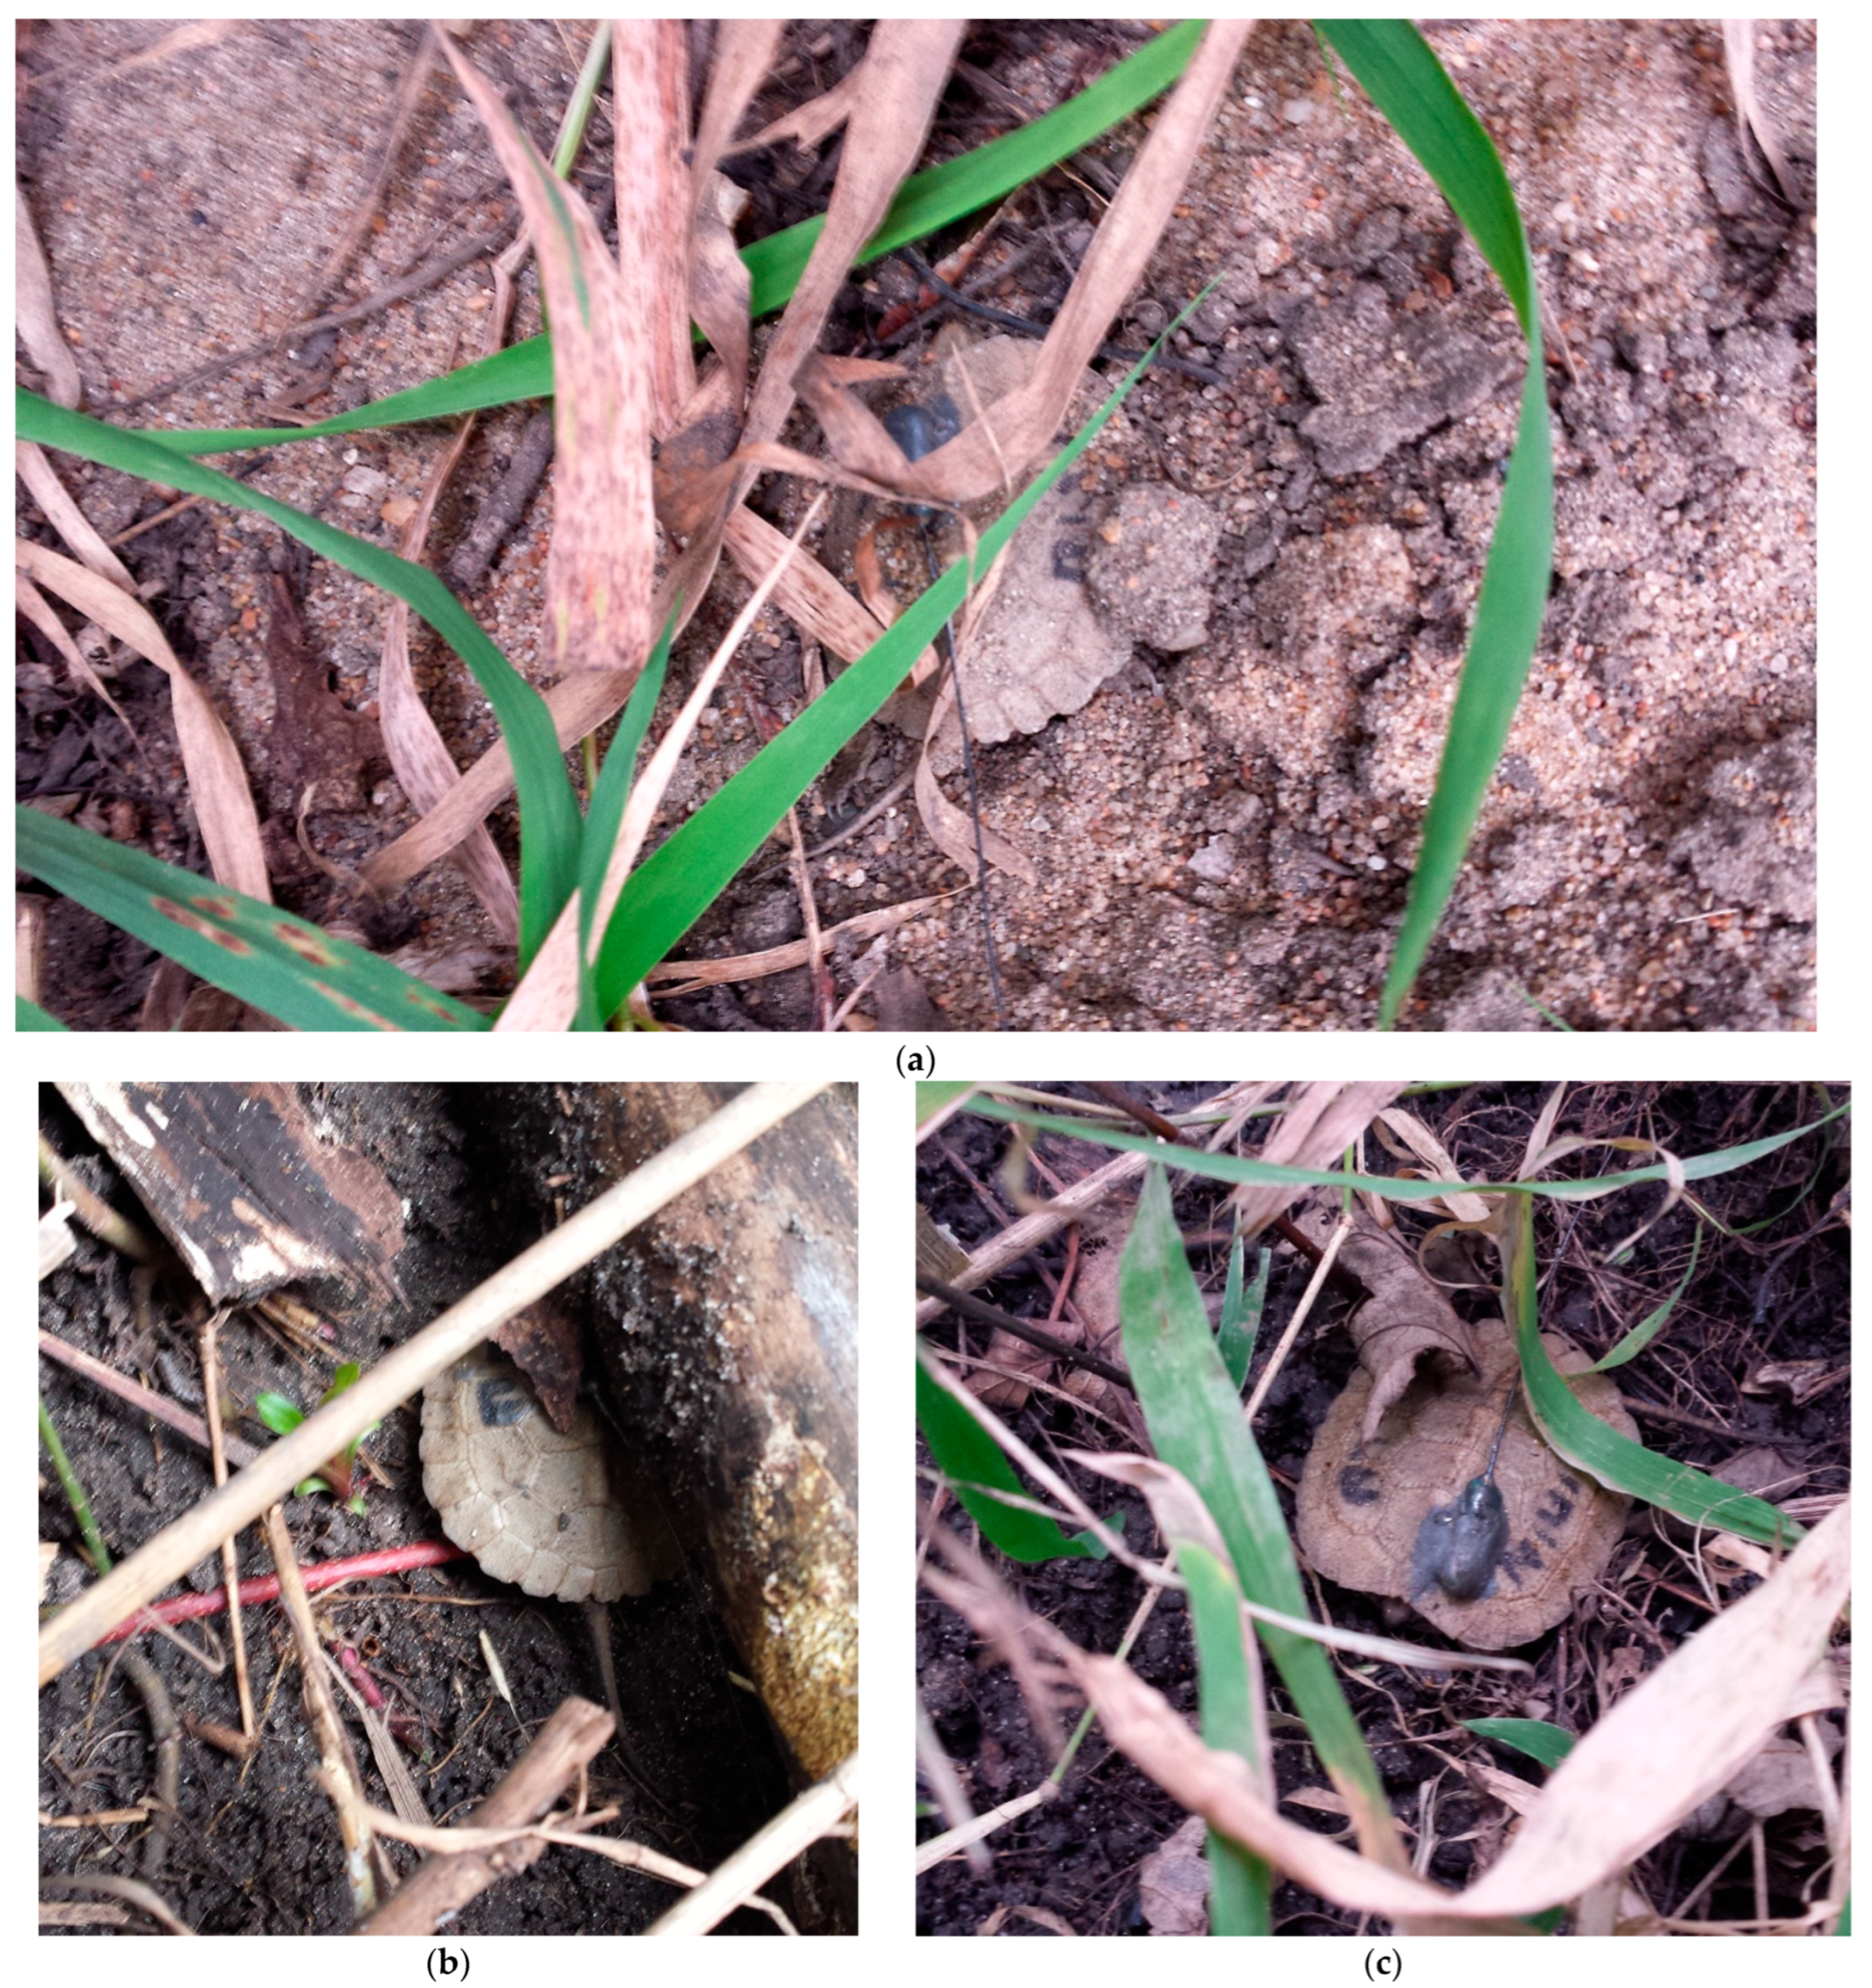
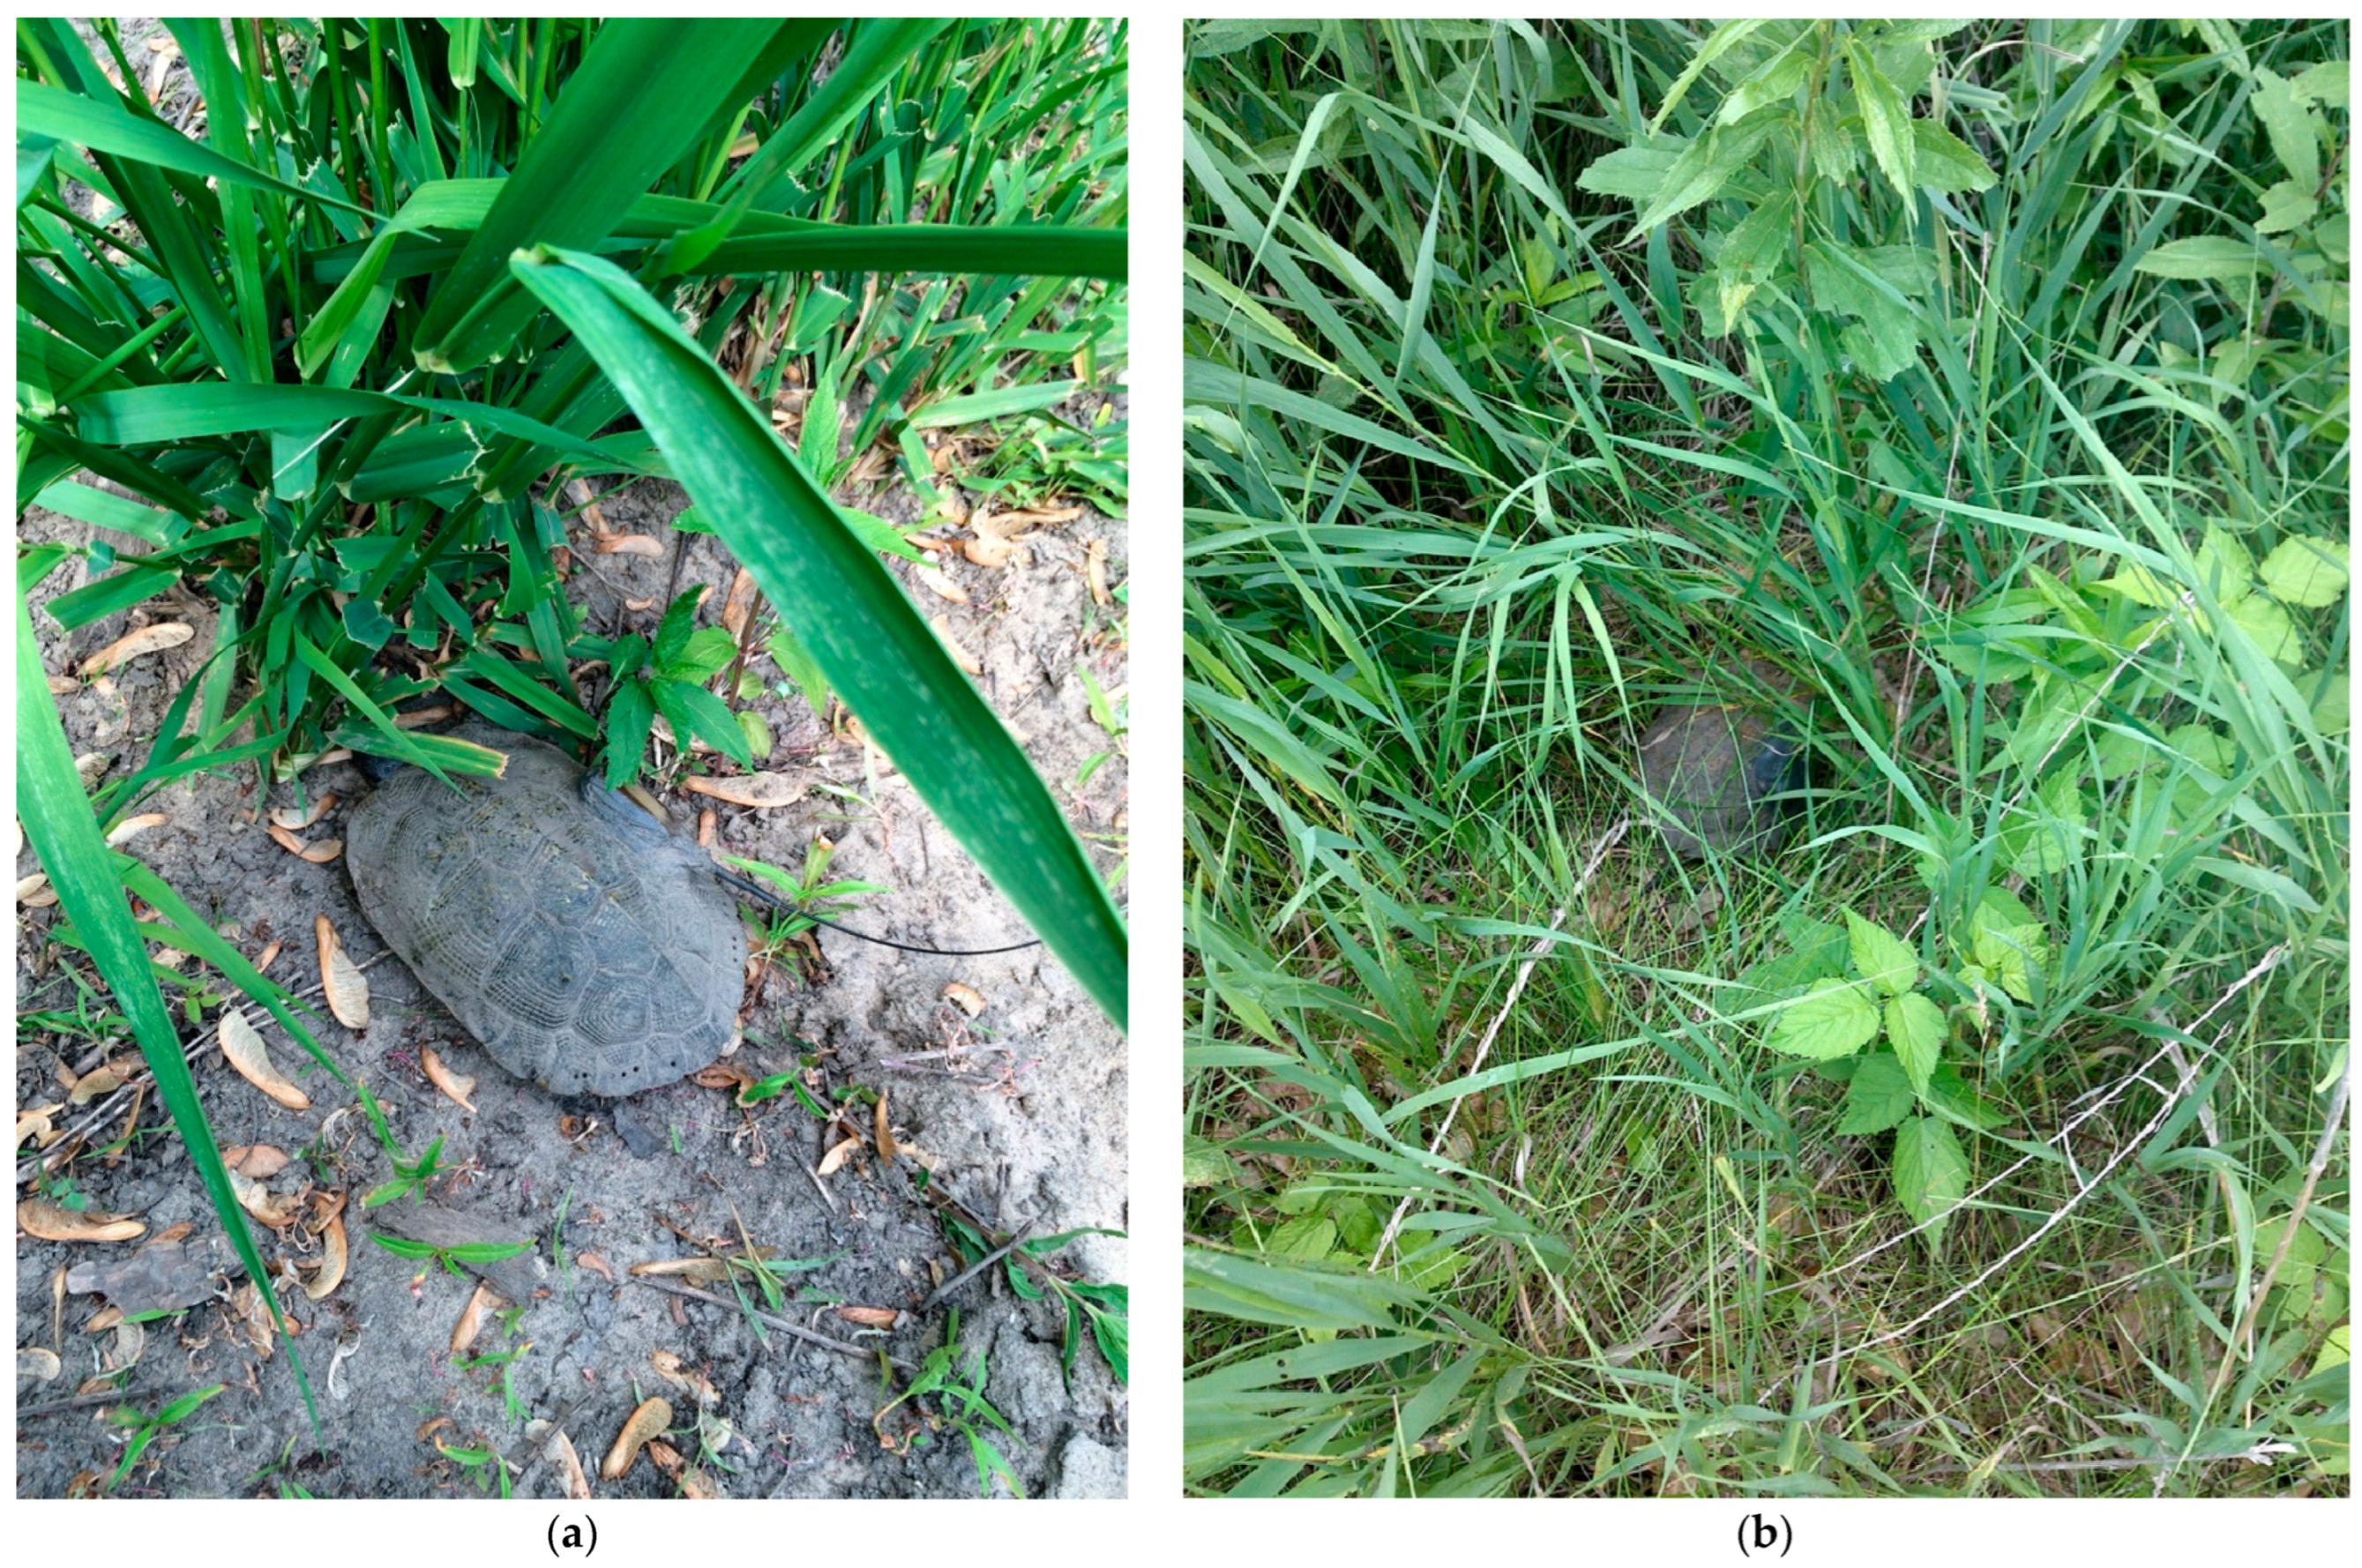
A recent habitat suitability modeling study indicated that Iowa has the lowest probability of Wood Turtle occupancy of any of the midwestern states [6]. Our study analyzed estimated home range sizes and habitat usage of 7 of the 10 juvenile turtles encountered in Iowa during an over 20 yr monitoring program. During that period, only one wild hatchling has ever been discovered, so these data represent a comprehensive analysis of the spatial ecology and habitat usage of the youngest age classes of Wood Turtles in Iowa. Hatchling Wood Turtles generally stayed close to the nest site and only one entered the stream immediately after release (Figure 6). For the first two weeks after release, hatchlings were mostly terrestrial. They remained highly cryptic and often buried themselves in the sand of the nesting beach, or under vegetation or woody debris (Figure 7). Although we did not quantify habitat availability, multiple areas of each habitat type were present within the mean LHR distances of both age classes. Hatchlings generally remained close to the stream and mostly occupied riverbank habitats until early October, when they became primarily aquatic. Our habitat usage results for the hatchlings may have been influenced by the nest location, which was on an open sand beach. However, areas of deciduous forest, open canopy grass and forb habitat, and extensive riverbank and stream habitat all existed within 20 m of the nest site/release location. In addition, maintaining the hatchlings in the lab for several weeks before release was necessary to facilitate transmitter attachment, and this may have affected their behavior.
Older juvenile Wood Turtles were more active than hatchlings, ventured farther from the stream, and often utilized open canopy grassland habitats during active periods of the annual cycle (Figure 8). Despite high predation levels on nests and adults at these sites, we did not observe juvenile mortality during the 10 yr study period. In the present study, juveniles were located in terrestrial habitats more frequently than hatchlings during the summer postnesting and fall prebrumation activity periods, when adult Wood Turtles at these sites become highly aquatic [8]. On average, juveniles were located farther from water than the hatchlings, but their mean distance from water was similar to that of adults in Iowa [8,33].

4.1. Comparisons with Other Hatchling and Juvenile Wood Turtle Studies

Hatchling Wood Turtle home ranges were substantially smaller than the older juveniles, and the limited movement patterns of hatchlings were consistent with the few existing spatial ecology studies on this youngest age class for this species [9,10,11,12,13,14]. On average, hatchlings in Iowa took approximately 2 weeks to enter the stream even though it was within 10 m of the release site. In New Hampshire, 12 hatchlings took 1–24 days to reach the stream (mean = 6.2 d) but the nest sites were in an upland area over 100 m from the stream [10]. In New Jersey, only three of 10 hatchlings that were released at the nest site reached the nearest stream during the 14–63 d radio tracking period; at this site, hatchlings moved 49–90 m to reach the stream [11]. In Virginia, hatchlings took 1–28 days to reach the stream (mean = 9.0 d) [13,14]. Although there is variability among clutch mates in all of these studies, clearly most Wood Turtle hatchlings do not immediately head directly for water after hatching. Our result that hatchlings used the riverbank habitat more frequently than other habitats may be more a function of the nest location and the limited movements of hatchlings than specific habitat preferences.
Juvenile MCPs were similar to values determined by Otten et al. [5], who used a subset of these same individuals at two of the three sites analyzed in this study. Otten et al. [5] determined that larger juvenile Wood Turtles exhibited limited movement compared to adults, especially adult males, but 100%, 95% and 50% MCP home ranges and SHR were similar between juveniles and adult females. Another study in Wisconsin of 7–9-month-old juvenile Wood Turtles documented small movement distances but did not calculate MCPs or KDEs [9].
Consistent with other studies on Emydine turtles, our home range estimates were substantially larger for the KDE method than for the MCP method, largely because KDE methods are more sensitive to multiple points within a small area [16,21,43]. Hatchling 95% KDE was six times larger than 95% MCP, and 50% KDE was four times larger than 50% MCP. Including all observations, juvenile 95% and 50% KDEs were three times larger than 95% and 50% MCPs, respectively. For our reduced juvenile observations, KDEs were five (95%) and four (50%) times larger than MCP estimates. We consider our MCP values to be a more accurate characterization of Wood Turtle space use during the study.
Older juvenile Wood Turtles at all three sites used inland grass and forb clearings with low canopy cover and dense ground cover for basking and foraging more frequently than hatchlings, although grass and forb clearings were available to the hatchlings. This may have been a function of the ability of larger juveniles to move longer distances and to seek areas with dense ground cover and open canopy that facilitate thermoregulation while still avoiding predators. In Wisconsin, 7–9-month-old juveniles used “ecotone” areas of Alder (Alnus rugosa), Reed Canary grass, and Meadow Willow (Salix petiolaris) more frequently than open grasslands, riverbank areas (“wet channel margin”), or the stream [9]. Although willow stands exist along riverbanks at the BC site and are used by juveniles and adults, stands of Alder and this exact habitat mixture do not exist at our Iowa sites. In Ontario, Canada, hatchlings preferred “riparian floodplain” habitat over the broad categories of stream, upland open, and upland forest areas, with the latter habitat being preferred least [12].

4.2. Comparisons with Adult Wood Turtle Studies

Mean 100% MCP of hatchling Wood Turtles in Iowa were 137 times smaller than those of adult males and 48 times smaller than those of adult females at these same sites. Similarly, 95% and 50% MCPs of hatchlings were 129 times (males) and 39 times (females) smaller than adults [5]. The tiny home ranges of hatchlings in the present study are smaller than any other home range estimates for this species in any other published study, including the previously smallest known values (0.3 ha ± 0.2 SD for males and 0.5 ha ± 0.3 SD for females) of adults from Wisconsin [50]. Our MCP values for older juveniles, although similar to those of adult females in Iowa, were considerably smaller than the values for adults of either sex that have been reported in the literature. Across 16 published studies, the mean values for 95% MCP (the most commonly reported metric) of adult females is 12.7 ha (range = 0.5–29.4 ha) and 19.2 ha (range = 0.3–35.6 ha) for adult males [29]. A long-term multi-decade study of adults from Massachusetts produced a mean 95% MCP of 13.1 ha (±10.7 SD) for adult females and a mean 95% KDE of 36.1 ha (±19.2 SD) (males were omitted from the analysis) [43].
The average mean LHR from seven studies is 657 m (range = 435–866 m) for adult females and 1028 m (range = 481–1531 m) for adult males. Our LHR values for hatchlings are seven times smaller than those of adult females and ten times smaller than those of adult males. Our LHR value for juveniles is 1.4 (females) and 2.2 (males) times smaller than those of adults [20]. Hatchling SHR values in our study were 17–19 times smaller than adults of both sexes from New Hampshire, Massachusetts, and Vermont, and 36 times smaller than adult males in Massachusetts [38,51,52]. Juvenile SHR values in our study were 100–300 m smaller than those of juveniles and adult females in Otten et al.’s [5] Iowa study and 200–900 m smaller than those of adults from New Hampshire, Massachusetts, and Vermont [38,51,52]. The SHR of adult males in Iowa was significantly larger than those of juveniles and adult females, and juvenile SHR in our study was approximately 1110 m smaller [5].
In Iowa, and across their range, sex influences the proportion of aquatic and terrestrial habitat usage in adults, with males being more aquatic [8,18,53,54]. Our study suggests that age class may also influence these broad habitat preferences. During the fall prebrumation period when Wood Turtles are primarily aquatic, hatchlings (60.2% of 69 observations) and juveniles (71.0% of 69 observations) in the present study used aquatic habitats less frequently than adults (77% of 179 observations) at these sites [5]. In northeastern Minnesota, adults of both sexes used lotic water heavily during all active periods [53]. In terrestrial habitat, adults had positive habitat associations with open canopy terrestrial areas, but preferences for mixed deciduous and coniferous forest were only positive among adult females. Both sexes displayed negative habitat associations with coniferous forest and deciduous forest at Minnesota sites [53]. In West Virginia, canopy cover and ground cover were correlated with adult Wood Turtle presence; turtles preferred areas with tall, thick herbaceous vegetative cover, and forested areas with high tree species richness and used open terrestrial areas bordering streams [54].
When in terrestrial habitat, the mean distance from water for juveniles in the present study was intermediate between the mean values of 71 adult females (46.3 m; n = 2307) and the mean value of 57 adult males (20.7 m; n = 1051) in Iowa [29]. Our values for juveniles were similar to those of adults (28.4 for males and 37.3 m for females) in Minnesota, but substantially less than the mean distances (85.67 for males, 139.8 for females) in West Virginia [53,54].

4.3. Conservation and Management Implications

Our results can be used to better understand the spatial ecology and habitat usage patterns of subadult Wood Turtles in Iowa and reveal how home range size and the utilization of habitat differs between recently hatched individuals and older juveniles. Hatchling Wood Turtles in Iowa remained within 150 m of the nest site until they became dormant for the winter and, among terrestrial habitats, used riparian locations more frequently than older juveniles. Despite most hatchlings not entering the stream for the first two weeks, during active periods hatchlings utilized aquatic habitats more frequently than juveniles before becoming dormant for the winter. In this study, hatchlings had miniscule home range sizes centered around the nest site and their MCPs and KDEs were several orders of magnitude smaller than those of older juveniles and the adults that have been monitored at these sites for over 20 yrs [5]. Thus, protection of nesting areas is crucial to not only current and future generations of Wood Turtles but also to previous clutches of hatchlings that are likely to remain within a few hundred m of nest sites for at least the first 6 months of life.
Juvenile Wood Turtles had larger home ranges than hatchlings, but these were still smaller than the home range sizes of adults in Iowa, particularly those of adult males [5]. On average, juvenile turtles were twice as far from water and used grass and forb clearings more frequently than hatchlings. Because Wood Turtles are an “edge species” that often occupy transitions between habitats, the protection and maintenance of open canopy areas with dense grass and forb ground vegetation along forest edges is essential to enhance the habitat diversity that is used by both older juvenile and adult Wood Turtles [5]. Our findings can be utilized by conservation managers for habitat restoration projects, including maintenance of forest succession, maintenance of natural nesting sites and the establishment of artificial nesting areas, and to develop a better understanding of the amount of space that is utilized by young Wood Turtles, whose habitat usage changes seasonally and whose home ranges center on flowing water habitats.
Although some recent studies suggest that adult survivorship of Glyptemys insculpta, and broadly other turtle taxa, may be more important to population persistence than hatchling and juvenile recruitment [55,56], the fact remains that future turtle populations cannot exist without at least some level of recruitment. Thus, knowledge of hatchling and juvenile spatial ecology and habitat usage is essential for effective management of this imperiled species. This may be particularly important for species in which the ecological patterns of young age classes differ from those of adult turtles.

Author Contributions

Conceptualization, J.W.T. and J.G.O.; methodology, J.W.T. and J.G.O.; formal analysis, J.W.T., N.E.P., J.B.T., and J.M.R.R.; writing—original draft preparation, J.W.T.; writing—review and editing, J.W.T., J.G.O., and J.M.R.R.; field data acquisition, J.W.T., J.G.O., S.W.B., and J.B.T. All authors have read and agreed to the published version of the manuscript.

Funding

This research was funded by the Iowa and Minnesota Department of Natural Resources through three Competitive State Wildlife Grants (US Fish and Wildlife Service award nos. F14AP00013, F17AP00028, and F21AP01078) contracted to the University of Northern Iowa (Jeff Tamplin, principal investigator).

Institutional Review Board Statement

All animals were handled in accordance with the American Veterinary Medical Association guidelines and methods were approved by the Iowa Department of Natural Resources (Permit no. SC-648; approved 1 January 2012, 31 January 2015, 8 March 2018, 1 March 2021, and 15 December 2023) and the Minnesota Department of Natural Resources (Special Permit no. 32116; approved 14 May 2021).

Informed Consent Statement

Not applicable.

Data Availability Statement

The data presented in this study are available on request from the corresponding author. The data are not publicly available due to the legally protected, endangered status of this species in the state of Iowa.

Acknowledgments

We thank Nicole Bell, Kara Branstad, Lucus Byrnes, Anthony DiFronzo, Paige Frahm, Skye Franklin, Jeremy George, Nicholas Matthews, Kinnick Medinger, Erin Schaufenbuel, Nick Schemmel, Zachary Schneider, and Sloan Vry for assistance with radiotelemetry and field data collection, and the Department of Biology and the College of Humanities, Arts, and Sciences of the University of Northern Iowa for additional funding. Jennifer A. Moore contributed valuable comments on the manuscript. The Black Hawk, Butler, and Mitchell County Conservation Boards and several private landowners granted access to field sites.

Conflicts of Interest

The authors declare no conflicts of interest. The funders had no role in the design of the study or in the collection, analyses, or interpretation of data, nor in the writing of the manuscript or the decision to publish the results.

References

  1. Iowa Natural Resource Commission. Chapter 77: Endangered and Threatened Plant and Animal Species. 2009. Available online: https://www.legis.iowa.gov/docs/ACO/chapter/571.77.pdf (accessed on 11 October 2025).
  2. van Dijk, P.P.; Harding, J. Glyptemys insculpta [Errata Version Published in 2016]; The International Union for the Conservation of Nature Red List of Threatened Species: Gland, Switzerland, 2011; Available online: www.IUCN.org (accessed on 11 October 2025).
  3. COSEWIC. COSEWIC Assessment and Status Report on the Wood Turtle Glyptemys insculpta in Canada; Committee on the Status of Endangered Wildlife in Canada: Ottawa, ON, Canada, 2018; 51p, Available online: http://www.registrelepsararegistry.gc.ca/default.asp?lang=en&n=24F7211B-1 (accessed on 11 October 2025).
  4. Spradling, T.A.; Tamplin, J.W.; Dow, S.S.; Meyer, K.J. Conservation genetics of a peripherally isolated population of the Wood Turtle (Glyptemys insculpta) in Iowa. Conserv. Gen. 2010, 11, 1667–1677. [Google Scholar] [CrossRef]
  5. Otten, J.G.; Hulbert, A.C.; Berg, S.W.; Tamplin, J.W. Home range, site fidelity, and movement patterns of the Wood Turtle (Glyptemys insculpta) at the southwestern edge of its range. Chelonian Conserv. Biol. 2021, 20, 231–241. [Google Scholar] [CrossRef]
  6. Spaid, S.; Brown, D.J.; Mota, J.F.; Badje, A.F.; Crozier, G.E.; Lapin, C.N.; Lee, Y.M.; Moen, R.A.; Tamplin, J.W. Projected contemporary habitat distribution and quality for wood turtles across the Upper Midwest. J. Wildl. Manag. 2025, e70108. [Google Scholar] [CrossRef]
  7. Lapin, C.N.; Tamplin, J.W.; Cochrane, M.M.; Woodford, J.E.; Brown, D.J.; Moen, R.A. A regional analysis of Glyptemys insculpta (Wood Turtle) survival in the upper Midwest of the USA. Herpetol. Conserv. Biol. 2019, 14, 668–679. [Google Scholar]
  8. Tamplin, J.W. Upper Midwest Turtle Conservation—Phase 3; Final Report to the US Fish and Wildlife Service for Iowa State Wildlife; Grant No. F21AP01078; State of Iowa, Department of Natural Resources: Des Moines, IA, USA, 2024; 148p. [Google Scholar]
  9. Brewster, K.N.; Brewster, C.M. Movement and microhabitat use by juvenile Wood Turtles introduced into a riparian habitat. J. Herpetol. 1991, 25, 379–382. [Google Scholar] [CrossRef]
  10. Tuttle, S.E.; Carroll, D.M. Movements and behavior of hatchling wood turtles (Glyptemys insculpta). Northeast. Nat. 2005, 12, 331–348. [Google Scholar] [CrossRef]
  11. Castellano, C.M.; Behler, J.L.; Ultsch, G.R. Terrestrial movements of hatchling Wood Turtles (Glyptemys insculpta) in agricultural fields in New Jersey. Chelonian Conserv. Biol. 2008, 7, 113–118. [Google Scholar] [CrossRef]
  12. Paterson, J.E.; Steinberg, B.D.; Litzgus, J.D. Revealing a cryptic life-history stage: Differences in habitat selection and survivorship between hatchlings of two turtle species at risk (Glyptemys insculpta and Emydoidea blandingii). Wildl. Res. 2012, 39, 408–418. [Google Scholar] [CrossRef]
  13. Dragon, J. Habitat Selection, Movement, and Survival of Hatchling Wood Turtles (Glyptemys insculpta) in an Atypical Habitat. Master’s Thesis, George Mason University, Fairfax, VA, USA, 2014. [Google Scholar]
  14. Dragon, J.; Akre, T.; McShea, W.; Kleopfer, J.D. Post Emergence Behavior, Habitat Selection, and Survival of Neonatal Wood Turtles (Glyptemys Insculpta) in an Unusual Landscape; Abstract; Northeast Partners in Amphibian and Reptile Conservation: Branchville, NJ, USA, 2013. [Google Scholar]
  15. Paterson, J.E.; Steinberg, B.D.; Litzgus, J.D. Effects of body size, habitat selection and exposure on hatchling turtle survival. J. Zool. 2014, 294, 278–285. [Google Scholar] [CrossRef]
  16. Bernstein, N.P.; Fendrich, R.H.; McCollum, S.A. Do home range, movement patterns, and habitat use of Ornate Box Turtles (Terrepene ornata ornata) differ among age classes? J. Herpetol. 2023, 57, 1–10. [Google Scholar] [CrossRef]
  17. Macdonald, S.L.; Llewelyn, J.; Moritz, C.; Phillips, B.L. Peripheral isolates as sources of adaptive diversity under climate change. Front. Ecol. Evol. 2017, 5, 88. [Google Scholar] [CrossRef]
  18. Arvisais, M.; Bourgeois, J.-C.; Levesque, E.; Daigle, C.; Masse, D.; Jutras, J. Home range and movements of a wood turtle (Clemmys insculpta) population at the northern limit of its range. Can. J. Zool. 2002, 80, 402–408. [Google Scholar] [CrossRef]
  19. Jones, M.T.; Saumure, R.A.; Willey, L.L.; Roberts, H.P. Chapter 1, Introduction. In Biology and Conservation of the Wood Turtle; Jones, M.T., Willey, L.L., Eds.; Northeast Association of Fish and Wildlife Agencies: Petersburgh, NY, USA, 2021; pp. 1–20. [Google Scholar]
  20. Willey, L.L.; Akre, T.S.B.; Jones, M.T.; Brown, D.J.; Tamplin, J.W. Chapter 6, Spatial ecology and seasonal behavior. In Biology and Conservation of the Wood Turtle; Jones, M.T., Willey, L.L., Eds.; Northeast Association of Fish and Wildlife Agencies: Petersburgh, NY, USA, 2021; pp. 113–136. [Google Scholar]
  21. Row, J.R.; Blouin-Demers, G. Kernels are not accurate estimators of home-range size for herpetofauna. Copeia 2006, 2006, 797–802. [Google Scholar] [CrossRef]
  22. Boyle, S.A.; Lourenço, W.C.; da Silva, L.R.; Smith, A.T. Home range estimates vary with sample size and methods. Folia Primatol. 2009, 80, 33–42. [Google Scholar] [CrossRef]
  23. Boyle, S.A. Chapter 7, Home Range Analysis: Why the Methods Matter. In Spatial Analysis in Field Primatology: Applying GIS at Varying Scales; Dolins, F.L., Shaffer, C.A., Porter, L.M., Hickey, J.R., Nibbelink, N.P., Eds.; Cambridge University Press: Cambridge, UK, 2021; pp. 129–151. [Google Scholar] [CrossRef]
  24. Weaver, R.E.; Suriyamongkol, T.; Shoemaker, S.N.; Gonzales, J.T.; Mali, I. Spatial ecology and movement of Ornate Box Turtles in the escalating drought conditions of the Great Plains ecoregion. Fire 2025, 8, 24. [Google Scholar] [CrossRef]
  25. Hayne, D.W. Calculation of size of home range. J. Mammal. 1949, 30, 1–18. [Google Scholar] [CrossRef]
  26. Powell, R.A. Animal home ranges and territories and home range estimators. In Research Techniques in Animal Ecology: Controversies and Consequences; Boitani, L., Fuller, T.K., Eds.; Columbia University Press: New York, NY, USA, 2000; pp. 65–100. [Google Scholar]
  27. Saumure, R.A. Spatial Ecology and Conservation of the North American Wood Turtle (Glyptemys insculpta) in a Fragmented Agri-Forested Landscape. Ph.D. Dissertation, McGill University, Montreal, QC, Canada, 2004. [Google Scholar]
  28. White, G.C.; Garrott, R.A. Analysis of Wildlife Radiotracking Data; Academic Press: San Diego, CA, USA, 1990; 382p. [Google Scholar]
  29. Silva, I.; Crane, M.; Marshall, B.M.; Strine, C.T. Reptiles on the wrong track? Moving beyond traditional estimators with dynamic Brownian bridge movement models. Mov. Ecol. 2020, 8, 43. [Google Scholar] [CrossRef]
  30. Anderson, D.J. The home range: A new nonparametric estimation technique. Ecology 1982, 63, 103–112. [Google Scholar] [CrossRef]
  31. Ernst, C.H.; Lovich, J.E. Turtles of the United States and Canada; Johns Hopkins University Press: Baltimore, MD, USA, 2009; 840p. [Google Scholar]
  32. Jones, M.T.; Willey, L.L.; Crowley, J.; Akre, T.S.B.; deMaynadier, P.; Yorks, D.T.; Tamplin, J.W.; Zarate, B.; Saumure, R.A.; Badje, A.; et al. Chapter 4, Distribution of the Wood Turtle. In Biology and Conservation of the Wood Turtle; Jones, M.T., Willey, L.L., Eds.; Northeast Association of Fish and Wildlife Agencies: Petersburgh, NY, USA, 2021; pp. 61–80. [Google Scholar]
  33. Jones, M.T.; Willey, L.L.; Mays, J.D.; Akre, T.S.B.; Tamplin, J.W.; Gipe, K.D.; Burne, M.R.; Kleopfer, J.D.; Badje, A. Chapter 5, Habitat. In Biology and Conservation of the Wood Turtle; Jones, M.T., Willey, L.L., Eds.; Northeast Association of Fish and Wildlife Agencies: Petersburgh, NY, USA, 2021; pp. 81–111. [Google Scholar]
  34. Arvisais, M.; Levesque, E.; Bourgeois, J.-C.; Daigle, C.; Masse, D.; Jutras, J. Habitat selection by the wood turtle (Clemmys insculpta) at the northern limit of its range. Can. J. Zool. 2004, 82, 391–398. [Google Scholar] [CrossRef]
  35. Niederberger, A.J.; Seidel, M.E. Ecology and status of a wood turtle (Clemmys insculpta) population in West Virginia. Chelonian Conserv. Biol. 1999, 3, 414–418. [Google Scholar]
  36. Tamplin, J.; Haugen, J.; Anderson, T.; Berg, S.; Burtch, J.; Hayes, A.; Hobbs, G. Water depth selection by Iowa Wood turtles (Glyptemys insculpta) during seasonal activity periods. Northeast. Nat. 2024, 31, G1–G17. [Google Scholar] [CrossRef]
  37. Akre, T.S.B.; Ernst, C.H. Population Dynamics, Habitat Use, and Home Range of the Wood Turtle, Glyptemys (=Clemmys) insculpta, in Virginia; Unpublished Report; Virginia Department of Game and Inland Fisheries: Richmond, VA, USA, 2006; 257p. [Google Scholar]
  38. Parren, S.G. A twenty-five-year study of the Wood Turtle (Glyptemys insculpta) in Vermont: Movements, behavior, injuries, and death. Herpetol. Conserv. Biol. 2013, 8, 176–190. [Google Scholar]
  39. Tamplin, J.W. Upper Midwest Turtle Conservation—Phase 2; Final Report to the US Fish and Wildlife Service for Iowa State Wildlife; Grant No. F21AP01078; State of Iowa, Department of Natural Resources: Des Moines, IA, USA, 2019; 40p. [Google Scholar]
  40. Mitchell, J.C.; Paton, P.W.C.; Raithel, C.J. Chapter 9, The importance of vernal pools to reptiles, birds, and mammals. In Science and Conservation of Vernal Pools in Northeastern North America; Calhoun, A.K., de Maynadier, P., Eds.; CRC Press: Boca Raton, FL, USA, 2008; pp. 169–190. [Google Scholar] [CrossRef]
  41. Hagani, J.S.; Macey, S.K.; Foley, J.D.; Seewagen, C.L. Movement ecology of the imperiled Wood Turtle (Glyptemys insculpta) in a lower Hudson River watershed. Chelonian Conserv. Biol. 2021, 20, 281–289. [Google Scholar] [CrossRef]
  42. McCoard, K.R.P.; Billings, A.A.; Anderson, J.T. Wood turtle home range and habitat use in the Central Appalachians. Chelonian Conserv. Biol. 2016, 15, 173–180. [Google Scholar] [CrossRef]
  43. Roberts, H.P.; Willey, L.L.; Jones, M.T.; Milam, J.; King, D.I. Long-term spatial ecology of three long-lived turtles. Northeast. Nat. 2024, 31, C92–C118. [Google Scholar] [CrossRef]
  44. Thompson, D.G.; Swystun, T.; Cross, J.; Cross, R.L.; Chartrand, D.; Edge, C.B. Fine and coarse-scale movements and habitat use by Wood Turtles (Glyptemys insculpta) based on probabilistic modeling of radio- and GPS-telemetry data. Can. J. Zool. 2018, 96, 1153–1164. [Google Scholar] [CrossRef]
  45. Cagle, F.R. A system of marking turtles for future identification. Copeia 1939, 1939, 170–173. [Google Scholar] [CrossRef]
  46. R Core Team. R: A Language and Environment for Statistical Computing; R Foundation for Statistical Computing: Vienna, Austria, 2024; Available online: https://www.R-project.org/ (accessed on 26 March 2025).
  47. Bates, D.; Maechler, M.; Bolker, B.; Walker, S.; Christensen, R.H.B.; Singmann, H.; Dai, B.; Scheipl, F.; Grothendieck, G.; Green, P.; et al. lme4: Linear Mixed-Efffects Models Using “Eigen” and S4. Version 1.1-37. 2025. Available online: https://cran.r-project.org/web/packages/lme4/index.html (accessed on 15 June 2025).
  48. Calenge, C. The package “adehabitat” for the R software: A tool for the analysis of space and habitat use by animals. Ecol. Model. 2006, 197, 516–519. [Google Scholar] [CrossRef]
  49. Bowers, B.C.; Walkup, D.K.; Hibbitts, T.J.; Crump, P.S.; Ryberg, W.A.; Lawing, A.M.; Lopez, R.R. Should I stay or should I go? Spatial ecology of Western Chicken Turtles (Deirochelys reticularia miaria). Herpetol. Cons. Biol. 2021, 16, 594–611. [Google Scholar]
  50. Ross, D.A.; Brewster, K.N.; Anderson, R.K.; Ratner, N.; Brewster, C.M. Aspects of the ecology of wood turtles, Clemmys insculpta, in Wisconsin. Can. Field Nat. 1991, 105, 363–367. [Google Scholar] [CrossRef]
  51. Jones, M.T.; Willey, L.L. Cross-watershed dispersal and annual movement in adult Wood Turtles (Glyptemys insculpta). Herpetol. Rev. 2020, 51, 208–211. [Google Scholar]
  52. Tuttle, S.E.; Carroll, D.M. Home range and seasonal movements of the Wood Turtle (Glyptemys insculpta) in Southern New Hampshire. Chelonian Conserv. Biol. 2003, 4, 656–663. [Google Scholar]
  53. Brown, D.J.; Nelson, M.D.; Rugg, D.J.; Buech, R.R.; Donner, D.H. Spatial and temporal habitat-use patterns of Wood Turtles at the western edge of their distribution. J. Herpetol. 2016, 50, 347–356. [Google Scholar] [CrossRef]
  54. McCoard, K.R.P.; McCoard, N.S.; Turk, P.J.; Anderson, J.T. Habitat characteristics that influence the occurrence of Wood Turtles at the southern limits of their range in the central Appalachians. J. Herpetol. 2016, 50, 381–387. [Google Scholar] [CrossRef]
  55. Bougie, T.A.; Peery, M.Z.; Lapin, C.N.; Woodford, J.E.; Pauli, J.N. Not all management is equal: A comparison of methods to increase wood turtle population viability. J. Wildl. Manag. 2022, 86, e22234. [Google Scholar] [CrossRef]
  56. McKnight, D.T.; Bower, D.S.; Ariel, E.; Beatty, S.; Clulow, S.; Connell, M.; Deppe, A.R.; Doody, S.; Freeman, A.; Georges, A.; et al. Does a lack of juveniles indicate a threat? Understanding body size distributions in a group of long-lived vertebrates. J. Anim. Ecol. 2025, 94, 1962–1982. [Google Scholar] [CrossRef] [PubMed]
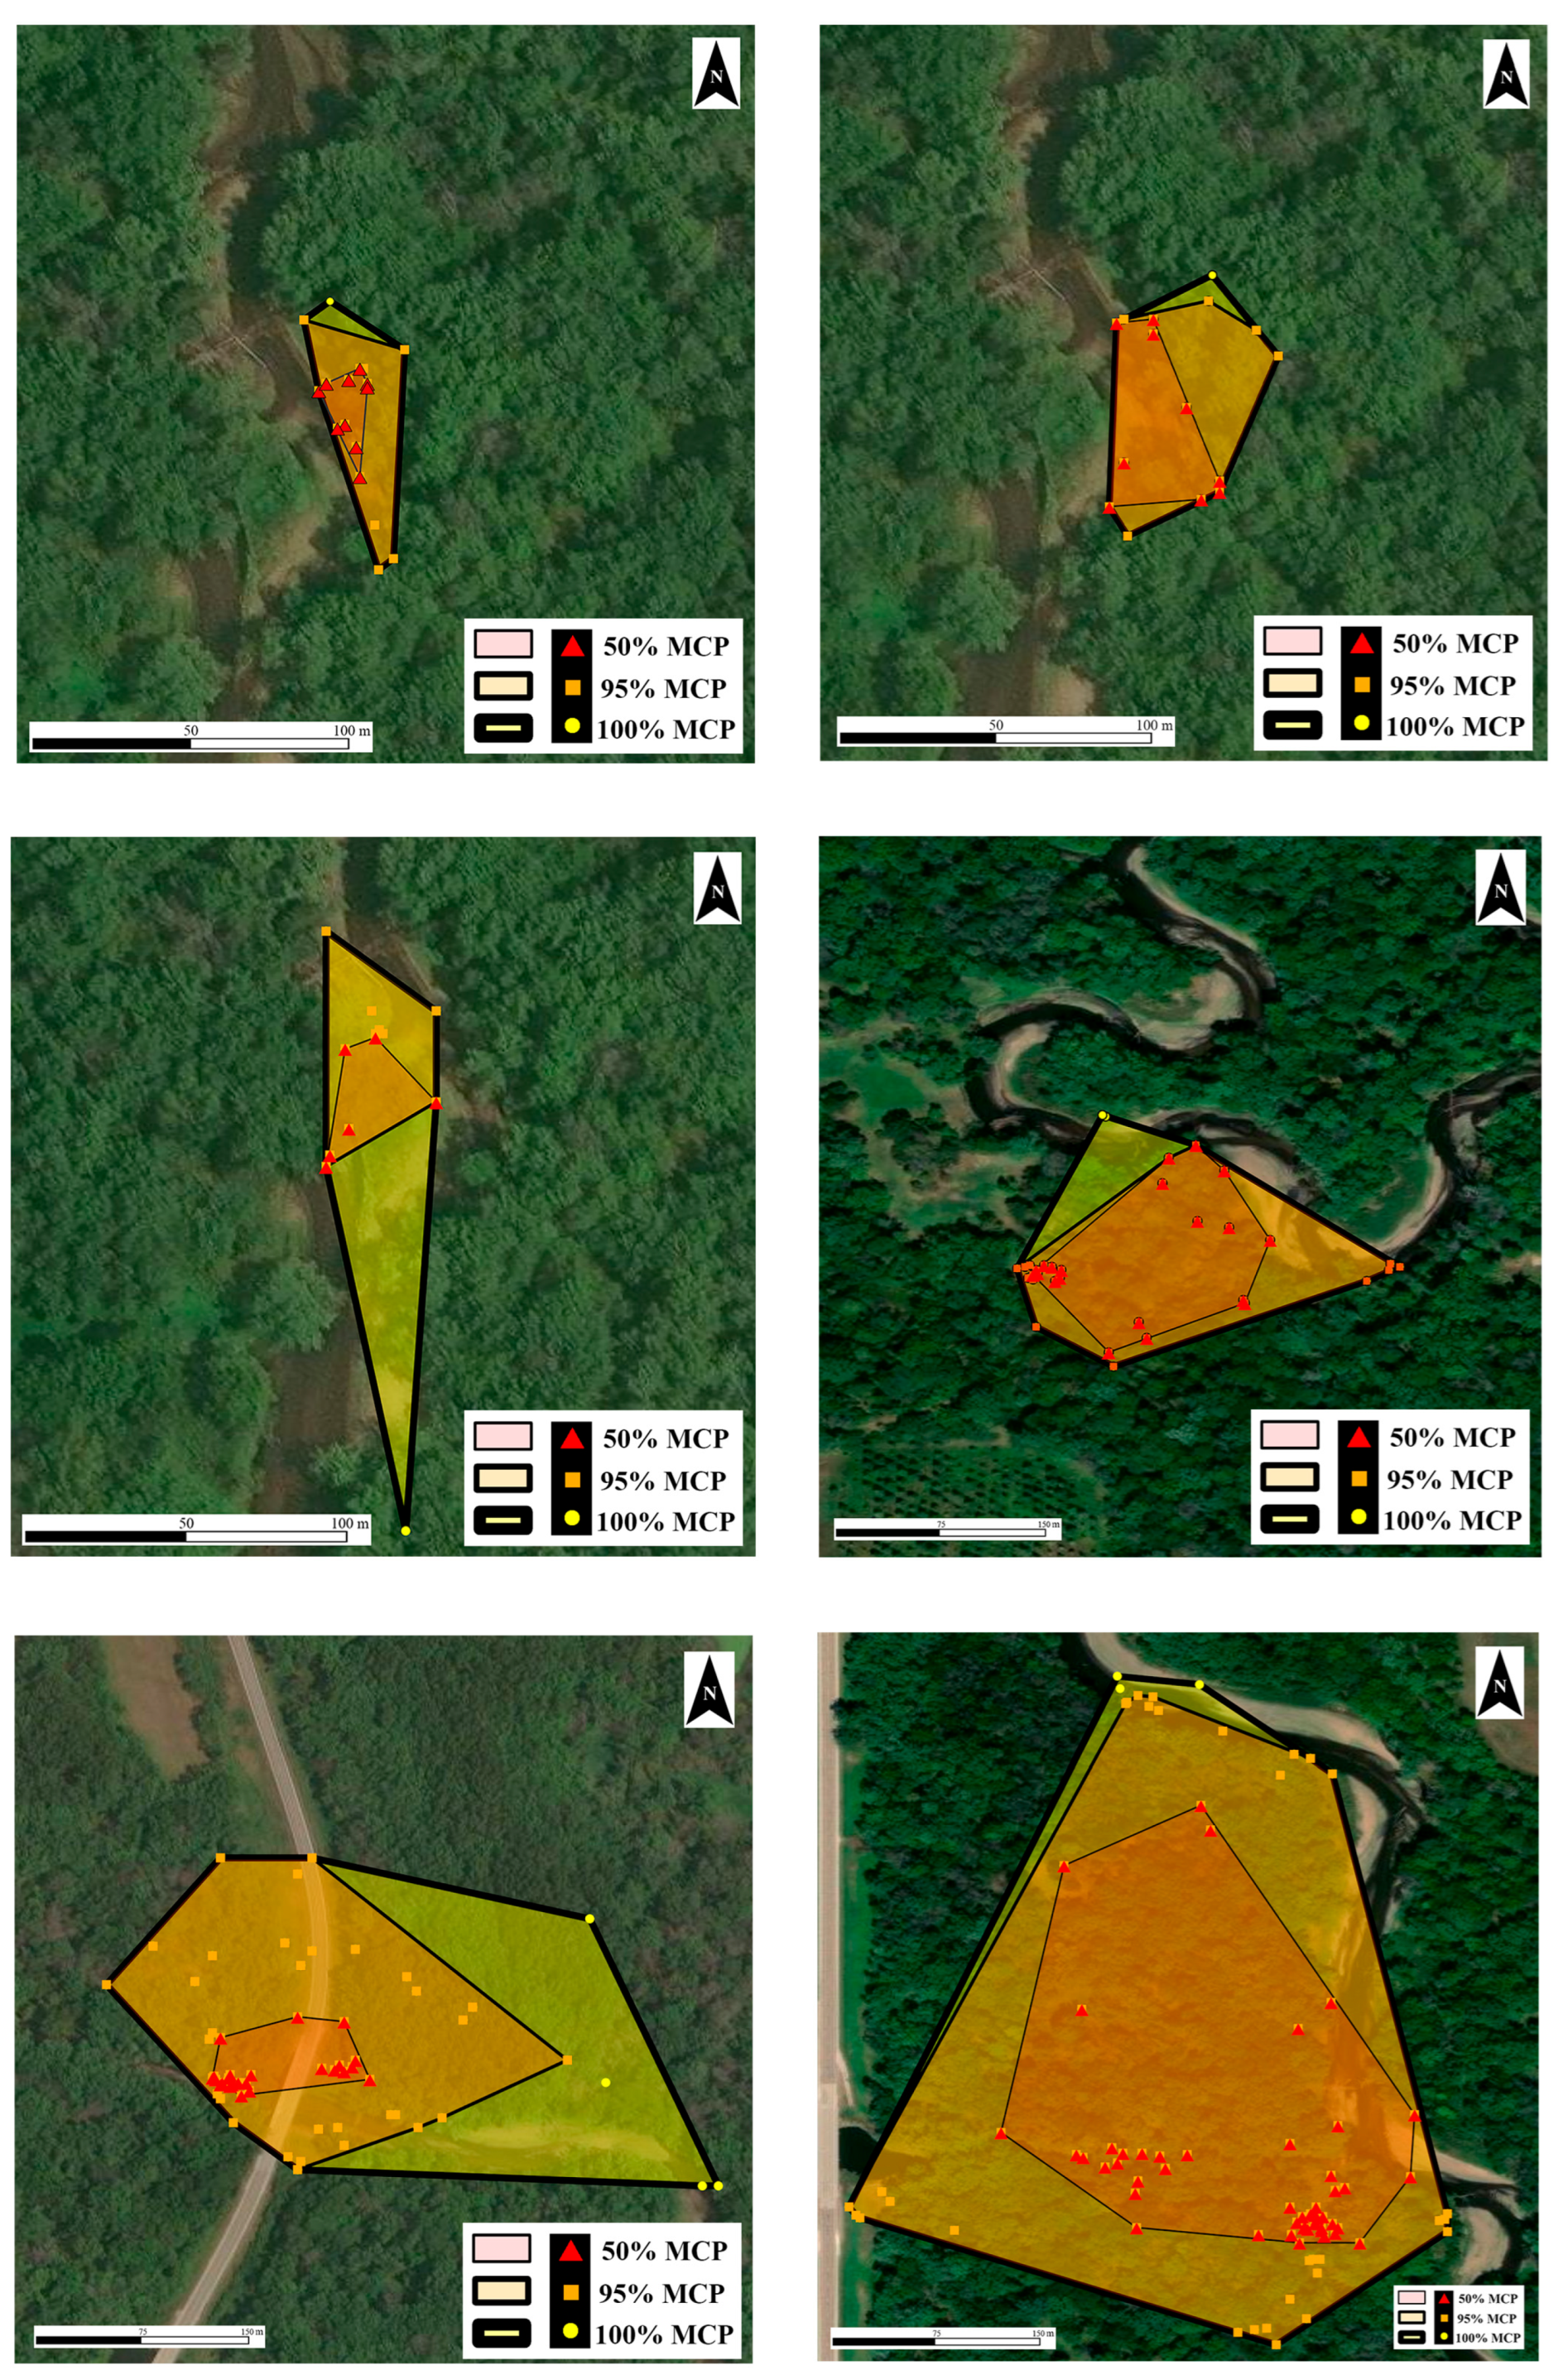
Figure 1. Representative example of home ranges (50% minimum convex polygon [MCP], 95% MCP, 100% MCP) for hatchling and juvenile wood turtles (Glyptemys insculpta). (a) Small home range size of a hatchling; (b) moderate home range size of a hatchling; (c) large home range size of a hatchling; (d) small home range size of a juvenile; (e) moderate home range size of a juvenile; (f) large home range of a juvenile. Individual turtle location points are indicated by symbols corresponding to each MCP metric (triangle = 50% MCP, square = 95% MCP, circle = 100% MCP).
Diversity 17 00733 g001
Figure 2. Percentages of aquatic and terrestrial habitat usage of 13 Iowa wood turtles (Glyptemys insculpta) during the active periods of 2014–2024. Aquatic habitats were two 20–30 m wide streams or ephemeral pools (blue), terrestrial habitats were categorized as riverbank (orange), inland grass and forb clearing (green), and deciduous forest (brown). Total observations = 438.
Diversity 17 00733 g002
Figure 3. (a) Percentages of aquatic and terrestrial locations of six hatchling wood turtles (Glyptemys insculpta) during the postnesting and prebrumation periods of 2015; total observations = 131. (b) Percentages of aquatic and terrestrial habitat usage of seven juvenile hatchling wood turtles (Glyptemys insculpta) during the entire active periods of 2014–2024; total observations = 307. (c) Percentages of aquatic and terrestrial locations of seven juvenile hatchling wood turtles (Glyptemys insculpta) during the postnesting and prebrumation periods of 2014–2024; total observations = 167.
Diversity 17 00733 g003
Figure 4. Percentages (y-axis) and individual observations (column numbers) of aquatic and terrestrial habitat usage of 13 Iowa wood turtles (Glyptemys insculpta) during the active periods of 2014–2024. Seasonal activity periods were Prenesting (spring), Nesting (early summer), Postnesting (summer), and Prebrumation (fall). Aquatic habitats were two 20–30 m wide streams (blue). Terrestrial habitats were categorized as riverbank (orange), inland grass and forb clearing (green), and deciduous forest (brown) based on proximity to the stream, percentages of canopy cover and ground cover, and type and amount of dominant vegetation. Total observations = 438.
Diversity 17 00733 g004
Figure 5. Mean (+ standard error) distance from water of six hatchling and seven juvenile wood turtles (Glyptemys insculpta) from Iowa during the active periods of 2014–2024. Data are presented as all observations (including aquatic locations; n = 438) and terrestrial observations only (aquatic locations omitted; n = 233). To facilitate comparison with hatchlings, data for juveniles during the postnesting and prehibernation periods only are also presented (total observations = 203; terrestrial only observations = 104). Aquatic habitat was represented by 20–30 m wide small streams or ephemeral pools deep enough for the turtles to fully submerge.
Diversity 17 00733 g005
Figure 6. (a) Hatchling wood turtles (Glyptemys insculpta) with radio transmitters released at the nest site on 17 September 2015; (b) only one of eight hatchlings immediately entered the stream after release. Photos by Sam Berg.
Diversity 17 00733 g006
Figure 7. Hatchling wood turtles (Glyptemys insculpta) from Iowa utilizing terrestrial habitats one week after release on 24 September 2015. (a) Hatchling partially buried on open sand near the nest site, 13.0 m from the stream; (b) hatchling partially buried under woody debris in a deciduous forest area, 29.0 m from the stream; (c) hatchling using a grass and forb clearing 16.0 m from the stream. Photos by Joshua Otten.
Diversity 17 00733 g007
Figure 8. Juvenile wood turtles (Glyptemys insculpta) from Iowa utilizing terrestrial habitats. (a) A 12-yr-old juvenile basking next to vegetative cover on a sandy streambank 13.0 m from the stream edge in June 2016; (b) 11-yr-old juvenile using an upland mixed grass and forb clearing near the edge of a forested area, 90.0 m from the stream during July 2025. Photos by Jeff Tamplin.
Diversity 17 00733 g008
Table 1. Summary statistics of home range size of six hatchling and seven older juvenile wood turtles (Glyptemys insculpta) from Iowa during 2014–2024. Data include mean (±standard deviation [SD] and standard error [SE]), and minimum (min) and maximum (max) values of 100% minimum convex polygon (MCP), 95% MCP, 50% MCP, 95% and 50% kernel density estimators (KDE), linear home range (LHR) and stream home range (SHR). For a more meaningful comparison to the hatchling data, juvenile data is presented separately for the first 22 locations only (MCPs, KDEs, LHR), or the first 12 locations only (SHR), as well as for all locations.
Age Class 100% MCP
(ha)
95% MCP
(ha)
50% MCP
(ha)
95% KDE
(ha)
50% KDE
(ha)
LHR
(m)
SHR
(m)
n
Locations
n
Weeks
Mean0.180.160.060.920.22100.6239.3821.836.00
HatchlingsSD0.050.060.040.410.0838.9617.340.410.00
(n = 6)SE0.020.020.020.170.0315.917.080.170.00
All Obs.Min0.100.080.010.480.1375.8015.0021.006.00
Max0.260.260.101.600.32176.0068.8022.006.00
Mean3.962.610.8214.063.41440.00445.8622.0022.00
JuvenilesSD2.162.590.8710.783.03125.44189.520.000.00
(n = 7)SE0.820.980.334.071.1547.4171.630.000.00
ReducedMin1.410.450.064.261.12247.00285.0022 (12)22 (12)
Obs.Max8.248.212.4736.439.91630.00828.0022 (12)22 (12)
Mean5.764.441.1613.172.87459.57487.2947.0046.43
JuvenilesSD3.193.500.998.121.79129.96175.9723.9024.25
(n = 7)SE1.211.320.373.070.6849.1266.519.039.17
All Obs.Min2.440.450.166.371.12247.00294.0022.0022.00
Max11.9811.533.1024.995.73630.00853.0088.0088.00
Table 2. Home range size (ha) comparison by age of six hatchling and seven older juvenile wood turtles (Glyptemys insculpta) from Iowa during 2014–2024. Data include mean (±standard deviation [SD]) of 100% minimum convex polygon (MCP), 95% MCP, 50% MCP, and 95% and 50% kernel density estimators (KDE). For a more meaningful comparison to the hatchling data, juvenile data is presented separately for the first 22 locations only, as well as all locations. The t-value (t), degrees of freedom (df) and probability values (p-value) are also presented. All comparisons were highly significantly different.
Hatchlings
(n = 6)
Juveniles
(n = 7)
All locations (ha ± SD)22 locations only (ha ± SD)tdfp-value
100% MCP0.1764 ± 0.05423.9568 ± 2.1583−11.9611<0.0001
95% MCP0.1620 ± 0.05782.6010 ± 2.5863−6.41110.0001
50% MCP0.0575 ± 0.03990.8221 ± 0.8687−3.68110.0036
95% KDE0.9150 ± 0.405214.0557 ± 10.7822−7.9211<0.0001
50% KDE0.2224 ± 0.08193.4144 ± 3.0306−7.5011<0.0001
All locations (ha ± SD)All locations (ha ± SD)tdfp-value
100% MCP0.1764 ± 0.05425.7616 ± 3.1944−13.3911<0.0001
95% MCP0.1620 ± 0.05784.4445 ± 3.5025−6.9111<0.0001
50% MCP0.0575 ± 0.03991.1612 ± 0.9869−5.30110.0003
95% KDE0.9150 ± 0.405213.1651 ± 8.1184−8.9711<0.0001
50% KDE0.2224 ± 0.08192.8690 ± 1.7861−8.4311<0.0001
Disclaimer/Publisher’s Note: The statements, opinions and data contained in all publications are solely those of the individual author(s) and contributor(s) and not of MDPI and/or the editor(s). MDPI and/or the editor(s) disclaim responsibility for any injury to people or property resulting from any ideas, methods, instructions or products referred to in the content.