Abstract
Coral reef ecosystems are biodiversity hotspots that provide essential ecological and environmental services but are increasingly threatened by anthropogenic pressure and climate change. Effective conservation of reef systems within Marine Protected Areas (MPAs) can be enhanced using spatially explicit approaches that integrate habitat mapping and ecological metrics at seascape scales. In this study, we characterized the benthic seascape of Cayo Arenas and identified optimal priority conservation zones in one of the core zones of the recently established Southern Gulf of Mexico Reefs National Park (SGMRNP). In July 2023, ground-truthing was performed to quantify the cover of sand, calcareous matrix, macroalgae, hard corals and octocorals. Cluster analysis of quantitative data and ecological similarity between classes was used to identify the main benthic habitat classes. Object-based and supervised classification algorithms on a PlanetScope image were used to construct a thematic map of the benthic reef system. Based on the thematic map, habitat connectivity, β-diversity, patch compactness, and availability for commercial species were estimated. In addition, a benthic change analysis (2017–2013), based on the spectral characteristics of PlanetScope images, was performed. The layers obtained were then used to perform an iterative weighted overlay analysis (WOA) using 126 combinations. Six main habitat classes, with different coverages of hard corals, calcareous matrix, macroalgae, and sand, were identified. Habitats with calcareous matrix and sandy substrates dominated the seascape. High habitat compactness, connectivity, and β-diversity values were observed, suggesting habitat stability and ecologically dynamic areas. Based on the WOA, eight optimal priority areas for conservation were recognized. These areas are characterized by heterogeneous habitats, moderate coral cover, and high connectivity. We provide a spatially explicit approach that can strengthen conservation planning within the SGMRNP and other MPAs, particularly by assisting zonation and sub-zonation processes.
1. Introduction
Coral reefs are ecosystems that maintain a high biodiversity and provide critical environmental services to coastal communities, including food, coastal protection and serve as a source for their livelihoods [1,2,3,4]. However, these ecosystems are facing a decline due to anthropogenic effects and climate change, with the loss of coral and associated species diversity and abundance [5,6,7].
One tool that has proven useful for the management and conservation of reef systems is the establishment of MPAs. For example, protected areas can reduce the loss of β-diversity and other seascape-scale metrics [8,9], enhance connectivity between habitats, facilitating ecological processes across seascapes [10,11,12], and help mitigate habitat fragmentation by preserving critical patches and corridors, acting as refugia that increase the resilience of reef systems [12,13,14]. Effective conservation in protected areas also requires the integration of social factors that influence ecosystems [15]. This consideration is one of the primary reasons for the implementation of core and buffer zones, as well as biological corridors, which serve to delimit biological, physical, and socioeconomic elements.
The increase in international agreements has encouraged the establishment of large-scale marine protected areas [16], where in many cases, governance factors rather than scientific evidence have been the main drivers for their establishment [17]. Furthermore, a recurring problem in MPAs’ implementation is the lack of long-term sustainable financing [18]. In Mexico, MPAs have been established mainly through opportunistic initiatives rather than through a structured (systematic) approach that can be replicated and evaluated, and government institutions responsible for coastal and marine issues are fragmented [19]. In addition, MPAs establishment and funding have not kept pace [20], which can result in insufficient monitoring of ecosystems [21] and unregulated anthropogenic impacts, such as overfishing and pollution [22].
To establish protected areas, it is essential to delimit zones that regulate different activities to achieve biodiversity and sustainable development objectives [23]. Although still limited in marine ecosystems [20], the use of spatially explicit tools plays an important role in the planning of sites suitable for the protection of the marine environment [24], as it allows a systematic (sensu orderly methodological process) approach that integrates different habitat types and seascape metrics for the identification of conservation sites [9,25,26,27].
Different approaches exist for identifying priority areas for conservation which consider key principles for spatial prioritization [28], such as representativeness, connectivity, persistence of ecological processes and areas with minimal impact on human activities. One of the most widely used is the systematic conservation planning framework, which maximizes the representation of multiple variables to identify complementary areas considering costs, connectivity, and representativeness for optimal solutions based on defined conservation targets [29,30]. In contrast, scoring methodologies, such as weighted overlay analysis, integrate multiple criteria into an index, assigning predefined weights based on ecological importance or the relative influence of metrics derived from statistical models, producing thematic layers to develop a comprehensive decision-making model [25,26,27,31,32,33].
Seascape metrics have been used to describe the structure and spatial complexity of coastal and marine environments. These include patch size, shape, and distance to the nearest patch [34]. These metrics help characterize the spatial configuration of habitat mosaics and are essential for understanding the pattern–process relationships within marine ecosystems. Patch size is a fundamental metric that influences habitat availability, species richness, and ecosystem function, as larger patches can support more individuals [34,35,36]. The distance to the nearest patch is a key connectivity indicator that reflects how easily organisms can move across the seascape, which is essential for dispersal, gene flow, and ecological resilience [35,36,37,38]. The patch shape or compactness is a metric that evaluates how closely the shape of a patch resembles a circle or a square. Compact patches minimize edge effects, enhance habitat quality, and are easier to manage [34,36,39]. These metrics have also been used to establish a framework for monitoring long-term habitat conditions [40]. Habitat β-diversity implies environmental gradients that control ecosystem function and sustain biodiversity [9,41]. Benthic spatial change analysis helps to identify areas that remain stable over time and those that show significant variation in habitat cover [25]. In reef systems, short-term changes may arise from natural processes such as bleaching, sedimentation, or the accumulation of macroalgae [42,43,44,45], highlighting the need for monitoring adapted to ecosystem dynamics and conservation goals. Such analyses are key for identifying vulnerable areas and improving the delineation of conservation zones [46]. Although there is no universally accepted monitoring intervals at seascape scales, various programs, such as NOAA’s CoastWatch Change Analysis Program (C-CAP), recommend assessing cover changes every five years as a general standard [47]. This interval may vary depending on local dynamics or the objectives of the study.
Combining seascape metrics with other spatial data, such as habitat maps, benthic spatial change analysis, and human use patterns, provides a spatially explicit framework that can assist in the conservation of marine ecosystems, including the design of MPAs, their zonation, sub-zonation and the identification of adequate areas for restoration projects [25,48,49]. The establishment of MPAs often involves complex negotiations between multiple stakeholders [50]. In some cases, MPAs have been chosen due to their proximity to tourist destinations or for the maintenance of fish stocks [51]. However, recent strategies emphasize the need to maximize conservation objectives while addressing the concerns of different stakeholders, including fishing activities and the provision of ecosystem goods and services [50,51]. This integrated perspective underscores the importance of balancing ecological processes and human needs in the spatial prioritization for coral reef conservation.
In Mexico, recent marine ecosystem conservation efforts have focused on establishing large-scale (>13,000 km2) marine protected areas, particularly in oceanic and remote regions. This is the case for two new protected areas in the southern Gulf of Mexico, which have increased the total protected area by over 44,400 km2 in the last two years. Managing such extensive areas poses significant challenges, including limited surveillance, funding constraints, and the need for continuous stakeholder engagement. In this context, our study aims to (1) generate a high-resolution benthic habitat map of the Cayo Arenas reef system, recently incorporated into the new Southern Gulf of Mexico Reefs National Park (SGMRNP), and (2) identify priority areas for conservation by integrating seascape metrics, habitat change, and habitat importance for fisheries. This spatially explicit framework provides a practical tool to support informed decision-making that can assist the sub-zonation within the MPA. To achieve these objectives, we characterized benthic habitats, quantified seascape metrics and habitat patterns, and integrated the information using an iterative analysis to identify areas with high conservation value. By linking habitat mapping with spatially explicit ecological metrics, this study provides a practical framework to guide sub-zonation within the MPA and support evidence-based conservation planning.
2. Materials and Methods
2.1. Study Area
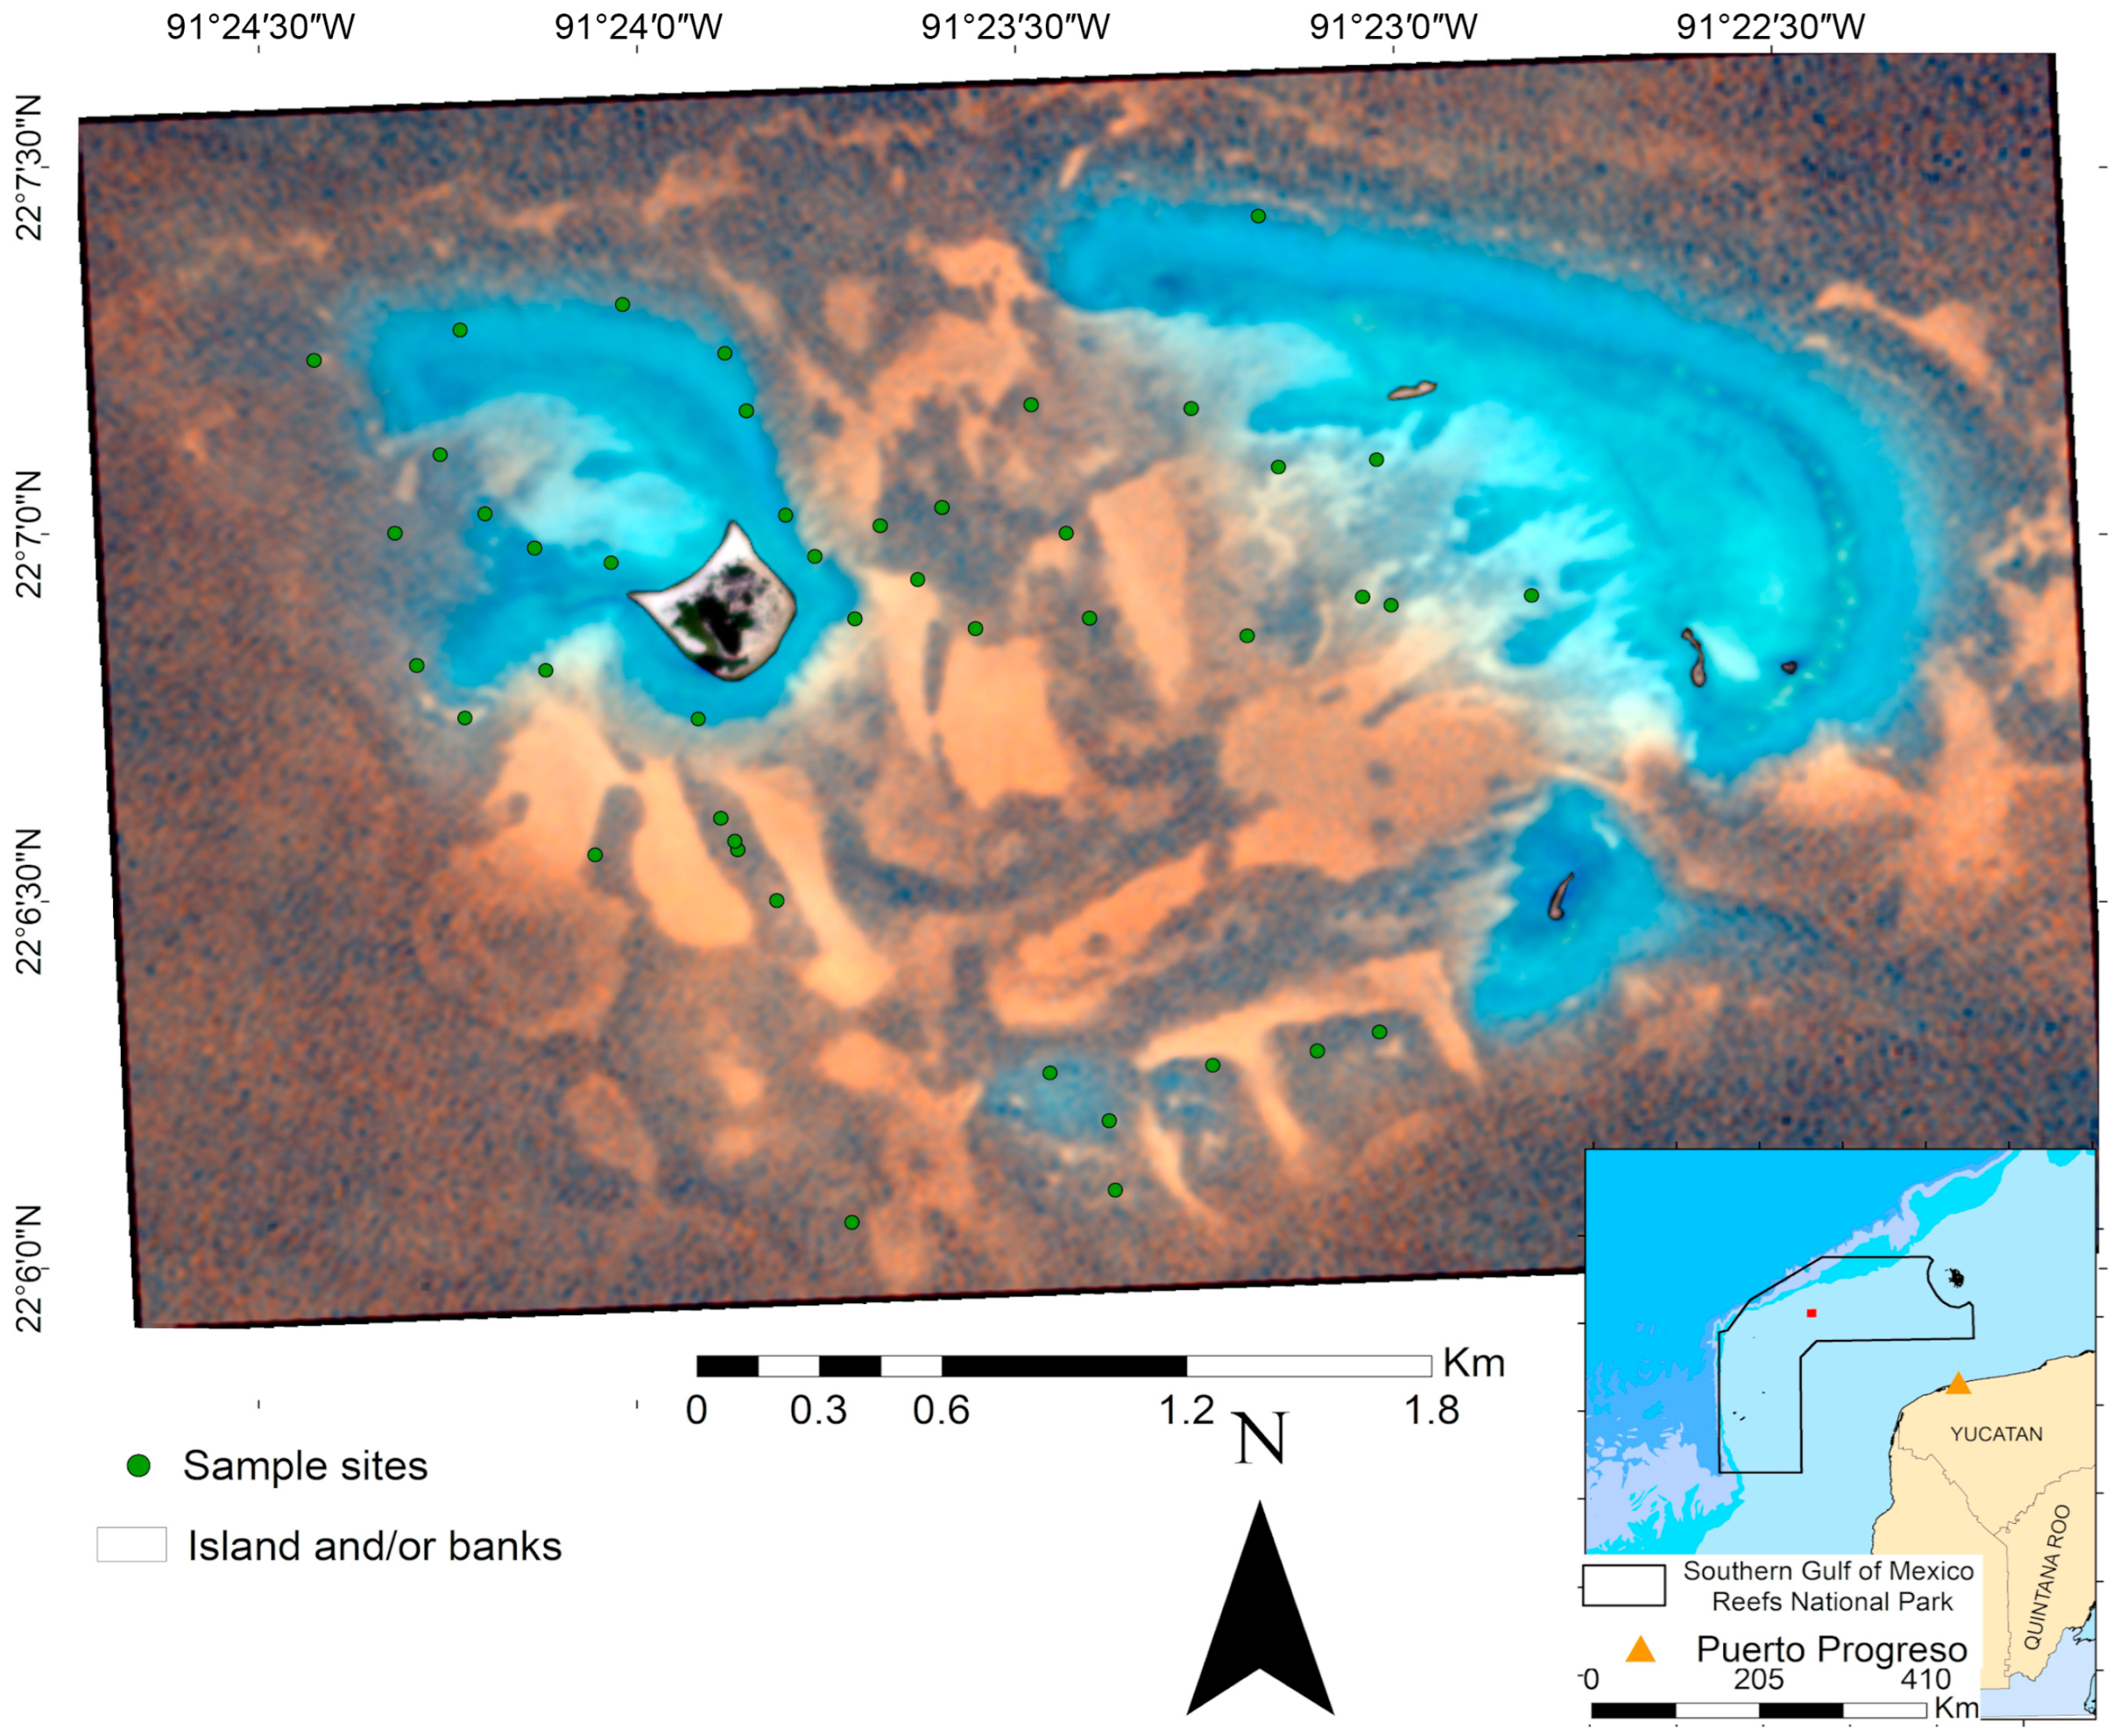
The Campeche Bank is an extensive shelf on the Yucatan Peninsula, where most reefs are located between 80 and 130 km offshore, ranging in size from 3 km2 to 20 km2 [52]. Cayo Arenas, located c.a. 200 km from Puerto Progreso in the Gulf of Mexico (Figure 1), consists of an island and two main fringing structures with a crescent shape, separated by a semi-enclosed channel with a maximum depth of c.a. 30 m [52,53,54].
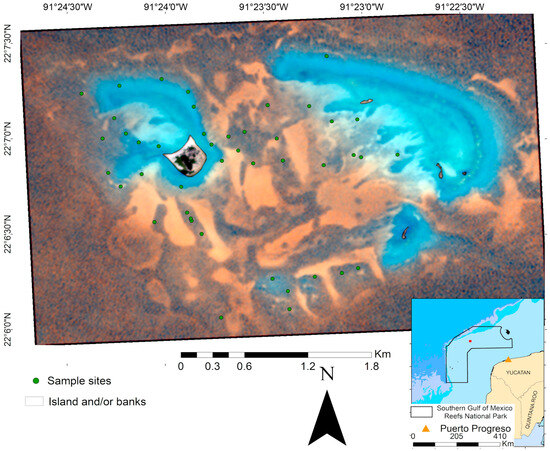
Figure 1.
Location of the Cayo Arenas reef system. PlanetScope multispectral image (R, G, B) of the Cayo Arenas reef system (13.79 km2). The inset shows its location within the Campeche-Yucatan coast, and the delimiting polygon of the newly established Southern Gulf of Mexico Reefs National Park.
Recently, Cayo Arenas was incorporated as one of the core zones of the Southern Gulf of Mexico Reefs National Park, decreed on 27 September 2024 [55], which covers an area of approximately 41,100 km2 and incorporates other reef systems of the Campeche Bank. According to the decree, the polygon of the protected area is subdivided in four core zones: Cayo Arenas (191.84 km2), Cayo Nuevo–Bajos Ingleses (334 km2), Cayo Triángulos (330 km2), and Bajo Obispos (314 km2), surrounded by a large buffer area (39,928 km2). Shallow areas are dominated by well-developed massive coral formations, particularly Orbicella spp. and Colpophyllia natans, which provide complex structures. In more protected zones, coral patches tend to be smaller, more discontinuous, and interspersed with sandy areas. Within the lagoon zone, the benthic cover is mostly composed of sand with sparse and isolated coral patches [56]. In addition to its ecological importance, Cayo Arenas is also an area of interest for fishing activities because of the presence of species with high commercial value, such as groupers [57].
2.2. Image Pre-Processing
A multispectral image (R, G, B, NIR) from the PlanetScope constellation (August 2023) was used to construct a benthic habitat thematic map. Atmospheric correction [58], solar reflection attenuation [59], and water column correction [60,61] were applied prior to analysis. In addition, a 7 × 7 low-pass filter was used for contrast enhancement and noise removal [62]. A multispectral (R, G, B) PlanetScope image (August 2017) was used to perform the benthic spatial change analysis (described in Section 2.4). This image was co-registered to the August 2023 image, and an atmospheric correction was applied [58]. The area of interest (AOI) considered all marine habitats with depths of less than 25 m to obtain reliable information [60]. The bathymetry of the AOI was obtained using the Stumpf log-ratio algorithm [63]. The log-ratio was calculated using the Green (λGreen) and Blue (λBlue) bands for each pixel. Forty-five in situ depth measurements and 35 points with valid spectral signatures (free of cloud or sun glint artifacts), were used as the training dataset (Supplementary Materials, Table S1). The island and emerged areas were masked and removed from the analysis.
2.3. Habitat Characterization and Benthic Habitat Thematic Map Conservation
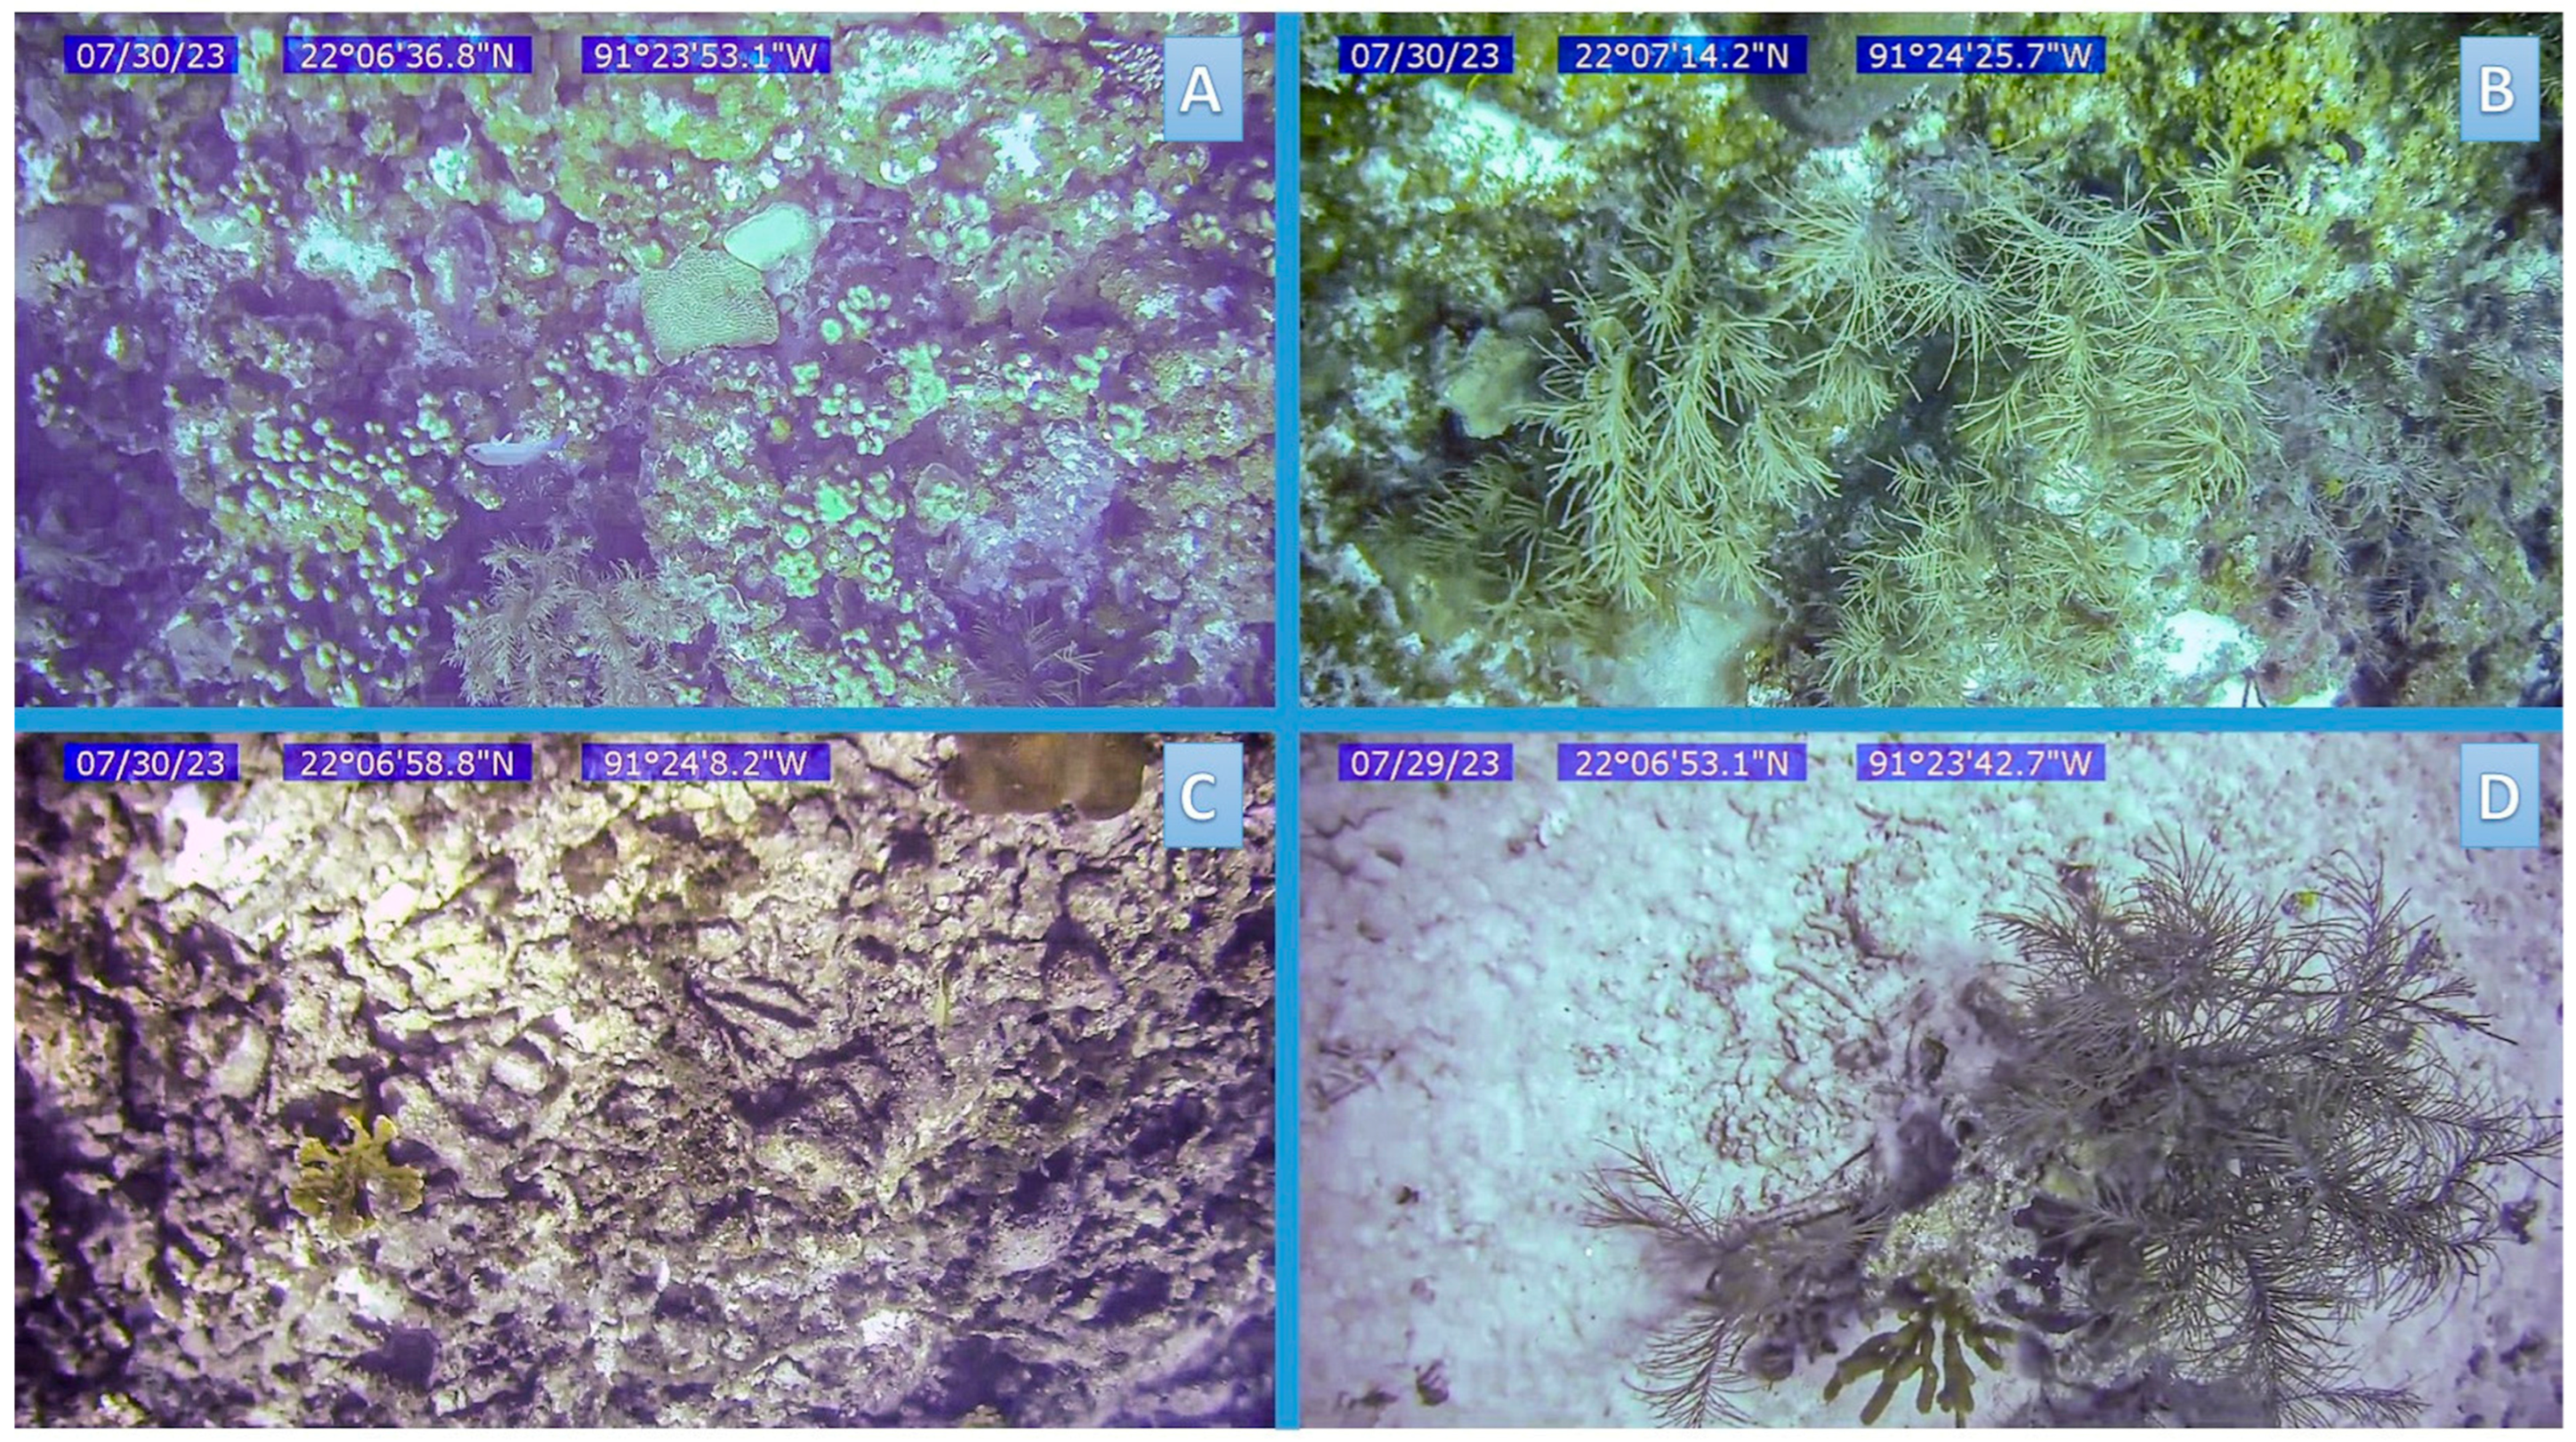
An unsupervised classification of the PlanetScope image (August 2023) was used to identify the initial clusters across the study area [64]. From these, 44 sites were selected through stratified sampling and subsequently visited in the field for data collection. At each site, a Seaviewer 6000 camera (Seaviewer Cameras Inc., Tampa, FL, USA) with a Garmin 60CSxGPS (Garmin, Ltd., Olathe, KS, USA) was deployed to obtain c.a. 15 s videos. Depth was measured using a digital depth sounder (Hondex, Speedtech Instruments, Sterling, VA, USA, Canada model no. 14903). Six frames were selected from each video: two at the beginning, two in the middle, and two at the end [25], to estimate the mean percent cover of benthic substrates, including hard corals, calcareous matrix, macroalgae, octocorals, and sand (Figure 2). In Caribbean reef systems, the analysis of three frames for per video were deemed representative of the substrates observed [25]. The frames were analyzed using GIMP v.2.1012 and ImageJ v.1.54d. The substrate cover and depth data from each site were grouped using a hierarchical analysis with the Bray–Curtis similarity index [65] to identify the main habitat classes. With the sampling sites grouped by habitat type, approximately 80% (35 sites) were randomly selected to assign representative pixels for each habitat class and segment the image using an object-based classification (OBC) algorithm. In this analysis, 35 polygons representing sandy beds at different depths identified from the visual interpretation of the satellite image, the bathymetry map, and local knowledge of the area, were also included (Supplementary Materials, Table S2). The obtained polygons from the OBC were then used as training sites to perform a supervised classification on the multispectral image using the Maximum Likelihood algorithm to produce a thematic map of the benthic reef seascape of Cayo Arenas. The classification accuracy was independently evaluated (with 16 sites not used for the classification) using an error matrix [66], obtaining an overall accuracy of 87.5% and a kappa coefficient of 0.8601 (Supplementary Materials, Table S3).
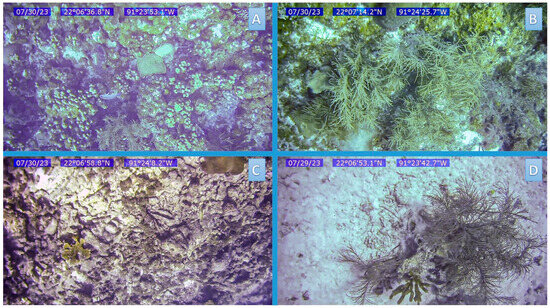
Figure 2.
Examples of frames corresponding to videos obtained from sampling sites showing different habitat types. (A) Hard coral coverage with other components, (B) Calcareous matrix with other components, (C) Calcareous matrix with minimal presence of other components, and (D) Sandy habitat at different depths.
Image preprocessing, classification, and accuracy assessment were performed using ERDAS Imagine v.2020.
2.4. Seascape Metrics and Spatial Change
Using the thematic map as a basis, layers of habitat β-diversity, patch compactness, connectivity, and habitat availability for commercial species were generated. The following equations were used to measure the patch compactness and connectivity. Patch compactness was measured using the patch shape index, which describes the relationship between the perimeter and area (Formula (1)), where values close to one indicate compact, simple geometries, and higher values reflect more irregular and fragmented shapes. Patch connectivity was assessed using the Euclidean nearest-neighbor distance (ENN) to the closest patch of the same class (Formula (2)), with shorter distances indicating greater connectivity and higher accessibility for species that move between habitat patches, whereas longer distances suggest greater isolation, potentially limiting movement for species that rely on path-to-patch connectivity. Patch compactness and connectivity were computed using Fragstats 4.3 [67], with a minimum mapping unit of 4.5 m2. Calculations at edges of the layer followed standard Fragstats 4.3. edge rules.
- pij: perimeter (m) of patch j from the class i.
- aij: area (m2) of the patch j.
- hij: distance (m) from patch ij to the nearest patch belonging to the same class.
- SHAPE: Patch shape
- ENN: Euclidean nearest neighbor.
Dissimilarity coefficients using the Bray–Curtis index (Supplementary Materials, Table S4) between each class were used to calculate β-diversity values (Formula (3)).
- Bd: β-diversity.
- H: number of habitats within the sample area (window).
- Dij: Dissimilarity coefficient between habitat i and habitat j.
- Pi: Proportion of window compromised of habitat i.
β-diversity measures the degree of species or habitat turnover across space and, in this context, reflects the variation in habitat composition between adjacent areas. Once the dissimilarity matrix was obtained, β-diversity values were estimated for each pixel in an area of 0.1 km2, equivalent to a 105 × 105 pixel window [41,68]. In previous studies, an area of 0.2 km2 was considered more appropriate [8,68]. However, because Cayo Arenas is a relatively small area (c.a. 10 km2), a smaller window size was chosen to better represent the variation between habitats. β-diversity was estimated using scripts (https://doi.org/10.6084/m9.figshare.30174889.v2) written in MATLAB (R2024a).
The layer of habitat availability for species of commercial interest was estimated by considering the habitat preferences of the Serranidae family (genera Epinephelus and Mycteroperca), which were selected based on their economic relevance and distribution in the study area. Habitat preferences were established based on a literature review that included official fishery management plans and ecological assessments from the Yucatán Peninsula, particularly in the Campeche Bank region [69,70,71,72,73,74]. These sources indicate that, for Epinephelus morio, juveniles are typically found in shallow coral habitats (10–30 m), sub-adults in intermediate-depth reefs, and adults in deeper sandy bottoms. Although habitat availability may vary among species within the Serranidae family, most species tend to be associated with reef environments that offer greater structural complexity [75,76,77]. To spatialize the data, the thematic map was divided into regular 0.01 km2 windows using the Fishnet tool in ArcMap v10.8.2. For each window of analysis, the percentage of the most favorable habitats were calculated considering the substratum type and depth at which the species showed preference, according to the review described above. Each window was then classified into five categories, where one represented the lowest proportion of favorable habitats and five represented the highest (Table 1).

Table 1.
Reclassification scores were assigned to each input layer used in the weighted overlay analysis. The original values for each seascape metric and thematic map layer were reclassified on a scale of one (lowest conservation priority) to five (highest) based on their ecological relevance. For habitat availability, scores correspond to the percentage of coverage of habitats with coverage of hard corals and associated mixed substrates on 0.01 km2 windows of analysis as follows: 1 (0–20%), 2 (20.01–40%), 3 (40.01–60%), 4 (60.01–80%) and 5 (80.01–100%).
Finally, the layer of spatial change in the reef benthic seascape between 2017 and 2023 was constructed by comparing the spectral values of the pixels between recent and historical images using the DeltaCue tool in ERDAS Imagine v.2020. The analysis was based on pixel-by-pixel spectral differences between the two images. Values close to zero indicate stability, whereas positive or negative values reflect a gain or loss in reflectance, respectively, which can be interpreted as a change in the substrate. Significant changes were identified by fitting a Gaussian distribution to the pixel difference values and selecting the threshold corresponding to p < 0.05, discarding pixels with minimal variation or noise [78].
2.5. Selection of Priority Conservation Areas
The optimal priority sites for conservation were identified using an iterative WOA [79], integrating six generated layers: thematic map of the benthic seascape, patch compactness, connectivity, β-diversity, habitat availability for commercial species, and spatial change. First, the layers were reclassified to a common scale from one to five, where one represented the least favorable characteristics and five represented the most favorable (Table 1). The values from the layers were distributed in categories using natural breaks for habitat patch compactness and β-diversity, quantiles for habitat connectivity, and ecological criteria for the thematic map. Higher β-diversity, connectivity, habitat availability and lower compactness were given the higher scores as they relate to characteristics that help maintain biodiversity. For the benthic spatial change layer, stable areas (with no significant change, p > 0.05) were given the highest score (5) as they represent resilient habitats. Lower values were assigned to areas with substrate coverage loss. Because weight assignment in weighted overlay analyses is typically arbitrary, we implemented an iterative approach. Scripts written in MATLAB (R2024a) (https://doi.org/10.6084/m9.figshare.30174889.v2) were used to generate all possible (126) different weight combinations in 10% increments using the six layers (totaling 100% of weight assignment on each iteration). This produced a distribution of possible prioritization outcomes, from which a final optimal map was calculated based on the mean values per pixel considering all the 126 maps obtained. In addition, a standard error map was computed to assess the uncertainty of the optimal map. Finally, priority conservation patches were delineated using the Hot Spot Analysis tool in ArcMap v.10.8.2.
3. Results
3.1. Benthic Habitat Thematic Map and Seascape Metrics
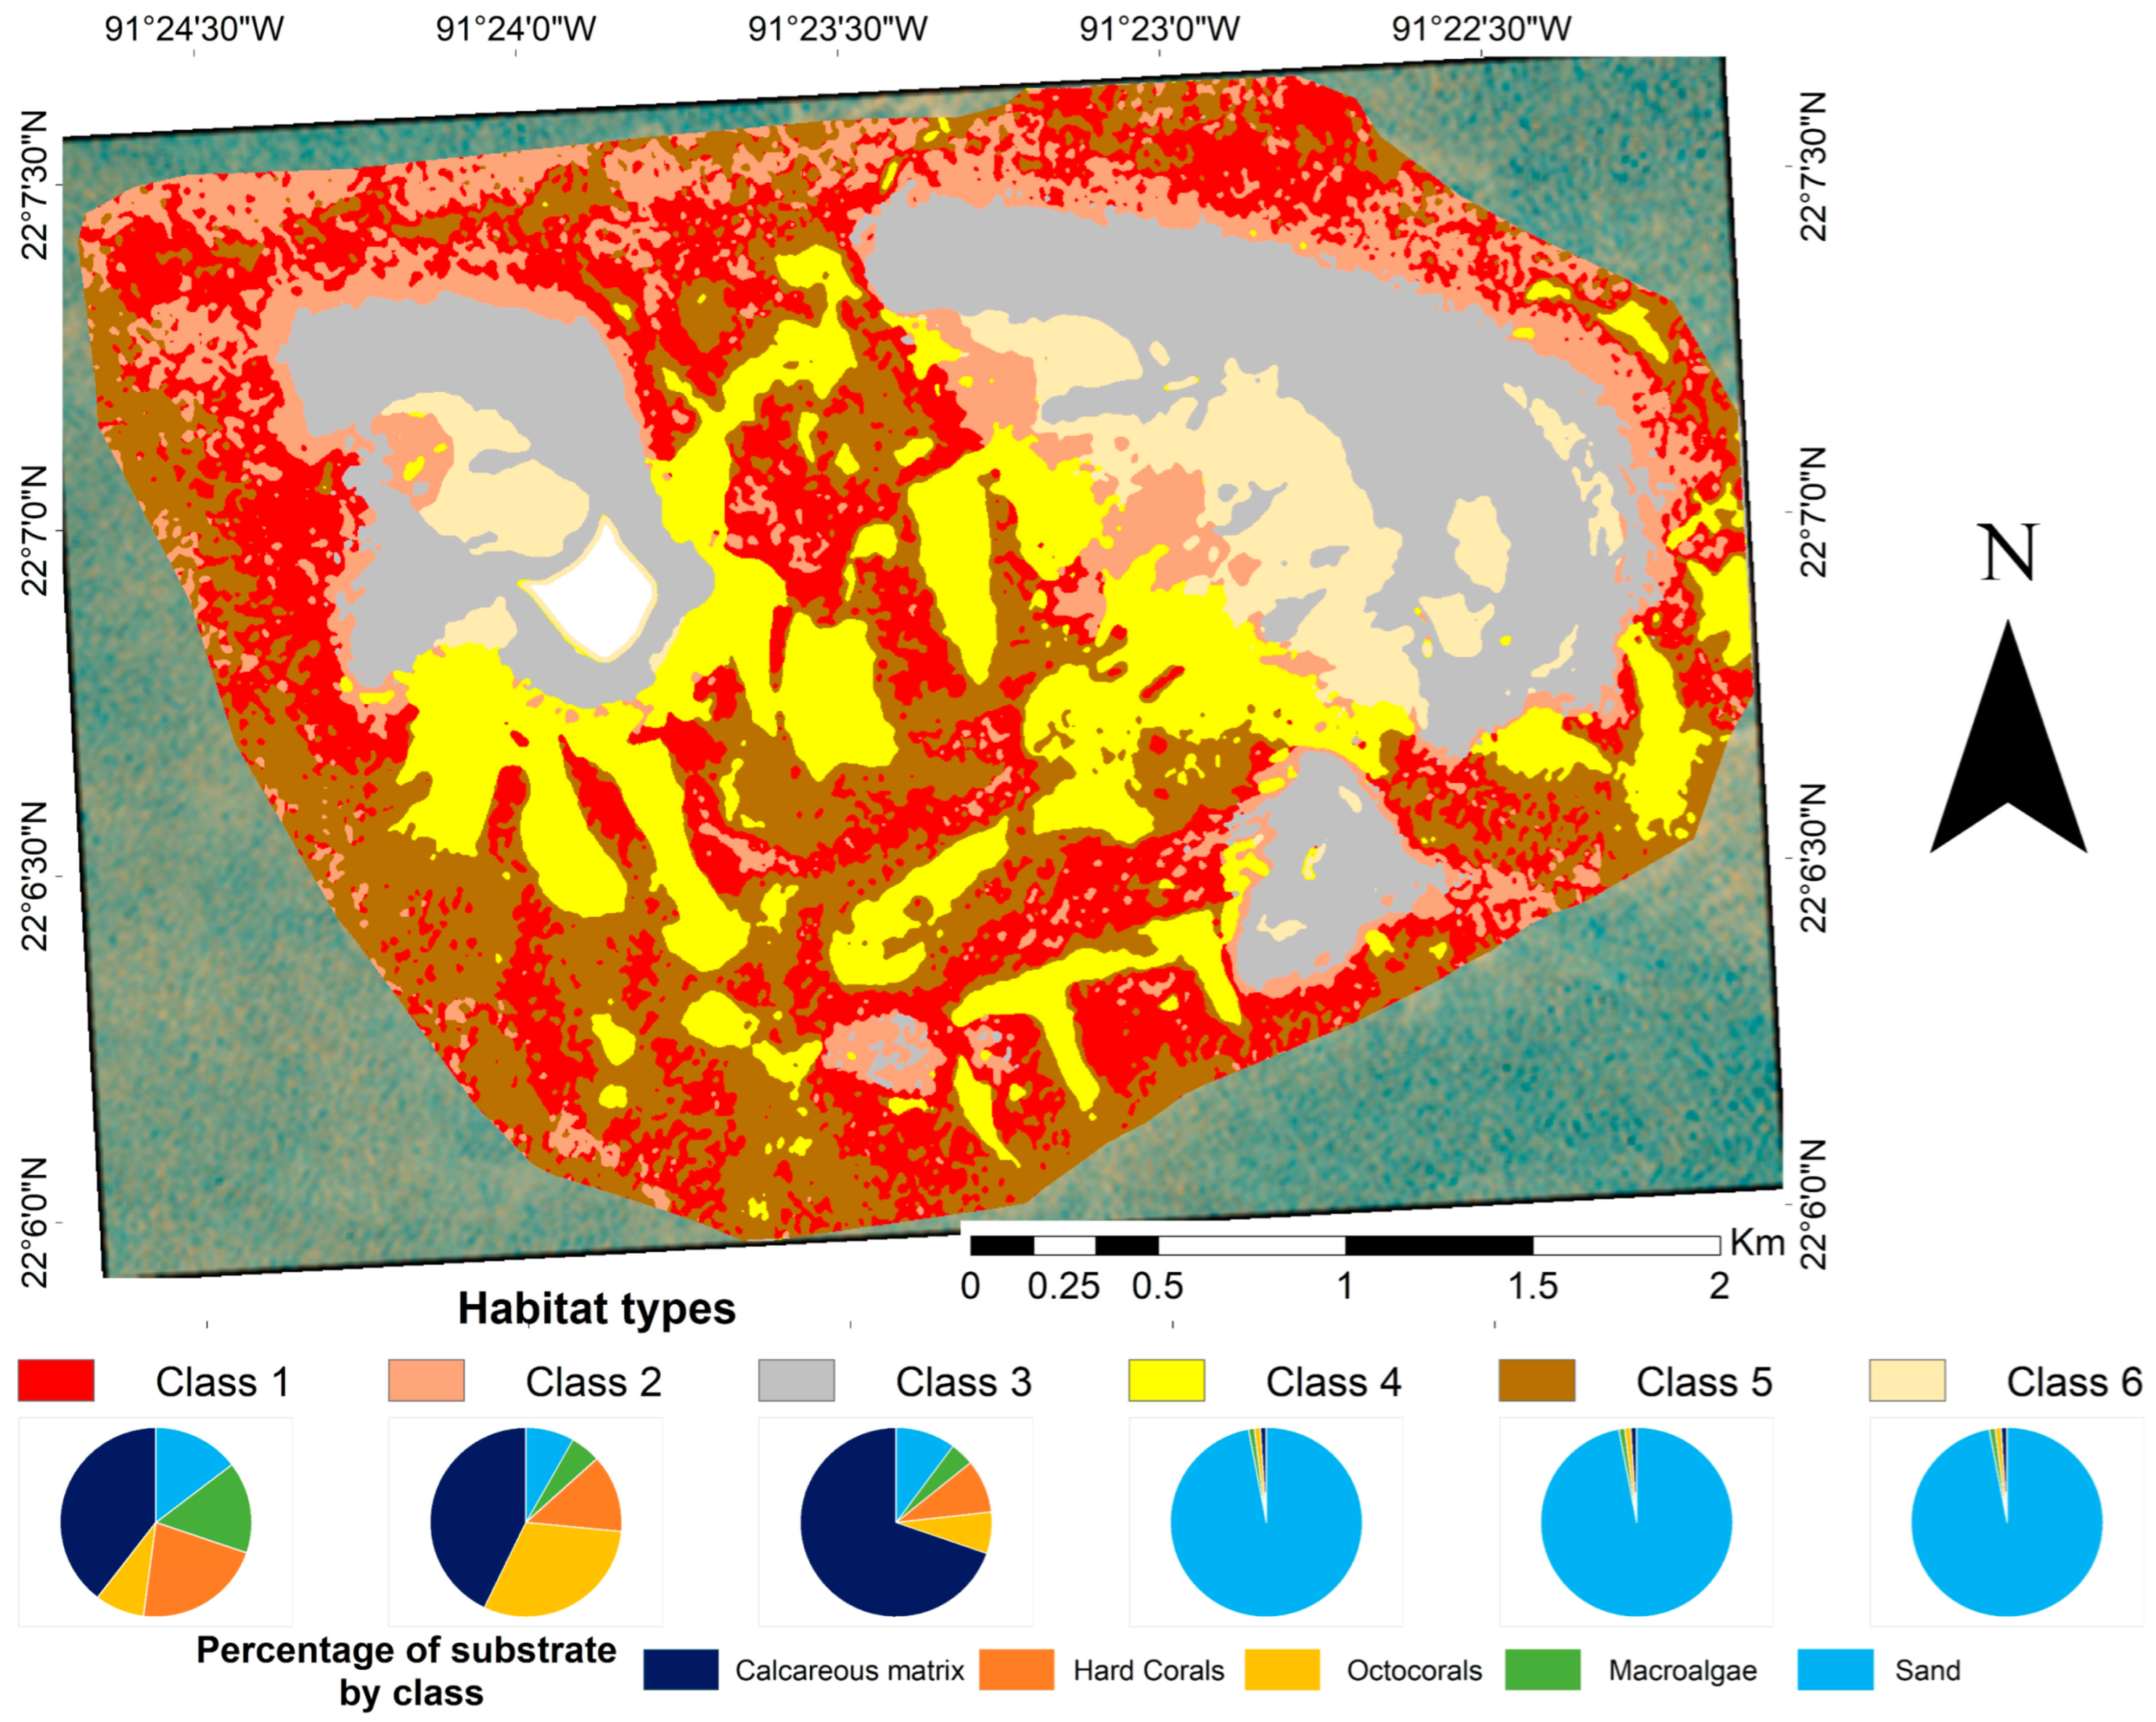
The benthic reef seascape thematic map (Figure 3) considered six habitat classes (Table 2). Sandy beds (classes 4, 5, and 6) represent an important component of the reef seascape (45.20%). Class 3, which represents the crescent-shaped and shallowest areas, was identified as mostly homogeneous and was dominated by a calcareous matrix. Classes 1 and 2 represent the areas with the greatest cover of hard coral and the greatest heterogeneity in substrate composition.
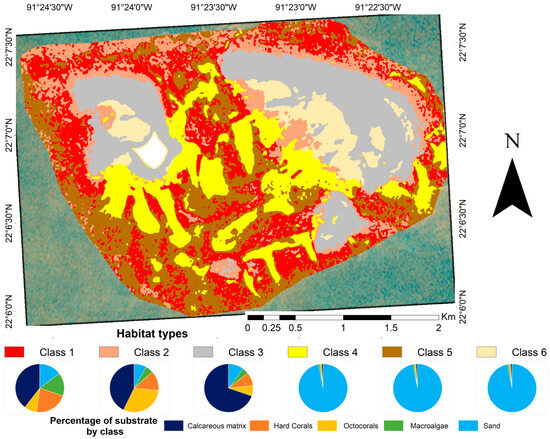
Figure 3.
Benthic habitats of Cayo Arenas, within the 10.09 km2 delimited area, obtained from the combined use of an object-based classification and a supervised classification of a PlanetScope (August 2023) image. The contribution of each substratum to each class, as described in Table 2, is shown at the bottom of the figure. The white area in the map corresponds to the masked island.

Table 2.
Description of the benthic habitat classes used in the thematic map. Habitat classes were derived from the Bray–Curtis analysis of benthic cover composition and depth profiles, along with two auxiliary classes. Substrate coverages are: Dominated ≥ 75%; High ≥ 50 < 75; Moderate ≥ 30 < 50%; Low ≥ 5 < 30%; Presence < 5%. User and producer accuracy’s for each class are included in the Supplementary Materials Table S3.
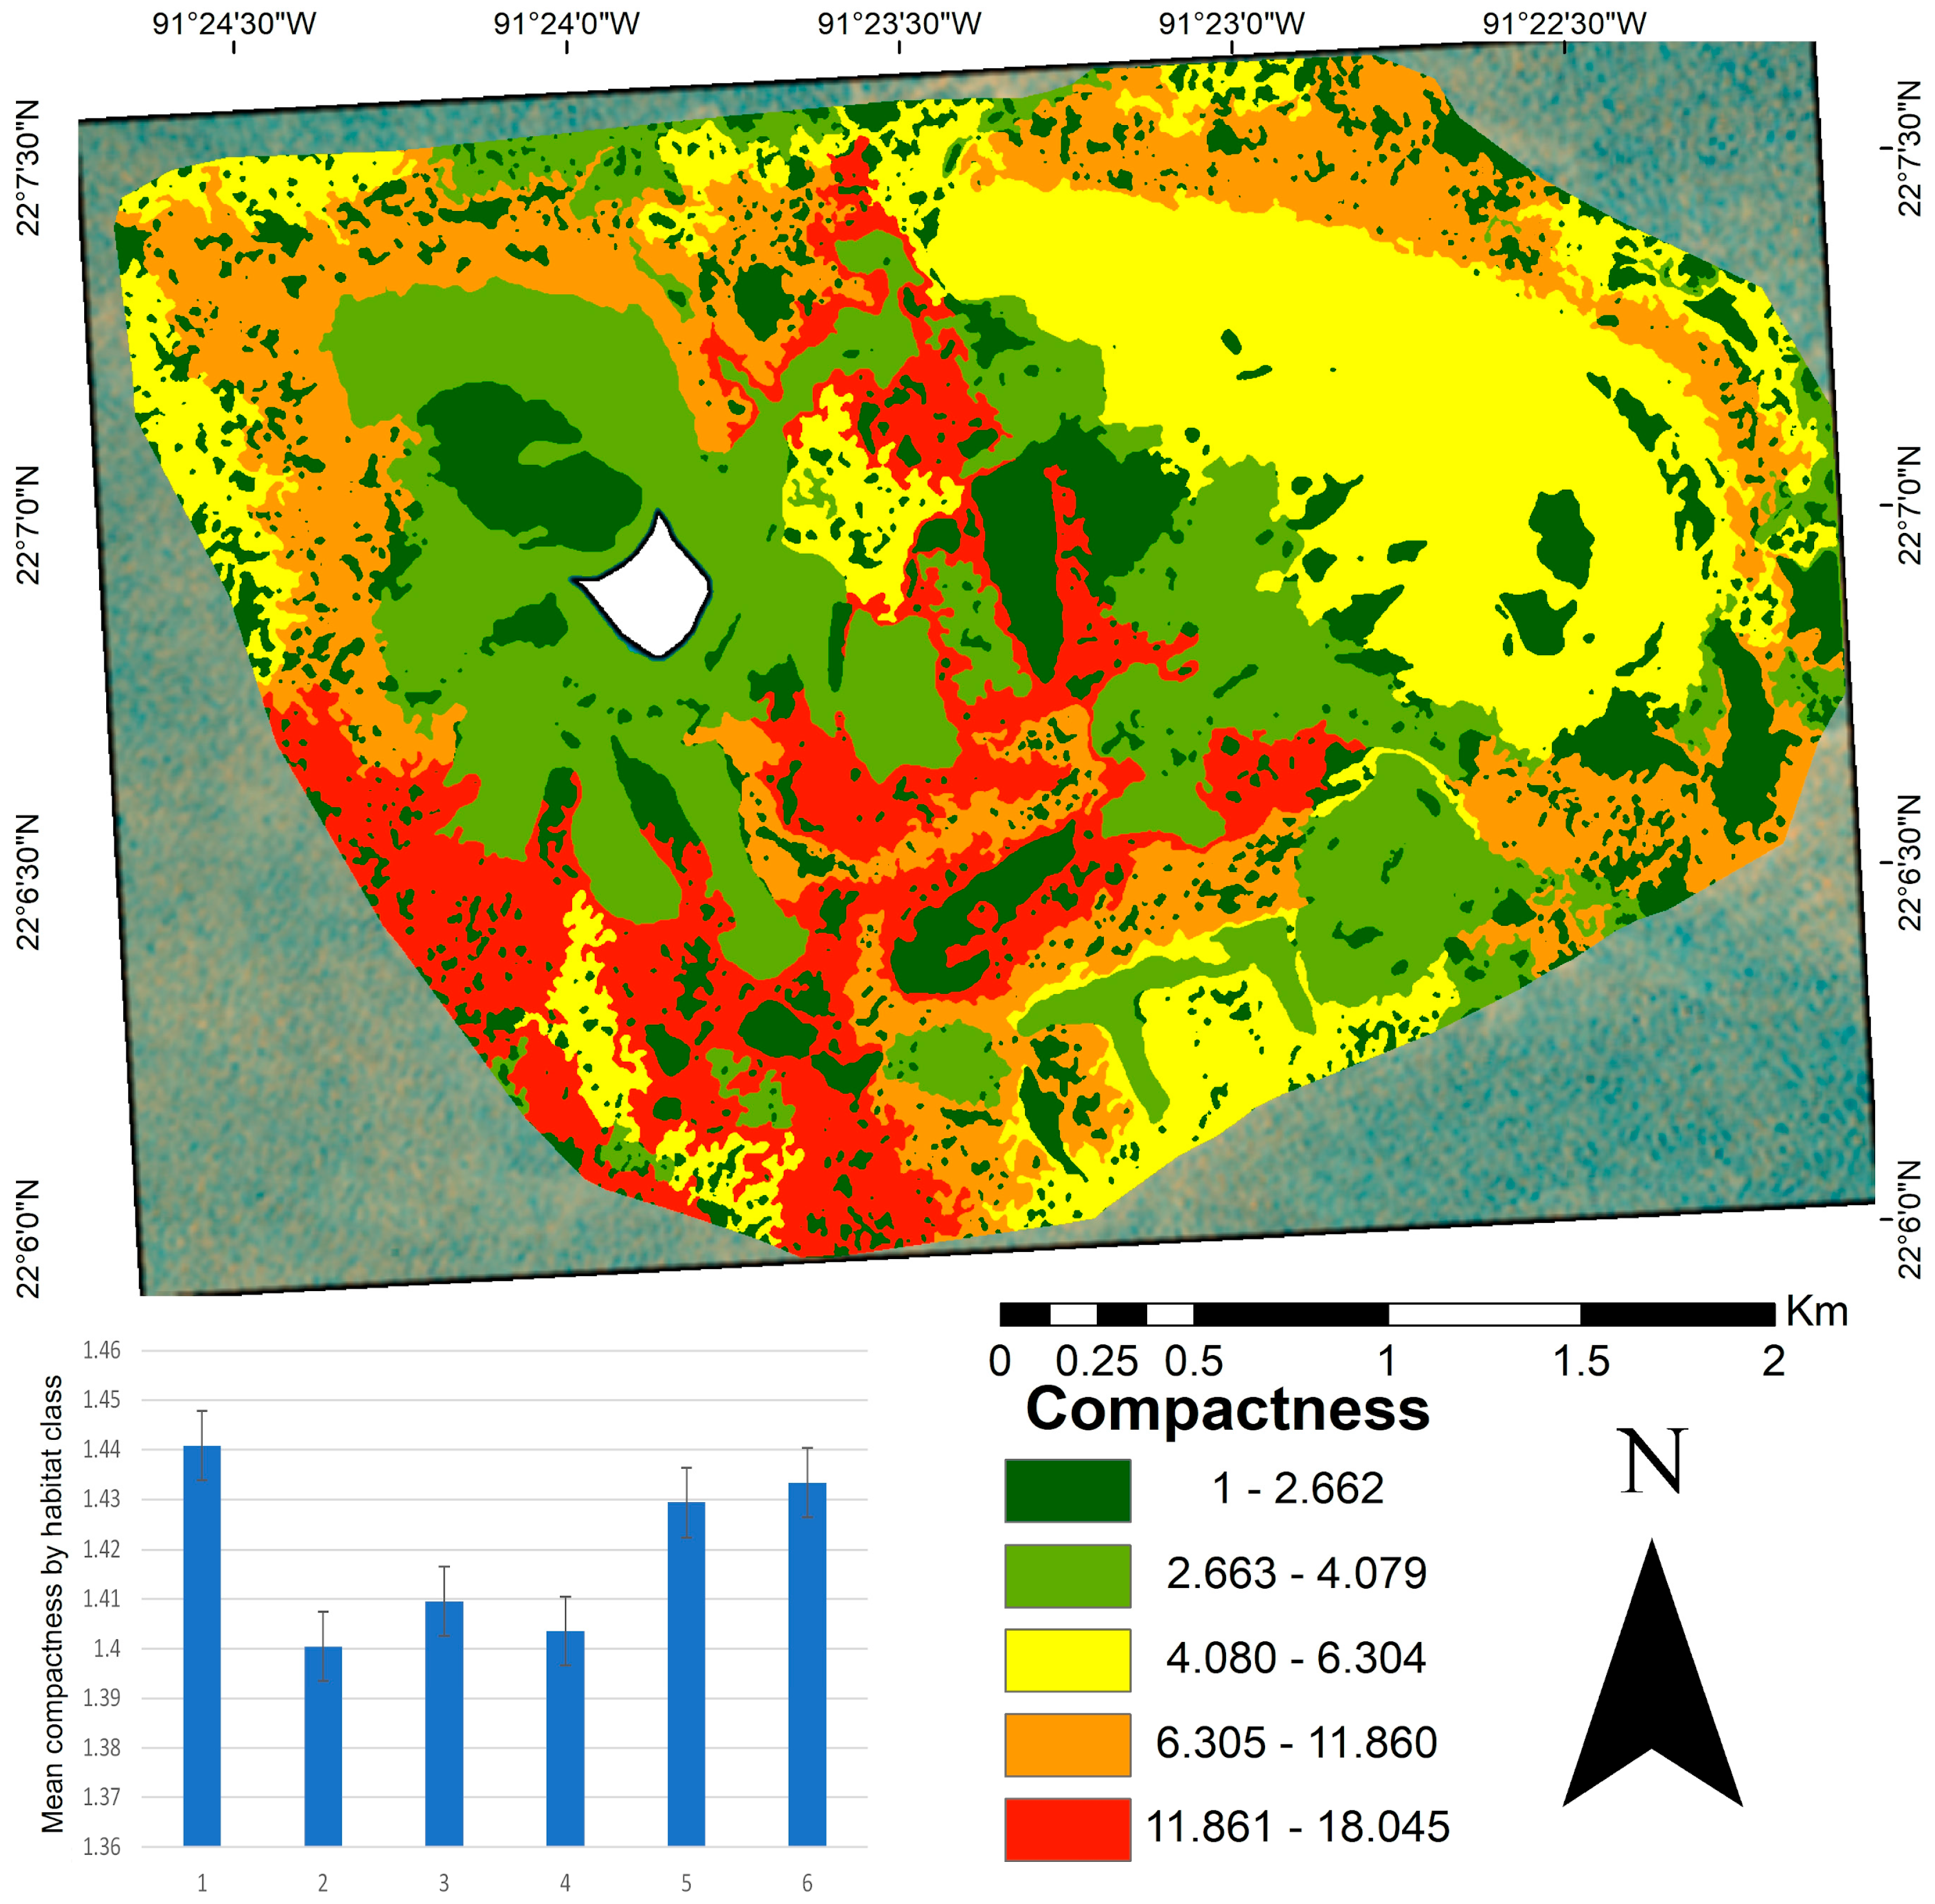
At the seascape scale, patch compactness had a mean value of 1.41 (Figure 4). Classes two, three, and four showed the lowest compactness values, characterized by high cover or dominated by a calcareous matrix and sandy habitats, respectively. In contrast, class one, which contained diverse substrates such as coral, macroalgae, and octocorals, exhibited more irregular forms. The compactness map (Figure 4) shows that the highest values (indicating less compact and more irregular shapes) were concentrated in the central and southern areas of the study site. In contrast, the most compact patches were mainly located in the northwestern, central, and southern regions.
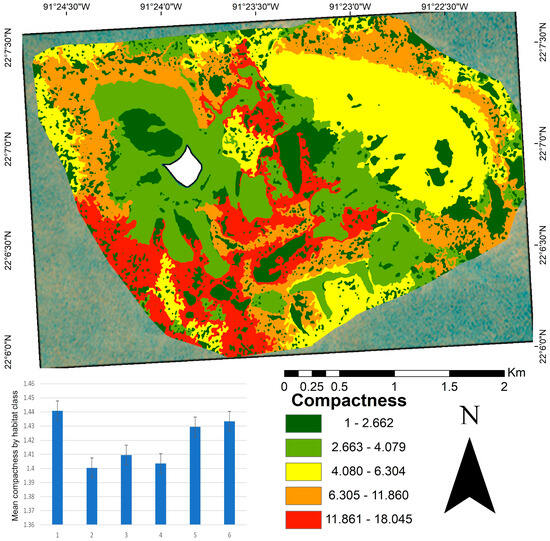
Figure 4.
Patch compactness map of benthic habitats in the Cayo Arenas reef system. The map shows the spatial distribution of compactness values based on the perimeter-to-area ratio, where values close to one (green) indicate more compact patches and less susceptibility to fragmentation, and higher values (red) reflect more irregular or elongated shapes that may be more susceptible to fragmentation. The embedded bar plot displays the mean patch compactness per habitat class, with vertical lines indicating standard error. The white area in the map corresponds to the masked island.
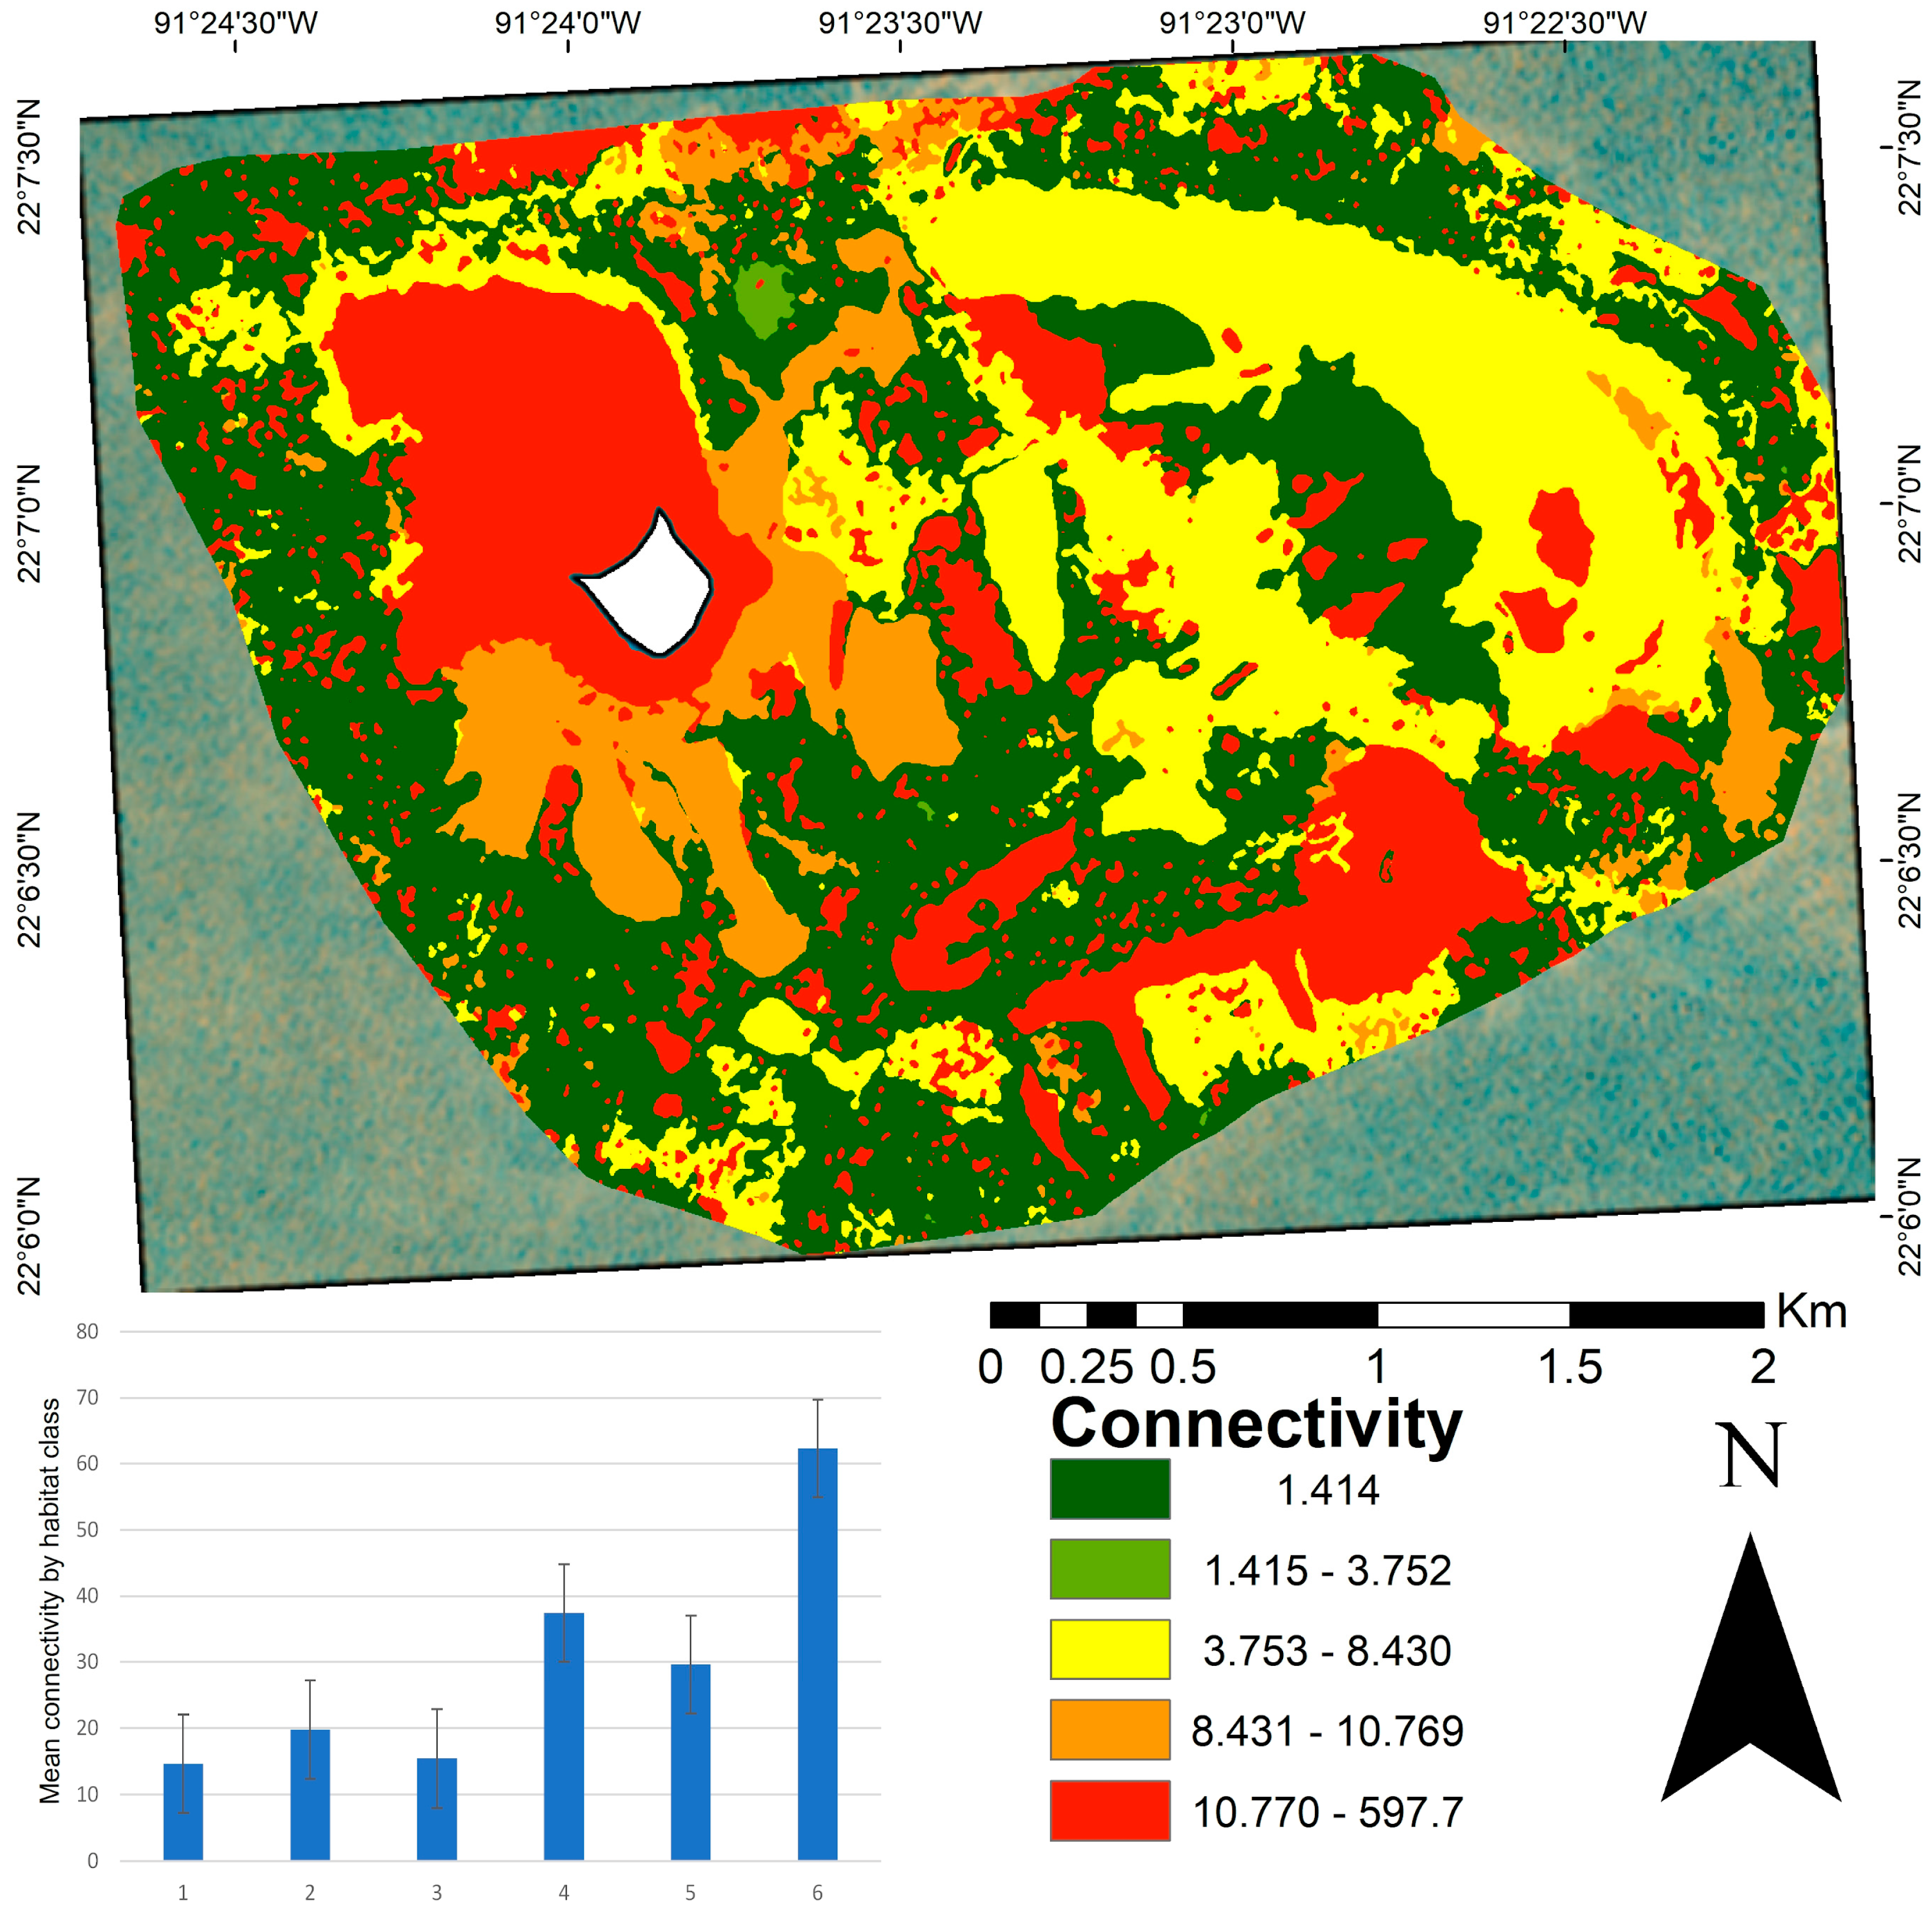
The connectivity analysis yielded a mean distance of 19.49 between patches (Figure 5), with values ranging from 1.41 to 597.79. Classes one, two, and three showed the highest connectivity (those with the shortest Euclidean distance). In contrast, class six was the most isolated habitat type. High connectivity is often associated with large, continuous habitat areas. The connectivity map (Figure 5) highlights that the most connected patches were widely distributed across the central and peripheral portions of the study area, corresponding to larger and more structurally diverse habitats. The most isolated patches (values between 10.77 and 597.79) were located in the northwest and southeast regions, particularly in crescent-shaped structures facing the southeast. These areas mostly consist of small, spatially dispersed patches.
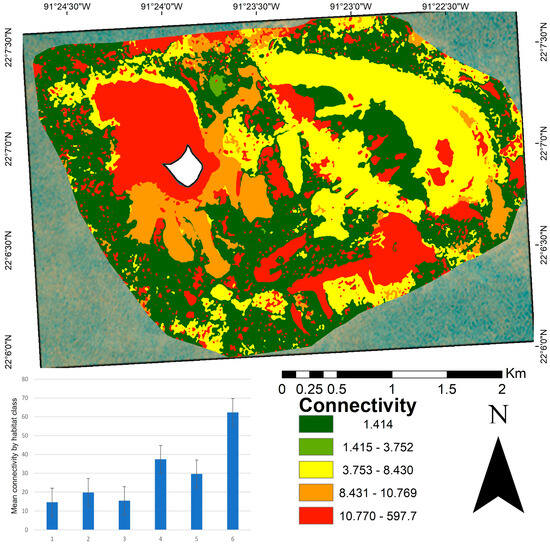
Figure 5.
Connectivity map of benthic patches in the Cayo Arenas reef system. The map shows the spatial distribution of connectivity values calculated as the Euclidean distance to the nearest patch of the same habitat class. Lower values (green) indicate higher connectivity, whereas higher values (red) indicate more isolated patches. The accompanying bar plot displays the mean connectivity per habitat class, with standard error bars. The mean connectivity value at the seascape scale was 19.49 m. The white area in the map corresponds to the masked island.
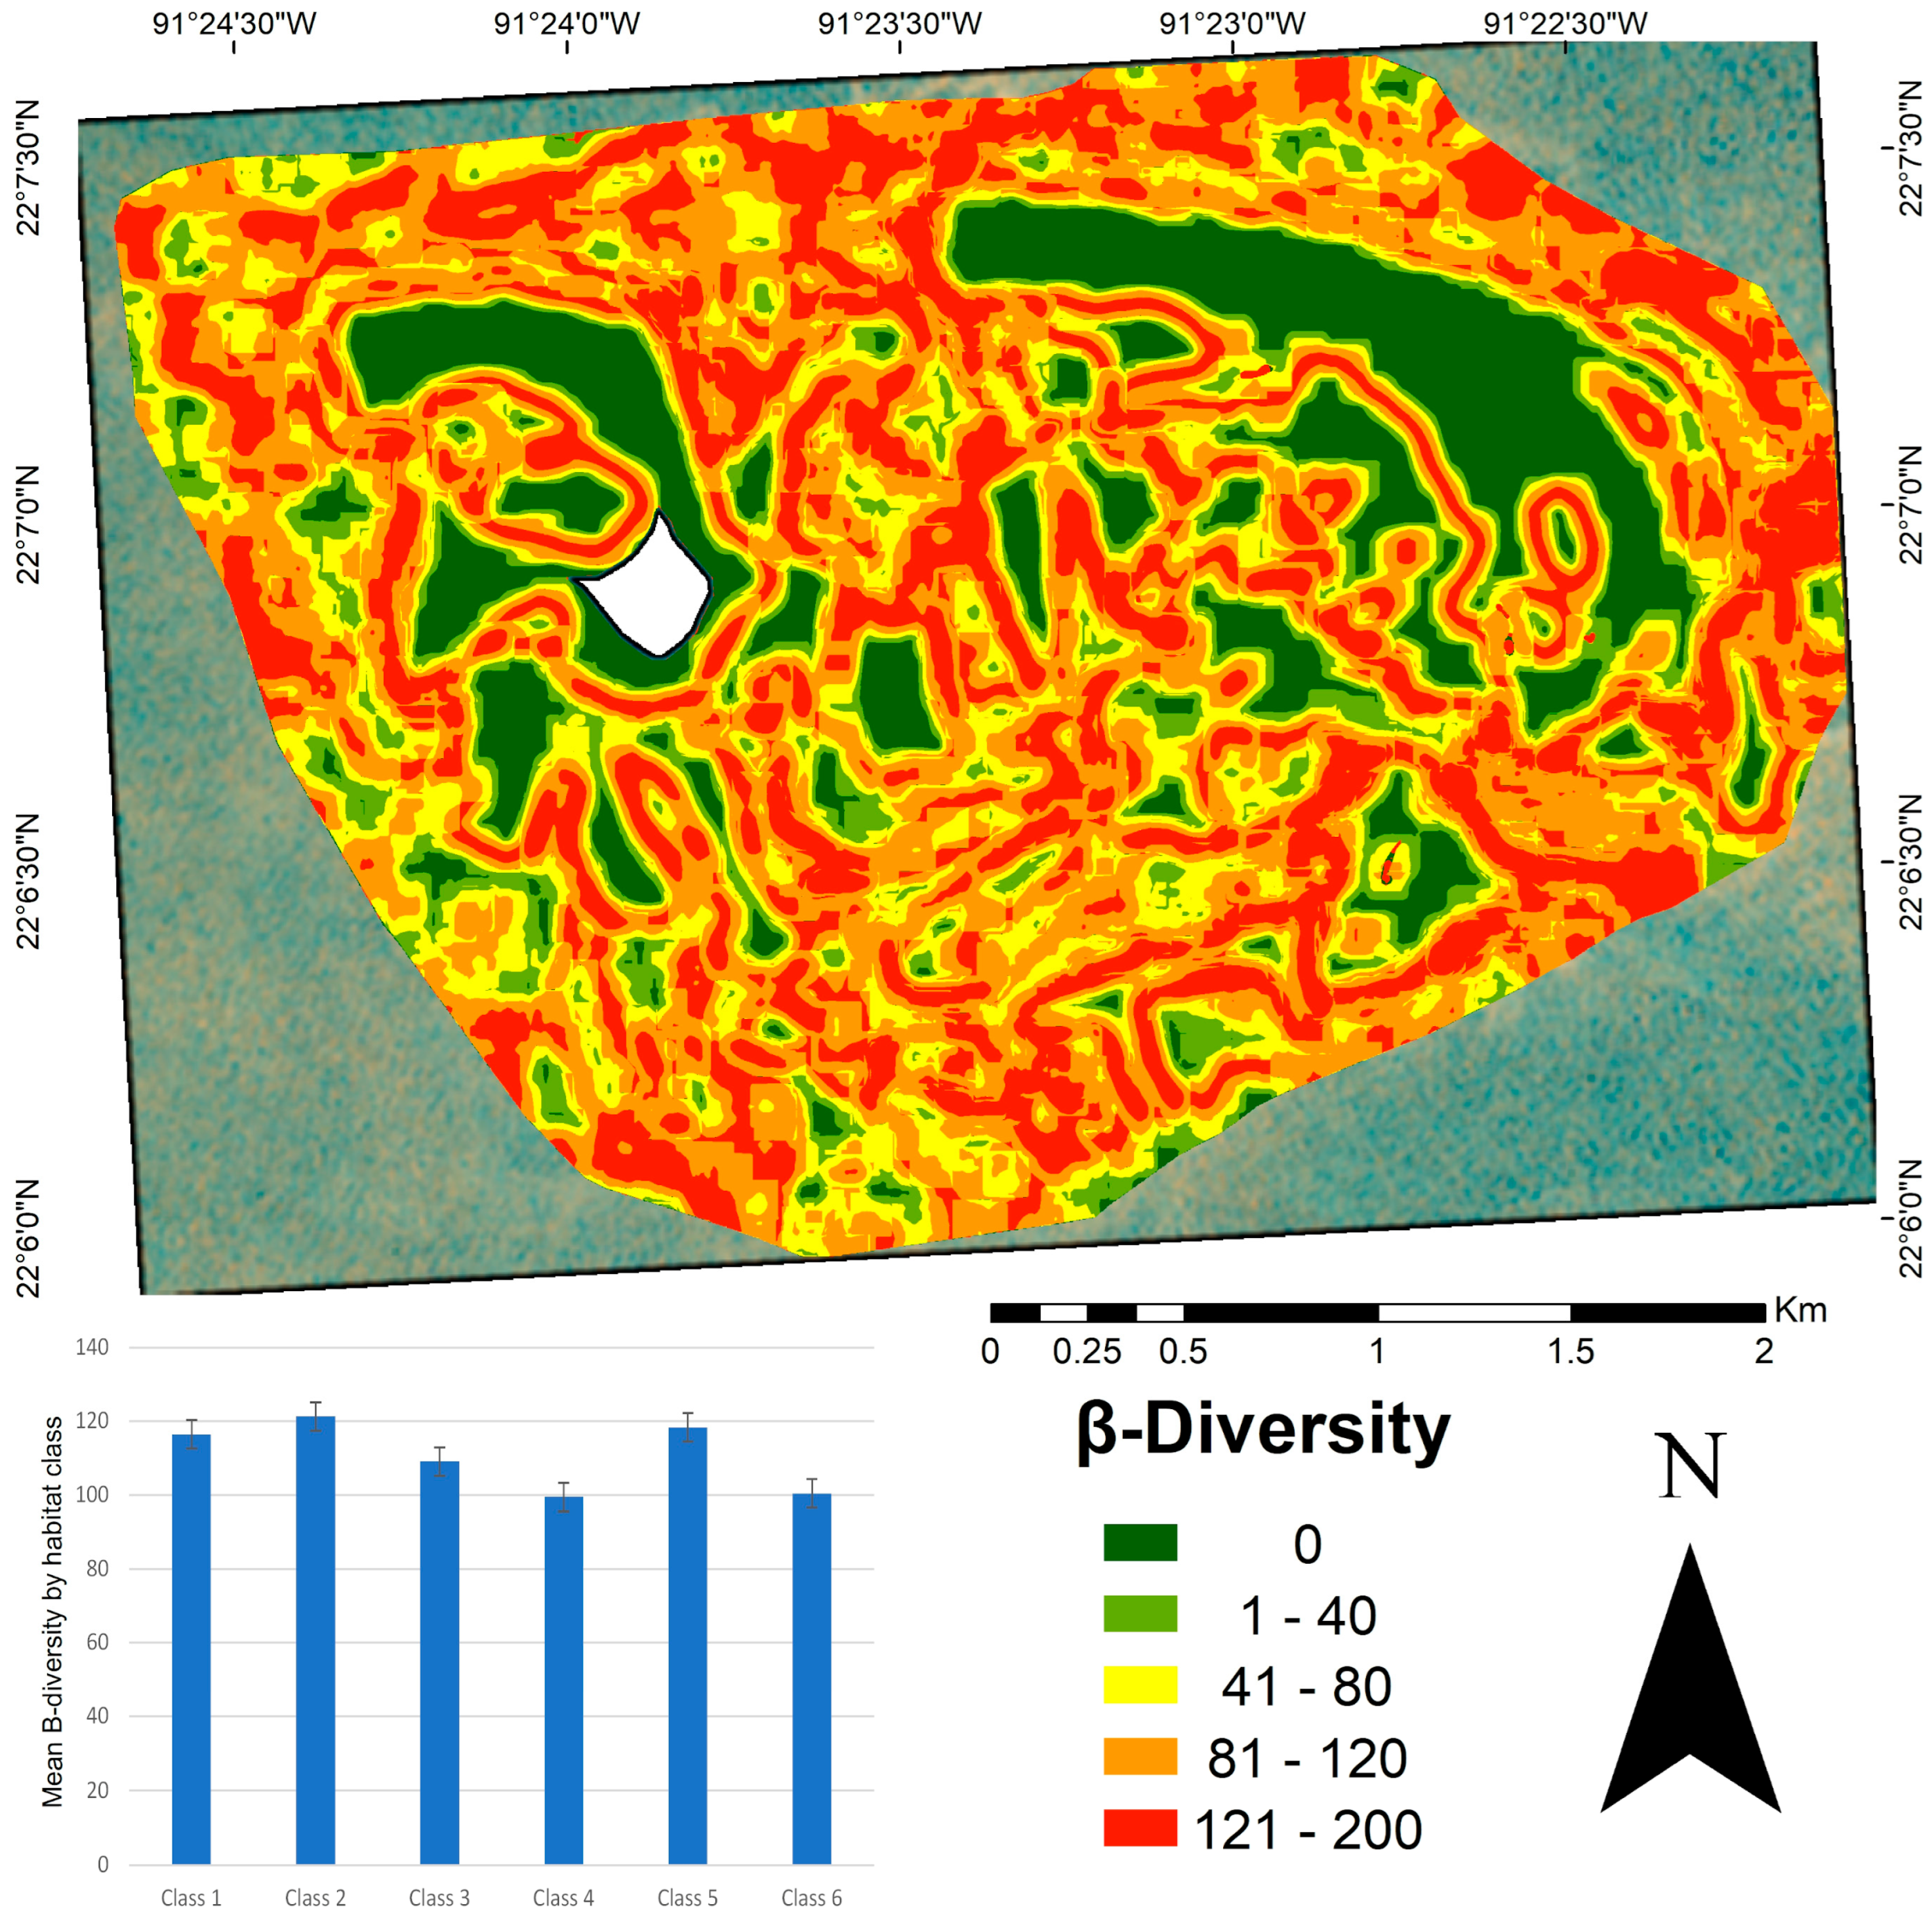
High β-diversity values were observed in structurally complex habitats, particularly in classes one and two (Figure 6). Class five also exhibited high β-diversity, suggesting its potential role as a transitional zone between habitats. Classes four and six, which mainly represent sandy areas, showed lower β-diversity. Although some large patches exhibited low internal β-diversity values, their edges showed higher values because of the transition to adjacent habitats. The β-diversity map (Figure 6) revealed higher values concentrated at patch edges, particularly along the boundaries of crescent-shaped patches dominated by a calcareous matrix and sandy substrate. Lower β-diversity values were observed in the inner zones of large, homogeneous patches.
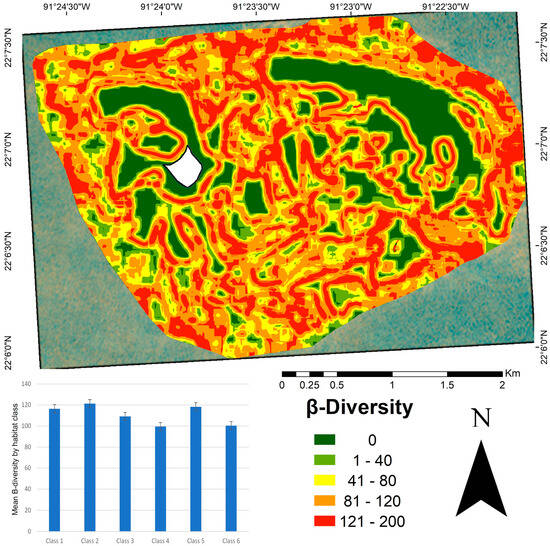
Figure 6.
β-diversity map of benthic habitats in the Cayo Arenas reef system. The map represents β-diversity values calculated using a 0.1 km2 moving window. Higher values (red) indicate higher β-diversity. The embedded bar plot shows the mean β-diversity per habitat class, with vertical lines representing the standard error. The average β-diversity value at the seascape scale was 110.77. The white area in the map corresponds to the masked island.
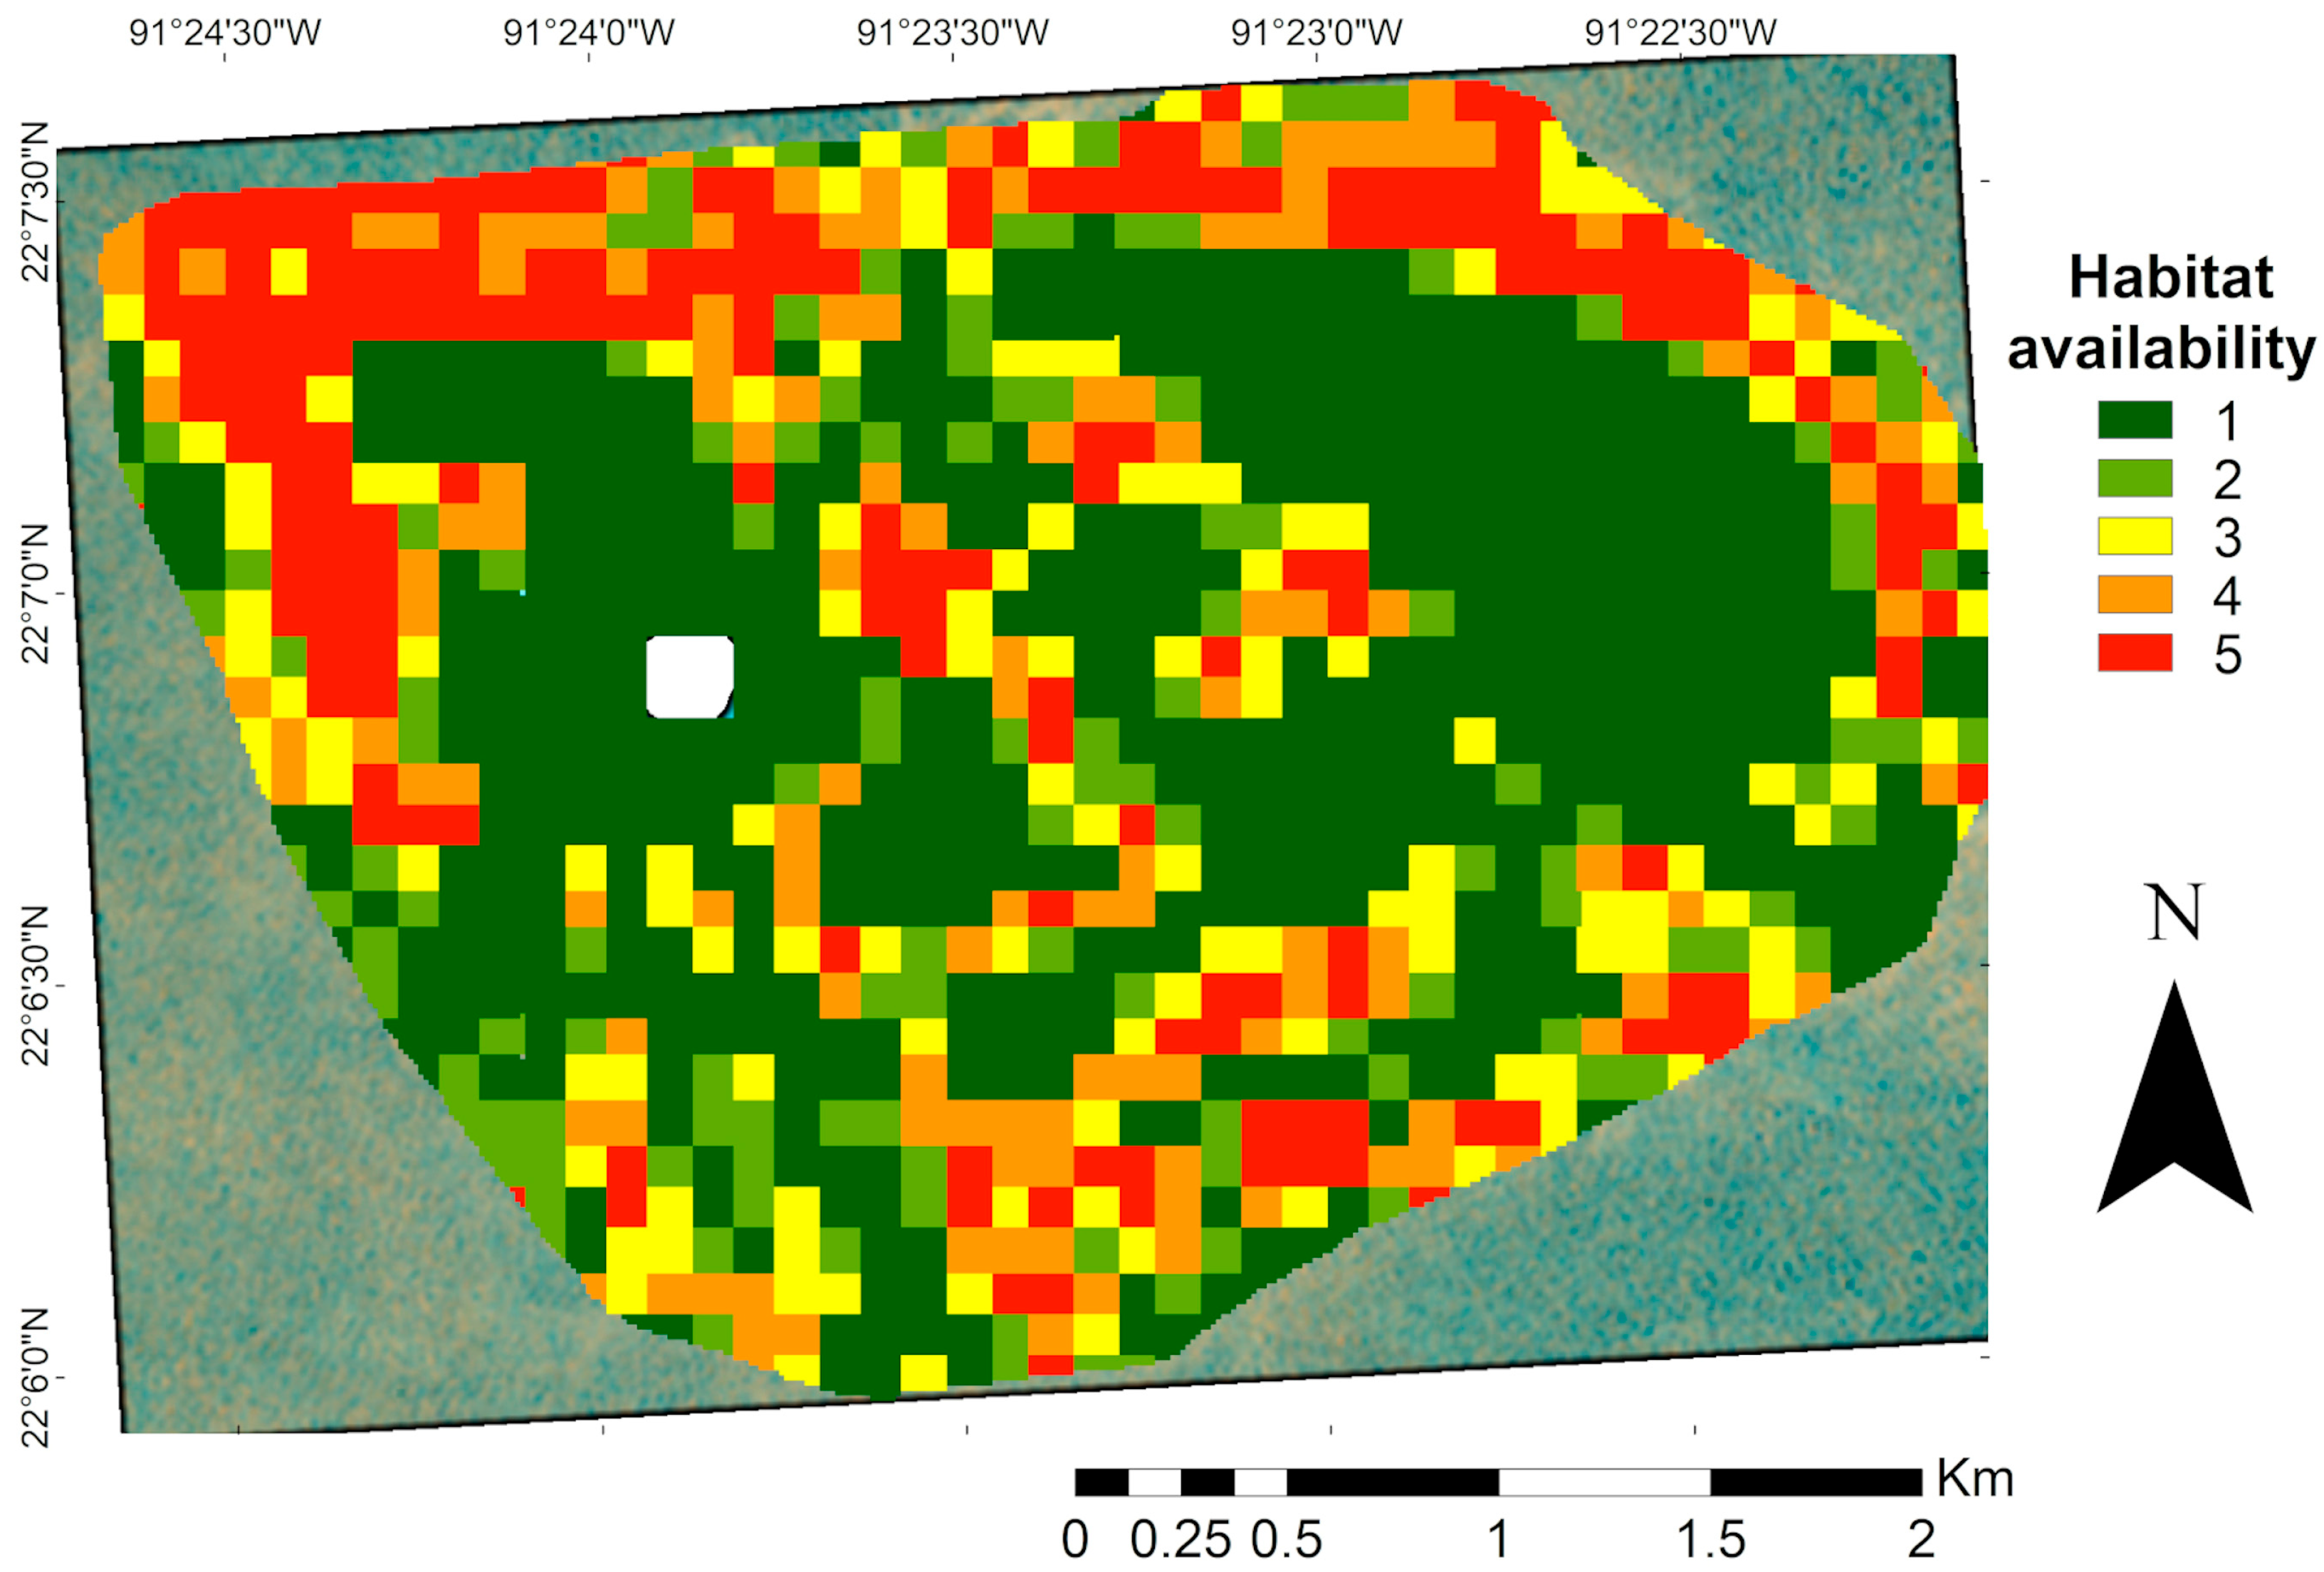
Habitat availability for species of commercial interest was estimated based on the habitat preferences of juvenile Serranidae obtained from the literature, which corresponded to habitat classes one and two up to a depth of 30 m. The resulting suitability map (Figure 7) showed higher values in the northern region of the study area, where hard corals and structurally complex substrates coincided with the appropriate depth ranges. In contrast, lower suitability was observed in shallow zones, particularly in crescent-shaped patches.
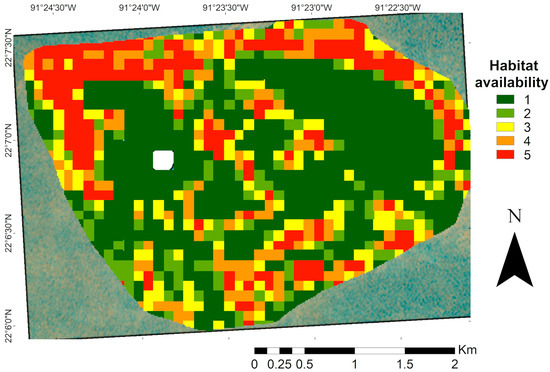
Figure 7.
Map of habitat availability for commercial species of the Serranidae family (Epinephelus and Mycteroperca). Areas with a higher proportion reflect a greater potential for the use of these species. The white area in the map corresponds to the masked island.
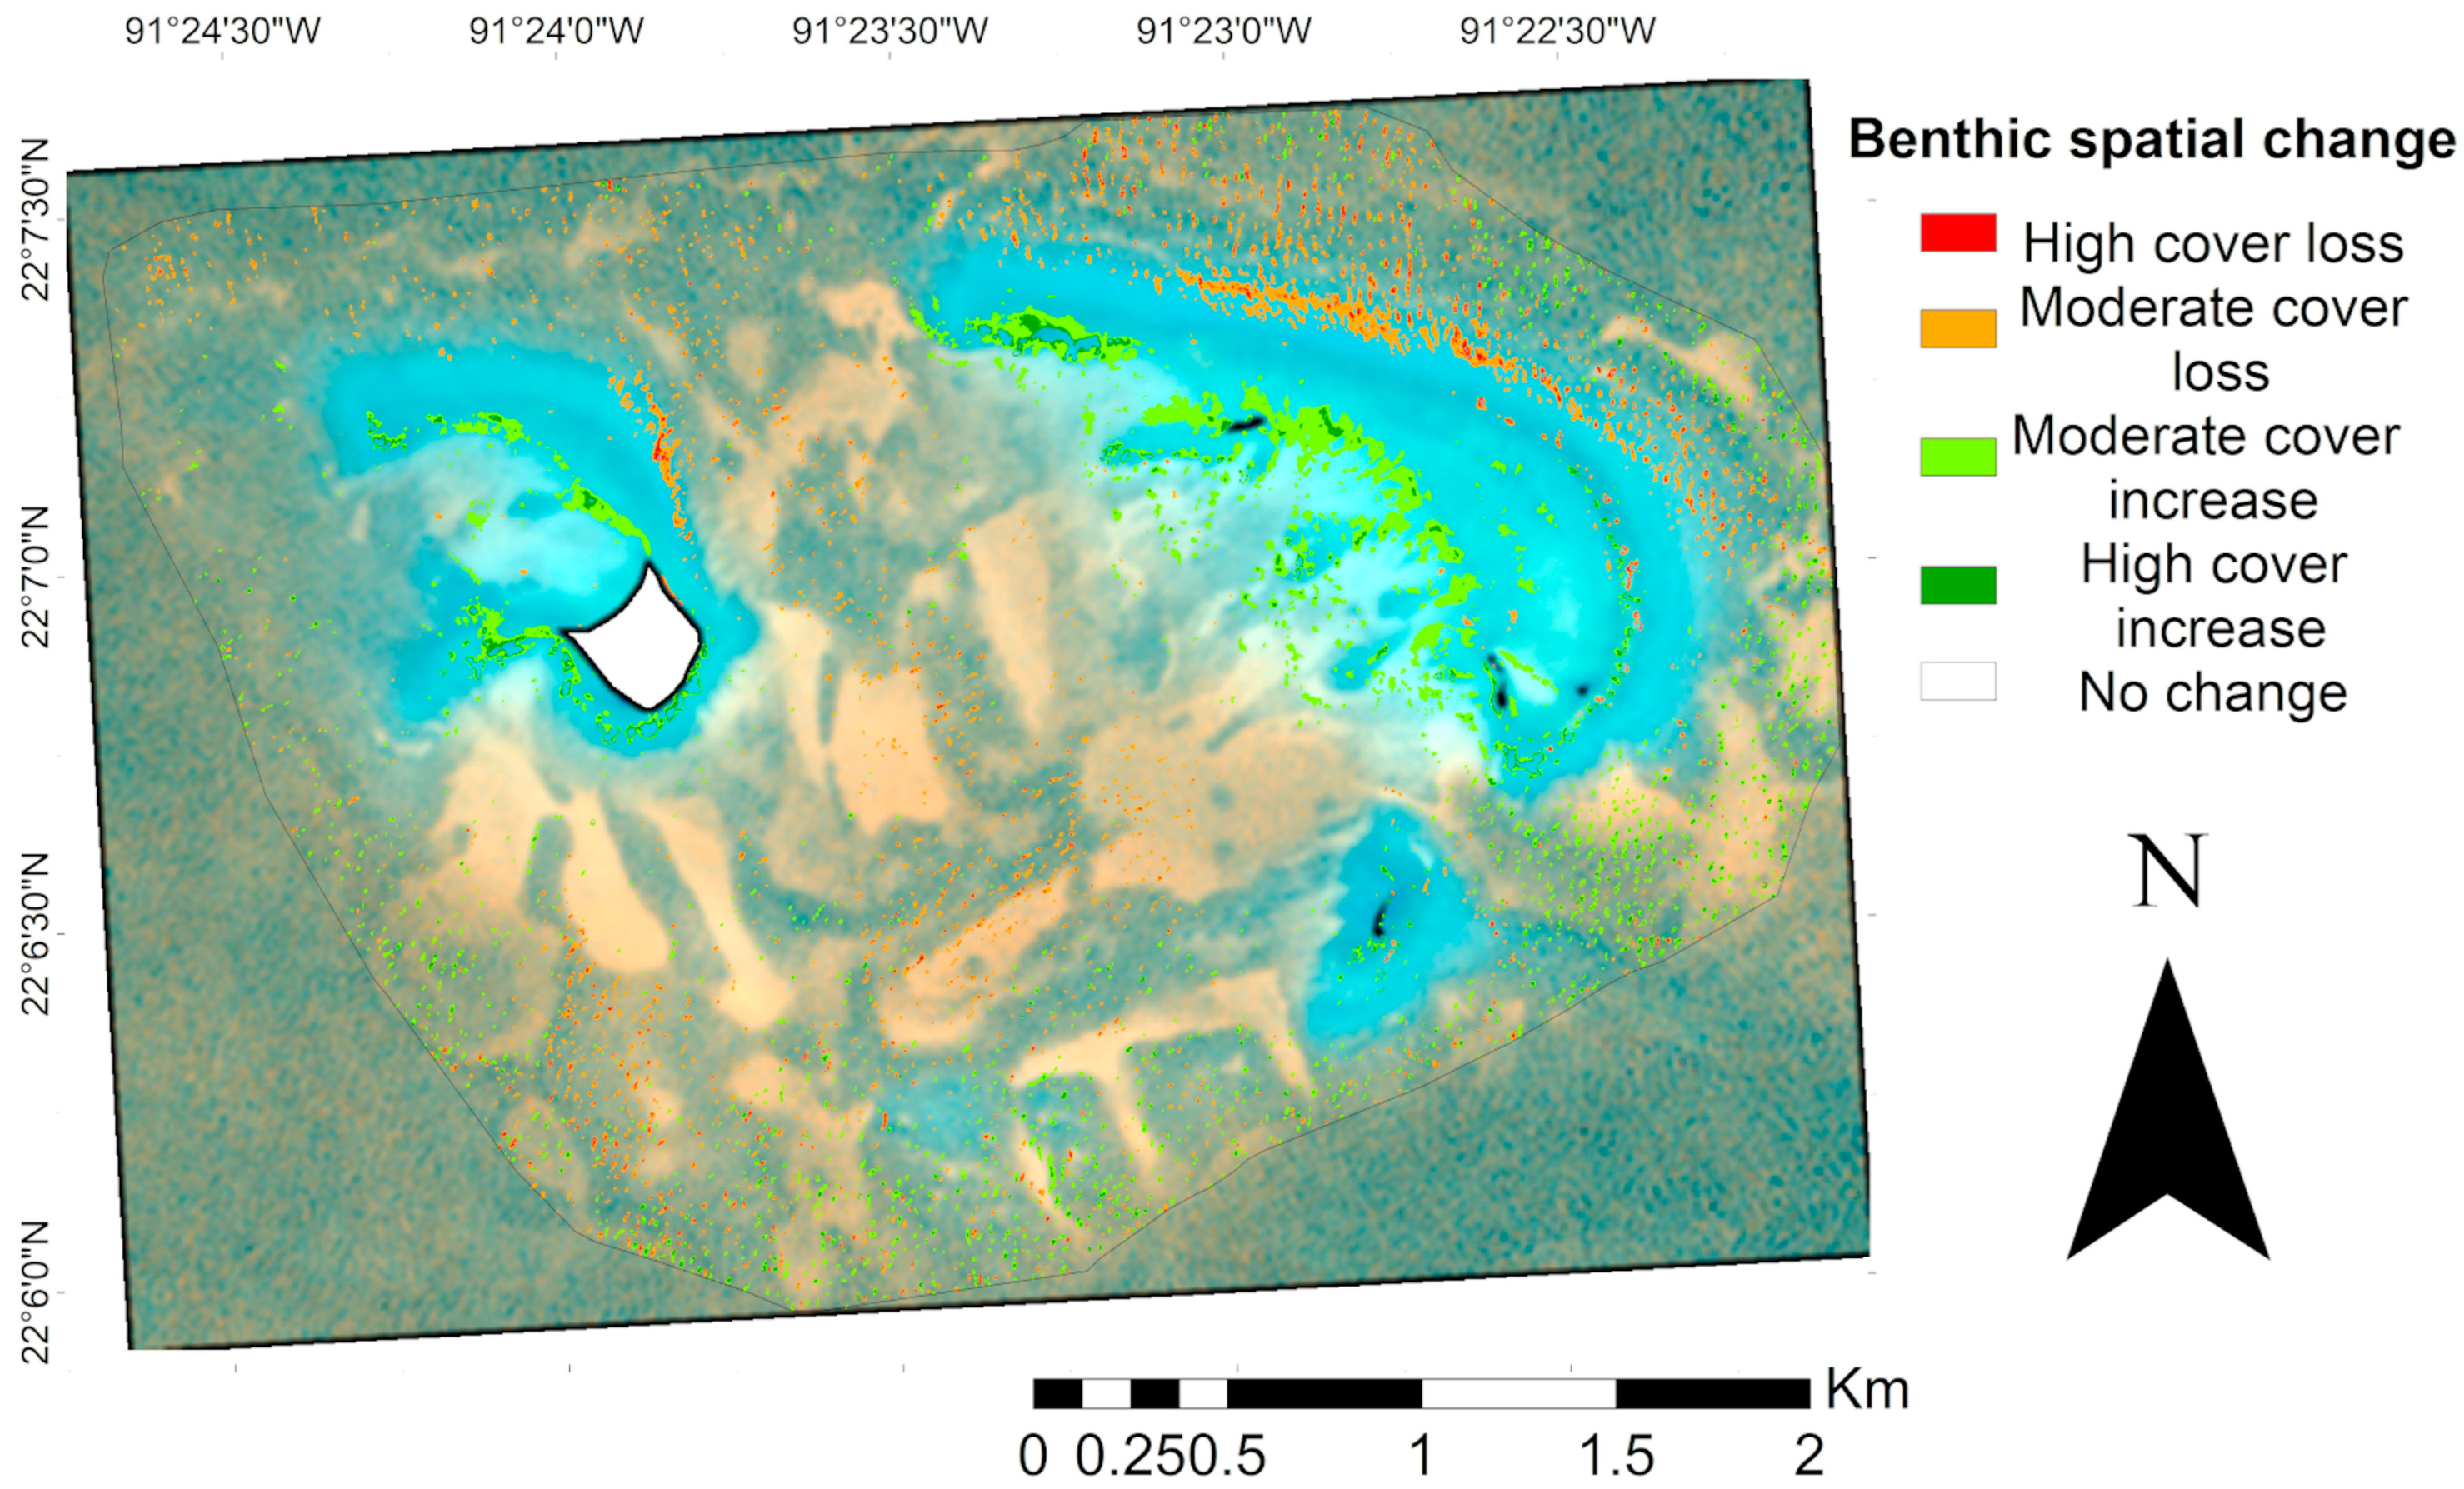
The benthic spatial change map (Figure 8), derived from the DeltaCue analysis, indicated that the overall habitat cover remained relatively stable between 2017 and 2023. However, large patches dominated by calcareous matrix in zones exposed to high wave energy showed significant loss (p < 0.05). Conversely, habitat cover gains were observed in the more protected interior sections of crescent-shaped patches, particularly in shallow sandy and calcareous matrix habitats.
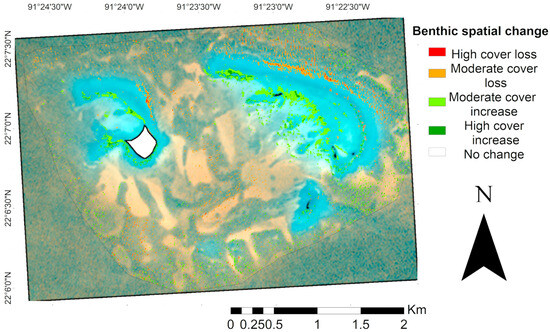
Figure 8.
Spatial change analysis of the Cayo Arenas benthic reef system. Map of benthic spatial change between 2017 and 2023. The study area is delimited by a black line. Transparent zones represent areas of no change between periods, and colored zones show modifications in benthic cover based on changes in spectral values between years of analysis. The white area in the map corresponds to the masked island.
3.2. Selection of Priority Areas for Conservation
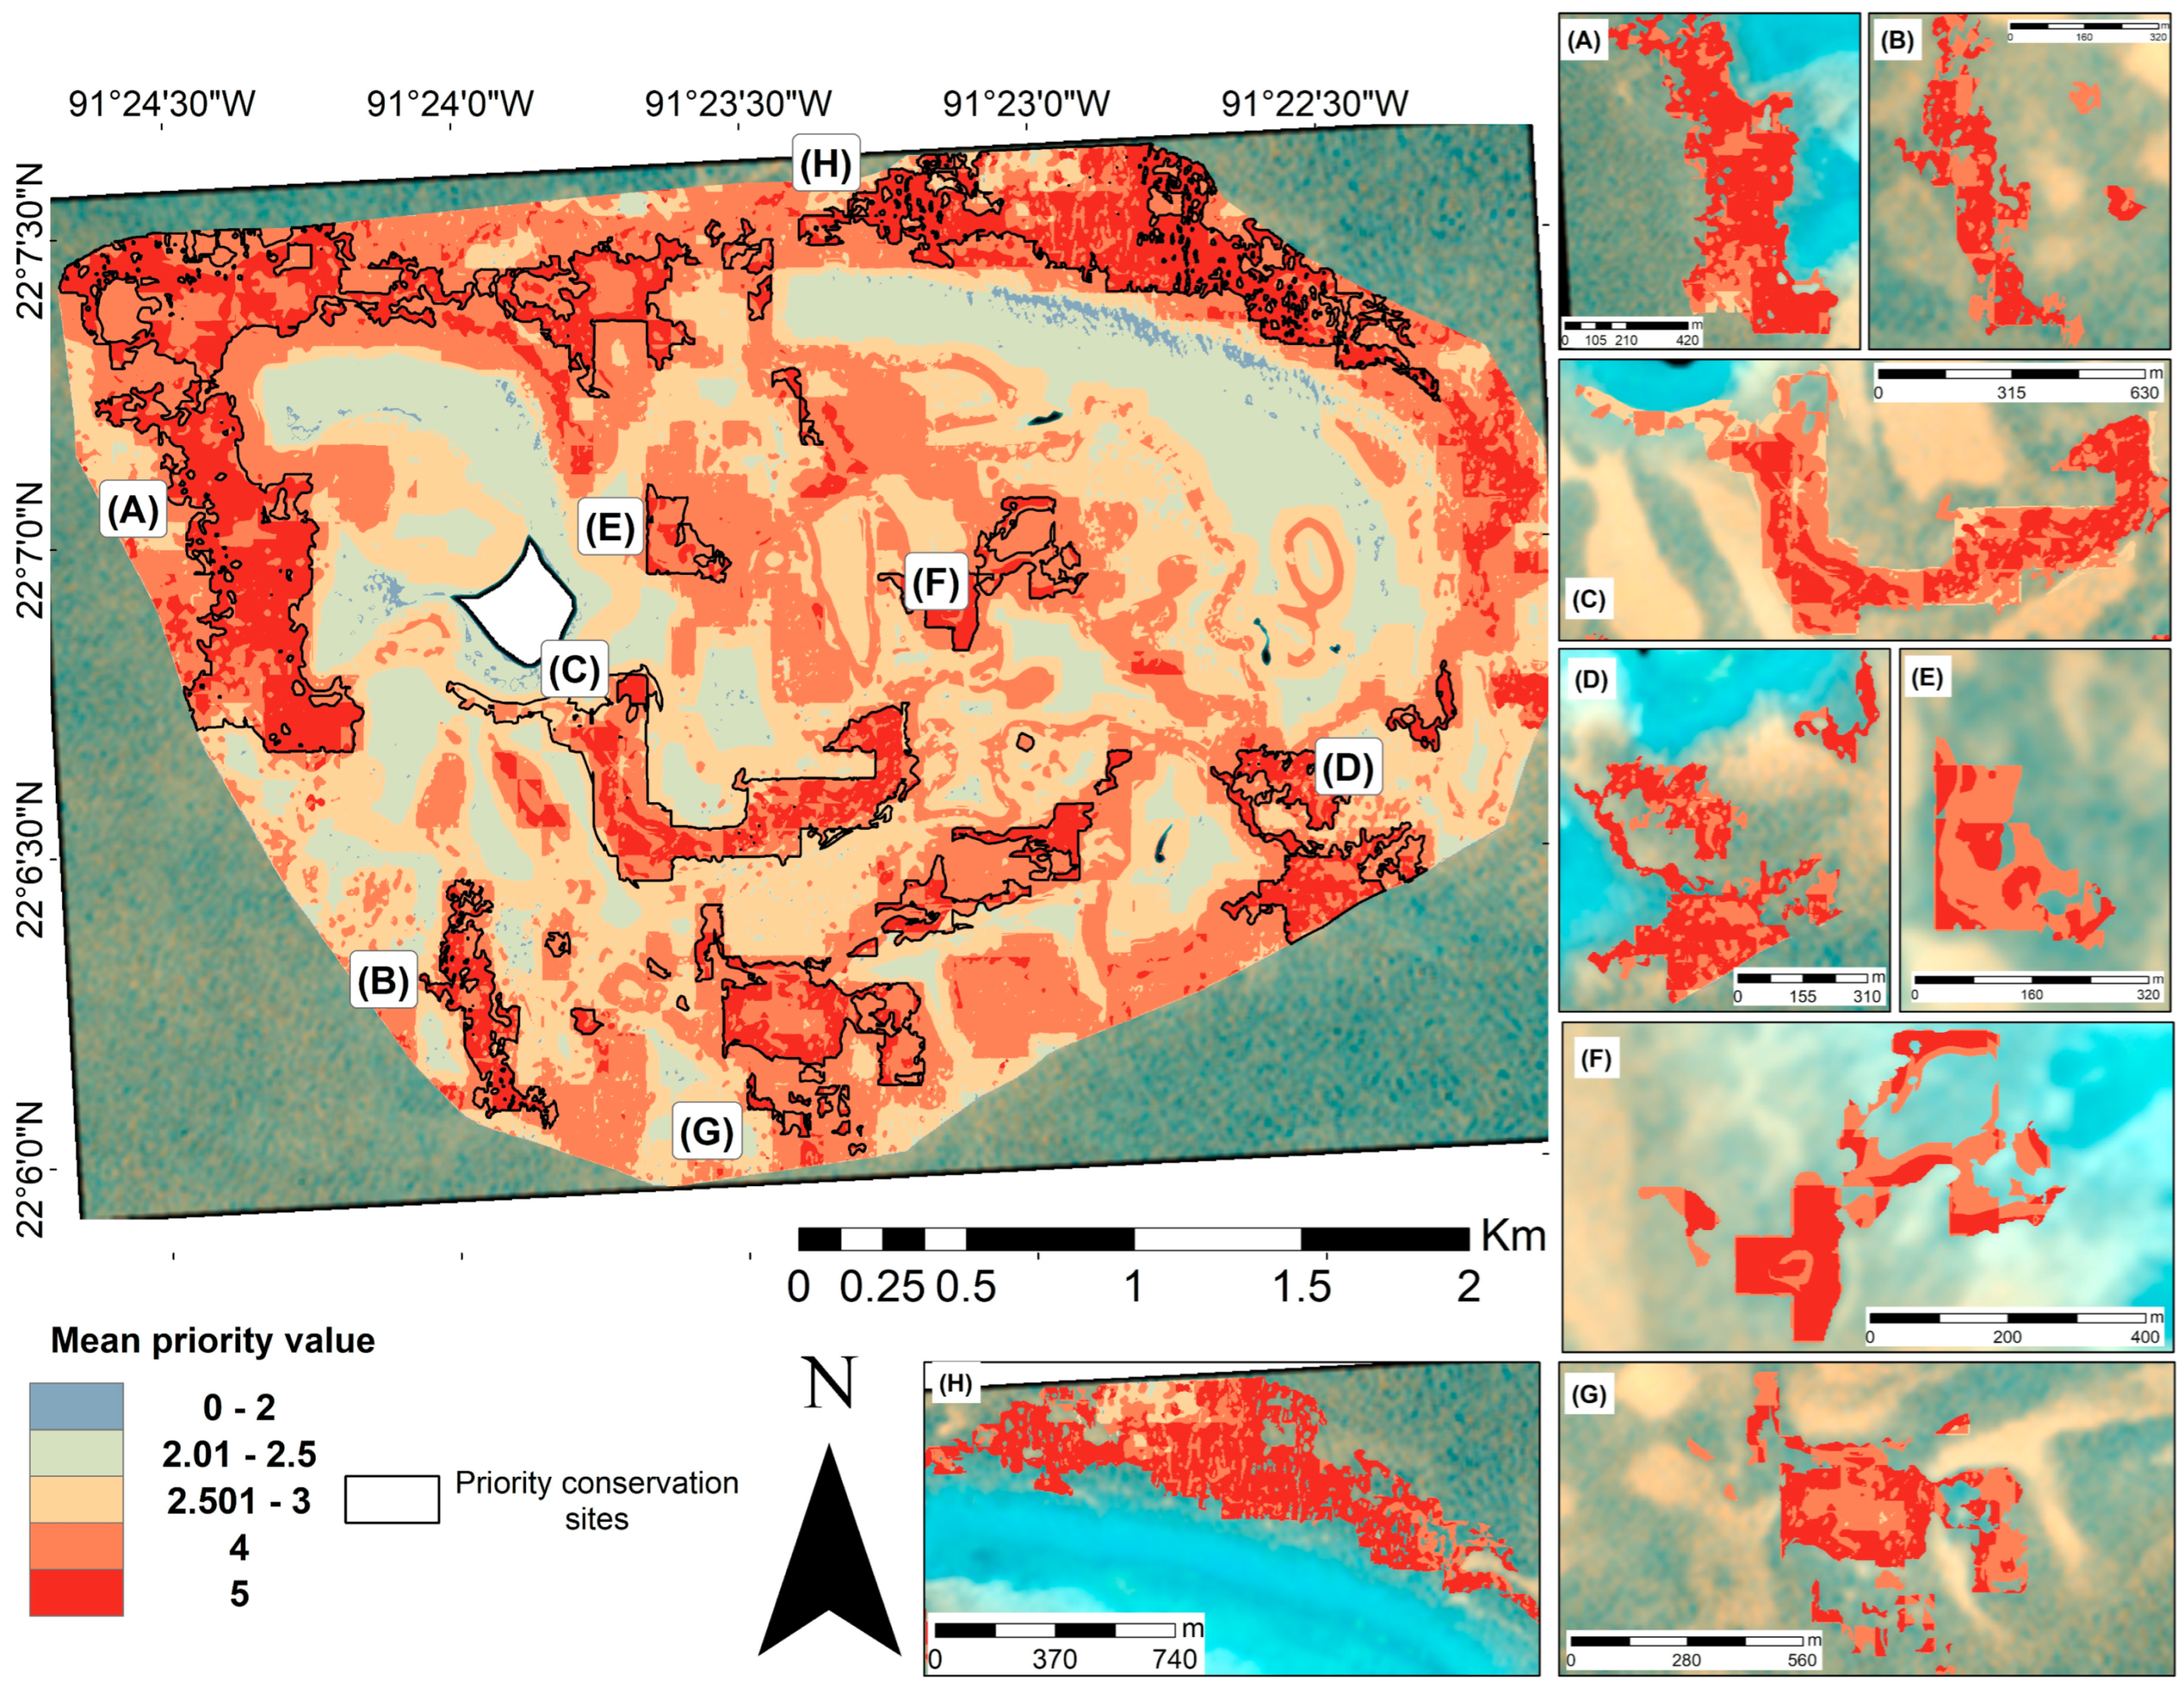
An optimal map was generated from 126 iterations of the WOA. The mean output of this analysis allowed us to identify areas with the greatest overlap of favorable characteristics in the study region. The resulting map (Figure 9) displayed a relatively homogeneous distribution with many priority areas scattered across the study site. Given the widespread and relatively uniform distribution of favorable values, the Hotspot Analysis tool was applied to delineate clusters in which high values (priority four and five) were concentrated (Figure 9A–H). In parallel, the standard error map (Supplementary Materials, Figure S1) revealed that areas with a high overlap of favorable variables exhibited lower uncertainty.
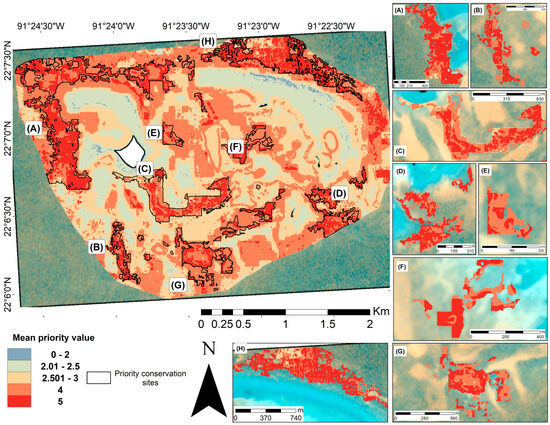
Figure 9.
Optimal map of priority conservation sites for the Cayo Arenas reef system. The map was obtained by averaging the priority of the conservation value of the WOA, considering 126 iterations. Areas with the most favorable characteristics for conservation are shown in red. Eight areas with values between four and five were identified (A–H) following the hotspot analysis. The white area in the main map corresponds to the masked island.
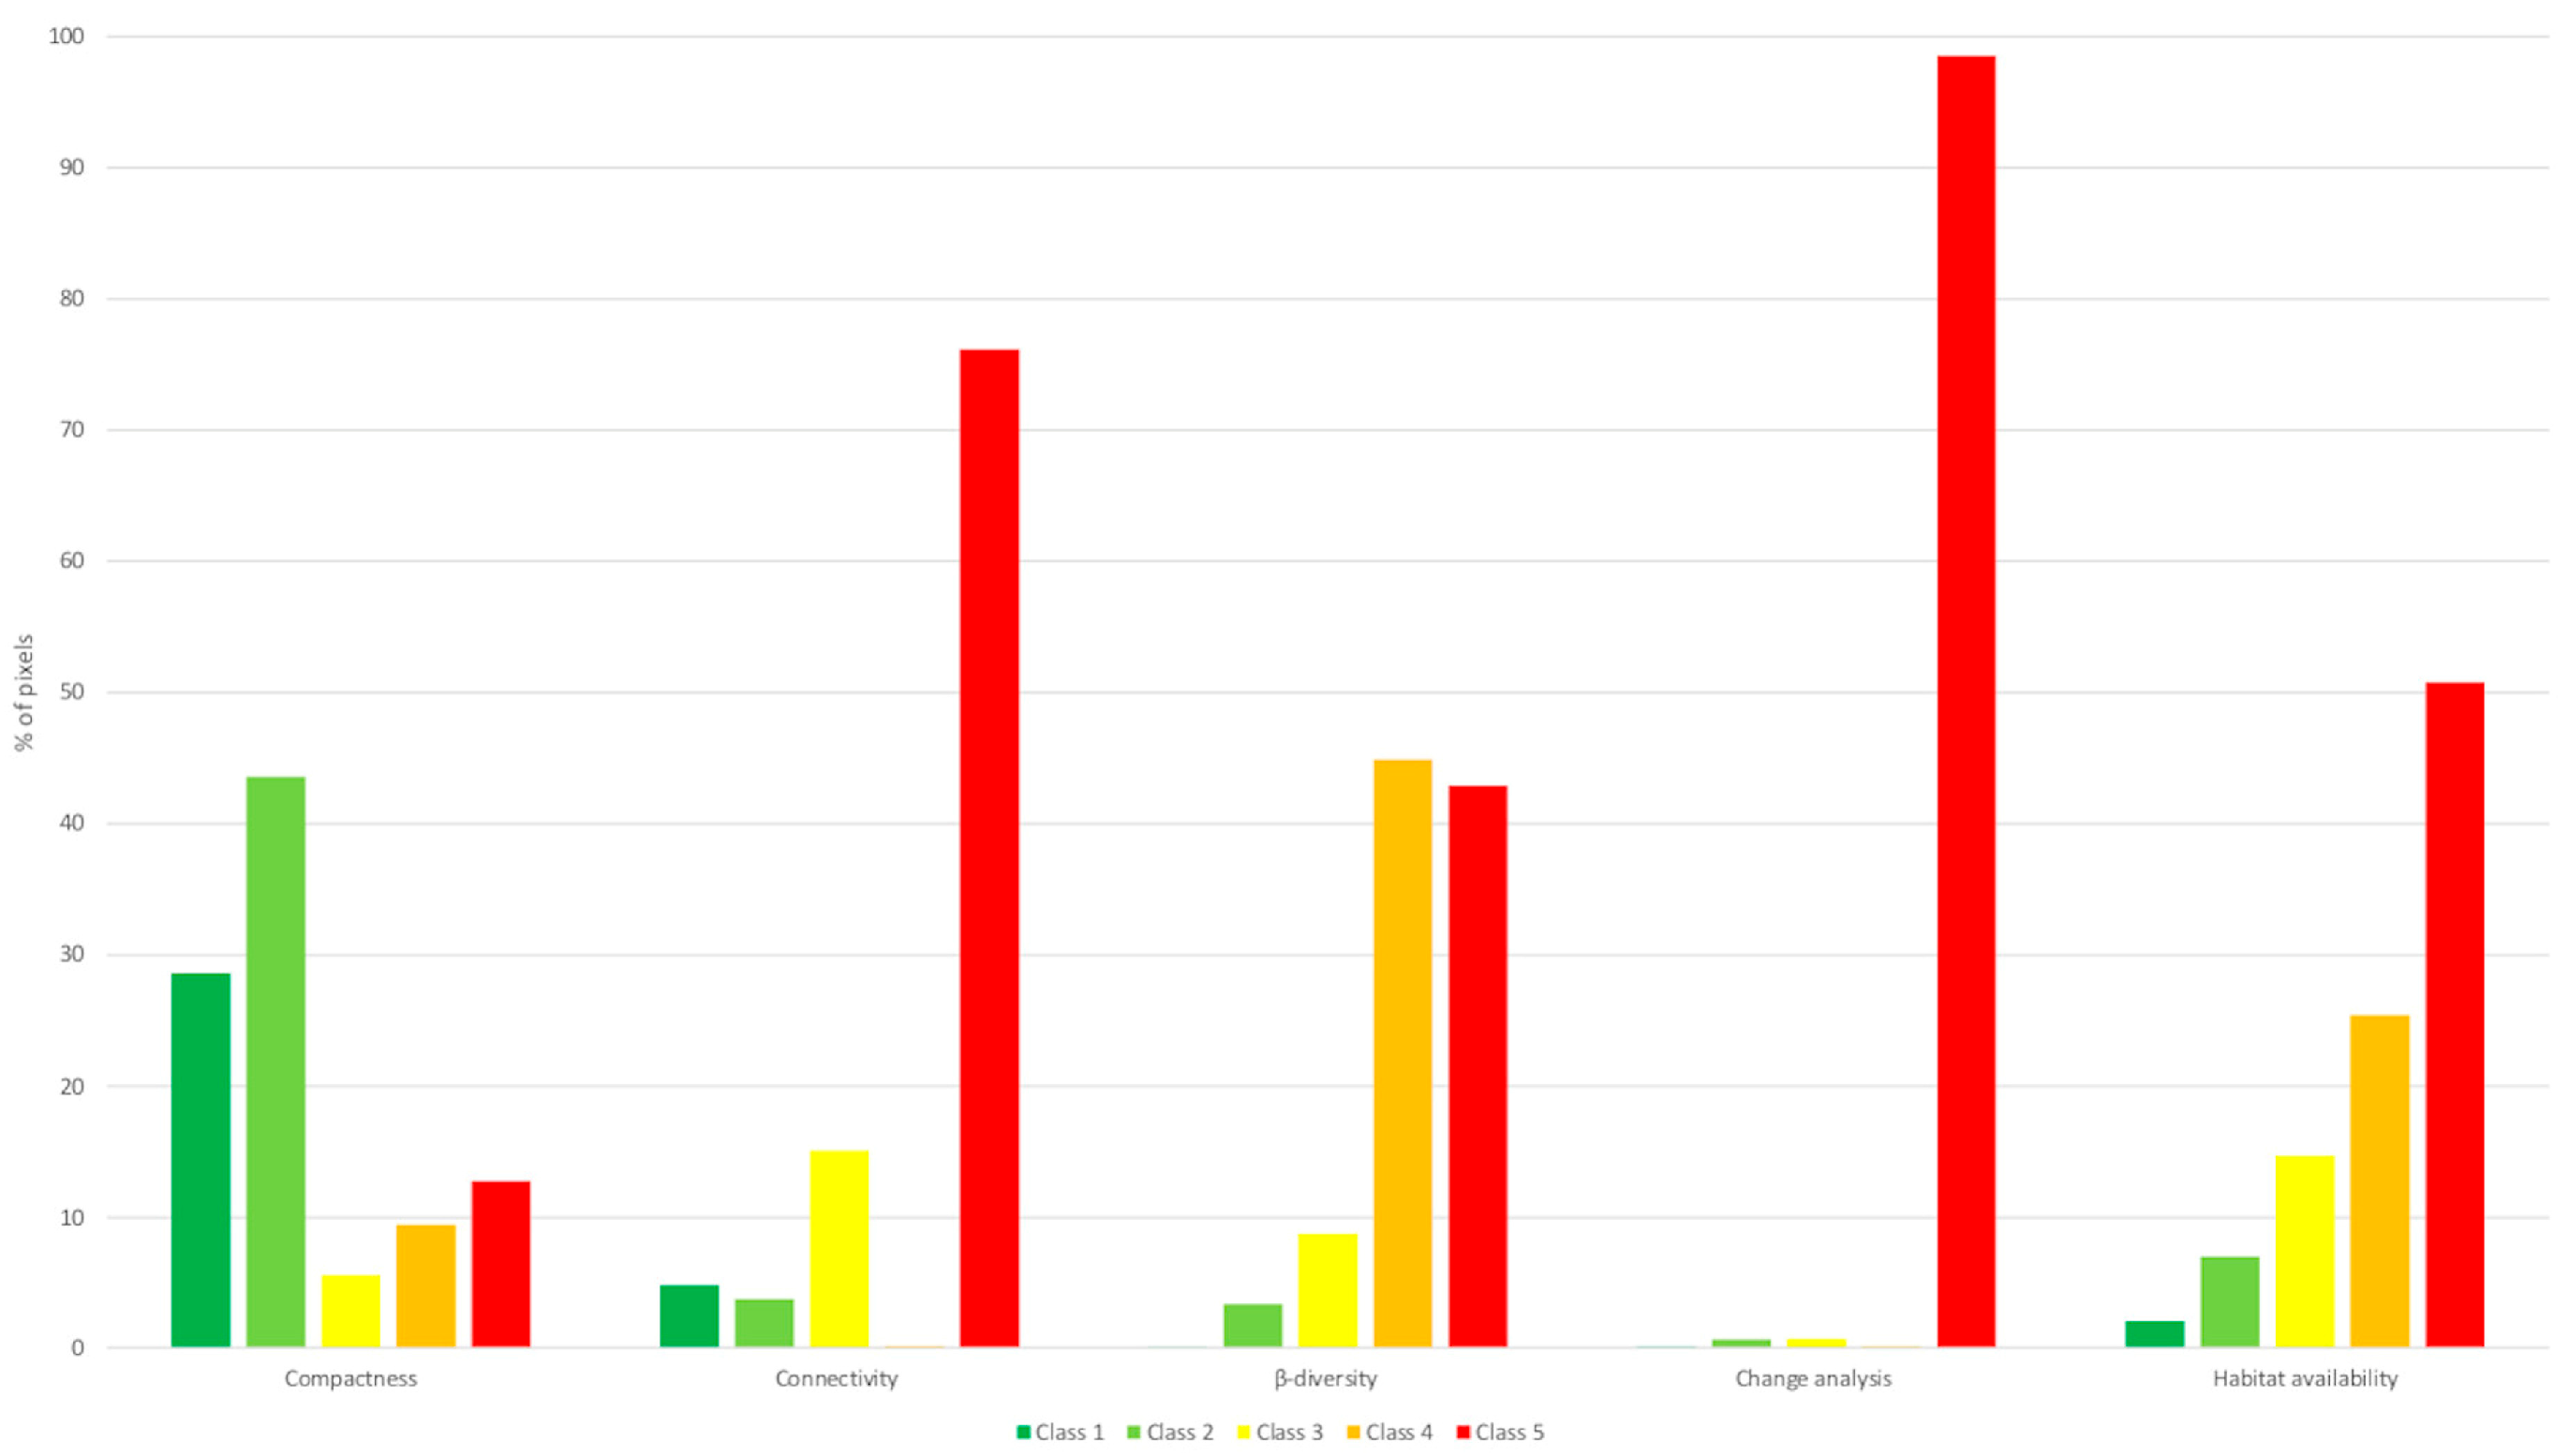
As shown in Figure 10, the identified priority areas considered all habitat types, with a high contribution from habitat classes one and two for compactness, class five for connectivity, classes four and five for β-diversity and habitat availability, and class five for benthic change over time. These regions represent optimal targets for conservation efforts across all prioritization scenarios.
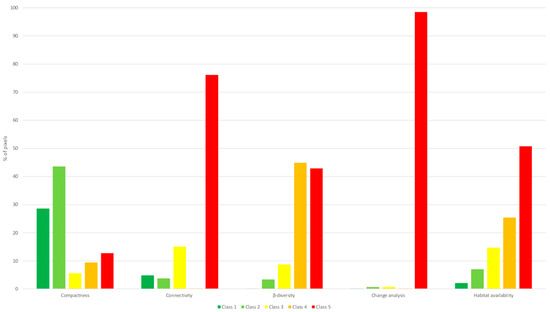
Figure 10.
Percentage of pixels of the AOI organized by habitat type, classified as high priority for conservation (values four and five) and grouped with the hotspot analysis tool for each seascape metric.
4. Discussion
The results of this study provide a spatially explicit prioritization framework that integrates multiple ecologically relevant variables to identify high-priority areas for conservation in the Cayo Arenas reef system, which has recently been incorporated as a core zone in a new marine protected area in the Gulf of Mexico. Using an iterative weighted overlay analysis, the final optimal map reflected areas of consistent overlap among habitat β-diversity, patch connectivity, benthic change, and habitat suitability for commercially important species. This approach highlights reef-associated habitats as key conservation targets and identifies eight priority areas characterized by low uncertainty and high ecological value.
By using all possible combinations of a WOA, this approach minimizes the limitations of traditional scoring methods, which often rely on arbitrary weight assignments [80]. Iterative modeling improves representativeness, complementarity, and resource efficiency by continuously refining priorities based on the interaction of selected sites and the performance of each variable across the seascape [80,81,82,83,84]. Systematic and reproducible models, such as this one, are especially important in the context of marine spatial prioritization, as flawed models (those that underestimate threats or overestimate ecological resilience) can mislead policy-making [85]. Once institutionalized, conservation policies based on limited models are extremely difficult to revise and often require substantial legal and bureaucratic effort [85,86]. This inertia can result in the continuation of ineffective or harmful policies, undermining biodiversity protection and public trust in science.
4.1. Seascape Metrics
The low mean value of patch compactness suggests a seascape structure dominated by relatively compact patches, such as sandy habitats and calcareous matrix dominated zones. The presence of large, compact, and homogeneous patches may be advantageous in terms of stability, as more compact patches tend to be less fragmented [87]. In addition, the greater spatial continuity of these patches could reduce exposure to edge effects and minimize habitat loss, favoring the persistence of species that depend on large, well-connected areas [88].
Shallow sandy areas characterized by compact and homogeneous patch structures dominate low-complexity zones, where abiotic factors primarily govern habitat variability [89]. The uniform distribution and consistent physical characteristics of sandy areas may reflect stable depositional conditions, reducing the likelihood of fragmentation [90]. Furthermore, the shallow sandy habitats in Cayo Arenas are often surrounded by calcareous matrix patches, which may serve as protective buffers against environmental stressors and physical disruptions. Interestingly, more irregular patches tended to have higher connectivity. This supports the notion that complex patch shapes with increased edge length and microhabitat diversity can facilitate biological exchange and species movement across habitats [91,92].
Higher β-diversity values at patch edges reflect the presence of transition zones with higher species turnover, reinforcing the idea that habitat edges are ecologically dynamic areas [93,94]. In contrast, lower β-diversity within the central areas of large patches may result from structural homogeneity, which limits niche differentiation [95]. This pattern was particularly evident in areas dominated by a single substrate type, such as sandy or calcareous matrix areas. Smaller patches located at the edges often exhibit greater β-diversity, as edge effects can alter both biotic and abiotic conditions, thereby enhancing habitat heterogeneity [96]. This aligns with findings in structurally complex systems, such as coral reefs and seagrass beds, where high β-diversity is associated with increased structural heterogeneity [25,41,97].
The habitat availability map for species of commercial interest revealed that the northern areas had a higher probability of occurrence of Serranidae species, consistent with the availability of favorable substrates and depth. Although crescent-shaped shallow zones cover large areas, environmental exposure and substrate type may limit their value as habitats or refuges. Fish distribution is not random but is often density-dependent, with individuals initially occupying optimal habitats before expanding into suboptimal areas as the density increases [98].
In this study, habitat availability was inferred from remotely sensed data in the absence of direct estimates of the fish biomass. However, integrating additional variables, such as hydrographic features, species-specific habitat preferences based on life history traits, and fishery use patterns could improve spatial prioritization and support more effective management [11,99,100,101].
Cayo Arenas faces serious challenges in managing its fisheries due to its remote location, which makes the enforcement of regulations difficult and expensive. Reaching this region involves the use of vessels with adequate deep-sea travel characteristics. Furthermore, red grouper fisheries (e.g., Epinephelus morio) have a high proportion of juvenile catches across fleets [102], and recreational fishing regulations often allow catches below the size at first maturity, thereby increasing the impact on populations [103].
Finally, the observed loss of the calcareous matrix habitat in high-energy areas and gains in cover in protected zones could be linked to sediment transport processes related to wave energy and currents [104,105,106] as, during the period between 2017 and 2023, there were no hurricanes that directly affected the seascape of the Cayo Arenas reef system. Additionally, slight changes detected in deeper areas may be associated with benthic cover shifts, possibly due to macroalgal growth, which has been shown to significantly alter satellite-derived reflectance [45].
Although the DeltaCue analysis does not rely on thematic classification and does not allow species or habitat-level interpretation, the observed changes in reflectance may reflect structural shifts in the dominant benthic components. At the current spatial resolution, habitats with building corals, such as Acropora spp. or Orbicella spp., are grouped within broader categories, such as regions dominated by a calcareous matrix. Therefore, while spatial change analysis highlights areas of increasing or decreasing reflectance, these changes likely reflect shifts in dominant structural components rather than specific taxa. In high energy zones, where regions are dominated by calcareous matrix, the detected decrease in cover may result from shifts toward soft-bodied benthic organisms [107], as field observations showed a high presence of Palythoa spp. in some of these areas.
4.2. Priority Areas for Conservation
The selection of priority sites using a spatial prioritization methodology, such as the WOA, has proven effective, especially when incorporating seascape metrics that allow the assessment of habitat structure, connectivity, and fragmentation [9,25,34].
The integration of metrics, such as β-diversity, connectivity, and patch compactness, allowed the identification of areas with high ecological value. In the optimal map obtained, the areas with the lowest priority for conservation values were concentrated in large patches dominated by calcareous matrix and sandy areas, habitats characterized by low substrate heterogeneity, low connectivity, and low β-diversity. This trend coincides with prioritization models, such as iterative zoning, which tend to discard less complex habitats [108,109]. Classes with high β-diversity, connectivity, and complexity coincided with patches of higher conservation priority. This trend has been documented in previous studies using seascape metrics for spatial prioritization [25]. Connectivity between different seascape elements is a fundamental principle in ecology and conservation strategies for spatial prioritization, as high connectivity ensures the maintenance of ecosystem services and biodiversity [110].
The high values of β-diversity at the edges of the large patches of calcareous matrix and sandy habitats show the function of these zones as transition areas between ecological communities. A mixture of adjacent habitat characteristics favors the coexistence of species with different ecological requirements [111,112]. Small and irregularly shaped patches with a higher proportion of edges tend to exhibit greater β-diversity [96]. In seascapes such as Cayo Arenas, the structural complexity of hard coral habitats seems to favor higher β-diversity. Interestingly, patch edges also showed low standard errors, possibly because of the stable conditions typical of transitional zones. These areas tend to combine favorable characteristics, such as high connectivity and species turnover (β-diversity), which reduce variability across iterations.
By integrating the optimal map with uncertainty analysis and hotspots, eight priority sites were identified. Regions with high ecological suitability and low uncertainty are robust candidates for targeted conservation actions [83,113], avoiding ineffective resource allocation. The standard error analysis showed that the identified areas with a high priority for conservation generally exhibited lower uncertainty, reflecting consistency across iterations. This indicates that the areas identified are reliable, even when considering extreme weight combinations, validating the final (optimal) outcome.
Habitat mapping based on satellite imagery is a valuable tool for the conservation of marine ecosystems. However, some limitations need to be considered. The spatial resolution of satellite images limit the detail with which habitats can be mapped [114]. Other, platforms can be used (e.g., drones and planes equipped with multispectral and hyperspectral sensors), but the spatial extent of the analysis and associated cost can limit their use. Furthermore, water depth strongly influences light absorption and the accuracy of benthic classification. Therefore, reef systems at depths > 25 m require alternative approaches [60].
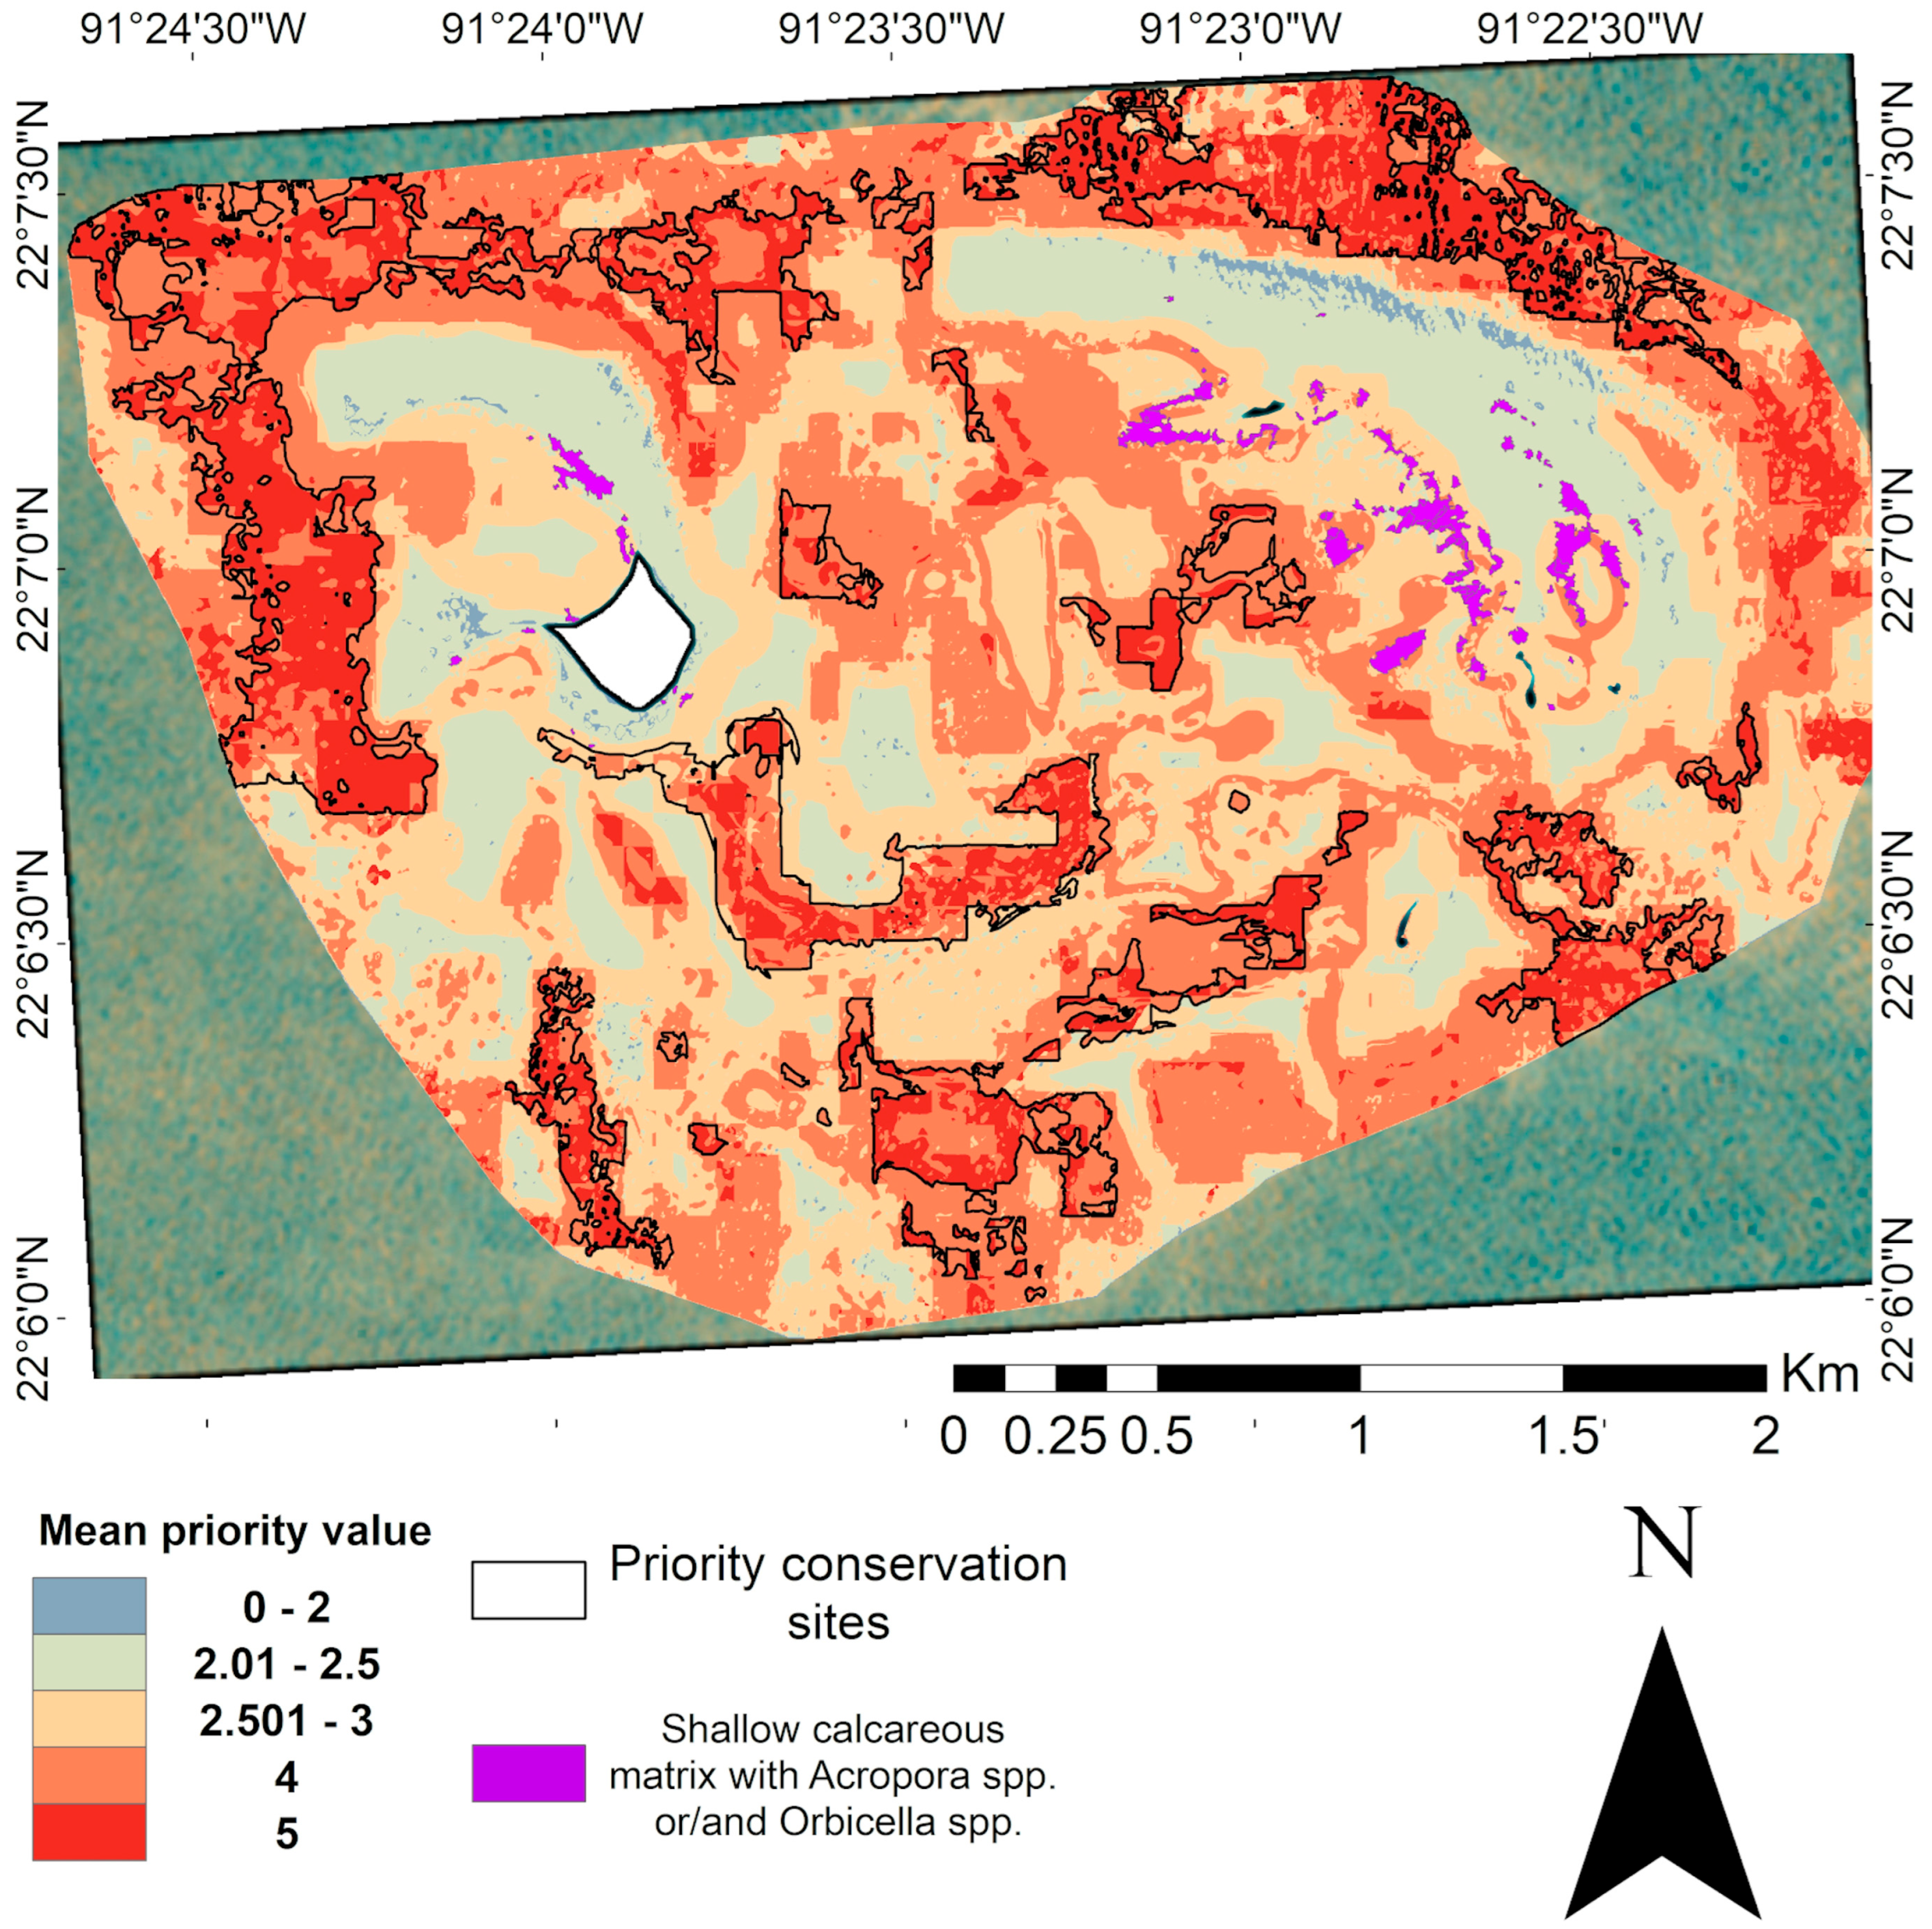
Despite the effectiveness of this prioritization approach, it is important to recognize that some ecologically relevant areas may not have been adequately represented in the final selection. The spatial resolution used in the analysis could underrepresent key species present in small patches, such as Acropora spp. and Orbicella spp. patches that have been observed in this area. This is evidence of the influence of scale on prioritization, where coarser resolutions favor general patterns and can omit relevant elements [115]. Areas identified during field surveys and visual drone imagery analysis with a high coverage of Acropora spp. and Orbicella spp., critically endangered genera of corals [116], were not considered in the iterative WOA. However, overlaying these zones with the current prioritization map can enhance conservation planning by capturing the fine-scale ecological value (Figure 11).
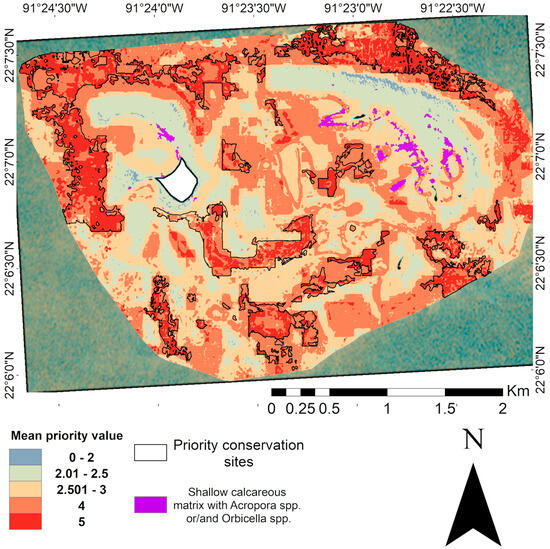
Figure 11.
Optimal map of Cayo Arenas with overlaying areas of high coverage of Acropora spp. and Orbicella spp. species, identified from field observations coupled with visual analysis of drone imagery. The white area in the map represents the masked island.
4.3. Implications for Conservation
In recent years, the implementation of marine protected areas (MPAs) as conservation strategies has increased significantly [117]. MPAs contribute to the sustainability of marine resources through the implementation of specific management programs that allow and restrict activities within their buffer and core zones. They also provide economic and social benefits to local populations by promoting recreational activities, tourism, and fishing [118,119].
At the political level, various environmental agendas have promoted the expansion of marine protection [120,121]. The effectiveness of these areas will depend on their ability to cope with increasing environmental and anthropogenic disturbances, and it is essential to allocate sufficient financial resources to enable the implementation of MPA regulations so that these tools can achieve their conservation objectives [9].
Although the creation of the SGMRNP and the inclusion of Cayo Arenas within one of its core zones seem to be a step forward for the conservation of marine ecosystems, the declaration was opportunistic rather than systematic.
The SGMRNP has a large extension of approximately 41,097.31 km2. As a National Park, its main objective is to strictly conserve biodiversity and ecological processes, significantly limiting human activities [122]. The declaration of the SGMRNP is similar to that of Revillagigedo National Park and the Mexican Caribbean Biosphere Reserve, another large MPAs in Mexico, where significant challenges have been identified in terms of management, monitoring, and enforcement of regulations, especially because of its remoteness and the limited presence of personnel, funding, and logistical resources [123,124,125,126,127,128].
The main social problems associated with the SGMRNP declaration are its economic impact on local and national fishing fleets [124,125] and ecotourism benefits [123]. Taken together, these problems may encourage the rejection of new marine reserves and provide incentives for illegal fishing if communities do not perceive alternative economic benefits.
The region where the SGMRNP is located faces challenges related to illegal fishing and limited surveillance capacity, driven by inequality and deficiencies in fisheries co-management [102,129]. Therefore, conservation strategies should go beyond focusing on protection within MPAs by promoting the participation of local communities and improving the selectivity of fishing gear [102].
The creation of MPAs does not always respond to sound ecological or social criteria and can leave key vulnerable ecosystems without effective protection [130,131,132]. The Cayo Arenas reef system (c.a. 10 km2) has been designated as a core zone of the SGMRNP, which covers 191.84 km2. The protected area has been officially declared by the federal government, which means that core and buffer areas are designated, but no specific sub-zoning (which is considered in Mexican legislation) is defined, and no management program has been established. Therefore, our results could be used to clearly define subzones within the Cayo Arenas reef system to limit the highest-restricted (no-take) areas to those identified. By doing this, the economic impact on ecotourism activities can be limited.
In the context of climate change, it is important to consider that core areas or no-take zones do not always show significant resistance to phenomena such as coral bleaching compared to less-protected areas. Protection through MPAs does not necessarily prevent the impacts of global warming [133], indicating that marine conservation must consider not only the territorial extension protected, but also ecological representativeness, complementarity, connectivity between habitats, and climate resilience [130].
This study integrates key ecological principles [28] to identify priority conservation sites. Thematic mapping is used to ensure the representativeness of habitats and associated species, whereas complementarity is achieved by including areas that add value to conservation through the use of β-diversity which emphasizes ecological gradients and changes in biotic assemblages, which are key to ensuring the persistence of biodiversity at multiple scales [9]. This metric is particularly valuable for conservation prioritization because it reflects both species turnover (replacement between sites) and nestedness (species gain or loss), thereby offering a broader understanding of the regional biodiversity. High turnover suggests the need to protect multiple distinct sites to capture overall diversity, whereas nestedness patterns prioritize the most species-rich locations [97,134]. Thus, the incorporation of β-diversity as a conservation prioritization criterion allows the identification of ecologically contrasting and complementary sites, unlike approaches that focus solely on species richness. In addition, the benthic spatial change analysis allowed us to consider areas with low change (naturally resilient), which was complemented by patch compactness and connectivity. Habitat availability for commercial species indirectly considers the use of the area for fishing activities.
Furthermore, the results of the iterative WOA highlighted habitats with greater substrate heterogeneity, primarily corresponding to moderate hard coral cover with other components (class one) and high calcareous matrix cover with other components (class two). These habitats contain foundational species that are critical for maintaining ecological connectivity and biodiversity.
As large-scale planning can fail to protect key patches within a habitat mosaic, incorporating multiple scales in future studies could improve the representation of small patches in conservation decision-making. The identification of priority sites does not seek to restrict their use but rather to identify areas where limited conservation resources are needed. To increase the acceptance and effectiveness of these measures, it is necessary to involve local communities and consider their socio-economic needs when designing conservation strategies.
5. Conclusions
Large-scale marine protected areas have the potential for marine conservation, but their effectiveness depends on proper management, continued investment in monitoring and infrastructure, and the participation of local stakeholders who depend on them. Simply expanding or establishing protected areas may not provide tangible benefits. Our results could assist in the elaboration of the management program of the SGMRNP, by limiting zones with high restrictions and allowing limited use by ecotourism providers.
The iterative WOA has proven to be an effective tool for identifying priority conservation areas, primarily by including multiple strategic ecological variables in the identification of conservation sites. Through this analysis, we generated an optimal map that facilitates informed decision-making by identifying eight priority patches characterized by heterogeneous habitats with a moderate presence of hard coral, high connectivity, and β-diversity, representing key sites for biodiversity and spatial management. This framework can be easily replicated in other core zones of the SGMRNP, which are mainly established in shallow areas with coral coverage, to define the sub-zonation based on ecological characteristics that maintain biodiversity. Nevertheless, the incorporation of other socio-ecological information is necessary. This will not only promote sustainability but also increase the social acceptance of these initiatives, reducing the potential social tensions associated with the exclusion of local stakeholders from the decision-making process, and balancing ecological, economic and socio-environmental objectives [135]. Identifying priority sites for conservation should ensure that conservation efforts focus on areas where they will have the greatest impact, minimizing the impact on local stake-holder activities.
The proactive protection of remote, unaltered areas represents a strategic opportunity to conserve biodiversity before it degrades, thus contributing to the resilience of marine ecosystems in the face of increasing human pressure and climate change.
Supplementary Materials
The following supporting information can be downloaded at: https://www.mdpi.com/article/10.3390/d17100708/s1, Table S1: Parameters used to construct the bathymetry map; Table S2: number of training and validation sites; Table S3: Confusion matrix for accuracy assessment; Table S4: Dissimilarity coefficients; Figure S1: Map of standard error.
Author Contributions
J.E.F.-V.: Conceptualization, formal analysis, methodology, validation, visualization, writing—original draft, writing—review, and editing. R.R.-N.: Conceptualization, investigation, methodology, supervision, validation, writing—original draft, writing—review and editing, funding acquisition. E.B.-F.: Methodology, investigation, visualization, writing—review, and editing. C.C.-V.: Data curation and investigation. L.A.-F.: Funding acquisition, writing—review, and editing. All authors have read and agreed to the published version of the manuscript.
Funding
This research was funded by the Programa de Apoyo a Proyectos de Investigación e Inovación Tecnológica grant number IG201323. J.E.F.-V. received a scholarship from the SECIHTI.
Institutional Review Board Statement
Not applicable.
Data Availability Statement
Raw data and scripts available at https://doi.org/10.6084/m9.figshare.30174889.v2.
Acknowledgments
We thank Daniela Monserrat Rojas Cano for her support during field work. During the preparation of the manuscript, the authors used PaperPal editing tool for language review and grammar correction. The authors have reviewed the output and take full responsibility for the content of this publication.
Conflicts of Interest
The authors declare no conflicts of interest.
References
- Lau, J.D.; Hicks, C.C.; Gurney, G.G.; Cinner, J.E. Disaggregating Ecosystem Service Values and Priorities by Wealth, Age, and Education. Ecosyst. Serv. 2018, 29, 91–98. [Google Scholar] [CrossRef]
- Moberg, F.; Folke, C. Ecological Goods and Services of Coral Reef Ecosystems. Ecol. Econ. 1999, 29, 215–233. [Google Scholar] [CrossRef]
- Downs, C.A.; Woodley, C.M.; Richmond, R.H.; Lanning, L.L.; Owen, R. Shifting the Paradigm of Coral-Reef ‘Health’ Assessment. Mar. Pollut. Bull. 2005, 51, 486–494. [Google Scholar] [CrossRef]
- Jones, G.P.; McCormick, M.I.; Srinivasan, M.; Eagle, J.V. Coral Decline Threatens Fish Biodiversity in Marine Reserves. Proc. Natl. Acad. Sci. USA 2004, 101, 8251–8253. [Google Scholar] [CrossRef]
- Hughes, T.P.; Baird, A.H.; Bellwood, D.R.; Card, M.; Connolly, S.R.; Folke, C.; Grosberg, R.; Hoegh-Guldberg, O.; Jackson, J.B.C.; Kleypas, J.; et al. Climate Change, Human Impacts, and the Resilience of Coral Reefs. Science 2003, 301, 929–933. [Google Scholar] [CrossRef] [PubMed]
- Hoegh-Guldberg, O.; Mumby, P.J.; Hooten, A.J.; Steneck, R.S.; Greenfield, P.; Gomez, E.; Harvell, C.D.; Sale, P.F.; Edwards, A.J.; Caldeira, K.; et al. Coral Reefs Under Rapid Climate Change and Ocean Acidification. Science 2007, 318, 1737–1742. [Google Scholar] [CrossRef] [PubMed]
- Pandolfi, J.M.; Bradbury, R.H.; Sala, E.; Hughes, T.P.; Bjorndal, K.A.; Cooke, R.G.; McArdle, D.; McClenachan, L.; Newman, M.J.H.; Paredes, G.; et al. Global Trajectories of the Long-Term Decline of Coral Reef Ecosystems. Science 2003, 301, 955–958. [Google Scholar] [CrossRef] [PubMed]
- Cruz Vázquez, C.; Rioja Nieto, R.; Enriquez, C. Spatial and Temporal Effects of Management on the Reef Seascape of a Marine Protected Area in the Mexican Caribbean. Ocean Coast. Manag. 2019, 169, 50–57. [Google Scholar] [CrossRef]
- Rioja Nieto, R.; Barrera Falcón, E.; Hinojosa Arango, G.; Riosmena Rodríguez, R. Benthic Habitat β-Diversity Modeling and Landscape Metrics for the Selection of Priority Conservation Areas Using a Systematic Approach: Magdalena Bay, Mexico, as a Case Study. Ocean Coast. Manag. 2013, 82, 95–103. [Google Scholar] [CrossRef]
- Jones, G.; Srinivasan, M.; Almany, G. Population Connectivity and Conservation of Marine Biodiversity. Oceanography 2007, 20, 100–111. [Google Scholar] [CrossRef]
- Eggertsen, L.; Goodell, W.; Cordeiro, C.A.M.M.; Cossa, D.; De Lucena, M.; Berkström, C.; Franco, J.N.; Ferreira, C.E.L.; Bandeira, S.; Gullström, M. Where the Grass Is Greenest in Seagrass Seascapes Depends on Life History and Simple Species Traits of Fish. Estuar. Coast. Shelf Sci. 2022, 266, 107738. [Google Scholar] [CrossRef]
- Abecasis, D.; Fragkopoulou, E.; Claro, B.; Assis, J. Biophysical Modelling and Graph Theory Identify Key Connectivity Hubs in the Mediterranean Marine Reserve Network. Front. Mar. Sci. 2023, 9, 1000687. [Google Scholar] [CrossRef]
- Liu, R.; Wang, Q.; Kong, H.; Li, Y. Priority Protected Areas for Mangrove Conservation in Coastal Guangdong, China: Addressing Climate and Land Cover Changes. Ocean Coast. Manag. 2025, 267, 107707. [Google Scholar] [CrossRef]
- Mumby, P.J. Connectivity of Reef Fish between Mangroves and Coral Reefs: Algorithms for the Design of Marine Reserves at Seascape Scales. Biol. Conserv. 2006, 128, 215–222. [Google Scholar] [CrossRef]
- Toledo, V.M. Repensar La Conservación: ¿áreas Naturales Protegidas o Estrategia Bioregional? Gac. Ecológica 2005, 77, 67–83. [Google Scholar]
- Nelson, J.; Bradner, H. The Case for Establishing Ecosystem-Scale Marine Reserves. Mar. Pollut. Bull. 2010, 60, 635–637. [Google Scholar] [CrossRef] [PubMed]
- Leenhardt, P.; Cazalet, B.; Salvat, B.; Claudet, J.; Feral, F. The Rise of Large-Scale Marine Protected Areas: Conservation or Geopolitics? Ocean Coast. Manag. 2013, 85, 112–118. [Google Scholar] [CrossRef]
- Antonio Puppim De Oliveira, J. Implementing Environmental Policies in Developing Countries Through Decentralization: The Case of Protected Areas in Bahia, Brazil. World Dev. 2002, 30, 1713–1736. [Google Scholar] [CrossRef]
- Bezaury-Creel, J.E. Protected Areas and Coastal and Ocean Management in México. Ocean Coast. Manag. 2005, 48, 1016–1046. [Google Scholar] [CrossRef]
- Rioja Nieto, R.; Álvarez Filip, L. Coral Reef Systems of the Mexican Caribbean: Status, Recent Trends and Conservation. Mar. Pollut. Bull. 2019, 140, 616–625. [Google Scholar] [CrossRef]
- Bobadilla, M.; Alvarez-Borrego, S.; Avila-Foucat, S.; Lara-Valencia, F.; Espejel, I. Evolution of Environmental Policy Instruments Implemented for the Protection of Totoaba and the Vaquita Porpoise in the Upper Gulf of California. Environ. Sci. Policy 2011, 14, 998–1007. [Google Scholar] [CrossRef]
- Edgar, G.J.; Stuart-Smith, R.D.; Willis, T.J.; Kininmonth, S.; Baker, S.C.; Banks, S.; Barrett, N.S.; Becerro, M.A.; Bernard, A.T.F.; Berkhout, J.; et al. Global Conservation Outcomes Depend on Marine Protected Areas with Five Key Features. Nature 2014, 506, 216–220. [Google Scholar] [CrossRef] [PubMed]
- Teh, L.C.L.; Teh, L.S.L.; Pitcher, T.J. A Tool for Site Prioritisation of Marine Protected Areas under Data Poor Conditions. Mar. Policy 2012, 36, 1290–1300. [Google Scholar] [CrossRef]
- Wood, L.J.; Dragicevic, S. GIS-Based Multicriteria Evaluation and Fuzzy Sets to Identify Priority Sites for Marine Protection. Biodivers. Conserv. 2007, 16, 2539–2558. [Google Scholar] [CrossRef]
- Ortiz Cajica, A.K.; Hinojosa-Arango, G.; Garza-Pérez, J.R.; Rioja-Nieto, R. Seascape Metrics, Spatio-Temporal Change, and Intensity of Use for the Spatial Conservation Prioritization of a Caribbean Marine Protected Area. Ocean Coast. Manag. 2020, 194, 105265. [Google Scholar] [CrossRef]
- Pittman, S.J.; Poti, M.; Jeffrey, C.F.G.; Kracker, L.M.; Mabrouk, A. Decision Support Framework for the Prioritization of Coral Reefs in the U.S. Virgin Islands. Use Spat. Ecol. Conserv. 2018, 47, 26–34. [Google Scholar] [CrossRef]
- Stelzenmüller, V.; Lee, J.; South, A.; Foden, J.; Rogers, S.I. Practical Tools to Support Marine Spatial Planning: A Review and Some Prototype Tools. Mar. Policy 2013, 38, 214–227. [Google Scholar] [CrossRef]
- Possingham, H.; Wilson, K.; Andelman, S.; Vynne, C. Protected Areas: Goals, Limitations, and Design. In Principles of Conservation Biology; Groom, M., Meefe, G., Carrol, C., Eds.; Sinauer Associates, Inc.: Sunderland, MA, USA, 2006; pp. 509–533. [Google Scholar]
- Ball, I.R.; Possingham, H.P.; Watts, M.E. Marxan and Relatives: Software for Spatial Conservation Prioritization. In Spatial Conservation Prioritization; Moilanen, A., Wilson, K.A., Possingham, H.P., Eds.; Oxford University Press: Oxford, UK, 2009; pp. 185–195. ISBN 978-0-19-954776-0. [Google Scholar]
- Moilanen, A.; Franco, A.M.A.; Early, R.I.; Fox, R.; Wintle, B.; Thomas, C.D. Prioritizing Multiple-Use Landscapes for Conservation: Methods for Large Multi-Species Planning Problems. Proc. R. Soc. B Biol. Sci. 2005, 272, 1885–1891. [Google Scholar] [CrossRef]
- Mir, A.H.; Sarma, K.; Upadhaya, K. Assessing the Effectiveness of Community Managed Forests for Plant Diversity Conservation in Meghalaya, Northeast India. Plant Divers. 2022, 44, 243–254. [Google Scholar] [CrossRef]
- Ghoneim, S.M.; Yehia, M.A.; Salem, S.M.; Ali, H.F. Integrating Remote Sensing Data, GIS Analysis and Field Studies for Mapping Alteration Zones at Wadi Saqia Area, Central Eastern Desert, Egypt. Egypt. J. Remote Sens. Space Sci. 2022, 25, 323–336. [Google Scholar] [CrossRef]
- Ranith, R.; Senthilnathan, L.; Machendiranathan, M.; Thangaradjou, T.; Sasamal, S.K.; Choudhury, S.B. Mapping Sites of Reef Vulnerability along Lagoons of Lakshadweep Archipelago, Indian Ocean. Environ. Monit. Assess. 2017, 189, 494. [Google Scholar] [CrossRef]
- Boström, C.; Pittman, S.; Simenstad, C.; Kneib, R. Seascape Ecology of Coastal Biogenic Habitats: Advances, Gaps, and Challenges. Mar. Ecol. Prog. Ser. 2011, 427, 191–217. [Google Scholar] [CrossRef]
- Pittman, S.J.; Monaco, M.E.; Friedlander, A.M.; Legare, B.; Nemeth, R.S.; Kendall, M.S.; Poti, M.; Clark, R.D.; Wedding, L.M.; Caldow, C. Fish with Chips: Tracking Reef Fish Movements to Evaluate Size and Connectivity of Caribbean Marine Protected Areas. PLoS ONE 2014, 9, e96028. [Google Scholar] [CrossRef] [PubMed]
- Swanborn, D.J.B.; Huvenne, V.A.I.; Pittman, S.J.; Woodall, L.C. Bringing Seascape Ecology to the Deep Seabed: A Review and Framework for Its Application. Limnol. Oceanogr. 2022, 67, 66–88. [Google Scholar] [CrossRef]
- Weeks, R. Incorporating Seascape Connectivity in Conservation Prioritisation. PLoS ONE 2017, 12, e0182396. [Google Scholar] [CrossRef]
- Pittman, S.; Yates, K.; Bouchet, P.; Alvarez-Berastegui, D.; Andréfouët, S.; Bell, S.; Berkström, C.; Boström, C.; Brown, C.; Connolly, R.; et al. Seascape Ecology: Identifying Research Priorities for an Emerging Ocean Sustainability Science. Mar. Ecol. Prog. Ser. 2021, 663, 1–29. [Google Scholar] [CrossRef]
- Ashtab, D.; Gholamalifard, M.; Jokar, P.; Kostianoy, A.G.; Semenov, A.V. Spatial Planning of Marine Protected Areas (MPAs) in the Southern Caspian Sea: Comparison of Multi-Criteria Evaluation (MCE) and Simulated Annealing Algorithm. J. Mar. Sci. Eng. 2024, 12, 123. [Google Scholar] [CrossRef]
- Cuevas, E.; Uribe-Martínez, A.; Morales-Ojeda, S.M.; Gómez-Ruíz, P.A.; Núñez-Lara, E.; Teutli-Hernández, C.; Herrera-Silveira, J.A. Spatial Configuration of Seagrass Community Attributes in a Stressed Coastal Lagoon, Southeastern Gulf of Mexico. Reg. Stud. Mar. Sci. 2021, 48, 102049. [Google Scholar] [CrossRef]
- Harborne, A.R.; Mumby, P.J.; Żychaluk, K.; Hedley, J.D.; Blackwell, P.G. Modeling the Beta Diversity of Coral Reefs. Ecology 2006, 87, 2871–2881. [Google Scholar] [CrossRef] [PubMed]
- Andréfouët, S.; Muller-Karger, F.E.; Hochberg, E.J.; Hu, C.; Carder, K.L. Change Detection in Shallow Coral Reef Environments Using Landsat 7 ETM+ Data. Remote Sens. Environ. 2001, 78, 150–162. [Google Scholar] [CrossRef]
- Kabiri, K.; Pradhan, B.; Samimi-Namin, K.; Moradi, M. Detecting Coral Bleaching, Using QuickBird Multi-Temporal Data: A Feasibility Study at Kish Island, the Persian Gulf. Estuar. Coast. Shelf Sci. 2013, 117, 273–281. [Google Scholar] [CrossRef]
- Shapiro, A.; Rohmann, S. Summit-to-Sea Mapping and Change Detection Using Satellite Imagery: Tools for Conservation and Management of Coral Reefs. Rev. Biol. Trop. 2005, 53, 185–193. [Google Scholar] [PubMed]
- Shapiro, A.C.; Rohmann, S.O. Mapping Changes in Submerged Aquatic Vegetation Using Landsat Imagery and Benthic Habitat Data: Coral Reef Ecosystem Monitoring in Vieques Sound between 1985 and 2000. Bull. Mar. Sci. 2006, 79, 375–388. [Google Scholar]
- Zacharias, M.A.; Gregr, E.J. Sensitivity and Vulnerability in Marine Environments: An Approach to Identifying Vulnerable Marine Areas. Conserv. Biol. 2005, 19, 86–97. [Google Scholar] [CrossRef]
- Dobson, J.E. NOAA Coastal Change Analysis Program (C-CAP): Guidance for Regional Implementation; U.S. Department of Commerce: Seattle, DC, USA, 1995. [Google Scholar]
- Pittman, S.J.; Connor, D.W.; Radke, L.; Wright, D.J. 1.09—Application of Estuarine and Coastal Classifications in Marine Spatial Management. In Treatise on Estuarine and Coastal Science; Wolanski, E., McLusky, D., Eds.; Academic Press: Waltham, MA, USA, 2011; pp. 163–205. ISBN 978-0-08-087885-0. [Google Scholar]
- Pittman, S.J.; Swanborn, D.J.B.; Connor, D.W.; Wright, D.J. Application of Estuarine and Coastal Classifications in Marine Spatial Management. In Treatise on Estuarine and Coastal Science, 2nd ed.; Elsevier: Amsterdam, The Netherlands, 2024; pp. 205–276. ISBN 978-0-323-91042-2. [Google Scholar]
- Selig, E.R.; Bruno, J.F. A Global Analysis of the Effectiveness of Marine Protected Areas in Preventing Coral Loss. PLoS ONE 2010, 5, e9278. [Google Scholar] [CrossRef]
- Bellwood, D.R.; Pratchett, M.S.; Morrison, T.H.; Gurney, G.G.; Hughes, T.P.; Álvarez-Romero, J.G.; Day, J.C.; Grantham, R.; Grech, A.; Hoey, A.S.; et al. Coral Reef Conservation in the Anthropocene: Confronting Spatial Mismatches and Prioritizing Functions. Biol. Conserv. 2019, 236, 604–615. [Google Scholar] [CrossRef]
- Jordán-Dahlgren, E.; Rodríguez-Martínez, R.E. The Atlantic Coral Reefs of Mexico. In Latin American Coral Reefs; Elsevier: Amsterdam, The Netherlands, 2003; pp. 131–158. ISBN 978-0-444-51388-5. [Google Scholar]
- Busby, R.F. Sediments and Reef Corals of Cayo Arenas, Campeche Bank, Yucatán, Mexico; US Naval Oceanographic Office: Hancock, MS, USA, 1965; Volume 187. [Google Scholar]
- Logan, B.W.; Bass, M.N.; Cebulski, D.E. Carbonate Sediments and Reefs, Yucatán Shelf, Mexico; McBirney, A.R., Ed.; American Association of Petroleum Geologists: Tulsa, OK, USA, 1969. [Google Scholar]
- Gobierno de México. DECRETO por el que se Declara Área Natural Protegida Arrecifes del Golfo de México-Sur, con la Categoría de Parque Nacional, la Superficie de 4,109,731-42-56.09 Hectáreas, Ubicada en el Golfo de México; Diario Oficial de la Federación: Cuauhtémoc, México, 2024. [Google Scholar]
- Cabrera Rivera, E.; Molina-Hernández, A.; Medellín-Maldonado, F.; Guendulain-García, S.; Pérez-Cervantes, E.; Rioja-Nieto, R.; Medina-Valmaseda, A.E.; Alvarez-Filip, L. Night surveys reveal abundant populations of sea urchins with high erosive potential in Cayo Arenas, Banco de Campeche. Cienc. Mar. 2025, 50, e3508. [Google Scholar] [CrossRef]
- Chávez, H. Peces colectados en el arrecife Triángulos Oeste y en cayo Arenas, Sonda de Campeche, México. Acta Zool. Mex. 1966, 8, 1–12. [Google Scholar]
- Chavez, P.S. An Improved Dark-Object Subtraction Technique for Atmospheric Scattering Correction of Multispectral Data. Remote Sens. Environ. 1988, 24, 459–479. [Google Scholar] [CrossRef]
- Hedley, J.D.; Harborne, A.R.; Mumby, P.J. Technical Note: Simple and Robust Removal of Sun Glint for Mapping Shallow-water Benthos. Int. J. Remote Sens. 2005, 26, 2107–2112. [Google Scholar] [CrossRef]
- Green, E.P.; Edwards, A.J. Remote Sensing Handbook for Tropical Coastal Management; UNESCO Großbritannien, Ed.; Coastal Management Sourcebooks; Unesco Publishing: Paris, France, 2000; ISBN 978-92-3-103736-8. [Google Scholar]
- Lyzenga, D.R. Remote Sensing of Bottom Reflectance and Water Attenuation Parameters in Shallow Water Using Aircraft and Landsat Data. Int. J. Remote Sens. 1981, 2, 71–82. [Google Scholar] [CrossRef]
- Schowengerdt, R.A. Chapter 7—Correction and Calibration. In Remote Sensing, 3rd ed.; Schowengerdt, R.A., Ed.; Academic Press: Burlington, VT, USA, 2007; pp. 285–354. ISBN 978-0-12-369407-2. [Google Scholar]
- Stumpf, R.P.; Holderied, K.; Sinclair, M. Determination of Water Depth with High-resolution Satellite Imagery over Variable Bottom Types. Limnol. Oceanogr. 2003, 48, 547–556. [Google Scholar] [CrossRef]
- Schowengerdt, R.A. Chapter 9—Thematic Classification. In Remote Sensing, 3rd ed.; Schowengerdt, R.A., Ed.; Academic Press: Burlington, VT, USA, 2007; pp. 387–455. ISBN 978-0-12-369407-2. [Google Scholar]
- Mumby, P.J.; Harborne, A.R. Development of a Systematic Classification Scheme of Marine Habitats to Facilitate Regional Management and Mapping of Caribbean Coral Reefs. Biol. Conserv. 1999, 88, 155–163. [Google Scholar] [CrossRef]
- Congalton, R.G. A Review of Assessing the Accuracy of Classifications of Remotely Sensed Data. Remote Sens. Environ. 1991, 37, 35–46. [Google Scholar] [CrossRef]
- McGarigal, K. FRAGSTATS Help; University of Massachusetts: Amherst, MA, USA, 2015; Volume 182. [Google Scholar]
- Rioja-Nieto, R.; Sheppard, C. Effects of Management Strategies on the Landscape Ecology of a Marine Protected Area. Ocean Coast. Manag. 2008, 51, 397–404. [Google Scholar] [CrossRef]
- SAGARPA. ACUERDO por el que se Da a Conocer el Plan de Manejo Pesquero de Mero (Epinephelus Morio) y Especies Asociadas en la Península de Yucatán; Diario Oficial de la Federación: Cuauhtémoc, México, 2014. [Google Scholar]
- Monroy García, C.; Galindo Cortes, G.; Hernandez Flores, Á. Mero Epinephelus Morio, En La Península de Yucatán. In Sustentabilidad Pesca Responsab. En México Eval. Manejo; INAPESCA-SAGARPA: Ciudad México, México, 2014; pp. 243–278. [Google Scholar]
- Albañez Lucero, M.O.; Arreguín Sánchez, F. Modelling the Spatial Distribution of Red Grouper (Epinephelus Morio) at Campeche Bank, México, with Respect Substrate. Ecol. Model. 2009, 220, 2744–2750. [Google Scholar] [CrossRef]
- Brulé, T.; Nóh-Quiñones, V.E.; Sánchez-Crespo, M.; Colás-Marrufo, T. Composición de las Capturas Comerciales del Complejo Mero-pargo en el Sureste del Golfo de México e Implicaciones para el Manejo de su Pesquería. Gulf Caribb. Fish. Inst. Proc. 2009, 61, 199–209. [Google Scholar]
- Hernandez, A.; Seijo, J.C. Spatial Distribution Analysis of Red Grouper (Epinephelus morio) Fishery in Yucatan, Mexico. Fish. Res. 2003, 63, 135–141. [Google Scholar] [CrossRef]
- López Rocha, J.A.; Arreguín Sánchez, F. Spatial Distribution of Red Grouper Epinephelus Morio (Serranidae) Catchability on the Campeche Bank of Mexico. J. Appl. Ichthyol. 2008, 24, 282–289. [Google Scholar] [CrossRef]
- Grüss, A.; Thorson, J.T.; Sagarese, S.R.; Babcock, E.A.; Karnauskas, M.; Walter, J.F.; Drexler, M. Ontogenetic Spatial Distributions of Red Grouper (Epinephelus morio) and Gag Grouper (Mycteroperca microlepis) in the U.S. Gulf of Mexico. Fish. Res. 2017, 193, 129–142. [Google Scholar] [CrossRef]
- Locker, S.D.; Reed, J.K.; Farrington, S.; Harter, S.; Hine, A.C.; Dunn, S. Geology and Biology of the “Sticky Grounds”, Shelf-Margin Carbonate Mounds, and Mesophotic Ecosystem in the Eastern Gulf of Mexico. Cont. Shelf Res. 2016, 125, 71–87. [Google Scholar] [CrossRef]
- Sluka, R.D.; Chiappone, M.; Sealey, K.M.S. Influence of Habitat on Grouper Abundance in the Florida Keys, U.S.A. J. Fish Biol. 2001, 58, 682–700. [Google Scholar] [CrossRef]
- ERDAS. IMAGINE DeltaCue. User’s Guide; ERDAS Inc.: Norcross, GA, USA, 2008. [Google Scholar]
- Rojas-Cano, D.M. Priorización Sistemática para la Conservación del Parque Nacional Arrecife de Puerto Morelos mediante el Uso de Sistemas de Información Geográfica y Percepción Remota. Tesis de Mestría. 2023. Available online: https://tesiunamdocumentos.dgb.unam.mx/ptd2023/marzo/0837098/Index.html (accessed on 12 September 2024).
- Kullberg, P.; Toivonen, T.; Montesino Pouzols, F.; Lehtomäki, J.; Di Minin, E.; Moilanen, A. Complementarity and Area-Efficiency in the Prioritization of the Global Protected Area Network. PLoS ONE 2015, 10, e0145231. [Google Scholar] [CrossRef]
- Church, R.L.; Stoms, D.M.; Davis, F.W. Reserve Selection as a Maximal Covering Location Problem. Biol. Conserv. 1996, 76, 105–112. [Google Scholar] [CrossRef]
- Kirkpatrick, J.B. An Lterative Method for Establishing Priorities for the Selection of Nature Reserves: An Example From Tasmania. Biol. Conserv. 1983, 25, 127–134. [Google Scholar] [CrossRef]
- Turpie, J.K. Prioritizing South African Estuaries for Conservation: A Practical Example Using Waterbirds. Biol. Conserv. 1995, 74, 175–185. [Google Scholar] [CrossRef]
- Kujala, H.; Moilanen, A.; Araújo, M.B.; Cabeza, M. Conservation Planning with Uncertain Climate Change Projections. PLoS ONE 2013, 8, e53315. [Google Scholar] [CrossRef]
- Shoemaker, K.T.; Loope, K.J. We Need Better Ways to Re-Evaluate Conservation Policies When They’re Founded on Flawed Research. Proc. Natl. Acad. Sci. USA 2025, 122, e2426166122. [Google Scholar] [CrossRef]
- Swanson, D.; Barg, S.; Tyler, S.; Venema, H.; Tomar, S.; Bhadwal, S.; Nair, S.; Roy, D.; Drexhage, J. Seven Tools for Creating Adaptive Policies. Technol. Forecast. Soc. Change 2010, 77, 924–939. [Google Scholar] [CrossRef]
- Dellafiore, C.M.; Gallego Fernández, J.B.; Vallés, S.M. Habitat Use for Warren Building by European Rabbits (Oryctolagus cuniculus) in Relation to Landscape Structure in a Sand Dune System. Acta Oecologica 2008, 33, 372–379. [Google Scholar] [CrossRef]
- Ou, D.; Zhang, Q.; Tang, H.; Qin, J.; Yu, D.; Deng, O.; Gao, X.; Liu, T. Ecological Spatial Intensive Use Optimization Modeling with Framework of Cellular Automata for Coordinating Ecological Protection and Economic Development. Sci. Total Environ. 2023, 857, 159319. [Google Scholar] [CrossRef]
- Helder, N.K.; Burns, J.H.R.; Green, S.J. Intra-Habitat Structural Complexity Drives the Distribution of Fish Trait Groups on Coral Reefs. Ecol. Indic. 2022, 142, 109266. [Google Scholar] [CrossRef]
- Rusciadelli, G.; Ricci, C.; Lathuilière, B. The Ellipsactinia Limestones of the Marsica Area (Central apennines): A Reference Zonation Model for Upper Jurassic Intra-Tethys Reef Complexes. Sediment. Geol. 2011, 233, 69–87. [Google Scholar] [CrossRef]
- Dong, Y.; Liu, S.; Pei, X.; Wang, Y. Identifying Critical Landscape Patterns for Simultaneous Provision of Multiple Ecosystem Services—A Case Study in the Central District of Wuhu City, China. Ecol. Indic. 2024, 158, 111380. [Google Scholar] [CrossRef]
- Weißhuhn, P. Indexing the Vulnerability of Biotopes to Landscape Changes. Ecol. Indic. 2019, 102, 316–327. [Google Scholar] [CrossRef]
- Arias-González, J.E.; Legendre, P.; Rodríguez-Zaragoza, F.A. Scaling up Beta Diversity on Caribbean Coral Reefs. J. Exp. Mar. Biol. Ecol. 2008, 366, 28–36. [Google Scholar] [CrossRef]
- Kark, S.; Van Rensburg, B.J. Ecotones: Marginal or Central Areas of Transition? Isr. J. Ecol. Evol. 2006, 52, 29–53. [Google Scholar] [CrossRef]
- Alados, C.L.; Navarro, T.; Komac, B.; Pascual, V.; Martinez, F.; Cabezudo, B.; Pueyo, Y. Do Vegetation Patch Spatial Patterns Disrupt the Spatial Organization of Plant Species? Ecol. Complex. 2009, 6, 197–207. [Google Scholar] [CrossRef]
- Liu, Q.; Buyantuev, A.; Wu, J.; Niu, J.; Yu, D.; Zhang, Q. Intensive Land-Use Drives Regional-Scale Homogenization of Plant Communities. Sci. Total Environ. 2018, 644, 806–814. [Google Scholar] [CrossRef]
- Rodil, I.F.; Lohrer, A.M.; Attard, K.M.; Hewitt, J.E.; Thrush, S.F.; Norkko, A. Macrofauna Communities across a Seascape of Seagrass Meadows: Environmental Drivers, Biodiversity Patterns and Conservation Implications. Biodivers. Conserv. 2021, 30, 3023–3043. [Google Scholar] [CrossRef]
- Carson, S.; Shackell, N.; Mills Flemming, J. Local Overfishing May Be Avoided by Examining Parameters of a Spatio-Temporal Model. PLoS ONE 2017, 12, e0184427. [Google Scholar] [CrossRef]
- Alvarez-Berastegui, D.; Ciannelli, L.; Aparicio-Gonzalez, A.; Reglero, P.; Hidalgo, M.; López-Jurado, J.L.; Tintoré, J.; Alemany, F. Spatial Scale, Means and Gradients of Hydrographic Variables Define Pelagic Seascapes of Bluefin and Bullet Tuna Spawning Distribution. PLoS ONE 2014, 9, e109338. [Google Scholar] [CrossRef]
- Caldow, C.; Monaco, M.E.; Pittman, S.J.; Kendall, M.S.; Goedeke, T.L.; Menza, C.; Kinlan, B.P.; Costa, B.M. Biogeographic Assessments: A Framework for Information Synthesis in Marine Spatial Planning. Mar. Policy 2015, 51, 423–432. [Google Scholar] [CrossRef]
- Stamoulis, K.A.; Delevaux, J.M.S. Data Requirements and Tools to Operationalize Marine Spatial Planning in the United States. Ocean Coast. Manag. 2015, 116, 214–223. [Google Scholar] [CrossRef]
- Rincón-Sandoval, L.A.; López-Rocha, J.A. Performance Indicators of the Red Grouper (Epinephelus morio) Fishery along the Yucatan Coast, Southeast Mexico. Mar. Policy 2024, 169, 106333. [Google Scholar] [CrossRef]
- Quiñones-Peraza, A.; Villegas-Hernández, H.; Guillén-Hernández, S.; Poot-López, G.R. Recreational Fishing and Angling Tournaments in the Yucatan Coast (Campeche Bank, Mexico): Social and Biological Dimensions. Reg. Stud. Mar. Sci. 2023, 61, 102897. [Google Scholar] [CrossRef]
- Storlazzi, C.D.; Field, M.E.; Bothner, M.H.; Presto, M.K.; Draut, A.E. Sedimentation Processes in a Coral Reef Embayment: Hanalei Bay, Kauai. Mar. Geol. 2009, 264, 140–151. [Google Scholar] [CrossRef]
- Sartori, G.; Boles, E.L.; Monismith, S.G.; Mumby, P.J.; Dunbar, R.B.; Khrizman, A.; Tatebe, L.; Capozzi, R. Morphologically Driven Sedimentation Patterns on a Coral Reef. Coral Reefs 2025, 44, 591–607. [Google Scholar] [CrossRef]
- Ouillon, S.; Douillet, P.; Lefebvre, J.P.; Le Gendre, R.; Jouon, A.; Bonneton, P.; Fernandez, J.M.; Chevillon, C.; Magand, O.; Lefèvre, J.; et al. Circulation and Suspended Sediment Transport in a Coral Reef Lagoon: The South-West Lagoon of New Caledonia. Mar. Pollut. Bull. 2010, 61, 269–296. [Google Scholar] [CrossRef] [PubMed]
- Suchanek, T.H.; Green, D.J. Interspecific Competition between Palythoa Caribaeorum and Other Sessile Invertebrates on St. Croix Reefs, US Virgin Islands. In Proceedings of the Fourth International Coral Reef Symposium, Manila, Philippines, 18–22 May 1981; Volume 2, pp. 679–684. [Google Scholar]
- Bekessy, S.A.; White, M.; Gordon, A.; Moilanen, A.; Mccarthy, M.A.; Wintle, B.A. Transparent Planning for Biodiversity and Development in the Urban Fringe. Landsc. Urban Plan. 2012, 108, 140–149. [Google Scholar] [CrossRef]
- Moilanen, A. Planning Impact Avoidance and Biodiversity Offsetting Using Software for Spatial Conservation Prioritisation. Wildl. Res. 2013, 40, 153. [Google Scholar] [CrossRef]
- Kukkala, A.S.; Moilanen, A. Ecosystem Services and Connectivity in Spatial Conservation Prioritization. Landsc. Ecol. 2017, 32, 5–14. [Google Scholar] [CrossRef] [PubMed]
- Pitacco, V.; Mistri, M.; Aleffi, I.F.; Lardicci, C.; Prato, S.; Tagliapietra, D.; Munari, C. Spatial Patterns of Macrobenthic Alpha and Beta Diversity at Different Scales in Italian Transitional Waters (Central Mediterranean). Estuar. Coast. Shelf Sci. 2019, 222, 126–138. [Google Scholar] [CrossRef]
- Switzer, R.D.; Parnell, P.E.; Leichter, J.L.; Driscoll, N.W. The Effects of Tectonic Deformation and Sediment Allocation on Shelf Habitats and Megabenthic Distribution and Diversity in Southern California. Estuar. Coast. Shelf Sci. 2016, 169, 25–37. [Google Scholar] [CrossRef]
- Ebrahimi, E.; Ahmadzadeh, F.; Abdoli, A.; Araújo, M.B.; Naimi, B. Refined Gap Analysis for Biodiversity Conservation under Climate Change. Biol. Conserv. 2025, 305, 111054. [Google Scholar] [CrossRef]
- Wilson, K.L.; Wong, M.C.; Devred, E. Comparing Sentinel-2 and WorldView-3 Imagery for Coastal Bottom Habitat Mapping in Atlantic Canada. Remote Sens. 2022, 14, 1254. [Google Scholar] [CrossRef]
- Tanhuanpää, T.; Mikkonen, N.; Kujala, H.; Heinaro, E.; Mäyrä, J.; Kumpula, T. Input Data Resolution Affects the Conservation Prioritization Outcome of Spatially Sparse Biodiversity Features. Ambio 2023, 52, 1793–1803. [Google Scholar] [CrossRef]
- Cortés-Useche, C.; Muñiz-Castillo, A.I.; Calle-Triviño, J.; Yathiraj, R.; Arias-González, J.E. Reef Condition and Protection of Coral Diversity and Evolutionary History in the Marine Protected Areas of Southeastern Dominican Republic. Reg. Stud. Mar. Sci. 2019, 32, 100893. [Google Scholar] [CrossRef]
- Burbano, D.V.; Meredith, T.C.; Mulrennan, M.E. Exclusionary Decision-Making Processes in Marine Governance: The Rezoning Plan for the Protected Areas of the ‘Iconic’ Galapagos Islands, Ecuador. Ocean Coast. Manag. 2020, 185, 105066. [Google Scholar] [CrossRef]
- Rasheed, A.R. Marine Protected Areas and Human Well-Being—A Systematic Review and Recommendations. Ecosyst. Serv. 2020, 41, 101048. [Google Scholar] [CrossRef]
- Villasante, S.; Ainsworth, G.B.; Pita, P.; Belgrano, A.; Bennett, N.; Sumaila, U.R. The Role of Marine Protected Areas (MPAs) in Providing Ecosystem Services to Improve Ocean and Human Health. In Oceans and Human Health; Elsevier: Amsterdam, The Netherlands, 2023; pp. 23–37. ISBN 978-0-323-95227-9. [Google Scholar]
- Patrizzi, N.S.; Barros, F.; Giglio, V.J. Media Bias on Communicating Conservation Interventions: The Case of Large-Scale Marine Protected Areas in the South Atlantic. Mar. Policy 2023, 149, 105475. [Google Scholar] [CrossRef]
- Rees, W.G. Physical Principles of Remote Sensing, 3rd ed.; Cambridge University Press: Cambridge, UK, 2012; ISBN 978-1-107-00473-3. [Google Scholar]
- Reyes-Bonilla, H. Coral Reefs of the Pacific Coast of México. In Latin American Coral Reefs; Elsevier: Amsterdam, The Netherlands, 2003; pp. 331–349. ISBN 978-0-444-51388-5. [Google Scholar]
- Cisneros-Montemayor, A.M.; Becerril-García, E.E.; Berdeja-Zavala, O.; Ayala-Bocos, A. Shark Ecotourism in Mexico: Scientific Research, Conservation, and Contribution to a Blue Economy. In Advances in Marine Biology; Elsevier: Amsterdam, The Netherlands, 2020; Volume 85, pp. 71–92. ISBN 978-0-12-822199-0. [Google Scholar]
- Lynham, J.; Villaseñor-Derbez, J.C. Evidence of Spillover Benefits from Large-Scale Marine Protected Areas to Purse Seine Fisheries. Science 2024, 386, 1276–1281. [Google Scholar] [CrossRef]
- Saenz-Arroyo, A.; Camacho-Valdez, V. Large-Scale Marine Protected Areas by Decree: Lessons Learned from the Creation of the Revillagigedo Marine Park. Sustainability 2022, 14, 4027. [Google Scholar] [CrossRef]
- Del Pilar Blanco-Parra, M.; Niño-Torres, C.A. Elasmobranchs of the Mexican Caribbean: Biodiversity and Conservation Status. Environ. Biol. Fishes 2022, 105, 151–165. [Google Scholar] [CrossRef]
- Espinosa-Andrade, N.; Suchley, A.; Reyes-Bonilla, H.; Alvarez-Filip, L. The No-Take Zone Network of the Mexican Caribbean: Assessing Design and Management for the Protection of Coral Reef Fish Communities. Biodivers. Conserv. 2020, 29, 2069–2087. [Google Scholar] [CrossRef]
- Suchley, A.; Alvarez-Filip, L. Local Human Activities Limit Marine Protection Efficacy on Caribbean Coral Reefs. Conserv. Lett. 2018, 11, e12571. [Google Scholar] [CrossRef]
- Hernández-Delgado, F.; Aguilar-Perera, A.; Giglio, V.J.; Nóh-Quiñones, V.; Euán-Ávila, J.I.; De Jesús Aguilar-Cordero, W.; Sélem-Salas, C.I. Stakeholders’ Perception on Consumption, Fishing, and Conservation of Red Grouper, Epinephelus Morio, off the Northern Coast of the Yucatan Peninsula, Mexico. Mar. Policy 2024, 161, 105999. [Google Scholar] [CrossRef]
- O’Leary, B.C.; Ban, N.C.; Fernandez, M.; Friedlander, A.M.; García-Borboroglu, P.; Golbuu, Y.; Guidetti, P.; Harris, J.M.; Hawkins, J.P.; Langlois, T.; et al. Addressing Criticisms of Large-Scale Marine Protected Areas. BioScience 2018, 68, 359–370. [Google Scholar] [CrossRef]
- Singleton, R.L.; Roberts, C.M. The Contribution of Very Large Marine Protected Areas to Marine Conservation: Giant Leaps or Smoke and Mirrors? Mar. Pollut. Bull. 2014, 87, 7–10. [Google Scholar] [CrossRef] [PubMed]
- Wang, B. The Outlook for the Establishment and Management of Marine Protected Area Network in China. Int. J. Geoheritage Parks 2018, 6, 32–42. [Google Scholar] [CrossRef]
- Côté, I.M.; Darling, E.S. Rethinking Ecosystem Resilience in the Face of Climate Change. PLoS Biol. 2010, 8, e1000438. [Google Scholar] [CrossRef] [PubMed]
- Baselga, A. Partitioning the Turnover and Nestedness Components of Beta Diversity. Glob. Ecol. Biogeogr. 2010, 19, 134–143. [Google Scholar] [CrossRef]
- Pennino, M.G.; Brodie, S.; Frainer, A.; Lopes, P.F.M.; Lopez, J.; Ortega-Cisneros, K.; Selim, S.; Vaidianu, N. The Missing Layers: Integrating Sociocultural Values into Marine Spatial Planning. Front. Mar. Sci. 2021, 8, 633198. [Google Scholar] [CrossRef]
Disclaimer/Publisher’s Note: The statements, opinions and data contained in all publications are solely those of the individual author(s) and contributor(s) and not of MDPI and/or the editor(s). MDPI and/or the editor(s) disclaim responsibility for any injury to people or property resulting from any ideas, methods, instructions or products referred to in the content. |
© 2025 by the authors. Licensee MDPI, Basel, Switzerland. This article is an open access article distributed under the terms and conditions of the Creative Commons Attribution (CC BY) license (https://creativecommons.org/licenses/by/4.0/).

