Article

Genetic Monitoring of the Endangered Acipenser dabryanus Using a High-Resolution MNP System

1
Institute for Systems Biology, School of Life Sciences, Jianghan University, Wuhan 430056, China
2
Key Laboratory of Three Gorges Project for Conservation of Fishes, Yichang 443100, China
3
Sturgeon Research Institute, China Three Gorges Corporation, Yichang 443100, China
*
Authors to whom correspondence should be addressed.
These authors contributed equally to this work.
Diversity 2025, 17(10), 704; https://doi.org/10.3390/d17100704
Submission received: 7 September 2025 / Revised: 5 October 2025 / Accepted: 7 October 2025 / Published: 11 October 2025

Abstract

Acipenser dabryanus, once abundant in China’s freshwater ecosystems, is now extinct in the wild. Effective genetic tools are urgently needed to support conservation efforts under the Yangtze River Protection Law and the 10-year fishing ban. Traditional molecular markers (e.g., COI, SSR, SNP) often lack sufficient resolution for fine-scale population assessment. Here, we developed a high-resolution Multiple-Nucleotide Polymorphism (MNP) system for A. dabryanus, comprising 424 newly developed, highly polymorphic markers optimized for multiplex PCR and high-throughput sequencing. The MNP system demonstrated excellent performance in individual fin tissue samples, successfully distinguishing Acipenser sinensis and Acipenser ruthenus individuals from the A. dabryanus population. In addition, 41 characteristic alleles specific to A. dabryanus were further identified. Across samples, it achieved >90% MNP locus detection rate, with an average of 7.48 alleles per locus, 66.5% heterozygosity, >98% reproducibility, and 99% accuracy. A strong correlation was observed between DNA concentration and spike-in-based copy numbers (R2 > 0.99), and sensitivity analysis confirmed reliable detection at ~1 copy/reaction. Application of the system across 97 samples, including 51 A. dabryanus tissue samples and 46 water environmental samples, revealed clear population structure with an average genetic differentiation of 70.45%, highlighting substantial genetic diversity within the sampled populations. Based on the above experimental results, the high-resolution MNP system has the potential to enable construction of population-specific allelic genotypes to distinguish wild individuals from released ones and, when applied to tissue and eDNA samples, to facilitate monitoring of migration pathways and habitat connectivity. Such applications could provide essential genetic information to evaluate release programs, guide conservation strategies, and inform habitat restoration for the recovery of A. dabryanus.

1. Introduction

Acipenser dabryanus, an endemic and once commercially important freshwater fish species in China, has experienced a dramatic population decline in recent decades [1,2]. Historically, this species played a significant economic role in the Yangtze River basin, with Food and Agriculture Organization (FAO) records indicating peak annual catches of about 25 tons in the 1970s, while its caviar commanded prices up to $5000 per kilogram in international markets. According to FAO and World Wide Fund for Nature (WWF) reports, global sturgeon catches have also dropped by over 99% in the past three decades, underscoring both the former economic importance of sturgeons and the severity of their decline [3]. The primary causes of this decline include overfishing, illegal sand mining, dam construction, and other human activities [4,5]. In 2022, the International Union for Conservation of Nature (IUCN) (https://www.iucnredlist.org/species/231/61462199 (accessed on 21 July 2022)) officially declared A. dabryanus extinct in the wild. As a result, captive breeding of A. dabryanus and the release of captive-bred individuals into the wild may represent the last hope for ensuring the species’ survival and long-term sustainability. To accurately and promptly assess the current status of released individuals and evaluate the effectiveness of ongoing conservation efforts, it is imperative to develop precise and efficient monitoring tools. These tools must be capable of reliably detecting A. dabryanus in complex aquatic environments, evaluating genetic diversity, and tracking changes in population structure over time. In support of such efforts, the Yangtze River Protection Law of the People’s Republic of China, enacted in 2021, explicitly encourages population assessment and conservation research on 19 key aquatic wildlife species, including A. dabryanus. Therefore, integrating advanced molecular detection technologies with national conservation strategies is essential to support the recovery and long-term management of A. dabryanus.
Traditional monitoring methods, such as direct capture or sonar-based surveys, are often invasive, labor-intensive, or limited in sensitivity. In contrast, environmental DNA (eDNA) analysis offers a non-invasive, efficient, and scalable solution for aquatic species surveillance. eDNA refers to the DNA that organisms continuously shed into their surrounding environment through sloughed skin cells, excreta, bodily fluids, or decaying tissues [6,7,8,9,10]. These extracellular fragments can persist in water for a limited period, allowing for their extraction and amplification using molecular techniques, which enables species detection without the need to physically capture individuals. As a result, eDNA is particularly suitable for monitoring rare or elusive species such as A. dabryanus [11], especially under current regulatory constraints like the 10-year fishing ban in the Yangtze River, which prohibits invasive sampling methods.
However, current eDNA-based approaches still face several limitations in resolution, specificity, and genotyping power. Commonly used markers, including mitochondrial DNA barcoding (e.g., COI, Cytb, 12S rRNA and 16S rRNA) [12,13,14], simple sequence repeats (SSR) [15], and single-nucleotide polymorphisms (SNPs) [16], each have inherent drawbacks. Although COI barcoding is effective for species-level identification, its reliance on a standard sequence length (~600 bp) limits its utility for degraded eDNA samples [17], resulting in low sensitivity and limited resolution, especially for closely related taxa [18,19]. Moreover, the use of Sanger sequencing often leads to unreadable overlapping peaks when applied to mixed environmental samples, limiting its applicability in eDNA-based monitoring. To address the challenges posed by degraded samples, metabarcoding and mini-COI barcodes (~100–200 bp) have been developed in recent years [20,21,22]. Nonetheless, metabarcoding [23,24,25] is frequently affected by primer bias and incomplete reference databases, leading to inaccurate identification of certain taxa and limited ability to quantitatively assess species abundance [26,27]. While mini-COI barcodes are better suited for degraded DNA, their short length reduces the amount of genetic information available, resulting in lower taxonomic resolution and decreased identification accuracy, and they are often difficult to match with existing full-length barcode databases [20]. SSR, though highly polymorphic, suffer from low throughput and amplification slippage [28,29,30], compromising accuracy in complex eDNA samples. SNP markers, by contrast, are abundant and stable throughout the genome and have been widely used in genetic diversity and population studies. Single-nucleotide polymorphism sites (SNPs) also serve as the basis for constructing taxonomic units such as Operational Taxonomic Units (OTUs) or Amplicon Sequence Variants (ASVs), enabling accurate species identification in high-throughput sequencing contexts. However, traditional bi-allelic SNPs exhibit limited resolution in highly polymorphic populations, making them unsuitable for individual-level tracking or fine-scale population structure analysis, especially in low-abundance, mixed, or degraded eDNA samples [31].
To overcome these limitations, we propose the application of multiple-nucleotide polymorphism (MNP) markers, combined with next-generation sequencing (NGS), as a robust, high-resolution genetic tool for monitoring A. dabryanus. An MNP marker refers to a group of multiple dispersed SNPs within a genomic segment whose length is less than 300 bp [32], offering greater allelic diversity and higher discriminatory power than traditional SNPs. The ability to differentiate individuals is based on the unique combinations of SNPs present in each MNP allele. They are particularly suited for analyzing low-abundance or degraded DNA, which is common in environmental surveillance. MNP genotyping is highly compatible with multiplex PCR and NGS workflows, thereby enabling cost-effective, high-throughput, and accurate analyses. Currently, MNP markers have demonstrated high stability and resolution across both diploid and polyploid genomes [33,34,35,36,37]. Building upon these advantages, we developed a species-specific MNP system for A. dabryanus and demonstrated its application in conservation monitoring. The system targets short, highly polymorphic loci and allows for efficient detection and genotyping using NGS platforms. In practice, DNA is extracted from fish tissue or environmental water samples, followed by multiplex PCR amplification of selected MNP loci. Amplicons are then sequenced and analyzed to detect the presence of A. dabryanus, assess genetic diversity, and monitor population structure over time. This approach provides a sensitive, scalable, and non-invasive solution to support long-term conservation and monitoring of this critically endangered species.
As part of current conservation measures, artificial breeding, release, and habitat protection and restoration are proposed for A. dabryanus [38,39]. The MNP system, as a high-resolution molecular tool, can be integrated into these strategies. For example, by establishing characteristic allelic genotypes for both released individuals and wild populations, the MNP system can reliably distinguish between the two groups. This would allow for effective evaluation of release effectiveness, such as assessing survival rates, reproductive contributions, and genetic diversity. By providing such genetic evidence, MNP technology can play a critical role in optimizing release strategies and supporting habitat restoration and management, thus offering essential technical support for the conservation of A. dabryanus.

2. Materials and Methods

2.1. Sample Collection and DNA Extraction

A total of 53 fin tissue samples (see Supplementary File S1) were collected from captive sturgeon individuals maintained at the Chinese Sturgeon Research Institute of China Three Gorges Corporation (CTG), including 51 samples from Acipenser dabryanus, 1 from Acipenser ruthenus, and 1 from Acipenser sinensis. To develop a high-resolution MNP marker system for genetic analysis of A. dabryanus, 30 representative individuals were selected for restriction-site associated DNA sequencing. The remaining 21 A. dabryanus samples and two non-target sturgeon samples (Acipenser sinensis and Acipenser ruthenus) were subsequently used to evaluate the amplification performance of the designed MNP primers. Each fin sample was immediately preserved in absolute ethanol and stored at −20 °C until further analysis. This study was performed in line with the principles of the Declaration of Helsinki and the guidelines and regulations of the National Institute of Health Guide for the Care and Use of Laboratory Animals, China. We received permits to conduct this research from the ethics board of the Chinese Sturgeon Research Institute, Yichang, China (Approval ID: CSRI2023625; Approval Date: 27 June 2023).
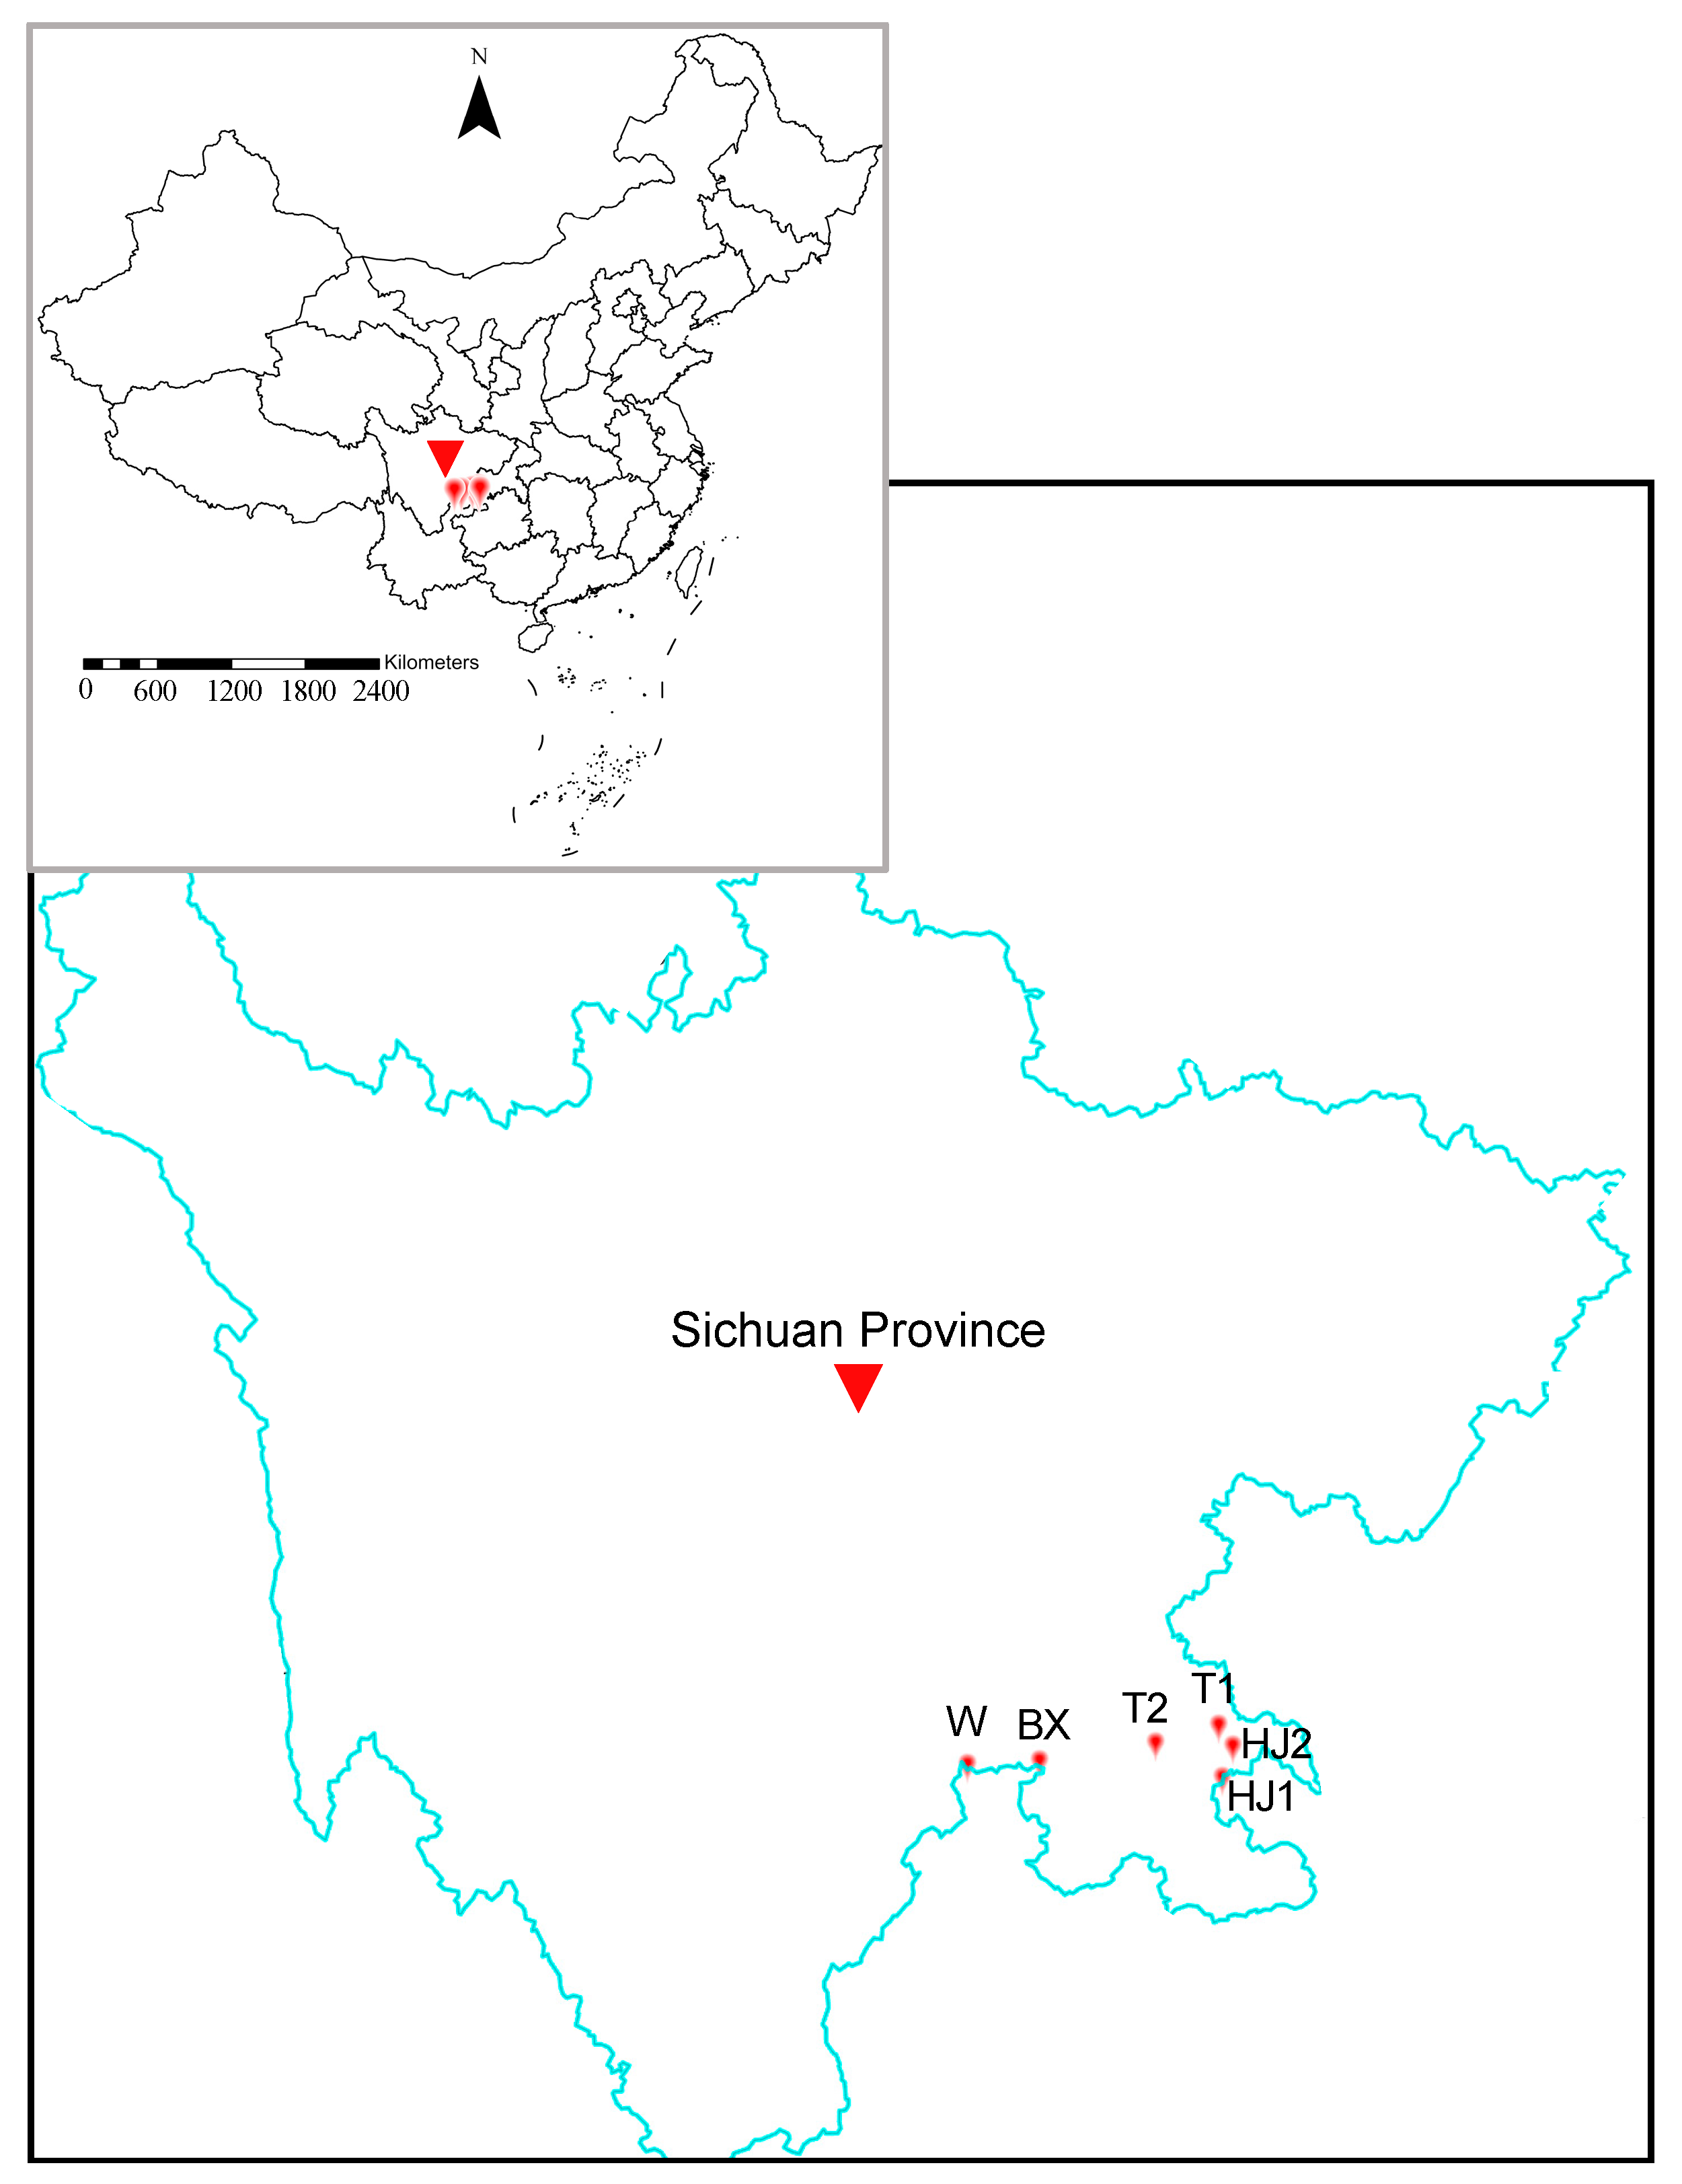
In addition, 46 environmental water samples (see Supplementary File S2) were collected from six major sites along the Yangtze River: BX (downstream of Xiangjiaba Dam, Jinsha River, Yibin), W (the lower reach of the Jinsha River), HJ1 (downstream of Chishui River Port, Hejiang), HJ2 (Chishui River Port, Hejiang), T1 (downstream of Luzhou), and T2 (upstream of Luzhou). At each site, water sampling was conducted at three transects representing the left (L), middle (M), and right (R) sides of the river channel. For each transect, three replicate samples were collected (e.g., L1, L2, L3; M1, M2, M3; R1, R2, R3). However, some transects did not yield all three replicates, possibly due to sampling errors or sample damage during field collection or transport.
For each sample, 2 L of surface river water were collected and filtered on-site using 0.45 µm mixed cellulose ester membranes to capture eDNA. All sampling equipment and filtration devices, including filter holders and tubing, were thoroughly sterilized prior to each use by wiping with 10% bleach solution for at least 10 min, followed by rinsing twice with nuclease-free water to remove any residual bleach. To monitor potential contamination, field blank controls consisting of nuclease-free water were filtered in parallel using the same procedures and equipment. The filters were immediately placed into sterile tubes, stored on ice during transport, and transferred to −80 °C upon return to the laboratory.
Genomic DNA extraction was performed separately for tissue and environmental samples in physically isolated laboratory areas to prevent cross-contamination. DNA from fin tissues was extracted using the TIANamp Genomic DNA Kit (Tiangen Biotech, Beijing, China), following the manufacturer’s instructions. For water samples, DNA was extracted from filter membranes using the Jianshi DNA Extraction Kit for water samples (Jianshi Biotech, Wuhan, China), according to the recommended protocol. All extractions were carried out using sterile, DNA-free consumables, and environmental DNA extractions were conducted prior to any manipulation of high-concentration tissue samples on each experimental day.

2.2. Restriction-Site Associated DNA (RAD) Sequencing

Next, genomic DNA from the 30 representative A. dabryanus individuals was digested with Mse I and EcoR I-HF and ligated to barcoded adapters. The resulting fragments were then PCR-amplified to construct RAD libraries [40], followed by size selection to enrich for fragments around 300 bp in length. Paired-end sequencing was subsequently performed using Nextera XT reagents (Illumina, San Diego, CA, USA), and final sequencing was carried out on the Illumina Novoseq platform provided by Novogene, following the manufacturer’s protocols.

2.3. MNP Marker Screening and Primer Design in A. dabryanus

RAD sequencing data from 30 A. dabryanus individuals were demultiplexed and quality-filtered, and the clean reads were aligned to the reference genome (SRR15851056) which was downloaded from NCBI for the screening of MNP markers by means of Bowtie2 [41]. Subsequently, all SNPs were identified through the application of Samtools-mpileup [42]. After that, the sliding-window approach was adopted to search for candidate MNP marker sites within the entire genome. A genomic region of 125 bp was chosen, and the SNPs within this region were counted. To evaluate the polymorphism and genotyping resolution of each candidate region, the discriminative power (DP) was calculated based on pairwise comparisons of genotypes among all samples using the following formula [36]:
D P = i = 1 a 1 j = i + 1 a δ   ( g i g j ) a 2
where a is the total number of samples in which the marker was detected, gi and gj denote the genotypes of samples i and j, respectively, and δ (gigj) is an indicator function that equals 1 if the two genotypes are different and 0 otherwise. The numerator represents the number of distinguishable sample pairs, while the denominator corresponds to the total number of sample pairs under comparison.
If a genomic region contains more than 3 dispersed SNPs and has a depth proportion greater than 0.2, it is considered a candidate MNP marker site. A sliding window of 20 bp is then applied to re-evaluate these criteria across the genome. Candidate MNP loci were further filtered and used for primer design based on the following criteria: (1) The marker sequence must be specific to A. dabryanus and absent in other species, as confirmed by comparison with the NCBI NT database. (2) The marker must correspond to a single-copy region in the genome. (3) The region must contain at least three non-contiguous SNPs. (4) The sequence length must range between 100 and 300 bp. (5) The candidate markers should be evenly distributed across the genome.
Corresponding primer pairs were designed using the AmpliSeq platform (https://www.ampliseq.com (accessed on 20 May 2024)) to enable multiplex PCR amplification. During this process, primers were carefully optimized to meet the following criteria: avoiding more than three terminal repeats, maintaining a GC content between 40% and 70%, and ensuring that the last 15 bases at the 3′ end did not exhibit any non-specific binding sites within the genome. If any primers failed to meet these requirements, they were iteratively redesigned by slightly adjusting the binding region within the target sequence until all parameters were satisfied; if redesign was not successful, the candidate locus was discarded. Based on these criteria, a total of 424 high-resolution MNP markers and primers applicable to A. dabryanus were selected.

2.4. MNP System Workflow: From Library Construction to High-Throughput Sequencing for A. dabryanus

A total of 53 tissue samples and 46 water eDNA samples were subjected to MNP marker library construction. All primers were first diluted to a concentration of 100 µM. Subsequently, 10 µL of each primer was pipetted into the primer mix pool. The multi-PCR reaction system was composed of 4 µL of template DNA, 8 µL of primer mix, 10 µL GenoPlex 3×T Master mix, and 8 µL of ddH2O, with a total reaction mixture volume of 30 μL. To minimize potential contamination, a dUTP/UDG carry-over prevention system was incorporated, in which dTTP is substituted with dUTP during amplification and uracil-DNA glycosylase (UDG, also termed UNG) degrades any uracil-containing contaminant DNA prior to PCR [43]. The PCR reactions were carried out in the following steps: an initial denaturation at 95 °C for 3 min; then 15 cycles of denaturation at 95 °C for 30 s, annealing and extension at 60 °C for 4 min; followed by a final elongation at 72 °C for 4 min and cooling to 4 °C. Upon completion of the reaction, the PCR products were purified using the paramagnetic particle method.
The overall experimental workflow is illustrated in Figure 1. Initially, tissue samples from 30 A. dabryanus individuals were collected, and genomic DNA was extracted to construct RAD libraries. These libraries were sequenced using high-throughput platforms to generate simplified genome data, which provided the necessary genomic information for MNP marker design. Based on the identified polymorphic loci, a set of MNP markers was developed for subsequent genotyping applications.
Building on these developed markers, a robust detection method was then established. Multiplex PCR primers targeting the selected MNP loci were then used to amplify genomic DNA from each sample. The resulting PCR products underwent target fragment screening using the paramagnetic particle method, followed by a second round of PCR amplification to attach different sequencing barcodes (index) to each sample. After purification, the sequencing library was obtained, and its concentration was measured using the Qubit dsDNA HS Assay Kit. Qualified libraries were mixed in equal masses (100 ng each) and sequenced on the Illumina MiSeq platform provided by Beijing Novozymes.
After sequencing, quality control was performed on the data. Genotypes at each MNP locus were identified and statistically analyzed, forming the basis for the MNP fingerprinting profile for each individual. This robust detection method, combining multiplex PCR amplification and high-throughput sequencing, enables efficient and precise genotyping for the conservation monitoring of A. dabryanus.

2.5. Validation and Application of the MNP System to Individual and Water Samples

To evaluate the effectiveness of the 424 selected MNP markers, specifically designed primers were tested on genomic DNA extracted from 53 individual tissue samples. These included 30 A. dabryanus individuals used for marker development, 21 additional A. dabryanus individuals, and 2 individuals from other sturgeon species (1 from Acipenser ruthenus and 1 from Acipenser sinensis), all provided by the Chinese Sturgeon Research Institute of CTG. These samples were subjected to multiplex PCR amplification followed by high-throughput sequencing analysis. The results were assessed for reproducibility and accuracy (see Section 2.6), heterozygosity (defined as the proportion of individuals with heterozygous genotypes at each locus), allele diversity, and discriminative power across the 53 individuals.
After validating the performance of the MNP marker system in individual samples, we applied it to assess species identity and distinguish A. dabryanus from other closely related sturgeon species. Genetic differentiation across the 53 individual samples was analyzed based on the selected MNP loci. The proportion of sample differences was quantified as genetic differentiation, defined as the ratio of differing MNP loci to common MNP loci between two samples.
Subsequently, we assessed the applicability of the MNP system to eDNA samples collected from natural habitats. A total of 46 eDNA samples were collected from six sites (BX, W, T1, T2, HJ1, HJ2) along the Yangtze River (Figure 2). For each sample, the same MNP sequencing pipeline used for individual samples was applied, and key genetic indices were quantified, including the number of detected MNP loci, heterozygosity, spike-in-based copy numbers, and the number of characteristic alleles.

2.6. Determination of Key Parameters of the MNP System
8 A. dabryanus tissue samples were randomly chosen to assess reproducibility and accuracy, as indicators of the MNP system’s stability and reliability. Two identical DNA extracts were obtained from each A. dabryanus sample to establish two independent libraries. These two libraries underwent sequencing twice at distinct times, and the quantity of differential MNP markers between the two batches of libraries were contrasted. The reproducibility of each sample was computed based on the following formula (where n represents the number of comparable and reproducible genotype pairs, and N denotes the total number of common genotype pairs identified between the two libraries under comparison, and R denotes reproducibility):
R = n N
The genotypes of the MNP markers that were consistently detected in both replicate experiments were regarded as accurate outcomes. The accuracy of each sample was calculated using the following formula [32,34], where A represents accuracy and R represents reproducibility:
A = 1 1 R 2
Figure 2. Sampling locations of 46 environmental DNA samples collected from 6 sites along the Yangtze River. BX (downstream of Xiangjiaba Dam, Jinsha River, Yibin), W (the lower reach of Jinsha River), HJ1 (downstream of Chishui River Port, Hejiang), HJ2 (Chishui River Port, Hejiang), T1 (downstream of Luzhou), T2 (upstream of Luzhou).
Diversity 17 00704 g002

2.7. Testing Quantification and Sensitivity Assessment Based on Spike-In Normalization

To enable quantification of A. dabryanus DNA, a synthetic DNA spike-in fragment with a known concentration (5000 copies/reaction) was designed and used as an external reference [43,44]. This spike-in included 7 artificially synthesized MNP loci and served as an internal calibrator for estimating target DNA copy number. The spike-in fragment was designed with appropriate GC content and no significant similarity to any known natural sequences, and was cloned into plasmids for stable storage.
The copy number of A. dabryanus DNA in each reaction was calculated using the following formula:
N t a r g e t = N s p i k e i n × R t a r g e t R s p i k e i n ( N s p i k e i n = 5000 )
where Ntarget is the calculated copy number of A. dabryanus DNA, Nspike-in represents the known input copy number of the spike-in (5000 molecules), Rtarget is the number of reads aligned to the target MNP locus for A. dabryanus, and Rspike-in is the number of reads aligned to the spike-in sequence.
To evaluate the sensitivity of the MNP system under low-template conditions, a series of gradient dilutions of A. dabryanus DNA from individual DSX-7 were tested. Final concentrations included 10, 1, 0.1, 0.01, 0.001, 0.0002, 0.00004, and 0.000008 ng/reaction, corresponding approximately to 1150, 115, 11.5, 1.15, 0.115, 0.023, 0.0046, and 0.00092 copies/reaction [45]. Each reaction was supplemented with 5000 copies of the synthetic spike-in to ensure accurate normalization. A no-template control (NCK) group was also included to monitor potential contamination or background amplification.

3. Results

3.1. Evaluation of MNP Markers

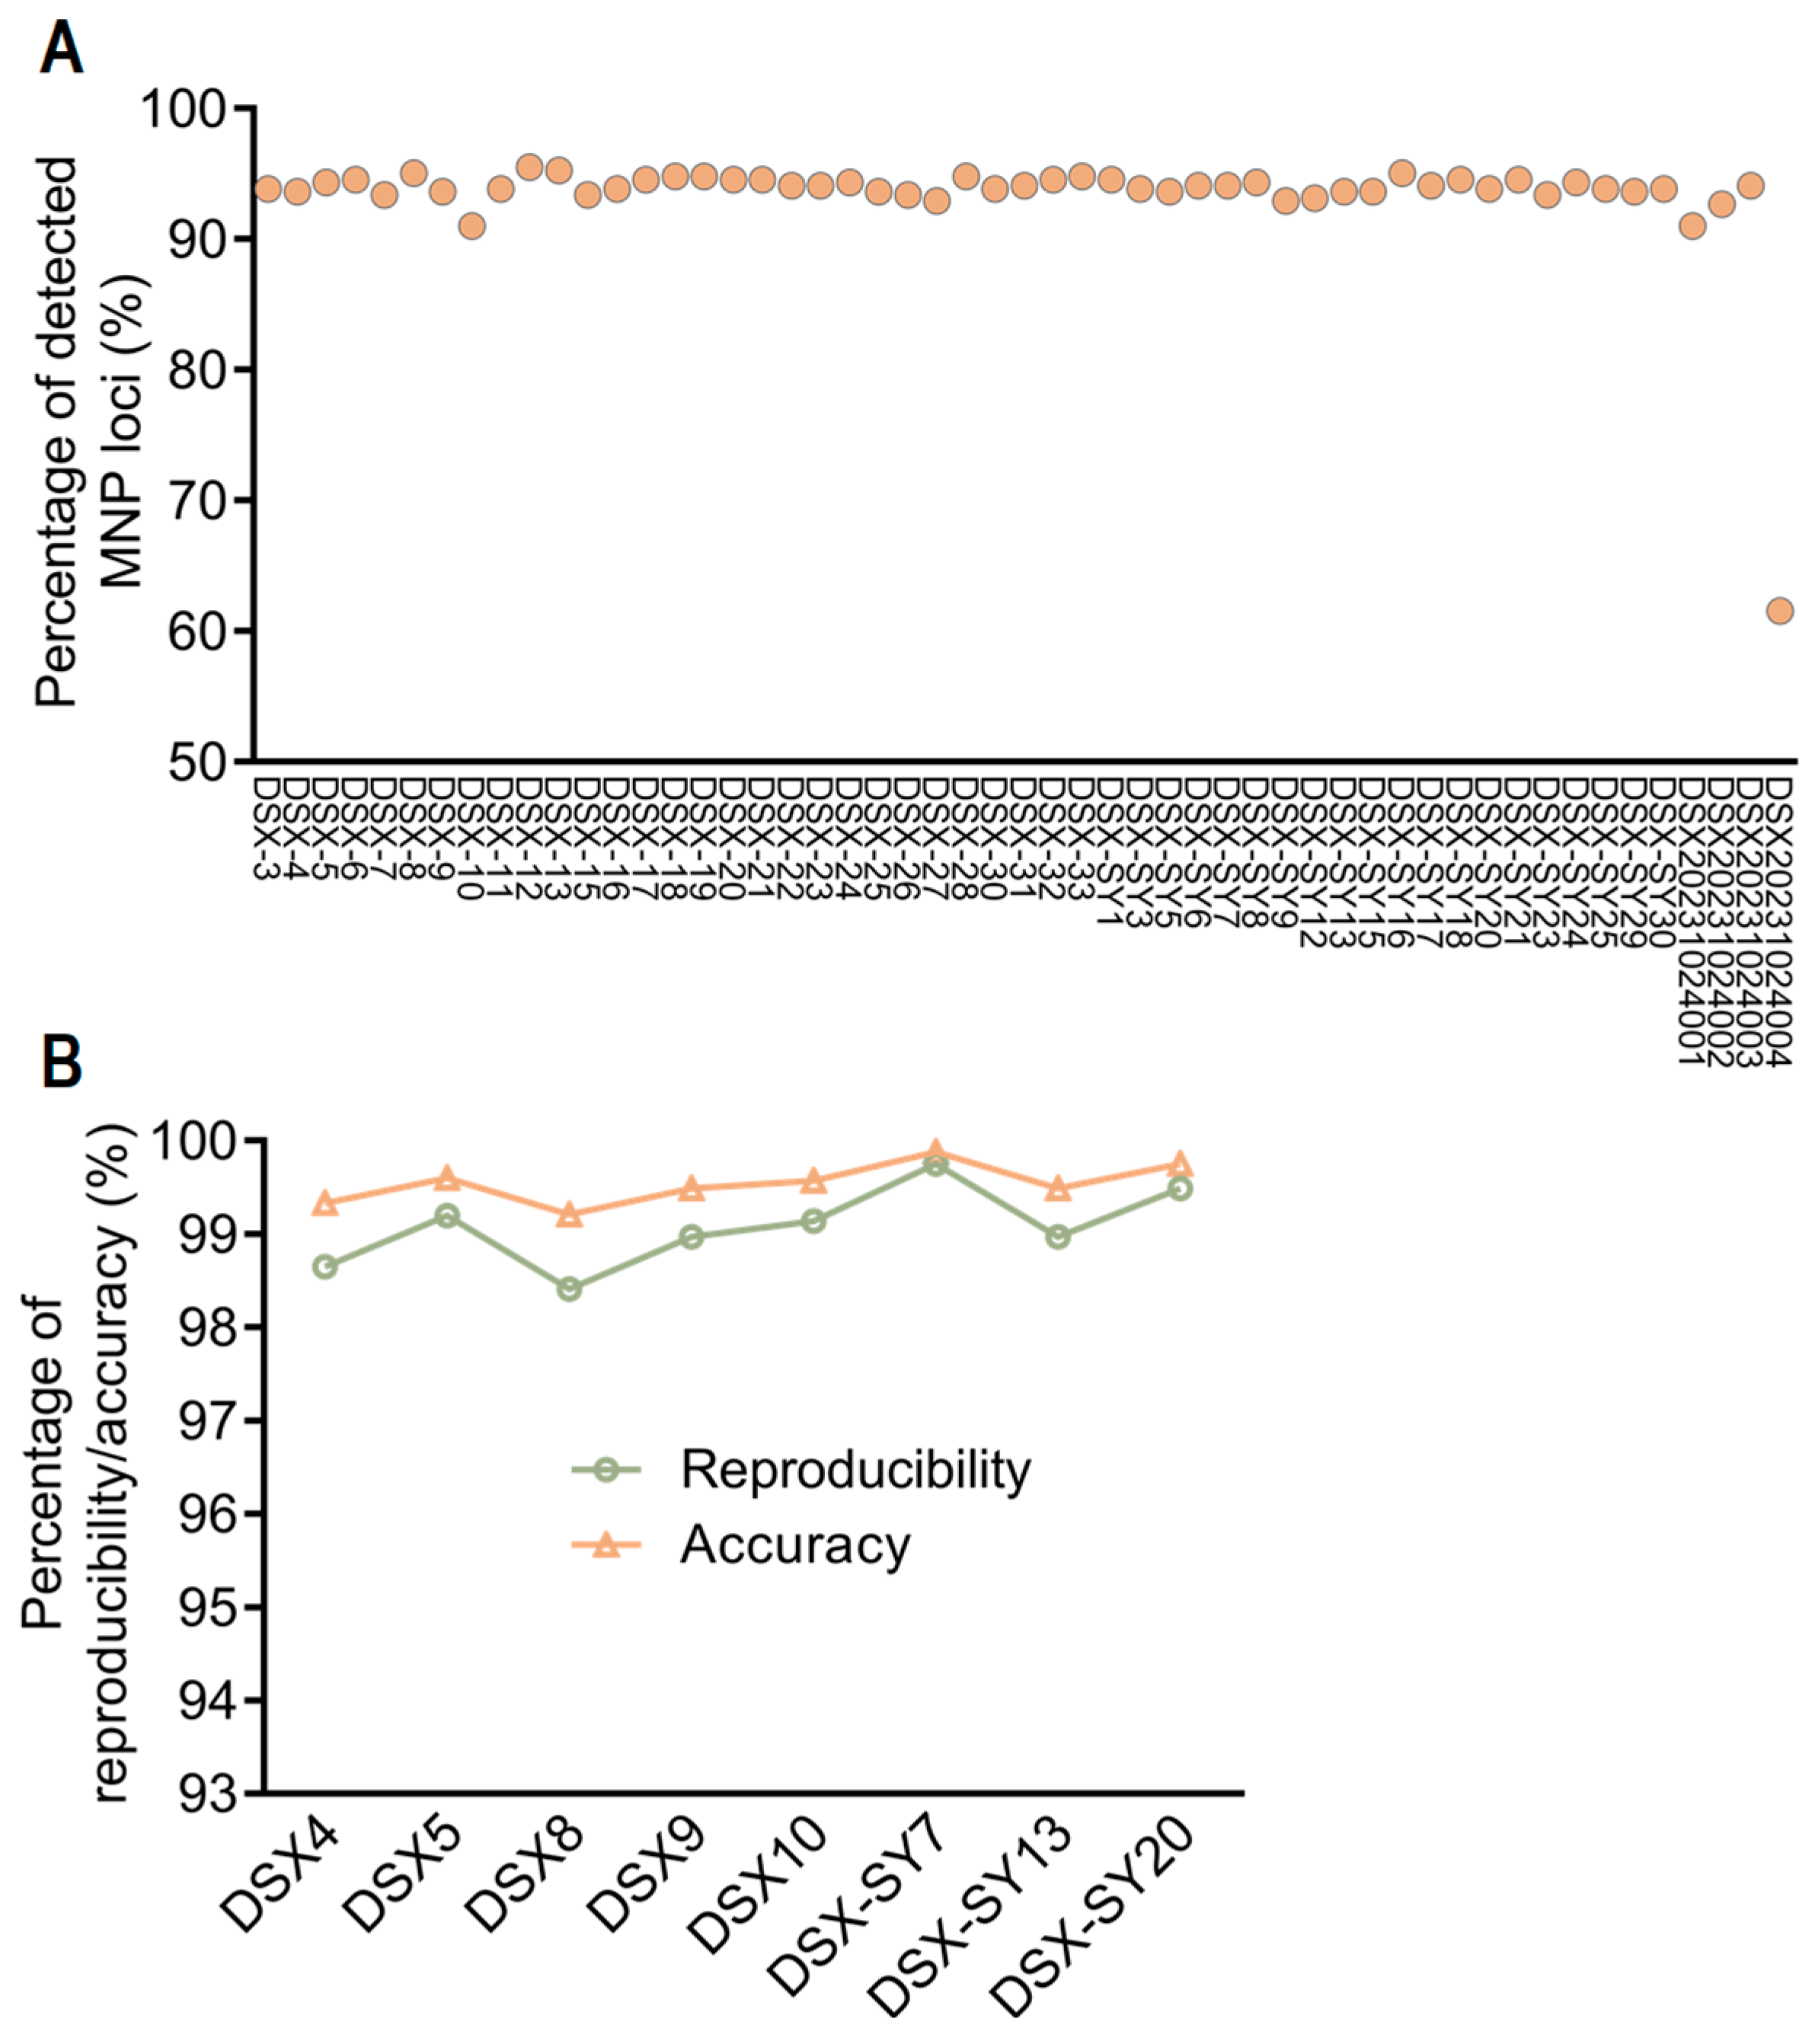
A total of 20,980 MNP markers were successfully detected by testing the 53 individual tissue samples with the 424 MNP markers. The average sequencing coverage for each sample reached 4017.88-fold. On average, 395.84 MNP markers were detected per sample, resulting in a detection rate of 93.36%. The distribution of the number of MNP markers detected in each sample is shown in Figure 3A.
To determine the key parameters (reproducibility, “R”, and accuracy, “A”) of the 424 selected MNP markers, we randomly selected 8 individuals from the 53 individual tissue samples for replicate testing. For each sample, two independent replicate experiments were performed. Across all samples, the results demonstrated high reproducibility and accuracy, with reproducibility exceeding 98% and accuracy greater than 99% (Figure 3B). Specifically, the average reproducibility and accuracy across all samples were 99.07% and 99.54%, respectively. The detailed information on MNP marker detection is presented in Table 1. These high values confirm the reliability of the MNP markers developed in this study, providing robust and accurate data for subsequent genetic analyses and population monitoring of A. dabryanus.
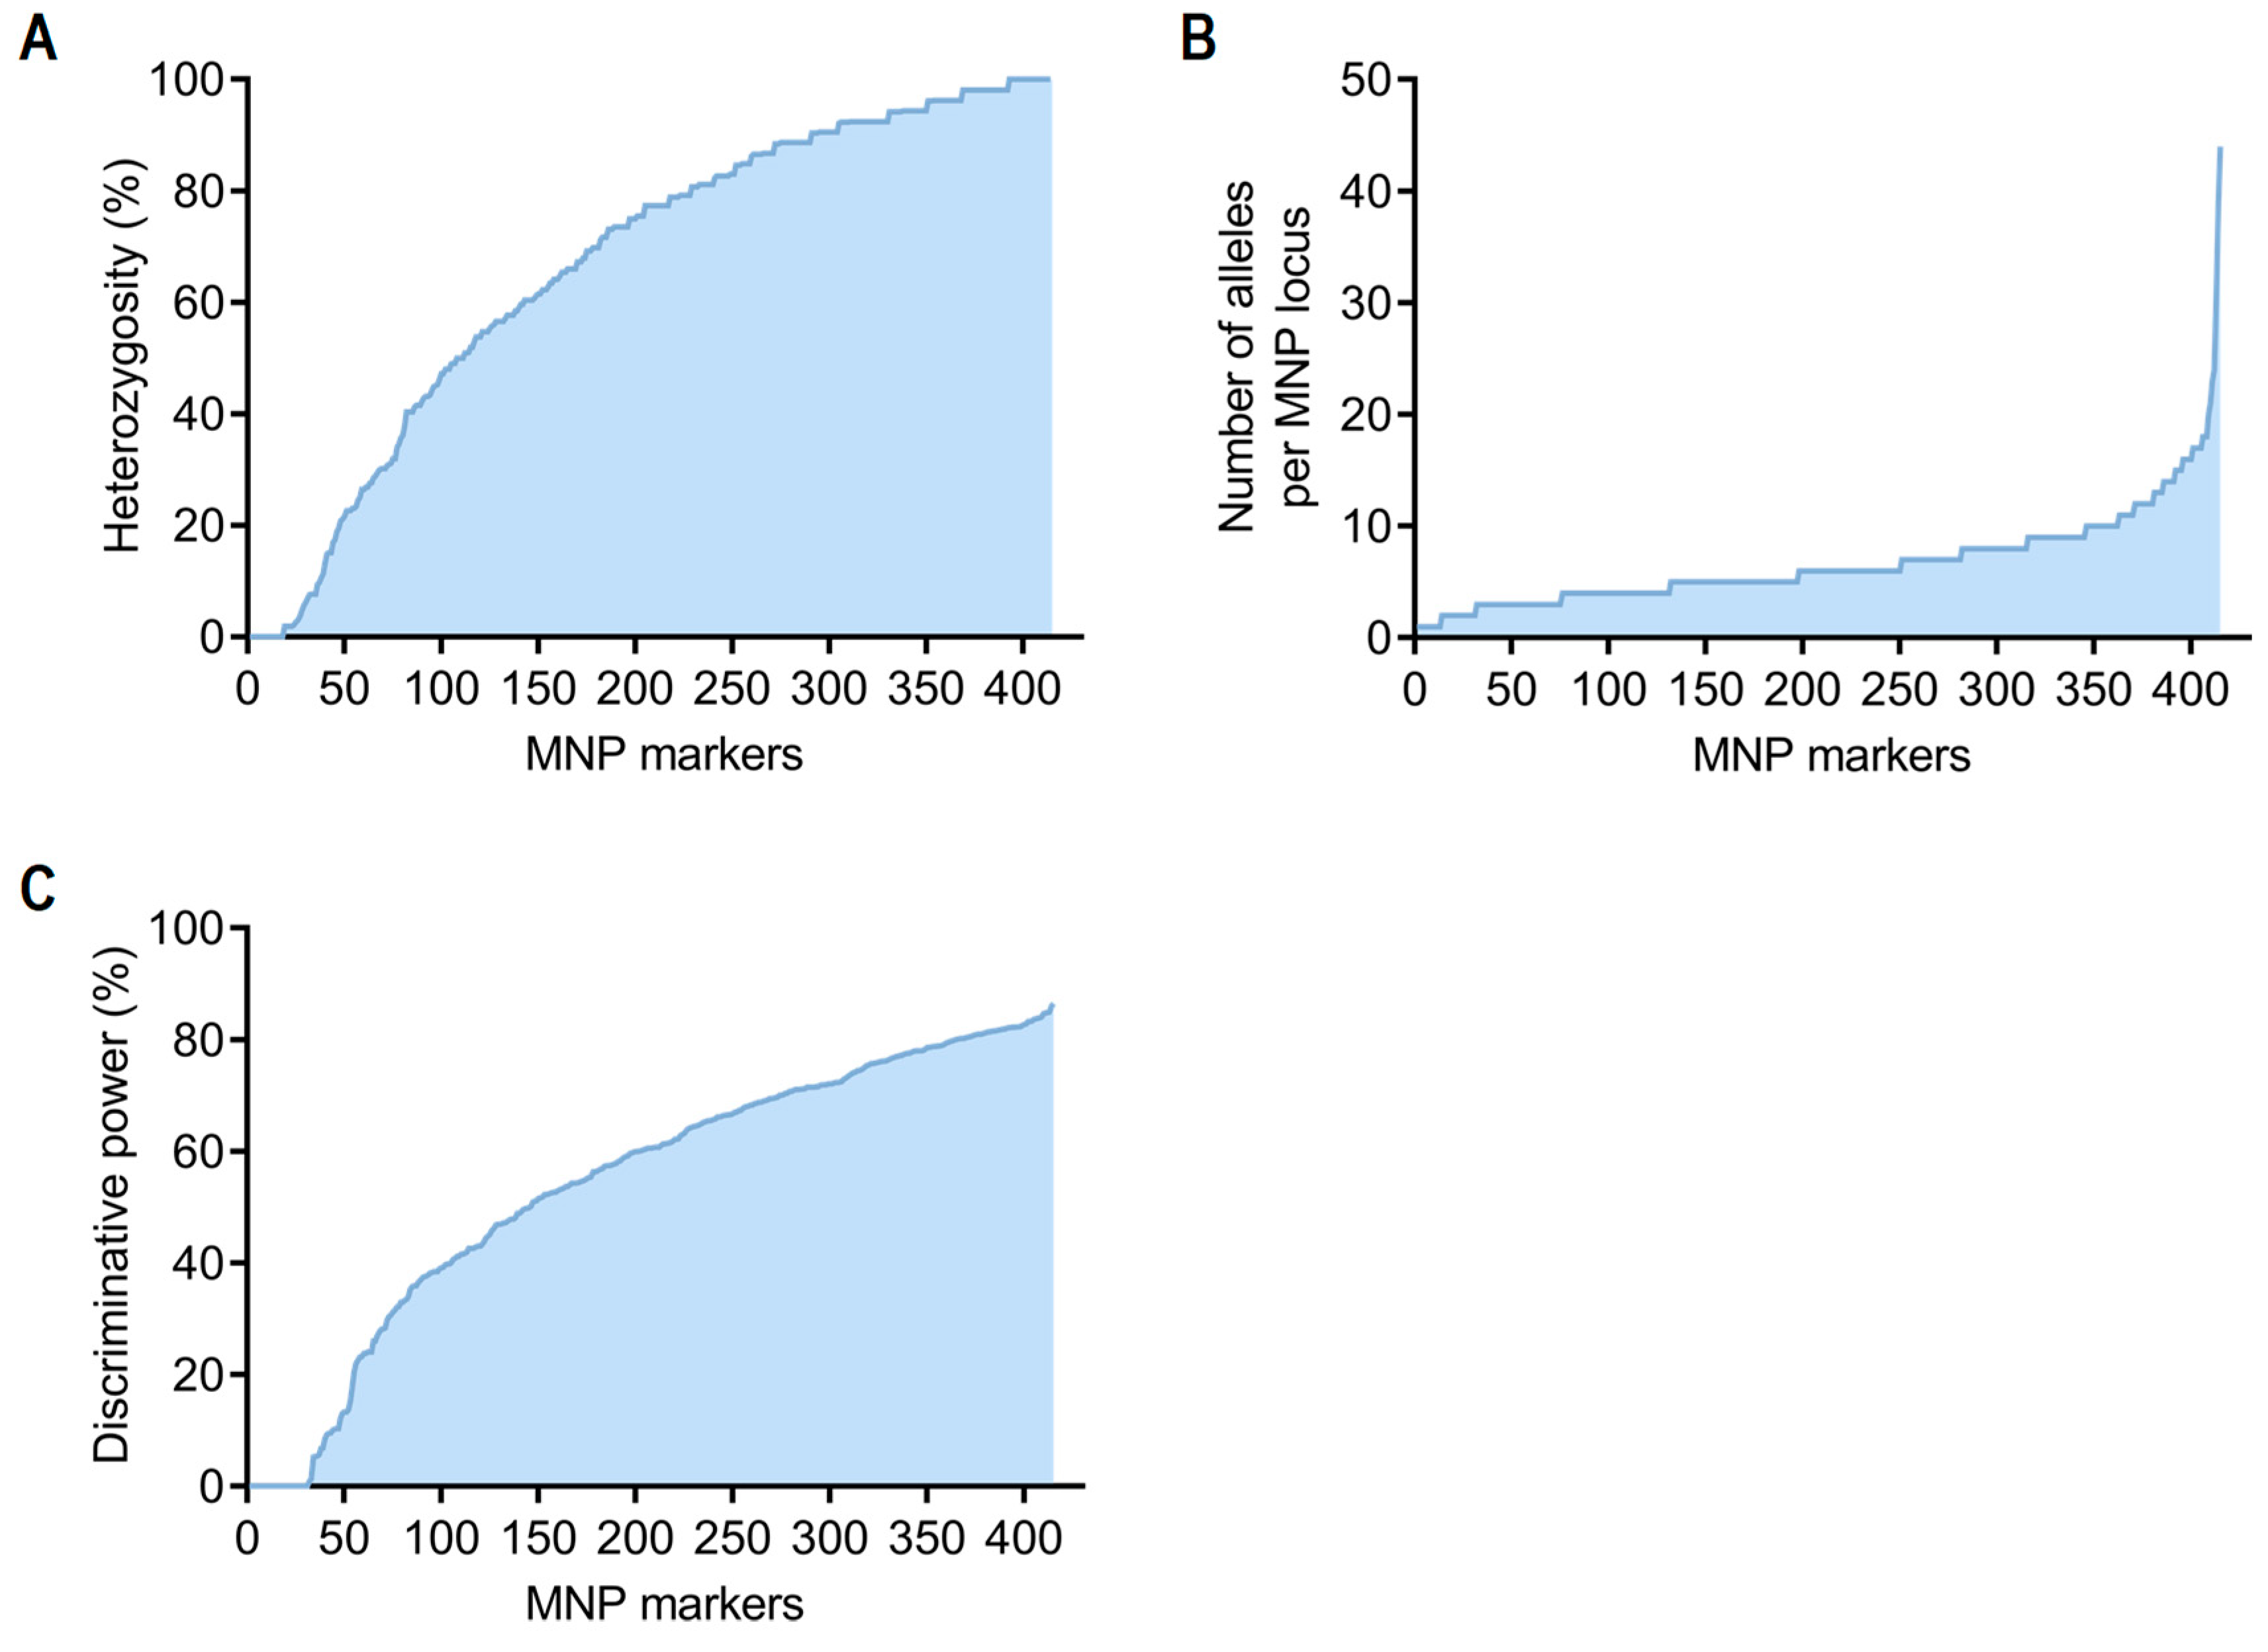
To further assess the genetic resolution of the developed MNP markers, we analyzed heterozygosity (defined as the proportion of individuals with heterozygous genotypes at each locus), allele diversity, and discriminative power across 53 individuals (Figure 4). Heterozygosity ranged from 0% to 100%, with an average of 66.53% (Figure 4A), indicating that A. dabryanus possesses abundant genetic variation and that the developed MNP markers are high-quality, informative loci suitable for population genetic studies. A total of 3171 alleles were detected, with an average of 7.48 alleles per MNP locus (Figure 4B), demonstrating the high allelic diversity and resolution capacity of the marker system. The mean discriminative power was 0.54, with 361 MNP loci (accounting for 85.4%) exhibiting a discriminative power greater than 0.2 (Figure 4C), highlighting the strong ability of these markers to differentiate between individuals with diverse genetic backgrounds. In summary, these results validate the high performance and reliability of the MNP marker system at the population level, providing a solid and effective tool for subsequent species identification and long-term monitoring of A. dabryanus populations.

3.2. Species Identification of A. dabryanus

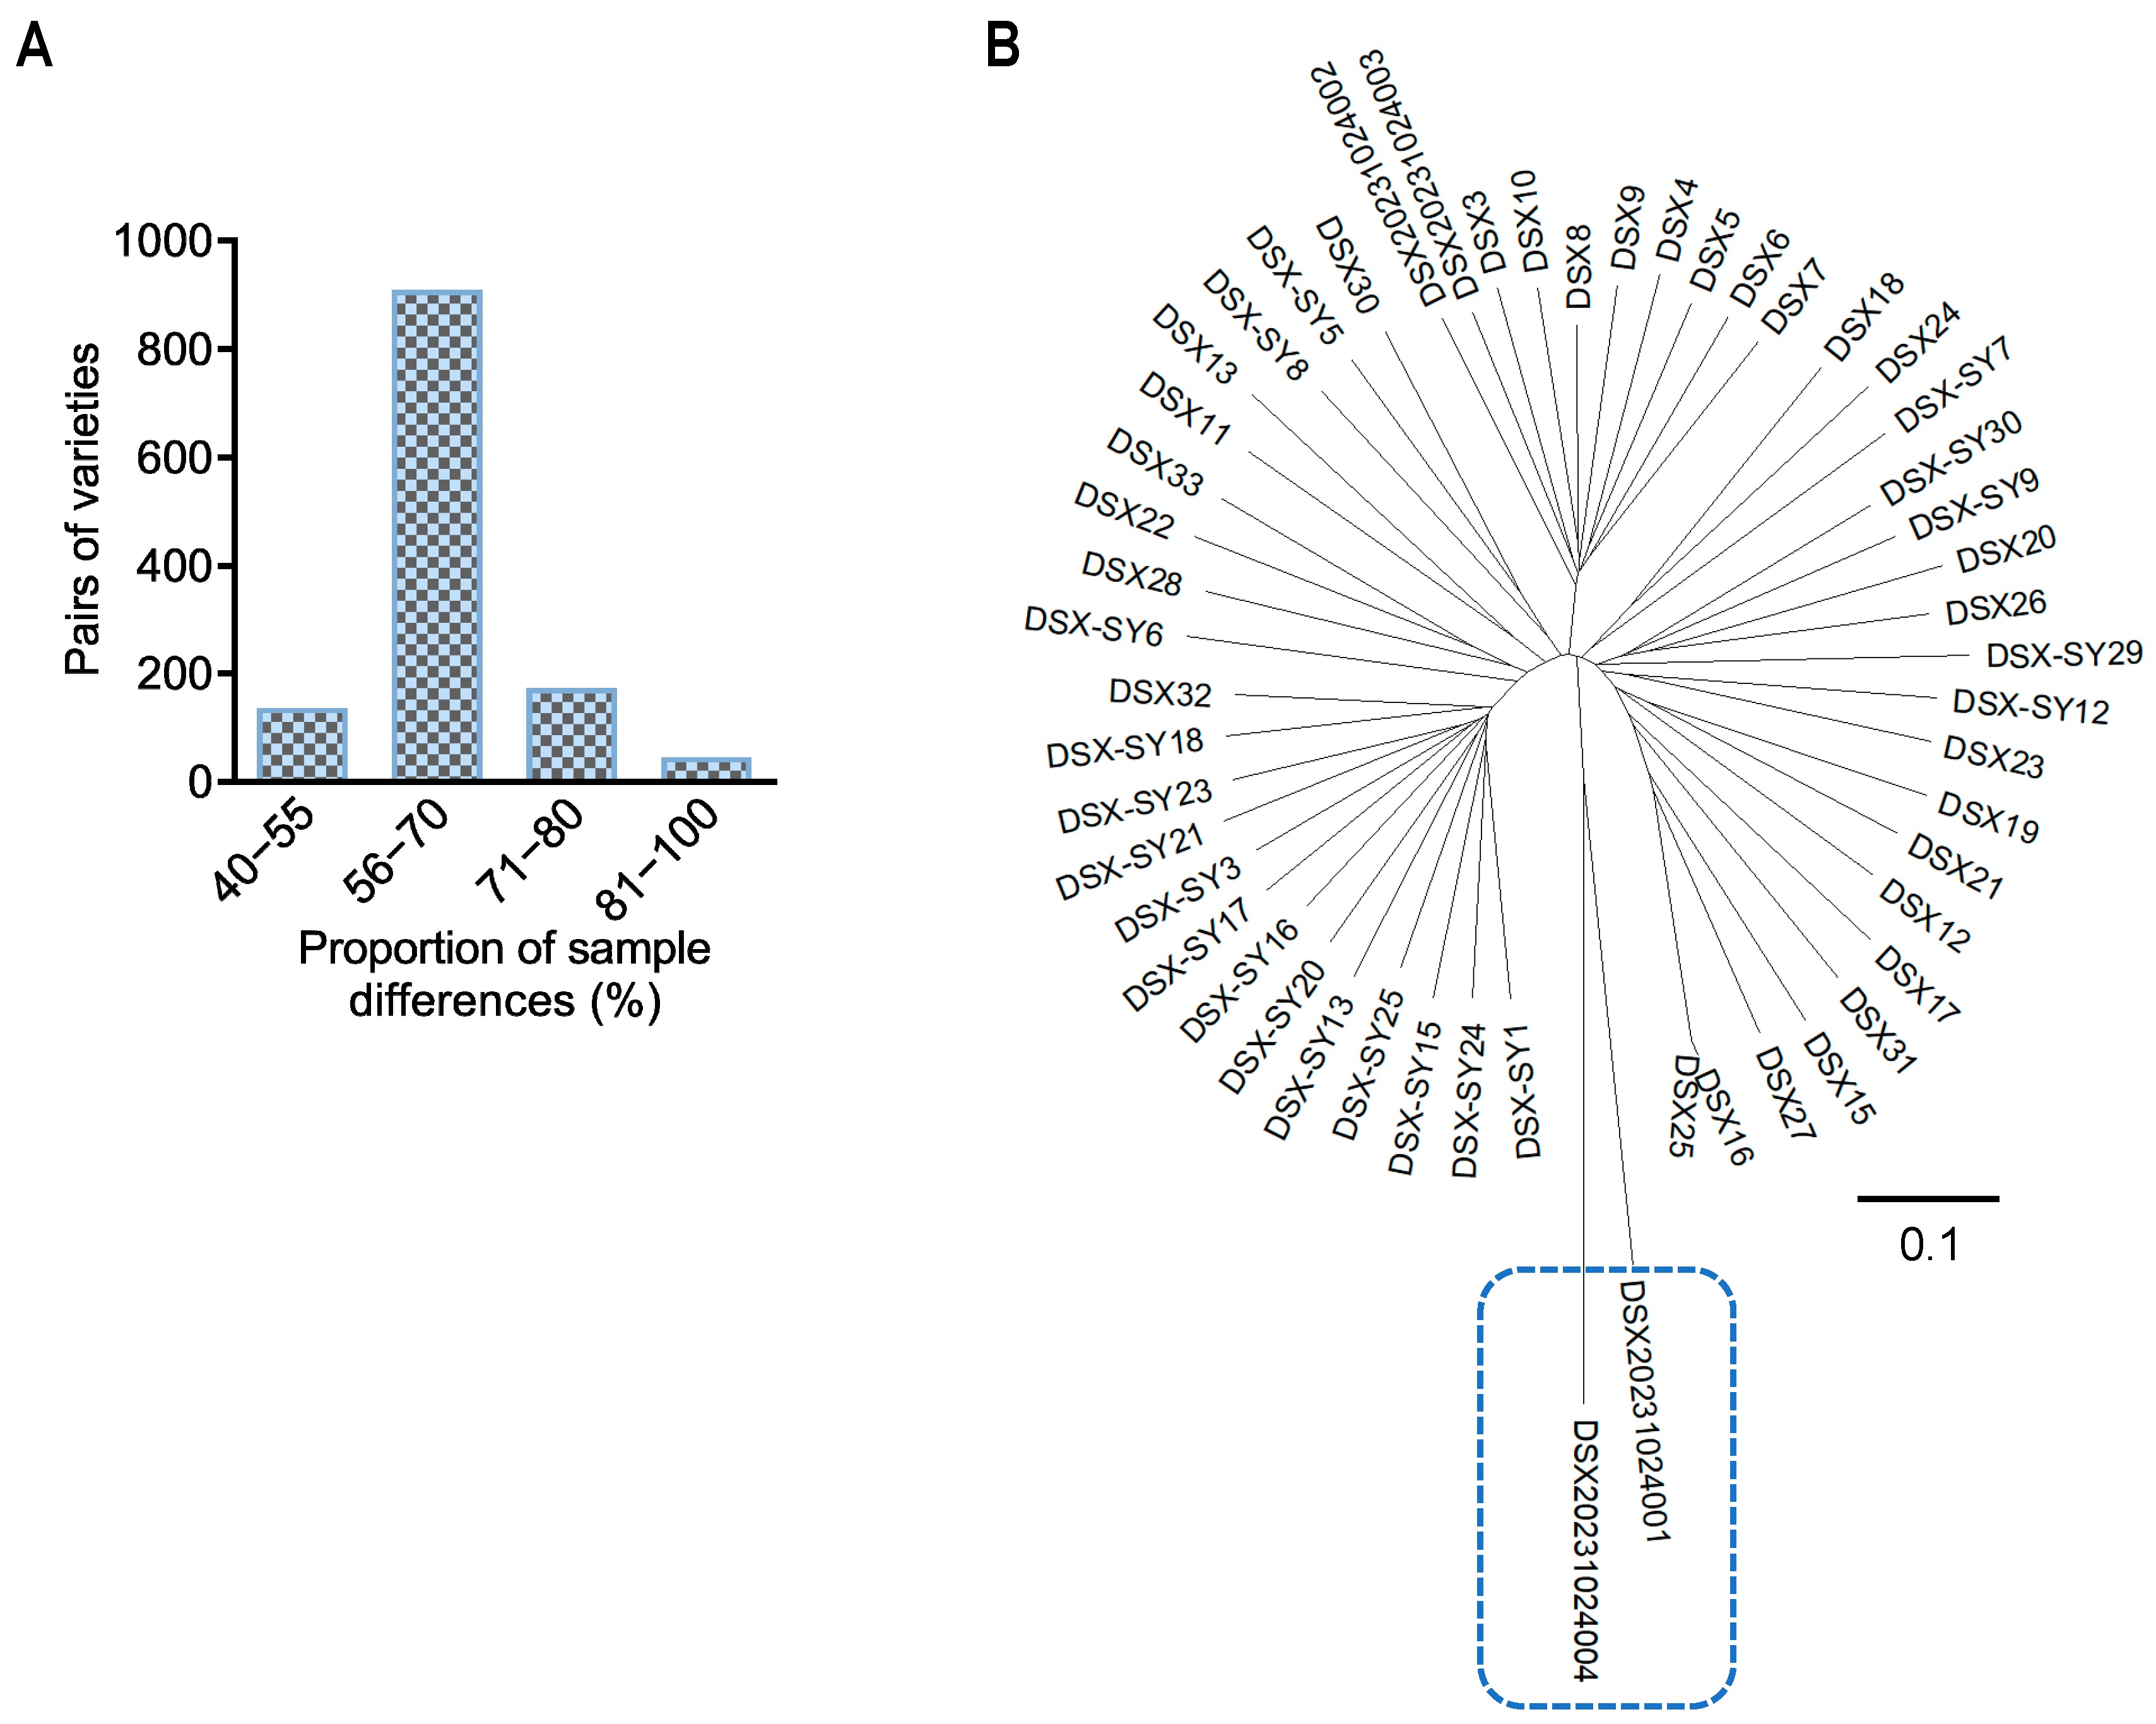
Following the validation of the superior performance of the MNP marker system, we further applied it to assess the species identity and distinguish them from other closely related sturgeon species. First, the genetic differentiation across 53 individual samples was analyzed based on the selected MNP loci. The proportion of sample differences was quantified as genetic differentiation, defined as the ratio of differing MNP loci to common MNP loci between two samples. A total of 1378 pairwise comparisons were conducted, yielding an average difference proportion of 66.08%. As shown in Figure 5A, the majority of pairwise difference proportions ranged between 40% and 80%. Collectively, the results demonstrate that the selected MNP markers possess strong discriminatory power for species identification.
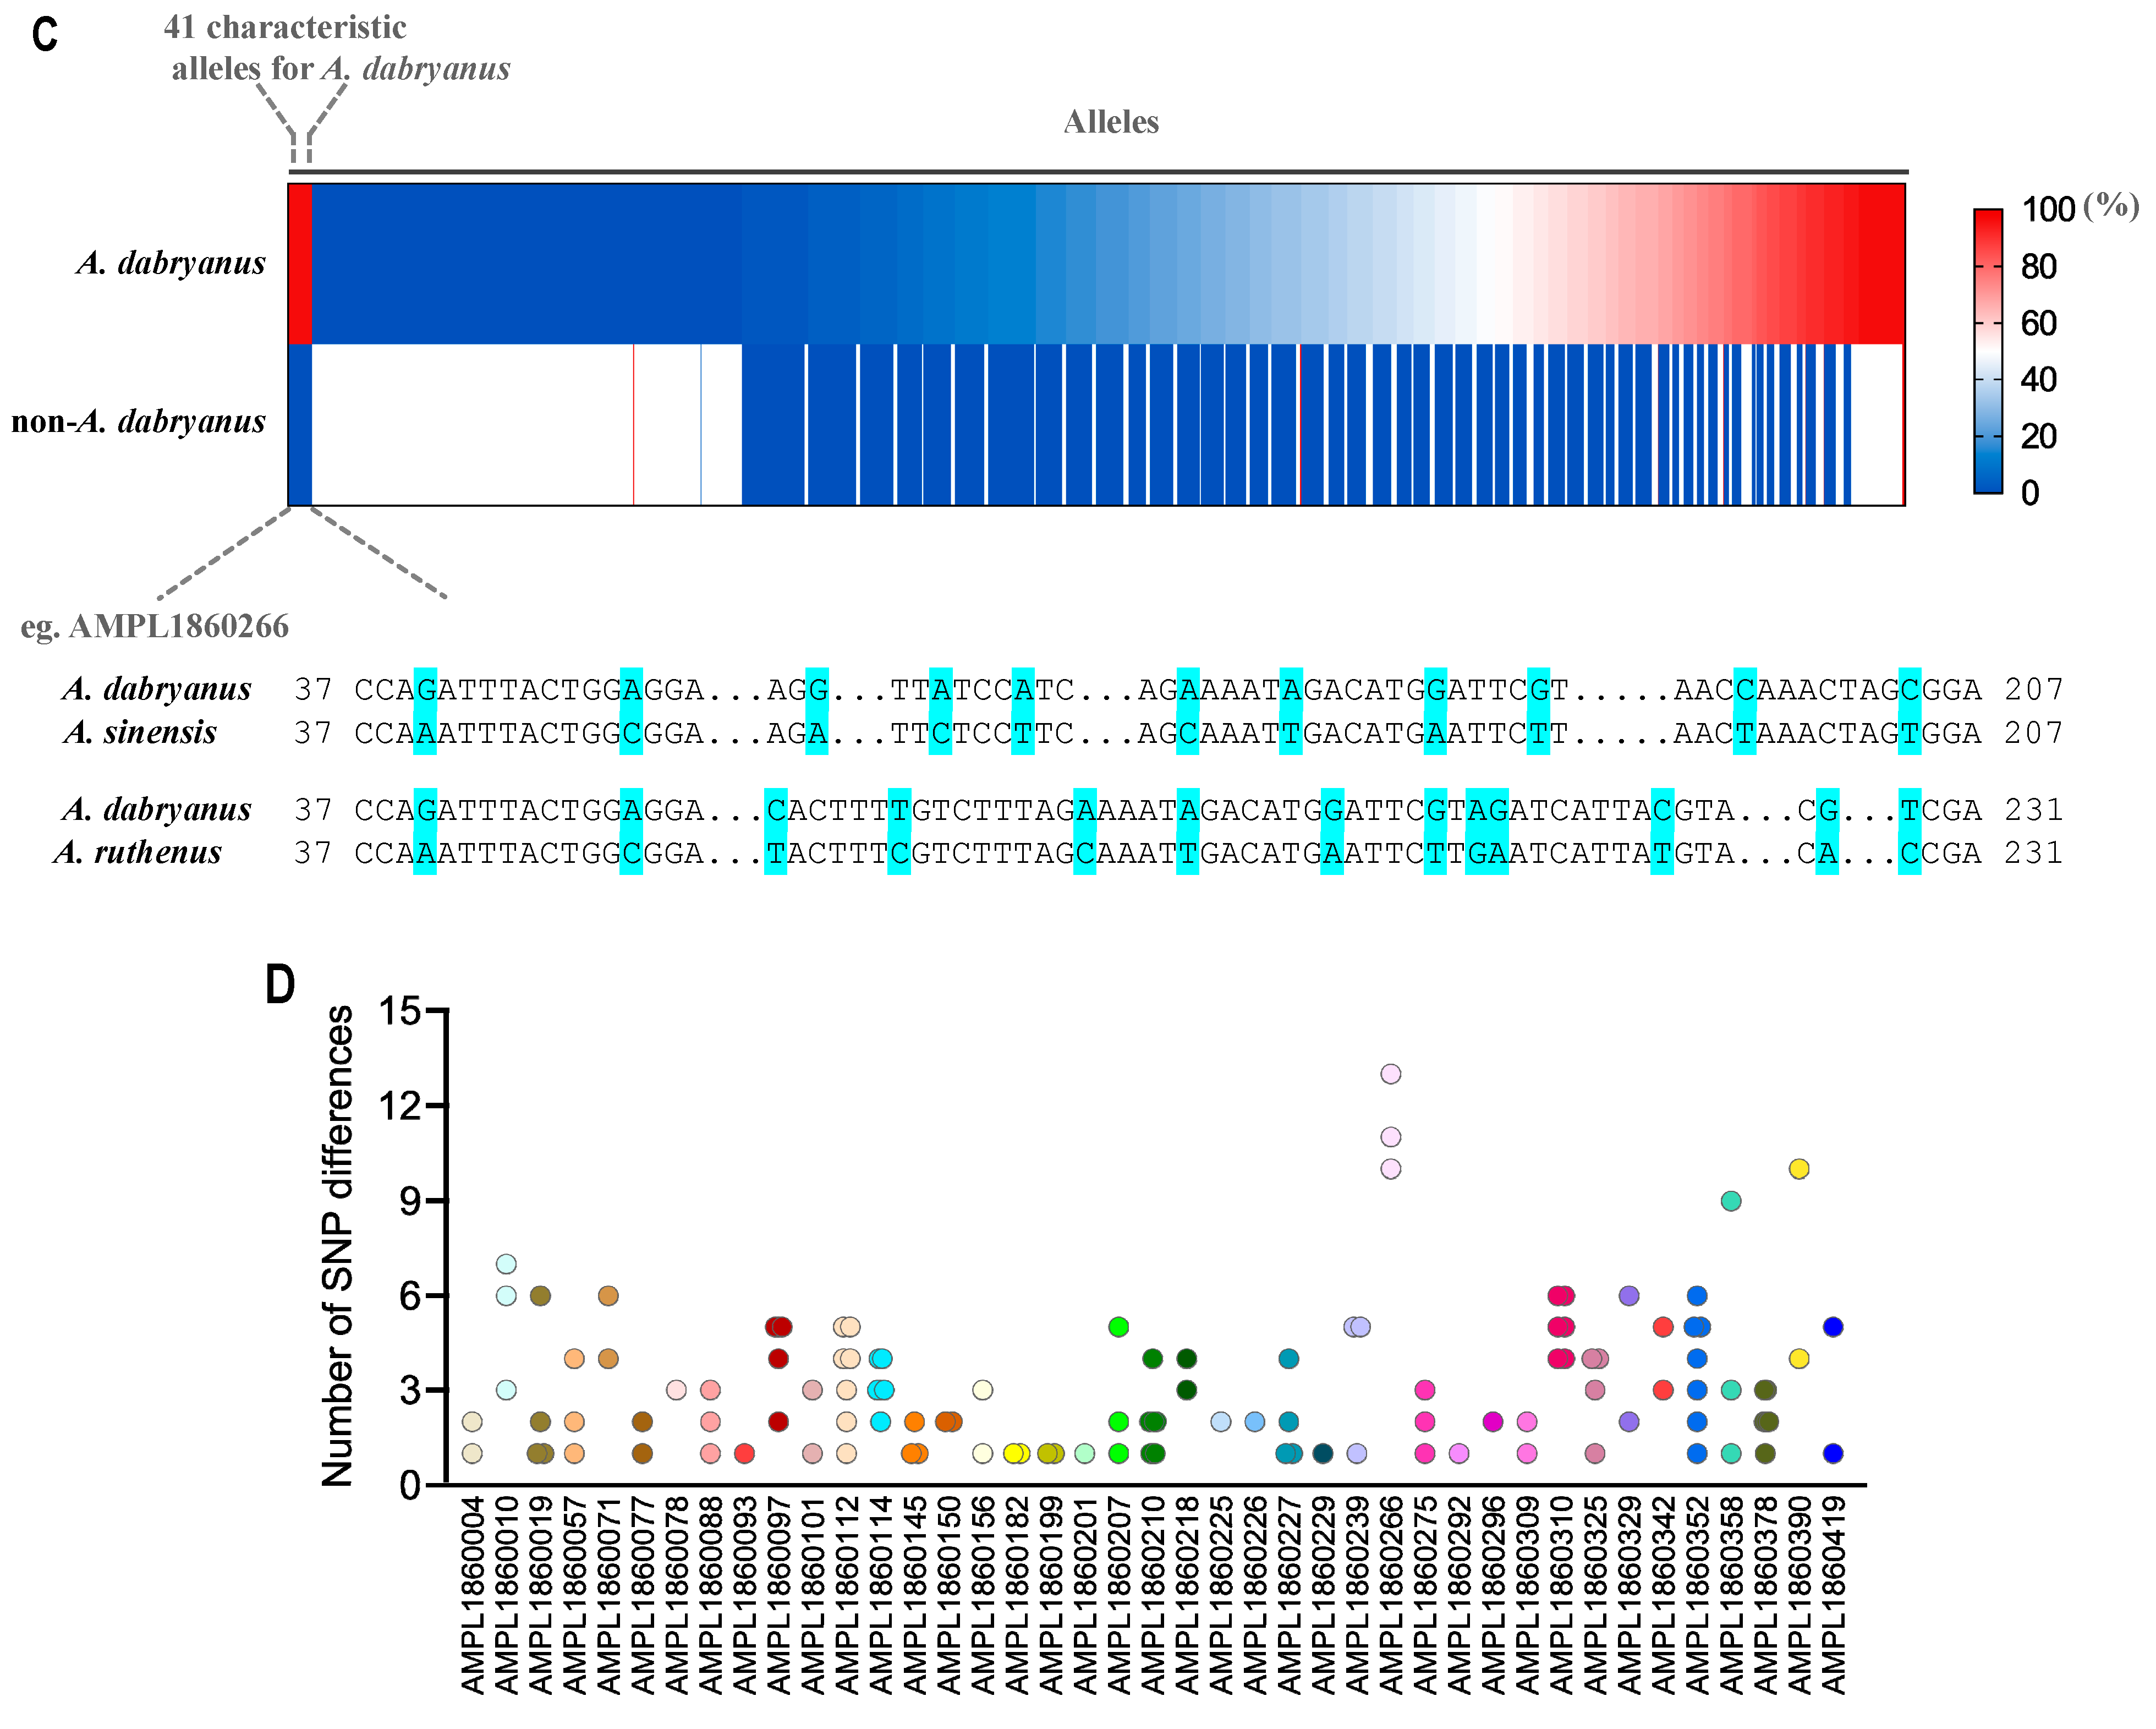
Next, a genetic clustering analysis was performed based on the selected 424 MNP markers. As shown in Figure 5B, these loci effectively distinguished different sturgeon species, with the 53 individuals clustered into two major groups in the constructed Neighbor-Joining tree. Samples DSX20231024001 and DSX20231024004, which were clearly separated from the others, corresponded to A. sinensis and A. ruthenus, respectively, according to metadata from the Chinese Sturgeon Research Institute of CTG; the remaining individuals were identified as A. dabryanus. From the alleles detected across all 53 tissue samples, 41 characteristic alleles specific to A. dabryanus were further identified, showing 100% occurrence in A. dabryanus but nearly absent in non-A. dabryanus individuals (Figure 5C). SNP comparison confirmed that these characteristic alleles consistently exhibited substantial differences between A. dabryanus and non-A. dabryanus (Figure 5D). For example, at allele AMPL1860266, the SNP differences between A. dabryanus and A. sinensis, and between A. dabryanus and A. ruthenus, were 11 and 13, respectively. Collectively, these results highlight the strong discriminatory power of the developed MNP markers, providing a reliable tool for the accurate identification of A. dabryanus and laying the foundation for future eDNA-based studies.

3.3. Abundance Quantification and Sensitivity Analysis of A. dabryanus Individuals Based on DNA Spike-In

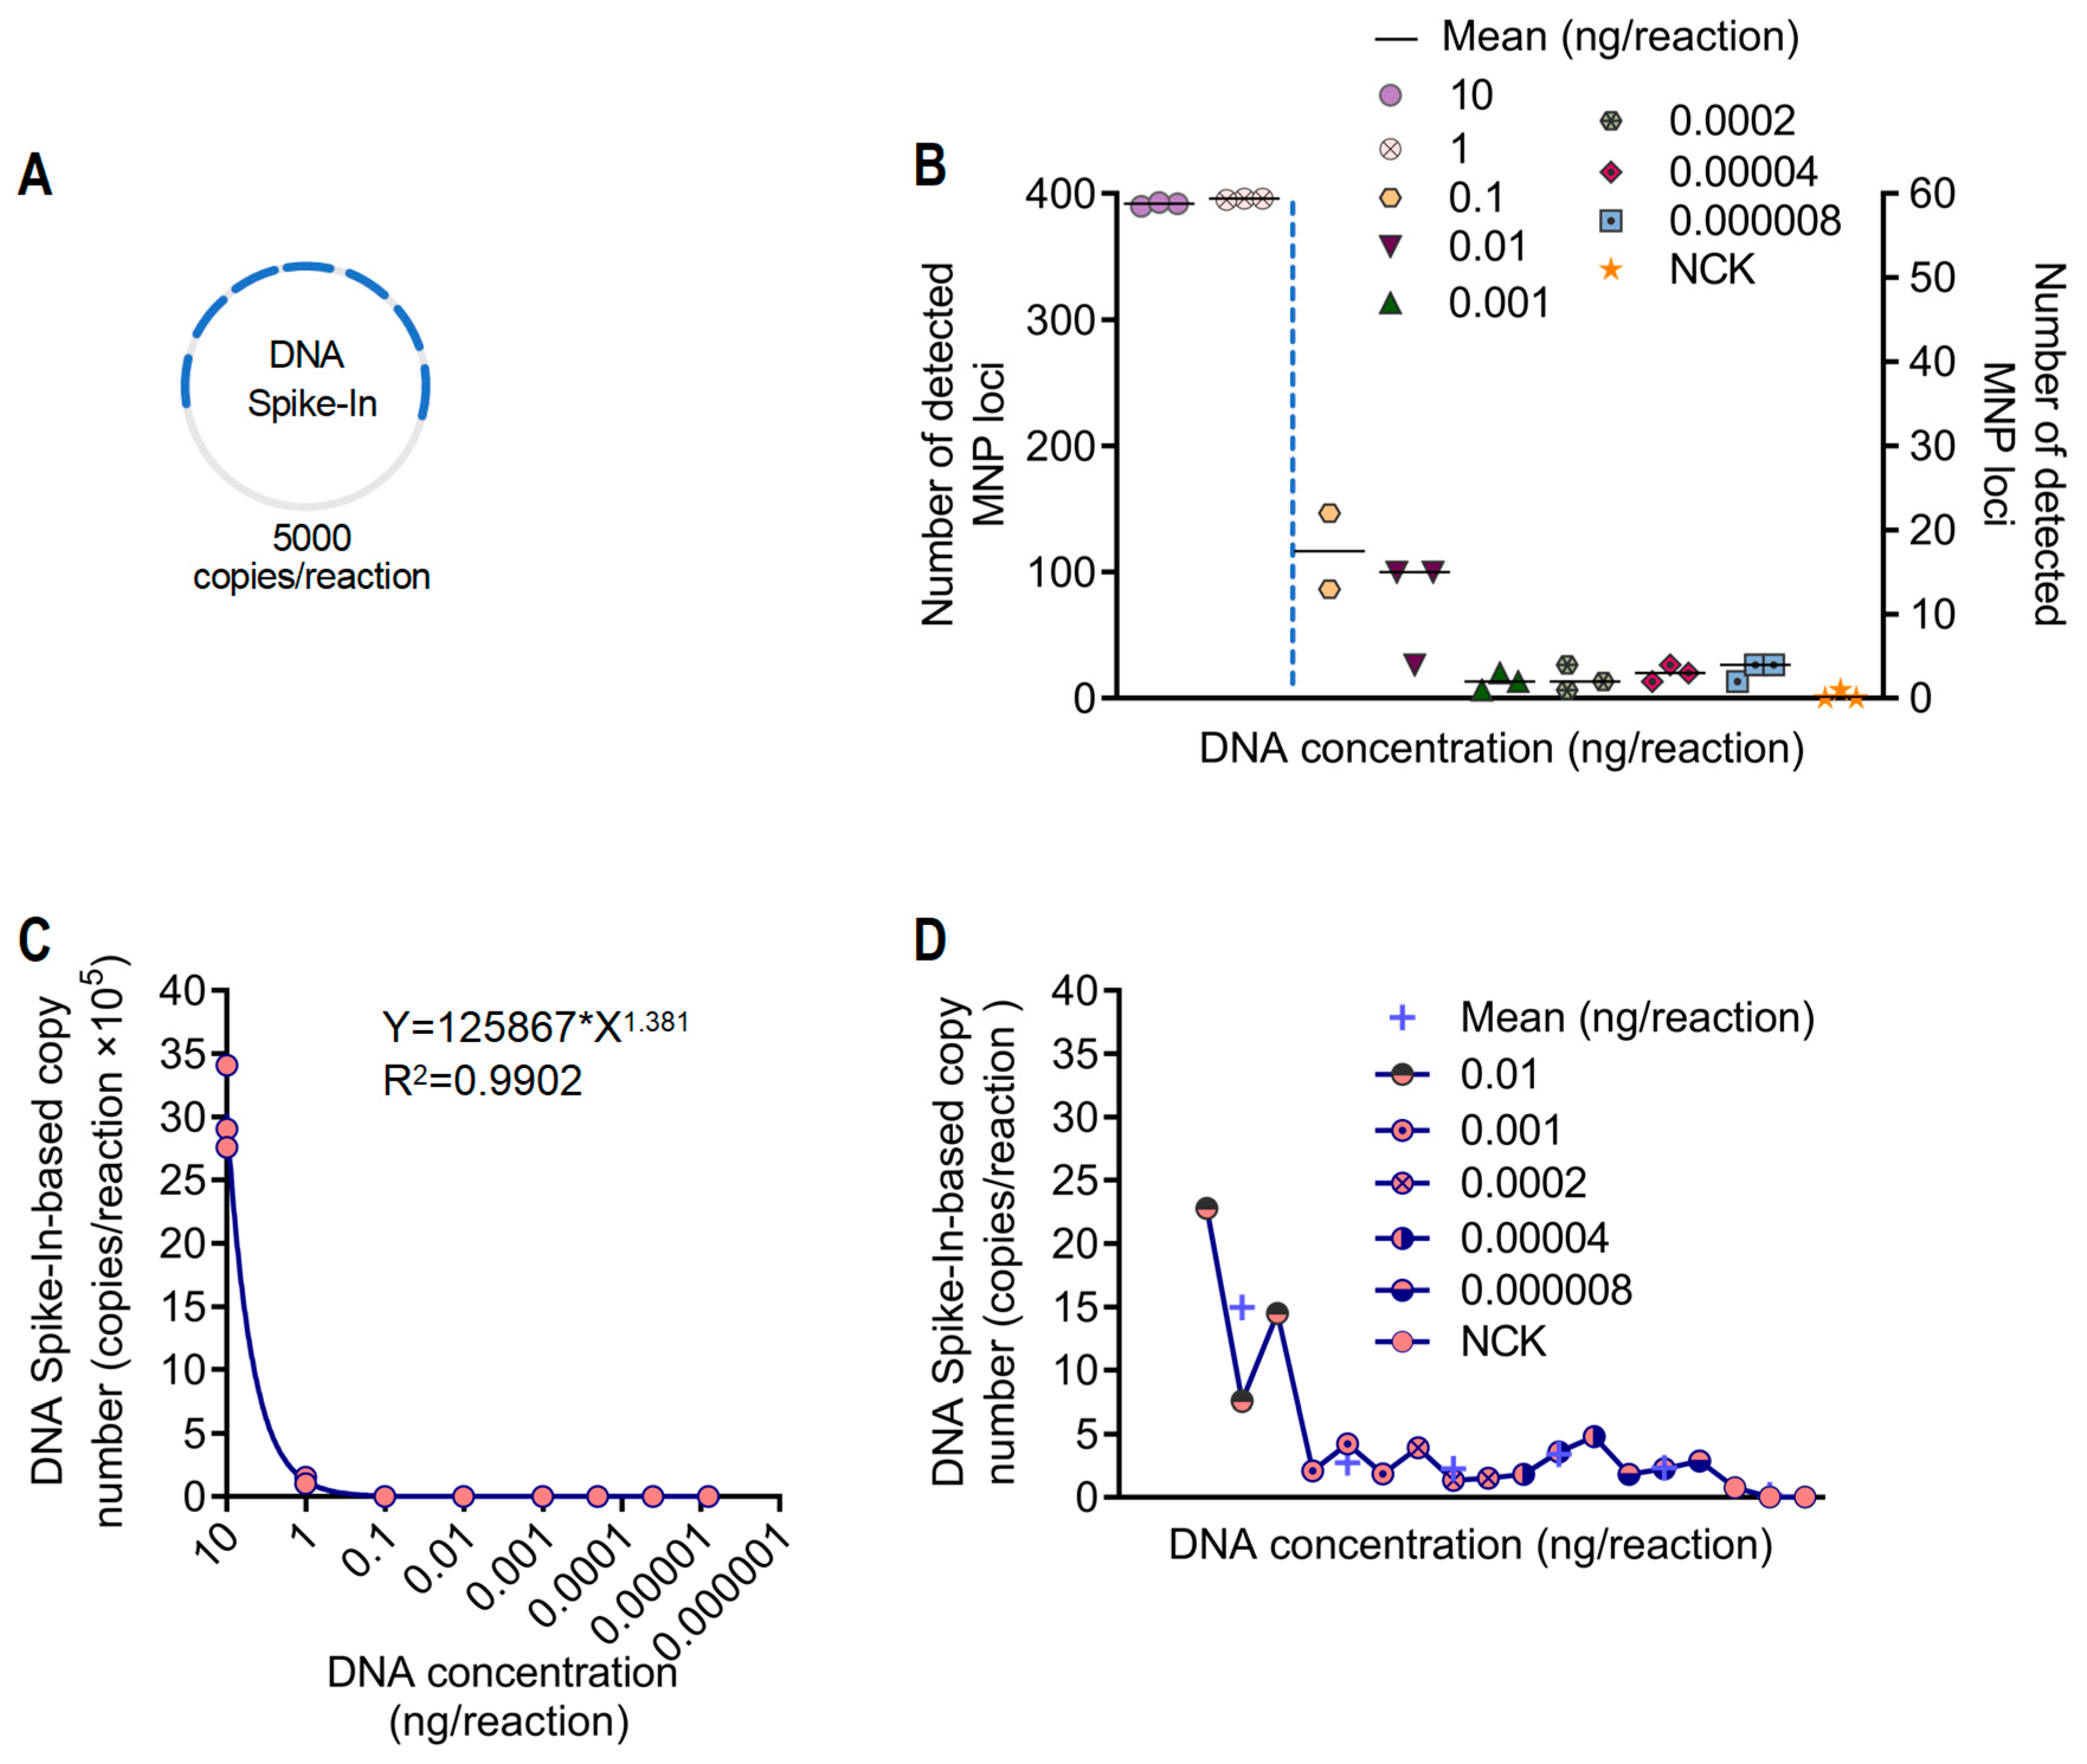
We utilized synthetic DNA spike-in as external references to quantify the DNA concentration of A. dabryanus. The spike-in, with known copy numbers (5000 copies/reaction), allow for accurate estimation of A. dabryanus DNA levels by comparing their tested reads counts to those of the sample DNA [43,46]. In this study, the spike-in construct incorporated 7 MNP loci (Figure 6A).
The results showed that all 7 loci of the spike-in were successfully detected. Meanwhile, the number of detected MNP loci from the A. dabryanus sample decreased progressively with lower DNA concentrations. For each DNA concentration, three replicates were performed, and the mean number of detected loci was calculated, yielding 391 (left Y-axis), 395 (left Y-axis), 18 (right Y-axis), 11 (right Y-axis), 2 (right Y-axis), 2 (right Y-axis), 3 (right Y-axis), 3 (right Y-axis), and 0.3 (right Y-axis) loci, respectively, across the dilution gradient (Figure 6B).
Subsequently, we calculated the copy number of sample DNA based on spike-in read counts (see Materials and Methods Section 2.7) and evaluated the relationship between DNA concentration and spike-in-based copy number. Simulation analysis revealed a strong positive correlation between the two estimates, with a regression model yielding an R2 value greater than 0.99 (Figure 6C).
To further assess detection sensitivity, we focused on the lower concentration groups (0.01–0.000008 ng/reaction), corresponding to approximately 1.15–0.00092 copies/reaction (see Materials and Methods 2.7; Figure 6D). The average spike-in-based copy numbers for these groups were 15, 3, 2, 3, 2, and 0.2, with corresponding detected MNP loci of 11, 2, 2, 3, 3, and 0.3, respectively (Figure 6B). Together, these results indicate a detection limit of around 1 copy/reaction, highlighting the high sensitivity and robustness of the A. dabryanus MNP system for extremely low-abundance DNA.

3.4. Application of the MNP System to Yangtze River Water Samples

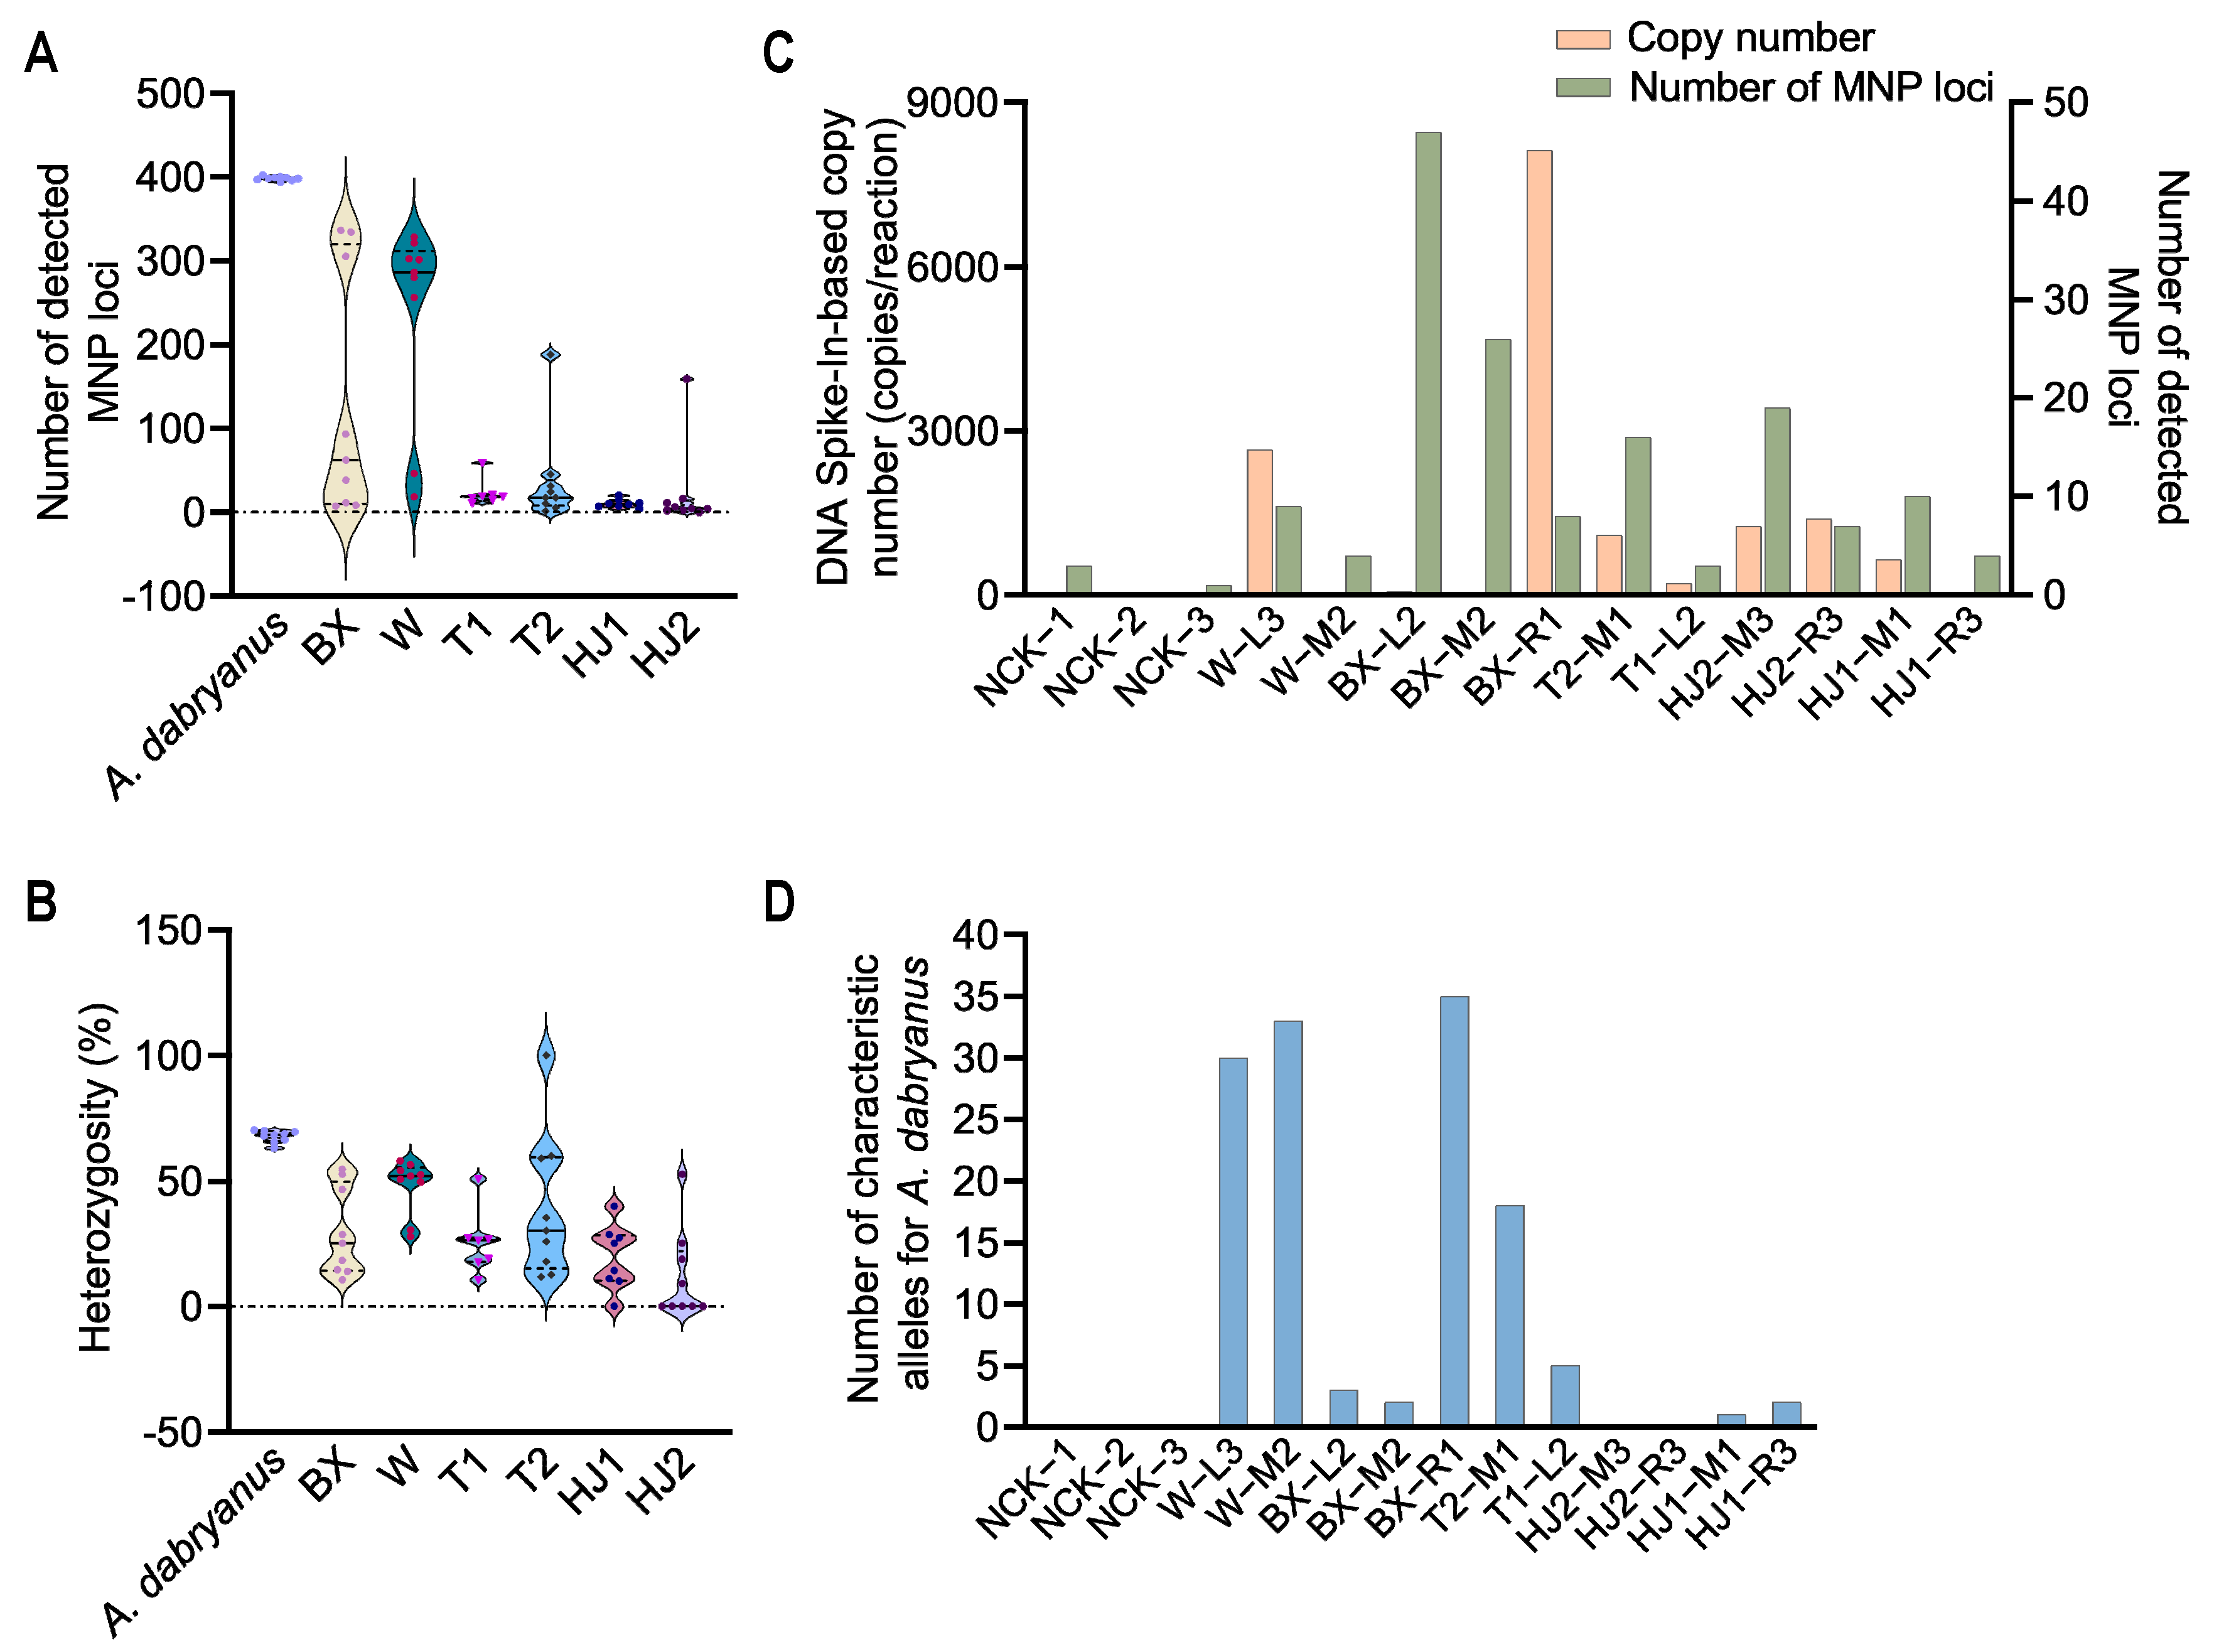
The number of detected MNP loci varied markedly among the six sites (BX, W, T1, T2, HJ1, HJ2), with BX and W showing notably higher values, while T1, T2, HJ1, and HJ2 exhibited lower values (Figure 7A). Beyond locus detection, we further examined heterozygosity, which also varied across sites. Notably, T2 samples displayed the highest heterozygosity, suggesting greater allelic diversity, whereas T1, HJ1, and HJ2 showed consistently lower heterozygosity, consistent with their reduced allele and locus detection (Figure 7B).
To complement these findings, we quantified DNA copy numbers in 11 randomly selected water samples using a spike-in approach. Copy numbers ranged from ~8 to ~8000 copies per reaction, with BX and W samples exhibiting higher values and T1, T2, HJ1, and HJ2 samples showing lower values (Figure 7C). Consistently, the number of detected MNP loci and characteristic alleles also varied considerably among samples. Some BX (BX-R1) and W (W-L3, W-M2) samples contained more than 30 characteristic alleles, whereas the remaining BX and T1, T2, HJ1, and HJ2 samples showed far fewer, and no characteristic alleles were detected in the NCK controls (Figure 7D). The detailed results of copy numbers, MNP loci, and characteristic alleles are summarized in Table 2.

3.5. Correlation and Phylogenetic Analysis of A. dabryanus Individuals and Environmental Water Samples

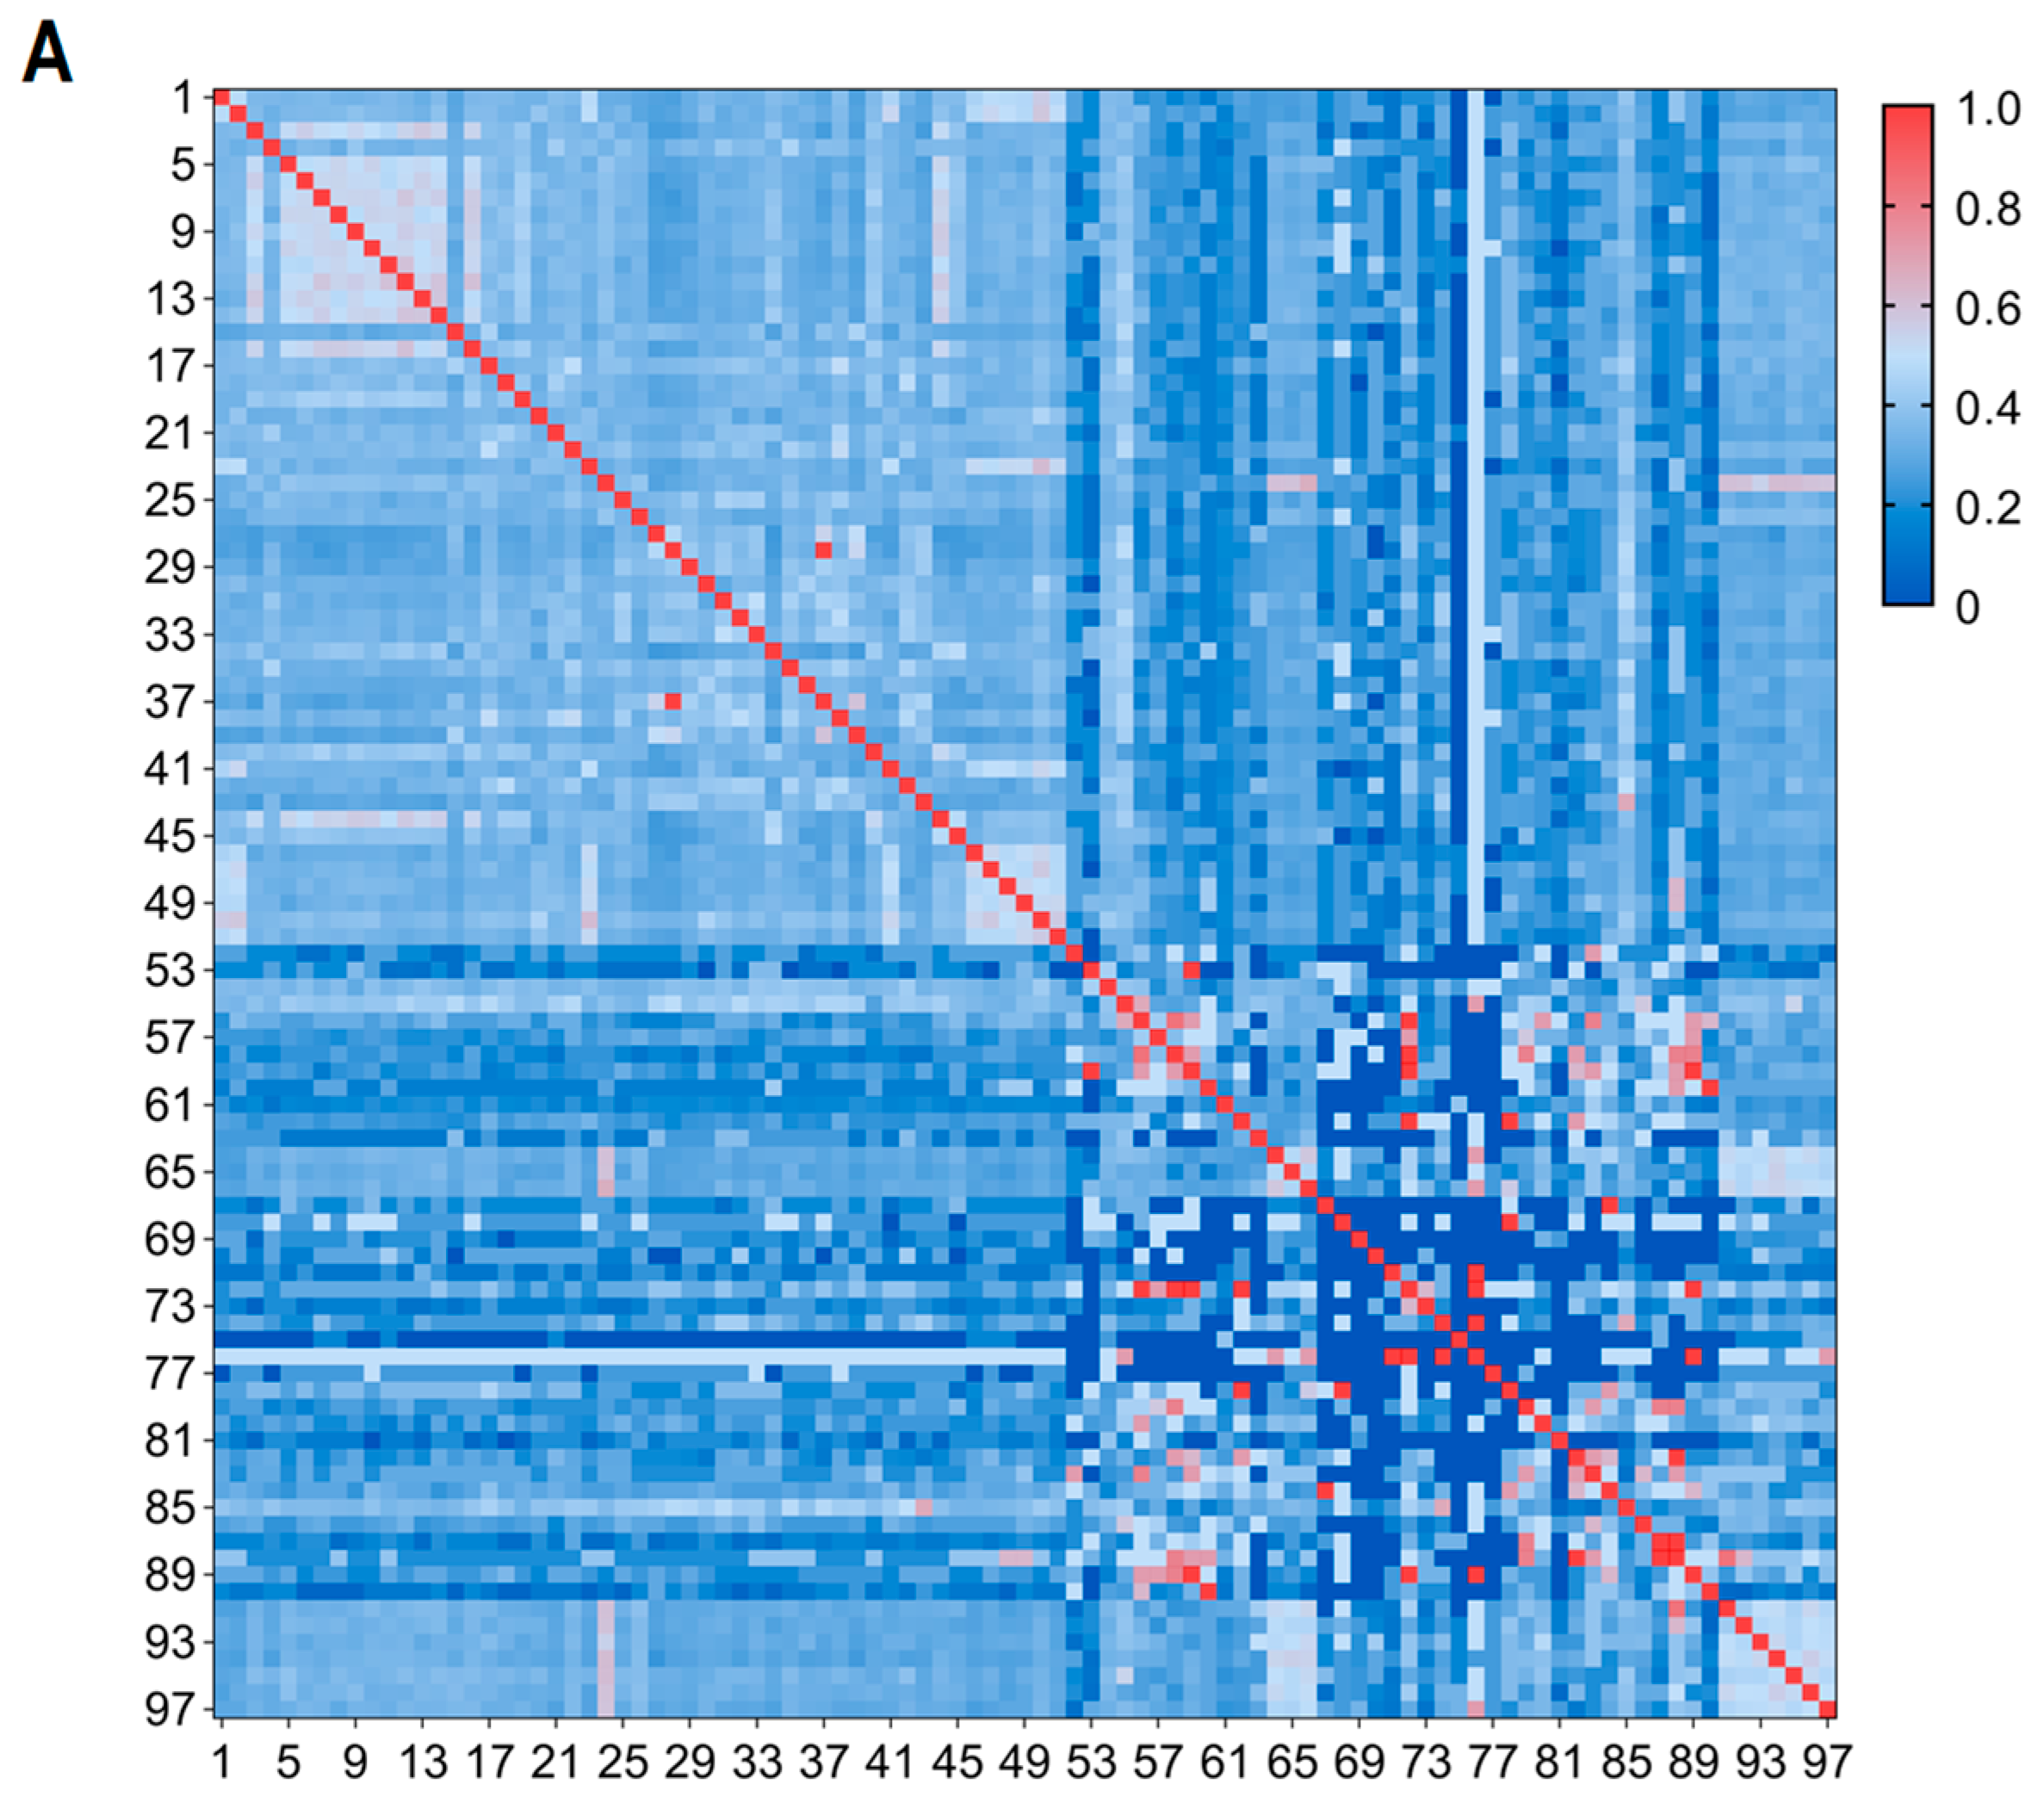
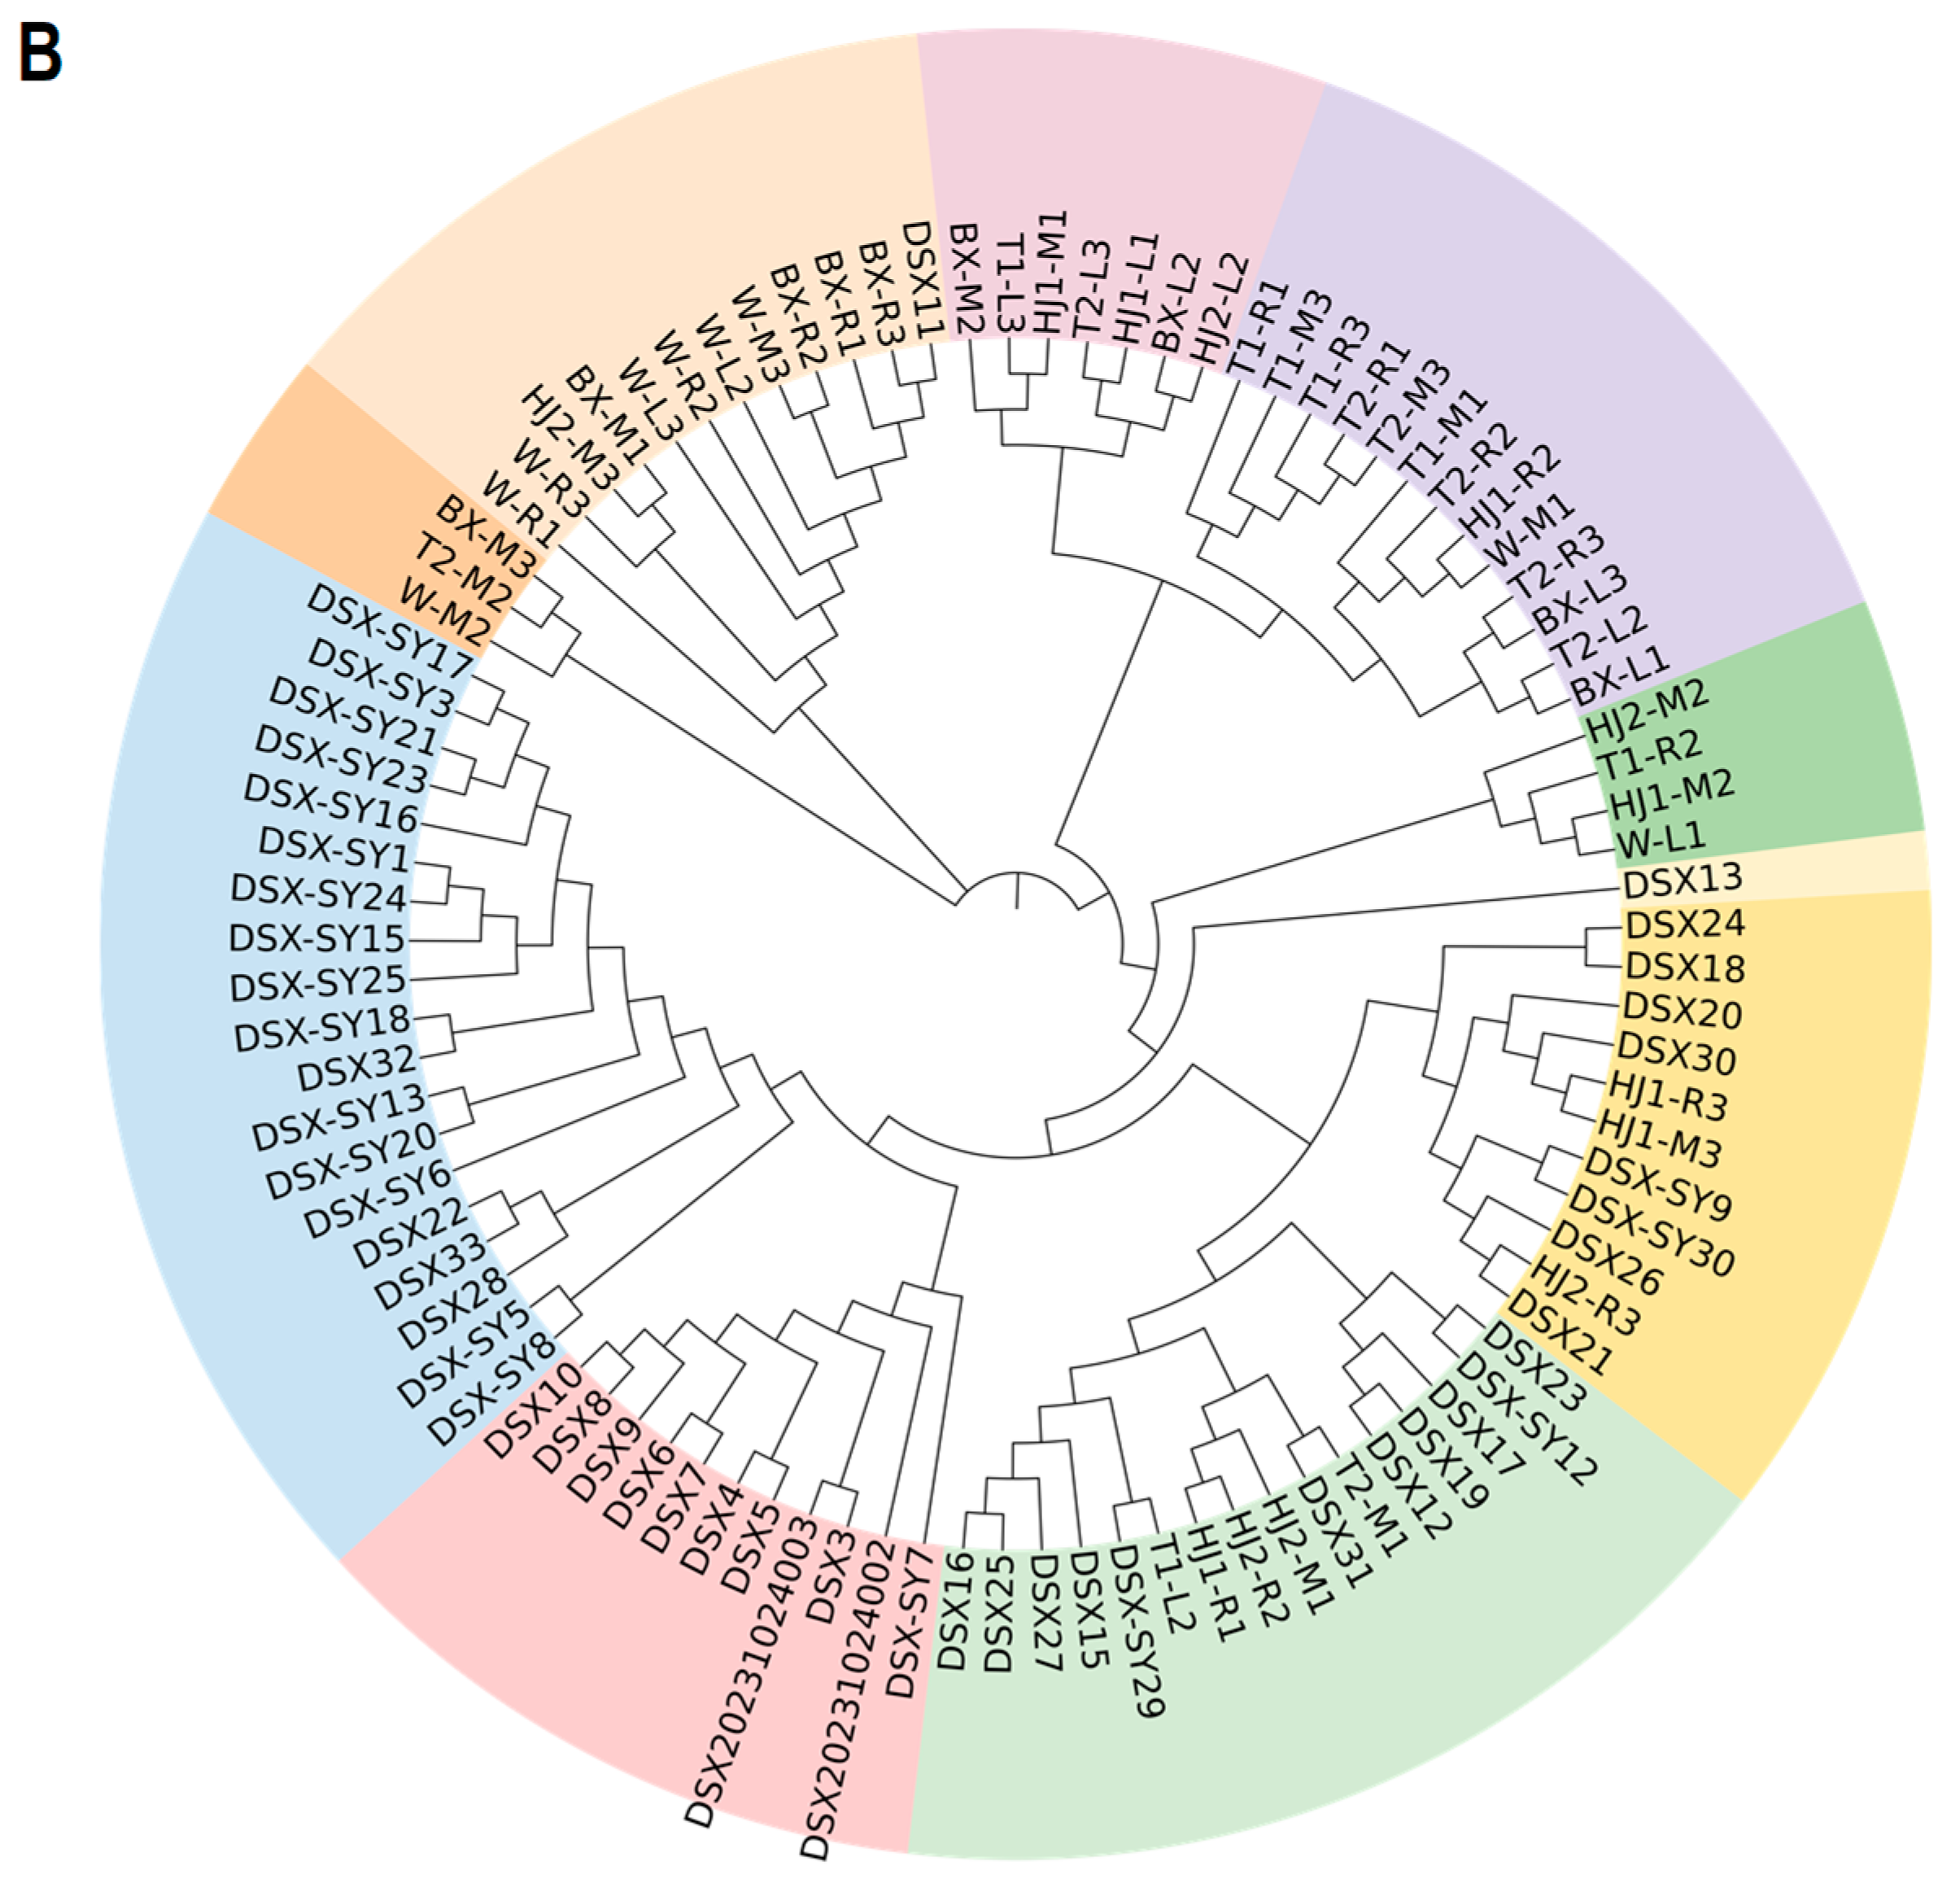
In order to better evaluate the representativeness and biodiversity-reflecting capacity of eDNA captured through MNP markers, we performed a comparative analysis of individual samples (n = 51, after removing non-A. dabryanus individuals DSX20231024001 and DSX20231024004) and water samples (n = 46). A genetic similarity heatmap was constructed using the genetic similarity of 1 minus the genetic differentiation, providing a visual representation of pairwise genetic relatedness across all 97 samples (Figure 8A). The heatmap analysis indicated an overall low level of genetic similarity, with a mean value of 29.54%, across A. dabryanus tissue and water-derived samples, based on 4747 pairwise comparisons. This suggests substantial genetic variability across individuals and sampling sites. These results highlight the strong discriminatory power of the MNP marker system. The Neighbor-Joining tree further supported these findings by revealing distinct genetic clusters corresponding to sample sources: A. dabryanus individuals from captive breeding programs (individual-based samples) and those from the Yangtze River (water-derived samples) clustered separately, with only a few exceptions, and exhibited an average genetic differentiation rate of 70.45% (Figure 8B). This genetic structuring suggests that physical isolation has led to restricted gene flow and incipient divergence between wild and captive populations. Interestingly, individuals from the same geographic region tended to cluster together. For instance, samples from the Jinsha River (BX and W) and the Luzhou region (T1, T2) predominantly formed two separate groups, suggesting that A. dabryanus populations in these areas may occupy relatively fixed activity ranges. However, numerous exceptions were observed. For example, individuals from the Hejiang region (HJ1, HJ2) were dispersed across multiple clusters, indicating that inter-regional gene flow may occur frequently. Together, these results demonstrate the potential of the MNP system to support fine-scale biodiversity assessments and population structure analysis in A. dabryanus.

4. Discussion

In this study, we developed and validated a robust MNP system for the endangered A. dabryanus, enabling accurate species identification (Figure 5) and genetic clustering analysis (Figure 8). The system showed high (>98%) reproducibility and accuracy (Figure 3), with an average detected MNP locus rate above 90%, and average alleles per MNP locus and heterozygosity of 7.48 and 66.53% (Figure 4), respectively. In addition, 41 characteristic alleles specific to A. dabryanus were further identified. Spike-in-based quantification demonstrated strong accuracy (R2 > 0.99), and the method reliably detected multiple loci at concentrations as low as 1 copies/reaction (Figure 6), indicating high sensitivity for low-abundance detection (Figure 7). These results confirm the method’s strong capacity to capture genetic variation and its suitability for both individual and eDNA samples, especially in cases involving low-quality or closely related genetic material. Genetic analysis further revealed substantial population-level differentiation (average divergence: 66.08%), suggesting that A. dabryanus populations harbor high genetic variation, possibly shaped by isolation, habitat disruption, or stocking history.
Given these advantages, the MNP system shows promise as a molecular tool that could contribute to conservation research and practice. Specifically, it has the potential to support the assessment of various strategies, such as artificial breeding, reintroduction programs, and habitat restoration efforts [47]. By enabling the precise identification of individuals and the monitoring of genetic diversity, MNP may allow for the evaluation of the success of release programs and the optimization of release strategies (e.g., family management, release scale, and genetic diversity maintenance). Similar approaches using eDNA mitochondrial markers to assess occupancy of endangered fish (e.g., Yaqui catfish in Mexico) have shown that molecular screening can offer early detection and inform management decisions in restoration contexts [48]. Additionally, MNP, when combined with eDNA, holds promise for enabling large-scale monitoring of species migration patterns and habitat connectivity, thereby providing crucial data that could guide restoration projects and ecological management. For example, recent studies such as the development of eDNA protocols for detection of endangered white sturgeon (Acipenser transmontanus) have demonstrated that carefully designed field-validated eDNA assays can reliably detect rare species in natural systems, reinforcing that molecular methods can supplement more traditional markers [49]. This dual applicability—robust laboratory performance and possible conservation relevance—indicates that the system has potential to serve as a bridge between molecular genetics and applied conservation management.
In summary, the MNP system developed in this study helps to partially address methodological limitations commonly encountered in previous research [50,51,52,53]. By combining strong polymorphism, high resolution, and high detection sensitivity, it represents a powerful molecular tool for the precise identification and genetic monitoring of endangered species, providing critical support for their conservation and restoration.

4.1. Differential Performance of the MNP System in Individual and Environmental Samples

The detection efficiency of MNP markers exhibited marked differences between A. dabryanus individual tissue samples and environmental water samples. In individual samples, the detection rate was consistently high across MNP loci, resulting in a smooth detection curve (Supplementary Figure S1). In contrast, water samples showed much greater variability in detection rates [54,55]. Notably, some markers exhibited detection rates approaching 90% (red arrow in Supplementary Figure S1), indicating that the degradation of different MNP loci in water is uneven. These results suggest that certain MNP markers may be relatively resistant to degradation and thus more suitable for detection in water samples.
The average number of detected MNP loci in individual samples was 395.84, with an average detection rate as high as 93.36% (Figure 3A) and a low standard deviation of only 0.73%. These findings demonstrate that the designed MNP amplification primers exhibit excellent multiplexing capability and strong applicability across A. dabryanus individuals. In comparison, water samples yielded an average of only 85.41 detected loci and a substantially lower average detection rate of 20.14% (Figure 7A). This sharp decrease (approximately 70%) from 93.36% in individual samples to 20.14% in water samples reflects the influence of environmental instability factors such as DNA degradation.
Furthermore, the standard deviation of detection rate in water samples reached 28.17%, which is 38.59 times higher than that of individual samples. This implies considerable variability in DNA content and degradation levels among different water samples, likely driven by uneven population densities or environmental factors. Interestingly, both individual and water samples showed a high proportion of heterozygous loci, 68.38% and 44.71% respectively (Figure 4A; Figure 7B), suggesting that even a small number of A. dabryanus individuals can preserve substantial genetic diversity.

4.2. Advantages of MNP System in eDNA Applications

The MNP system developed in this study offers improvements over traditional limitations (see Introduction), enabling qualitative analysis, abundance quantification, and genetic diversity analysis of A. dabryanus from individual and eDNA samples. To evaluate the reliability of the MNP system in environmental samples, it is important to estimate the probability of successfully detecting a certain number of markers from a given water sample. This not only provides a quantitative measure of the system’s sensitivity but also allows comparison with traditional markers, such as the COI DNA barcode. Based on the data presented in Section 4.1, the probability of detecting at least n markers can be calculated as:
P ( n ) = k = n 424 424 k × 20.14 % k × ( 1 20.14 % ) 424 k
Specifically, the probability of detecting at least 1 marker is:
P(n ≥ 1) = 1 − (1 − 20.14%)424 ≈ 100
Firstly, considering that the COI DNA barcode relies on a single locus and is much longer than the MNP markers, it is more susceptible to degradation in environmental samples, and its detection probability is therefore expected to be much lower than 20.14%. This highlights the unique advantage of MNP-based approaches in addressing the challenge of degraded DNA in water samples.
Secondly, the design of MNP primers in this study intentionally avoided regions with simple sequence repeats and targeted highly polymorphic core regions flanked by conserved sequences. This design strategy mitigates issues of stutter peaks and slippage amplification associated with SSR markers and addresses the problem of overestimated diversity in eDNA studies caused by amplification artifacts. In contrast, the 2017 study by Liu et al. [56], which developed only 20 SSR markers for paternity analysis in A. dabryanus, was limited by lower throughput and resolution. With 424 MNP markers developed, our MNP system thus offers a higher-resolution and more robust approach for genetic analysis across individuals and sample types.
Thirdly, compared to SNP markers, which are typically biallelic, MNPs exhibit exponentially greater allelic diversity, with up to 2n genotypes per locus. This substantial increase in polymorphism is particularly advantageous for distinguishing closely related individuals or populations in samples with low DNA concentration or high degradation. Moreover, assuming a detection error rate of “e” for a single SNP, an MNP composed of “m” linked SNPs would theoretically reduce the overall error rate to “em”. This exponential reduction in error enhances the reliability of rare species detection, a common challenge in eDNA-based monitoring.

4.3. Limitations of MNP Markers

Although the MNP system exhibited strong performance in both individual and environmental samples [33,34,35,36,37], several limitations should be acknowledged. In Figure 3A, non-target species such as A. sinensis (DSX20231024001) and A. ruthenus (DSX20231024004) still showed relatively high detection rates of 91% and 61%, indicating that the 424 MNP markers are not entirely species-specific. This result is understandable given the high genomic similarity between A. dabryanus and closely related sturgeons [57,58,59]. Nevertheless, when combined with genotyping and population genetic analyses, these markers successfully distinguished A. dabryanus from other sturgeons (Figure 5B). In addition, 41 characteristic alleles unique to A. dabryanus were identified, which further supported its separation from non-target species. It is important to recognize that the aim of this MNP system is not to achieve absolute species exclusivity for every locus, but rather to provide a reliable framework for the genetic identification of A. dabryanus. Indeed, within the current dataset of 53 individuals, the system already demonstrated robust discrimination between A. dabryanus and non-A. dabryanus, thereby fulfilling its primary purpose. However, it should be noted that our dataset included only 51 A. dabryanus individuals and merely two non-target sturgeon samples. While this limited sample size allowed us to demonstrate proof-of-concept discrimination, it also restricts the statistical robustness of the findings. A larger and more balanced dataset will be required to validate the universality and reliability of these species-diagnostic alleles, and to expand the applicability of the system in broader conservation and monitoring contexts.
The limitations of the current system are further illustrated by the water-sample data (Table 2). Because contamination is a major concern in eDNA studies [60,61,62], we implemented multiple precautions during sampling and laboratory work, including disinfection during water collection [63,64], the use of routine negative controls, and the incorporation of a dUTP/UDG prevention system during PCR [43,65,66], as reported in previous studies. The effectiveness of these measures is supported by negligible amplification in blank controls (NCK) relative to environmental samples (Figure 6 and Figure 7) and by the low genetic similarity observed between tissue and water samples (Figure 8B), together arguing against systematic contamination.
Some samples (e.g., HJ2-M3 and HJ2-R3) nevertheless showed high spike-in copy numbers but no detection of characteristic A. dabryanus alleles (Table 2). A major reason for this discrepancy is that the set of 41 characteristic alleles was derived from a very limited dataset, consisting of only 51 A. dabryanus individuals and two non-target sturgeons. This small sample size means that the identified alleles do not fully capture the genetic diversity of A. dabryanus, and some diagnostic variants present in natural populations may have been missed. As a result, the current allele set may not be universally applicable across all sampling sites. In addition, target loci in environmental samples are prone to fragmentation and degradation, which further reduces the likelihood of recovering complete allele signatures. Analytical factors such as filtering thresholds in bioinformatic processing may also contribute to allele dropout. Taken together, these considerations indicate that, although the MNP system yields valuable information, the current allele set and study design are insufficient to support a robust, generalizable detection threshold for A. dabryanus in eDNA without expanded sampling and further validation.

4.4. Application of MNP System in Endangered Species Conservation: A Case Study of A. dabryanus

A. dabryanus is a critically endangered species in China, with its population severely threatened by habitat destruction and overfishing. Current conservation measures, including artificial breeding, release, and habitat protection [67], require further scientific validation and optimization, particularly regarding the assessment of release effectiveness. Traditional methods for evaluating release effectiveness, such as physical marking, microsatellite markers, and mitochondrial DNA markers, have certain limitations, such as low polymorphism, high genotyping errors, and invasiveness [47,68,69,70,71,72]. The MNP system, with its high sensitivity, accuracy, and non-invasive nature, provides critical technical support for the conservation of A. dabryanus. This study proposes a conservation plan based on the MNP system to supplement existing release evaluation methods, improve accuracy, and enhance population recovery efforts, making it a more reliable and efficient tool for assessing the effectiveness of conservation measures.
  • Genetic Fingerprint Database: A genetic database will be created with allele genotypes from both wild and released individuals, using specific allelic markers to distinguish between them at the genetic level.
  • Monitoring Released Individuals: DNA from water samples will be analyzed to detect genetic signals from released individuals, allowing tracking of their distribution across time and space.
  • Allelic Gene Penetration Assessment: The specific allelic gene penetration rate (R1) will be calculated to assess the genetic contribution of released fish to the target gene pool. The formula for R1 is: R1 = SAt/SA, Where SAt is the number of specific alleles in released fish, and SA is the total number of alleles from both released and wild fish.
A higher R1 value indicates that released fish are well-represented in the gene pool, and an increasing R1 over time suggests successful growth and reproduction of released individuals in the Yangtze River.
In summary, this study demonstrates how MNP markers can precisely distinguish between released and wild individuals of A. dabryanus through specific allelic genotypes. By quantifying survival rates, the MNP system may help optimize release strategies, providing essential technical support for the conservation of endangered species. Moreover, combining molecular tools with traditional sampling has been shown to significantly improve detection and distribution estimates of endangered marine species, as in the case of the Atlantic wolffish where eDNA detections increased station-based occurrence estimates relative to trawl catches [73].
Taken together, these findings suggest that the MNP system may represent a technically reliable and potentially useful tool for long-term monitoring of endangered species, extending its application beyond methodological development. Thus, the method can be viewed not only as a technical advancement but also as a potentially versatile approach that may inform evidence-based management decisions for A. dabryanus and, with further validation, for other threatened taxa.

5. Conclusions

The MNP system exhibits high sensitivity, stability, resolution, and specificity, making it a promising molecular tool for monitoring endangered species in both individual-based and eDNA-based applications. In this study, the MNP system successfully detected and differentiated A. dabryanus from both individual and environmental samples, enabling genotyping, abundance estimation, and assessment of genetic diversity even from low-quality or trace DNA. The MNP system can complement traditional molecular markers, as each type of marker has its strengths in different applications. As a high-resolution molecular detection tool, the MNP system has the potential to provide effective technical support for evaluating conservation measures, particularly for assessing the effectiveness of release programs and monitoring population recovery. By enabling long-term monitoring, MNP technology could play a crucial role in the conservation of A. dabryanus, a flagship species vital for maintaining the ecological integrity of the Yangtze River.

Supplementary Materials

The following supporting information can be downloaded at https://www.mdpi.com/article/10.3390/d17100704/s1.

Author Contributions

L.C. (Lu Cai) and J.Z. conceived the study. L.C. (Lu Cai), W.J. and T.L. designed the experiments. H.S., H.P., H.C., L.C. (Lihong Chen), R.W., L.G., B.Z. and Z.X. performed the molecular experiments. Z.F., S.L., L.L. and L.C. (Lu Cai) conducted bioinformatic and statistical analyses. L.C. (Lu Cai) drafted the manuscript. T.L. and J.Z. supervised the project and revised the manuscript. All authors have read and agreed to the published version of the manuscript.

Funding

This research was funded by Open Research Fund of Key Laboratory of Three Gorges Project for Conservation of Fishes (2021041-ZHX) and Youth Talent Project of the Scientific Research Program of Hubei Provincial Department of Education (Q20234406).

Data Availability Statement

The datasets supporting this study are available from the corresponding author upon reasonable request. Raw sequencing data from MNP-seq analyses have been deposited in the National Genomics Data Center (NGDC) of the China National Center for Bioinformation (CNCB) under BioProject accession numbers PRJCA039246 and PRJCA039195 (https://ngdc.cncb.ac.cn/ (accessed on 23 April 2025)).

Acknowledgments

We thank the China Three Gorges Corporation for providing access to samples and facilities. The authors are grateful to colleagues at Jianghan University and the Sturgeon Research Institute for their valuable technical assistance. This work was financially supported by Youth Talent Project of the Scientific Research Program of Hubei Provincial Department of Education (Q20234406), Open Research Fund of Key Laboratory of Three Gorges Project for Conservation of Fishes (2021041-ZHX).

Conflicts of Interest

The authors declare that they have no competing interests.

References

  1. Zhang, H.; Kang, M.; Shen, L.; Wu, J.; Li, J.; Du, H.; Wang, C.; Yang, H.; Zhou, Q.; Liu, Z.; et al. Rapid change in Yangtze fisheries and its implications for global freshwater ecosystem management. Fish Fish. 2020, 21, 601–620. [Google Scholar] [CrossRef]
  2. Zhang, H.; Wei, Q.W.; Du, H.; Li, L.X. Present status and risk for extinction of the Dabry’s sturgeon (Acipenser dabryanus) in the Yangtze River watershed: A concern for intensified rehabilitation needs. J. Appl. Ichthyol. 2011, 27, 181–185. [Google Scholar] [CrossRef]
  3. WWF. Saving Sturgeons a Global Report on Their Status and Suggested Conservation Strategy; WWF International: Morges, Switzerland, 2020. [Google Scholar]
  4. Huang, Z.; Wang, L. Yangtze Dams Increasingly Threaten the Survival of the Chinese Sturgeon. Curr. Biol. 2018, 28, 3640–3647.e18. [Google Scholar] [CrossRef]
  5. Xie, P. Three-Gorges Dam: Risk to ancient fish. Science 2003, 302, 1149–1151. [Google Scholar] [CrossRef]
  6. Coble, A.A.; Flinders, C.A.; Homyack, J.A.; Penaluna, B.E.; Cronn, R.C.; Weitemier, K. eDNA as a tool for identifying freshwater species in sustainable forestry: A critical review and potential future applications. Sci. Total Environ. 2019, 649, 1157–1170. [Google Scholar] [CrossRef]
  7. Harrison, J.B.; Sunday, J.M.; Rogers, S.M. Predicting the fate of eDNA in the environment and implications for studying biodiversity. Proc. Biol. Sci. 2019, 286, 20191409. [Google Scholar] [CrossRef]
  8. Pont, D.; Rocle, M.; Valentini, A.; Civade, R.; Jean, P.; Maire, A.; Roset, N.; Schabuss, M.; Zornig, H.; Dejean, T. Environmental DNA reveals quantitative patterns of fish biodiversity in large rivers despite its downstream transportation. Sci. Rep. 2018, 8, 10361. [Google Scholar] [CrossRef]
  9. Levy-Booth, D.J.; Campbell, R.G.; Gulden, R.H.; Hart, M.M.; Powell, J.R.; Klironomos, J.N.; Pauls, K.P.; Swanton, C.J.; Trevors, J.T.; Dunfield, K.E. Cycling of extracellular DNA in the soil environment. Soil. Biol. Biochem. 2007, 39, 2977–2991. [Google Scholar] [CrossRef]
  10. Pietramellara, G.; Ascher, J.; Borgogni, F.; Ceccherini, M.T.; Guerri, G.; Nannipieri, P. Extracellular DNA in soil and sediment: Fate and ecological relevance. Biol. Fert. Soils 2009, 45, 219–235. [Google Scholar] [CrossRef]
  11. Nevers, M.B.; Byappanahalli, M.N.; Morris, C.C.; Shively, D.; Przybyla-Kelly, K.; Spoljaric, A.M.; Dickey, J.; Roseman, E.F. Environmental DNA (eDNA): A tool for quantifying the abundant but elusive round goby (Neogobius melanostomus). PLoS ONE 2018, 13, e0191720. [Google Scholar] [CrossRef] [PubMed]
  12. Monteiro, C.S.; Deconinck, D.; Eljasik, P.; Sobczak, M.; Derycke, S.; Panicz, R.; Kane, N.; Mazloomrezaei, M.; Devlin, R.H.; Faria, M.A. A fast HRMA tool to authenticate eight salmonid species in commercial food products. Food Chem. Toxicol. 2021, 156, 112440. [Google Scholar] [CrossRef]
  13. Giusti, A.; Tinacci, L.; Sotelo, C.G.; Marchetti, M.; Guidi, A.; Zheng, W.; Armani, A. Seafood Identification in Multispecies Products: Assessment of 16S rRNA, Cytb, and COI Universal Primers’ Efficiency as a Preliminary Analytical Step for Setting up Metabarcoding Next-Generation Sequencing Techniques. J. Agric. Food Chem. 2017, 65, 2902–2912. [Google Scholar] [CrossRef]
  14. Milan, D.T.; Mendes, I.S.; Damasceno, J.S.; Teixeira, D.F.; Sales, N.G.; Carvalho, D.C. New 12S metabarcoding primers for enhanced Neotropical freshwater fish biodiversity assessment. Sci. Rep. 2020, 10, 17966. [Google Scholar] [CrossRef]
  15. Guichoux, E.; Lagache, L.; Wagner, S.; Chaumeil, P.; Leger, P.; Lepais, O.; Lepoittevin, C.; Malausa, T.; Revardel, E.; Salin, F.; et al. Current trends in microsatellite genotyping. Mol. Ecol. Resour. 2011, 11, 591–611. [Google Scholar] [CrossRef]
  16. Mastrochirico-Filho, V.A.; Del Pazo, F.; Hata, M.E.; Villanova, G.V.; Foresti, F.; Vera, M.; Martinez, P.; Porto-Foresti, F.; Hashimoto, D.T. Assessing Genetic Diversity for a Pre-Breeding Program in Piaractus mesopotamicus by SNPs and SSRs. Genes 2019, 10, 668. [Google Scholar] [CrossRef] [PubMed]
  17. Bylemans, J.; Furlan, E.M.; Gleeson, D.M.; Hardy, C.M.; Duncan, R.P. Does Size Matter? An Experimental Evaluation of the Relative Abundance and Decay Rates of Aquatic Environmental DNA. Environ. Sci. Technol. 2018, 52, 6408–6416. [Google Scholar] [CrossRef] [PubMed]
  18. Song, H.; Buhay, J.E.; Whiting, M.F.; Crandall, K.A. Many species in one: DNA barcoding overestimates the number of species when nuclear mitochondrial pseudogenes are coamplified. Proc. Natl. Acad. Sci. USA 2008, 105, 13486–13491. [Google Scholar] [CrossRef] [PubMed]
  19. Magnacca, K.N.; Brown, M.J. Mitochondrial heteroplasmy and DNA barcoding in Hawaiian Hylaeus (Nesoprosopis) bees (Hymenoptera: Colletidae). BMC Evol. Biol. 2010, 10, 174. [Google Scholar] [CrossRef]
  20. Sultana, S.; Ali, M.E.; Hossain, M.A.M.; Asing Naquiah, N.; Zaidul, I.S.M. Universal mini COI barcode for the identification of fish species in processed products. Food Res. Int. 2018, 105, 19–28. [Google Scholar] [CrossRef]
  21. Palumbo, F.; Scariolo, F.; Vannozzi, A.; Barcaccia, G. NGS-based barcoding with mini-COI gene target is useful for pet food market surveys aimed at mislabelling detection. Sci. Rep. 2020, 10, 17767. [Google Scholar] [CrossRef]
  22. Hajibabaei, M.; McKenna, C. DNA mini-barcodes. Methods Mol. Biol. 2012, 858, 339–353. [Google Scholar]
  23. Yuan, H.; Han, J.; Yang, M.; Chen, S.; Pang, X. DNA Metabarcoding: Current Applications and Challenges. J. Agric. Food Chem. 2025, 73, 20616–20632. [Google Scholar] [CrossRef]
  24. Creedy, T.J.; Andujar, C.; Meramveliotakis, E.; Noguerales, V.; Overcast, I.; Papadopoulou, A.; Morlon, H.; Vogler, A.P.; Emerson, B.C.; Arribas, P. Coming of age for COI metabarcoding of whole organism community DNA: Towards bioinformatic harmonisation. Mol. Ecol. Resour. 2022, 22, 847–861. [Google Scholar] [CrossRef] [PubMed]
  25. Burki, F.; Sandin, M.M.; Jamy, M. Diversity and ecology of protists revealed by metabarcoding. Curr. Biol. 2021, 31, R1267–R1280. [Google Scholar] [CrossRef] [PubMed]
  26. Miya, M. Environmental DNA Metabarcoding: A Novel Method for Biodiversity Monitoring of Marine Fish Communities. Ann. Rev. Mar. Sci. 2022, 14, 161–185. [Google Scholar] [CrossRef] [PubMed]
  27. Francioli, D.; Lentendu, G.; Lewin, S.; Kolb, S. DNA Metabarcoding for the Characterization of Terrestrial Microbiota-Pitfalls and Solutions. Microorganisms 2021, 9, 361. [Google Scholar] [CrossRef]
  28. Harr, B.; Zangerl, B.; Schlotterer, C. Removal of microsatellite interruptions by DNA replication slippage: Phylogenetic evidence from Drosophila. Mol. Biol. Evol. 2000, 17, 1001–1009. [Google Scholar] [CrossRef]
  29. Shinde, D.; Lai, Y.; Sun, F.; Arnheim, N. Taq DNA polymerase slippage mutation rates measured by PCR and quasi-likelihood analysis: (CA/GT)n and (A/T)n microsatellites. Nucleic Acids Res. 2003, 31, 974–980. [Google Scholar] [CrossRef]
  30. Hosseinzadeh-Colagar, A.; Haghighatnia, M.J.; Amiri, Z.; Mohadjerani, M.; Tafrihi, M. Microsatellite (SSR) amplification by PCR usually led to polymorphic bands: Evidence which shows replication slippage occurs in extend or nascent DNA strands. Mol. Biol. Res. Commun. 2016, 5, 167–174. [Google Scholar]
  31. Morin, P.A.; Luikart, G.; Wayne, R.K.; the SNP workshop group. SNPs in ecology, evolution and conservation. Trends Ecol. Evol. 2004, 19, 208–216. [Google Scholar] [CrossRef]
  32. Fang, Z.W.; Li, L.; Zhou, J.F.; You, A.Q.; Gao, L.F.; Li, T.T.; Chen, H.; Han, R.X.; Cui, Y.H.; Chen, L.H.; et al. Multiple nucleotide polymorphism DNA markers for the accurate evaluation of genetic variations. bioRxiv 2021. 03:09.434561. [Google Scholar] [CrossRef]
  33. Liu, J.; Wang, H.; Fan, X.; Zhang, Y.; Sun, L.; Liu, C.; Fang, Z.; Zhou, J.; Peng, H.; Jiang, J. Establishment and application of a Multiple nucleotide polymorphism molecular identification system for grape cultivars. Sci. Hortic. 2024, 325, 112642. [Google Scholar] [CrossRef]
  34. Ling, Y.Y.; Zhang, M.Z.; Ling, Z.L.; Cao, B.; Wu, X.P.; Peng, H.; Wang, Z.R.; Zhao, R.L. Evolutionary relationship and a novel method of efficient identification of Lentinula edodes cultivars in China. Mycosphere 2023, 13, 56–85. [Google Scholar] [CrossRef]
  35. Liu, F.; Wang, S.H.; Jia, D.H.; Tan, H.; Wang, B.; Zhao, R.L. Development of Multiple Nucleotide Polymorphism Molecular Markers for Enoki Mushroom (Flammulina filiformis) Cultivars Identification. J. Fungi 2023, 9, 330. [Google Scholar] [CrossRef] [PubMed]
  36. Liu, Y.F.; Zhao, Q.; Li, T.T.; Teng, C.L.; Peng, H.; Yao, Z.G.; Fang, Z.W.; Zhou, J.F.; Yang, X.H.; Qiao, J.X.; et al. Availability Evaluation and Application of MNP (Multiple Nucleotide Polymorphism) Markers in Variety Identification of Chrysanthemum. Horticulturae 2024, 10, 845. [Google Scholar] [CrossRef]
  37. Yi, Y.; Jiang, Z.; Ma, L.; Hou, X.; Li, L.; Ye, D.; Du, J.; Peng, H.; Han, G.; Li, H.; et al. Simultaneous identification of multiple animal-derived components in meat and meat products by using MNP marker based on high-throughput sequencing. Food Sci. Hum. Wellness 2025, 14, 9250178. [Google Scholar] [CrossRef]
  38. Ye, H.M.; Li, P.C.; Wu, J.M.; Shen, L.; Li, j.Y.; Du, H. Habitat distribution characteristics and key influencing factors analysis of artificially stocked juvenile Yangtze sturgeon (Acipenser dabryanus) in the Luzhou section of the Yangtze River. Acta Hydrobiol. Sin. 2025, 2025, 1–10. (In Chinese) [Google Scholar]
  39. Liu, W.C.; Li, J.Y.; Wu, J.M.; Ye, H.M.; Li, P.C.; Shen, L.; Du, H. Effectiveness assessment of Yangtze sturgeon (Acipenser dabryanus) stock enhancement in the upper Yangtze River during the initial fishing ban period. Acta Hydrobiol. Sin. 2025, 49, 26–33. (In Chinese) [Google Scholar]
  40. Wang, Y.; Hu, Y.; Zhang, T. Current status and perspective of RAD-seq in genomic research. Yi Chuan 2014, 36, 41–49. [Google Scholar]
  41. Langmead, B.; Salzberg, S.L. Fast gapped-read alignment with Bowtie 2. Nat. Methods 2012, 9, 357–359. [Google Scholar] [CrossRef]
  42. Danecek, P.; Bonfield, J.K.; Liddle, J.; Marshall, J.; Ohan, V.; Pollard, M.O.; Whitwham, A.; Keane, T.; McCarthy, S.A.; Davies, R.M.; et al. Twelve years of SAMtools and BCFtools. Gigascience 2021, 10, giab008. [Google Scholar] [CrossRef]
  43. Gao, L.; Li, L.; Fang, B.; Fang, Z.; Xiang, Y.; Zhang, M.; Zhou, J.; Song, H.; Chen, L.; Li, T.; et al. Carryover Contamination-Controlled Amplicon Sequencing Workflow for Accurate Qualitative and Quantitative Detection of Pathogens: A Case Study on SARS-CoV-2. Microbiol. Spectr. 2023, 11, e0020623. [Google Scholar] [CrossRef]
  44. Chen, K.; Hu, Z.; Xia, Z.; Zhao, D.; Li, W.; Tyler, J.K. The Overlooked Fact: Fundamental Need for Spike-In Control for Virtually All Genome-Wide Analyses. Mol. Cell Biol. 2015, 36, 662–667. [Google Scholar] [CrossRef]
  45. Wilhelm, J.; Pingoud, A.; Hahn, M. Real-time PCR-based method for the estimation of genome sizes. Nucleic Acids Res. 2003, 31, e56. [Google Scholar] [CrossRef]
  46. Blackburn, J.; Wong, T.; Madala, B.S.; Barker, C.; Hardwick, S.A.; Reis, A.L.M.; Deveson, I.W.; Mercer, T.R. Use of synthetic DNA spike-in controls (sequins) for human genome sequencing. Nat. Protoc. 2019, 14, 2119–2151. [Google Scholar] [CrossRef] [PubMed]
  47. Du, C.Z.; Jin, G.F.; Wu, L.; Que, P.Z.; Lu, X.Y.; Lu, H.H.; Sun, C.; Gu, Z.X. Evaluation of the proliferation and release effect of Schizothorax in high-altitude areas based on labeling technology. Environ. Ecol. 2025, 7, 46–52. (In Chinese) [Google Scholar]
  48. Stewart, D.R.; Hafen, T.; Hendrickson, D.A.; Taylor, A.T.; Varela-Romero, A.; Mason, D.H.; Dysthe, J.C.; Franklin, T.W.; Young, M.K.; McKelvey, K.S.; et al. Environmental DNA mitochondrial markers to assess potential occupancy of Endangered Yaqui catfish in the Yaqui River basin, Mexico. Endanger. Species Res. 2024, 53, 569–586. [Google Scholar] [CrossRef]
  49. Crossman James, A.; Flores, A.M.; Messmer, A.; Nelson, R.J.; McAdam Steve, O.; Johnson, P.; Reece, P.; Koop Ben, F. Development of eDNA Protocols for Detection of Endangered White Sturgeon (Acipenser transmontanus) in the Wild. Environ. DNA 2024, 6, e70006. [Google Scholar] [CrossRef]
  50. Singh, N.; Choudhury, D.R.; Singh, A.K.; Kumar, S.; Srinivasan, K.; Tyagi, R.K.; Singh, N.K.; Singh, R. Comparison of SSR and SNP markers in estimation of genetic diversity and population structure of Indian rice varieties. PLoS ONE 2013, 8, e84136. [Google Scholar] [CrossRef]
  51. Kalita, M.C.; Mohapatra, T.; Dhandapani, A.; Yadavad, D.K.; Srinivasanb, K.; Mukherjeee, A.K.; Sharmab, R.P. Comparative Evaluation of RAPD, ISSR and Anchored-SSR Markers in the Assessment of Genetic Diversity and Fingerprinting of Oilseed Brassica Genotypes. J. Plant Biochem. Biotechnol. 2007, 16, 41–48. [Google Scholar] [CrossRef]
  52. Gettings, K.B.; Kiesler, K.M.; Vallone, P.M. Performance of a next generation sequencing SNP assay on degraded DNA. Forensic Sci. Int. Genet. 2015, 19, 1–9. [Google Scholar] [CrossRef] [PubMed]
  53. Butler, J.M.; Coble, M.D.; Vallone, P.M. STRs vs. SNPs: Thoughts on the future of forensic DNA testing. Forensic Sci. Med. Pathol. 2007, 3, 200–205. [Google Scholar] [CrossRef] [PubMed]
  54. Jerde, C.L.; Olds, B.P.; Shogren, A.J.; Andruszkiewicz, E.A.; Mahon, A.R.; Bolster, D.; Tank, J.L. Influence of Stream Bottom Substrate on Retention and Transport of Vertebrate Environmental DNA. Environ. Sci. Technol. 2016, 50, 8770–8779. [Google Scholar] [CrossRef]
  55. Andruszkiewicz Allan, E.; Zhang, W.G.; CLavery, A.; FGovindarajan, A. Environmental DNA shedding and decay rates from diverse animal forms and thermal regimes. Environ. DNA 2020, 3, 492–514. [Google Scholar] [CrossRef]
  56. Liu, Y.; Chen, Y.; Gong, Q.; Lai, J.; Du, J.; Deng, X. Paternity assignment in the polyploid Acipenser dabryanus based on a novel microsatellite marker system. PLoS ONE 2017, 12, e0185280. [Google Scholar] [CrossRef]
  57. Zhang, S.M.; Zhang, Y.P.; Zheng, X.Z.; Chen, Y.J.; Deng, H.; Wang, D.Q.; Wei, Q.W.; Zhang, Q.W.; Nie, L.; Wu, Q.J. Sequence variation of the mitochondrial DNA ND4L-ND4 gene and molecular systematics of 12 species of Acipenseriformes. Sci. China (Ser. C) 1999, 29, 608–614. (In Chinese) [Google Scholar]
  58. Zhang, S.M.; Wu, Q.J.; Zhang, Y.P. Tandem repeat sequences in the control region of mtDNA and their evolutionary significance in Chinese sturgeon (Acipenser sinensis) and related species. Acta Biochim. Biophys. Sin. 2000, 32, 458–461. (In Chinese) [Google Scholar]
  59. Zhang, S.M.; Wu, Q.J.; Zhang, Y.P. On the taxonomic status of Yangtze sturgeon, Asian and American green sturgeon based on mitochondrial control region sequences. Acta Zool. Sin. 2001, 47, 632–639. (In Chinese) [Google Scholar]
  60. Guillera-Arroita, G.; Lahoz-Monfort, J.J.; van Rooyen, A.R.; Weeks, A.R.; Tingley, R.; McCrea, R. Dealing with false-positive and false-negative errors about species occurrence at multiple levels. Methods Ecol. Evol. 2017, 8, 1081–1091. [Google Scholar] [CrossRef]
  61. Lahoz-Monfort, J.J.; Guillera-Arroita, G.; Tingley, R. Statistical approaches to account for false-positive errors in environmental DNA samples. Mol. Ecol. Resour. 2016, 16, 673–685. [Google Scholar] [CrossRef]
  62. Hansen, B.K.; Bekkevold, D.; Clausen, L.W.; Nielsen, E.E. The sceptical optimist: Challenges and perspectives for the application of environmental DNA in marine fisheries. Fish Fish. 2018, 19, 751–768. [Google Scholar] [CrossRef]
  63. Shu, L.; Ludwig, A.; Peng, Z. Standards for Methods Utilizing Environmental DNA for Detection of Fish Species. Genes 2020, 11, 296. [Google Scholar] [CrossRef]
  64. Ai, Q.; Yuan, H.; Wang, Y.; Li, C. Estimation of Species Abundance Based on the Number of Segregating Sites Using Environmental DNA (eDNA). Mol. Ecol. Resour. 2025, 25, e14076. [Google Scholar] [CrossRef]
  65. Liu, W.E.; Tan, D.; Zhang, Z. Serum HBV DNA detected by polymerase chain reaction with dUTP/uracil-DNA glycosylase. Hunan Yi Ke Da Xue Xue Bao 1998, 23, 278–280. [Google Scholar]
  66. Song, D.; Xu, C.; Sang, P.; Liu, Y.; Huang, X. Rapid and contamination-free detection of cucumber green mottle mosaic virus as a viral indicator in wastewater via UDG-RT-LAMP combined with CRISPR/Cas12a. J. Hazard. Mater. 2025, 497, 139571. [Google Scholar] [CrossRef]
  67. Xu, L.X.; Zhou, L.; Wei, Q.W. Stock status and conservation dilemma of species of Acipenseriformes in the Yangtze River and relevant suggestions. J. Fish. China 2023, 47, 029304. (In Chinese) [Google Scholar]
  68. Ding, Y.; Ren, Z.J.; Xu, X.; Lu, Y.J.; Lou, F.R. Evaluation of stock enhancement effect of Oplegnathus fasciatus in Yinshan Bay based on microsatellite markers. J. Yantai Univ. (Nat. Sci. Eng. Ed.) 2025. (In Chinese) [Google Scholar] [CrossRef]
  69. Qiu, J.Y.; Lu, D.; Hu, Y.L.; Wang, W.J.; Lu, G.Z.; Shan, X.J. Evaluation of the proliferation and release effect of Fenneropenaeus chinensis in high-altitude areas based on molecular marker technology. J. Fish. Sci. China 2025, 32, 362–371. (In Chinese) [Google Scholar]
  70. Sy, Z. Evaluation of Callista chinensis stock enhancement effect based on microsatellite markers. J. Fish. Sci. China 2025, 52–55. (In Chinese) [Google Scholar]
  71. Fazekas, G.; Kovács, G.; Sándor, Z.J.; Bogár, K.; Géczi, A.; Kovács, B. Genetic Characterization of Endangered Sterlet (Acipenser ruthenus, Linnaeus 1758) Gene Bank Broodstock, Natural and Cultured Populations in Hungary. Fishes 2024, 9, 201. [Google Scholar] [CrossRef]
  72. Yang, S.; Zhao, Z.; Xu, Z.; Liu, Y.; Jiang, M.; Fu, L.; Zhang, J.; Jing, Z.; Pang, X.; Shao, W.; et al. Identification of Hybrid Sturgeon (Acipenser baerii × Acipenser schrenckii) from Their Parents Using Germplasm. Animals 2025, 15, 907. [Google Scholar] [CrossRef] [PubMed]
  73. Chevrinais, M.; Bourret, A.; Cote, G.; Faille, G.; Gagne, N.; Parent, G.J. Improving an endangered marine species distribution using reliable and localized environmental DNA detections combined with trawl captures. Sci. Rep. 2025, 15, 11926. [Google Scholar] [CrossRef] [PubMed]
Figure 1. The Procedure of MNP Marker Development for A. dabryanus. The development of MNP markers involves two steps: (1) identifying candidate MNP genomic loci with diverse alleles in A. dabryanus and (2) refining the candidate MNP markers to design effective PCR primers. Each colorful dot represents an SNP site on the genomic sequences. The MNP genotyping process includes steps (3)–(8): constructing a high-throughput sequencing library and performing sequencing, followed by reads filtering, assembly, and alignment. Genotyping is then conducted by comparing the assembled sequences with the reference genome.
Diversity 17 00704 g001
Figure 3. Validation of MNP marker detection capability. (A) Number of detected MNP loci across 53 individual tissue samples. (B) Reproducibility rate (green) and accuracy rate (orange). 8 individuals randomly selected from 53 individual samples were used for the reproducibility experiment.
Diversity 17 00704 g003
Figure 4. Evaluation of MNP Markers. (A) Heterozygosity for each MNP marker. (B) Number of alleles per MNP marker. (C) The discriminative power of 424 MNP loci across 53 individual samples.
Diversity 17 00704 g004
Figure 5. Application of species identification based on MNP markers. (A) Distribution of sample differences in 53 individuals. Pairwise comparisons of these 53 individuals yielded 1378 sample-pair difference ratios. The proportion of sample differences was quantified as genetic differentiation, defined as the ratio of differing MNP loci to common MNP loci between two samples. (B) Neighbor-joining tree of genetic clustering analysis based on the proportion of sample differences for 53 individuals. (C) Characteristic alleles of A. dabryanus and comparison with non-A. dabryanus species. Top panel: Heatmap showing the presence and frequency of 41 characteristic alleles for A. dabryanus (red indicates high frequency, blue indicates low frequency) across A. dabryanus individuals and non-A. dabryanus samples. Bottom panel: Sequence alignment of representative MNP loci (e.g., AMPL1860266) showing the SNP differences (highlighted in blue boxes) between A. dabryanus and other species (A. sinensis and A. ruthenus). (D) Distribution of the number of SNP differences among 41 characteristic alleles between A. dabryanus and non-A. dabryanus. The colored dots represent the number of SNPs that differ between A. dabryanus and non-A. dabryanus at each characteristic allele. Since the types and quantities of SNPs differ between A. dabryanus and non-A. dabryanus at each characteristic allele, a single allele may exhibit one or more differing SNP combinations, ultimately resulting in different alleles.
Diversity 17 00704 g005aDiversity 17 00704 g005b
Figure 6. Quantitative and sensitivity analysis of A. dabryanus individuals based on DNA Spike-In. (A) Diagram of DNA spike-in design for quantitative analysis, including 7 MNP loci (blue). (B) Statistical analysis of A. dabryanus MNP loci detected across 9 experimental groups with varying DNA concentrations and a negative control (NCK). The horizontal line “—” represents the mean value. The values to the left of the dashed line (10, 1) correspond to the left Y-axis, while those to the right of the dashed line (0.1, 0.01, 0.001, 0.0002, 0.00004, 0.000008 and NCK) correspond to the right Y-axis. Note: The third data group (the “0.1 ng/reaction” group) contains only two replicates due to the accidental loss of one sample during experimental processing. (C) Computationally fitted curve of the relationship between the DNA concentration and the DNA Spike-In-based copy number. The asterisk (*) indicates a × symbol. (D) Sensitivity analysis of MNP system detection.
Diversity 17 00704 g006
Figure 7. Quantitative analysis of environmental DNA based on DNA Spike-In. (A) Number of detected MNP loci in A. dabryanus individual samples and environmental samples. (B) Heterozygosity in A. dabryanus individual samples and environmental samples. (C) Number of detected MNP loci (green, right y-axis) and copy number (orange, left y-axis) based on DNA Spike-In of environmental DNA. (D) Number of characteristic alleles detected in 11 water samples.
Diversity 17 00704 g007
Figure 8. Correlation analysis and genetic clustering analysis of A. dabryanus individual samples and environmental samples. (A) Correlation analysis between 97 samples (51 A. dabryanus individual samples and 46 environmental samples) based on the sample similarity proportion. The figure shows pairwise comparison results between 97 samples. The similarity proportion is defined as 1 minus the sample difference proportion. (B) Neighbor-joining genetic clustering analysis tree of 97 samples. Individual samples not belonging to A. dabryanus (DSX20231024001 and DSX20231024004) have been removed.
Diversity 17 00704 g008aDiversity 17 00704 g008b
Table 1. Statistical results of reproducibility and accuracy rates.
Sample NameLibrary 1Library 2Number of Common MNP Markers Number of Different MNP Markers ReproducibilityAccuracy
DSX4DSX4-1DSX4-2370598.65%99.33%
DSX5DSX5-1DSX5-2374399.20%99.60%
DSX8DSX8-1DSX8-2377698.41%99.21%
DSX9DSX9-1DSX9-2389498.97%99.49%
DSX10DSX10-1DSX10-2350399.14%99.57%
DSX-SY7DSX-SY7-1DSX-SY7-2394199.75%99.88%
DSX-SY13DSX-SY13-1DSX-SY13-2388498.97%99.49%
DSX-SY20DSX-SY20-1DSX-SY20-2391299.49%99.75%
Table 2. Summary of DNA copy numbers, detected MNP loci, and characteristic alleles identified across 11 water samples.
Water SampleDNA Spike-In-Based Copy NumberNumber of MNP LociNumber of MNP Loci
NCK-1430
NCK-2000
NCK-3310
W-L32658930
W-M28433
BX-L263473
BX-M235262
BX-R18125835
T2-M110921618
T1-L221635
HJ2-M31250190
HJ2-R3139470
HJ1-M1650101
HJ1-R31542
Disclaimer/Publisher’s Note: The statements, opinions and data contained in all publications are solely those of the individual author(s) and contributor(s) and not of MDPI and/or the editor(s). MDPI and/or the editor(s) disclaim responsibility for any injury to people or property resulting from any ideas, methods, instructions or products referred to in the content.