
Retrotransposon-Based Genetic Diversity of Rhodiola rosea L. (Crassulaceae) from Kazakhstan Altai

 , ,
, , 
Abstract
1. Introduction
2. Materials and Methods
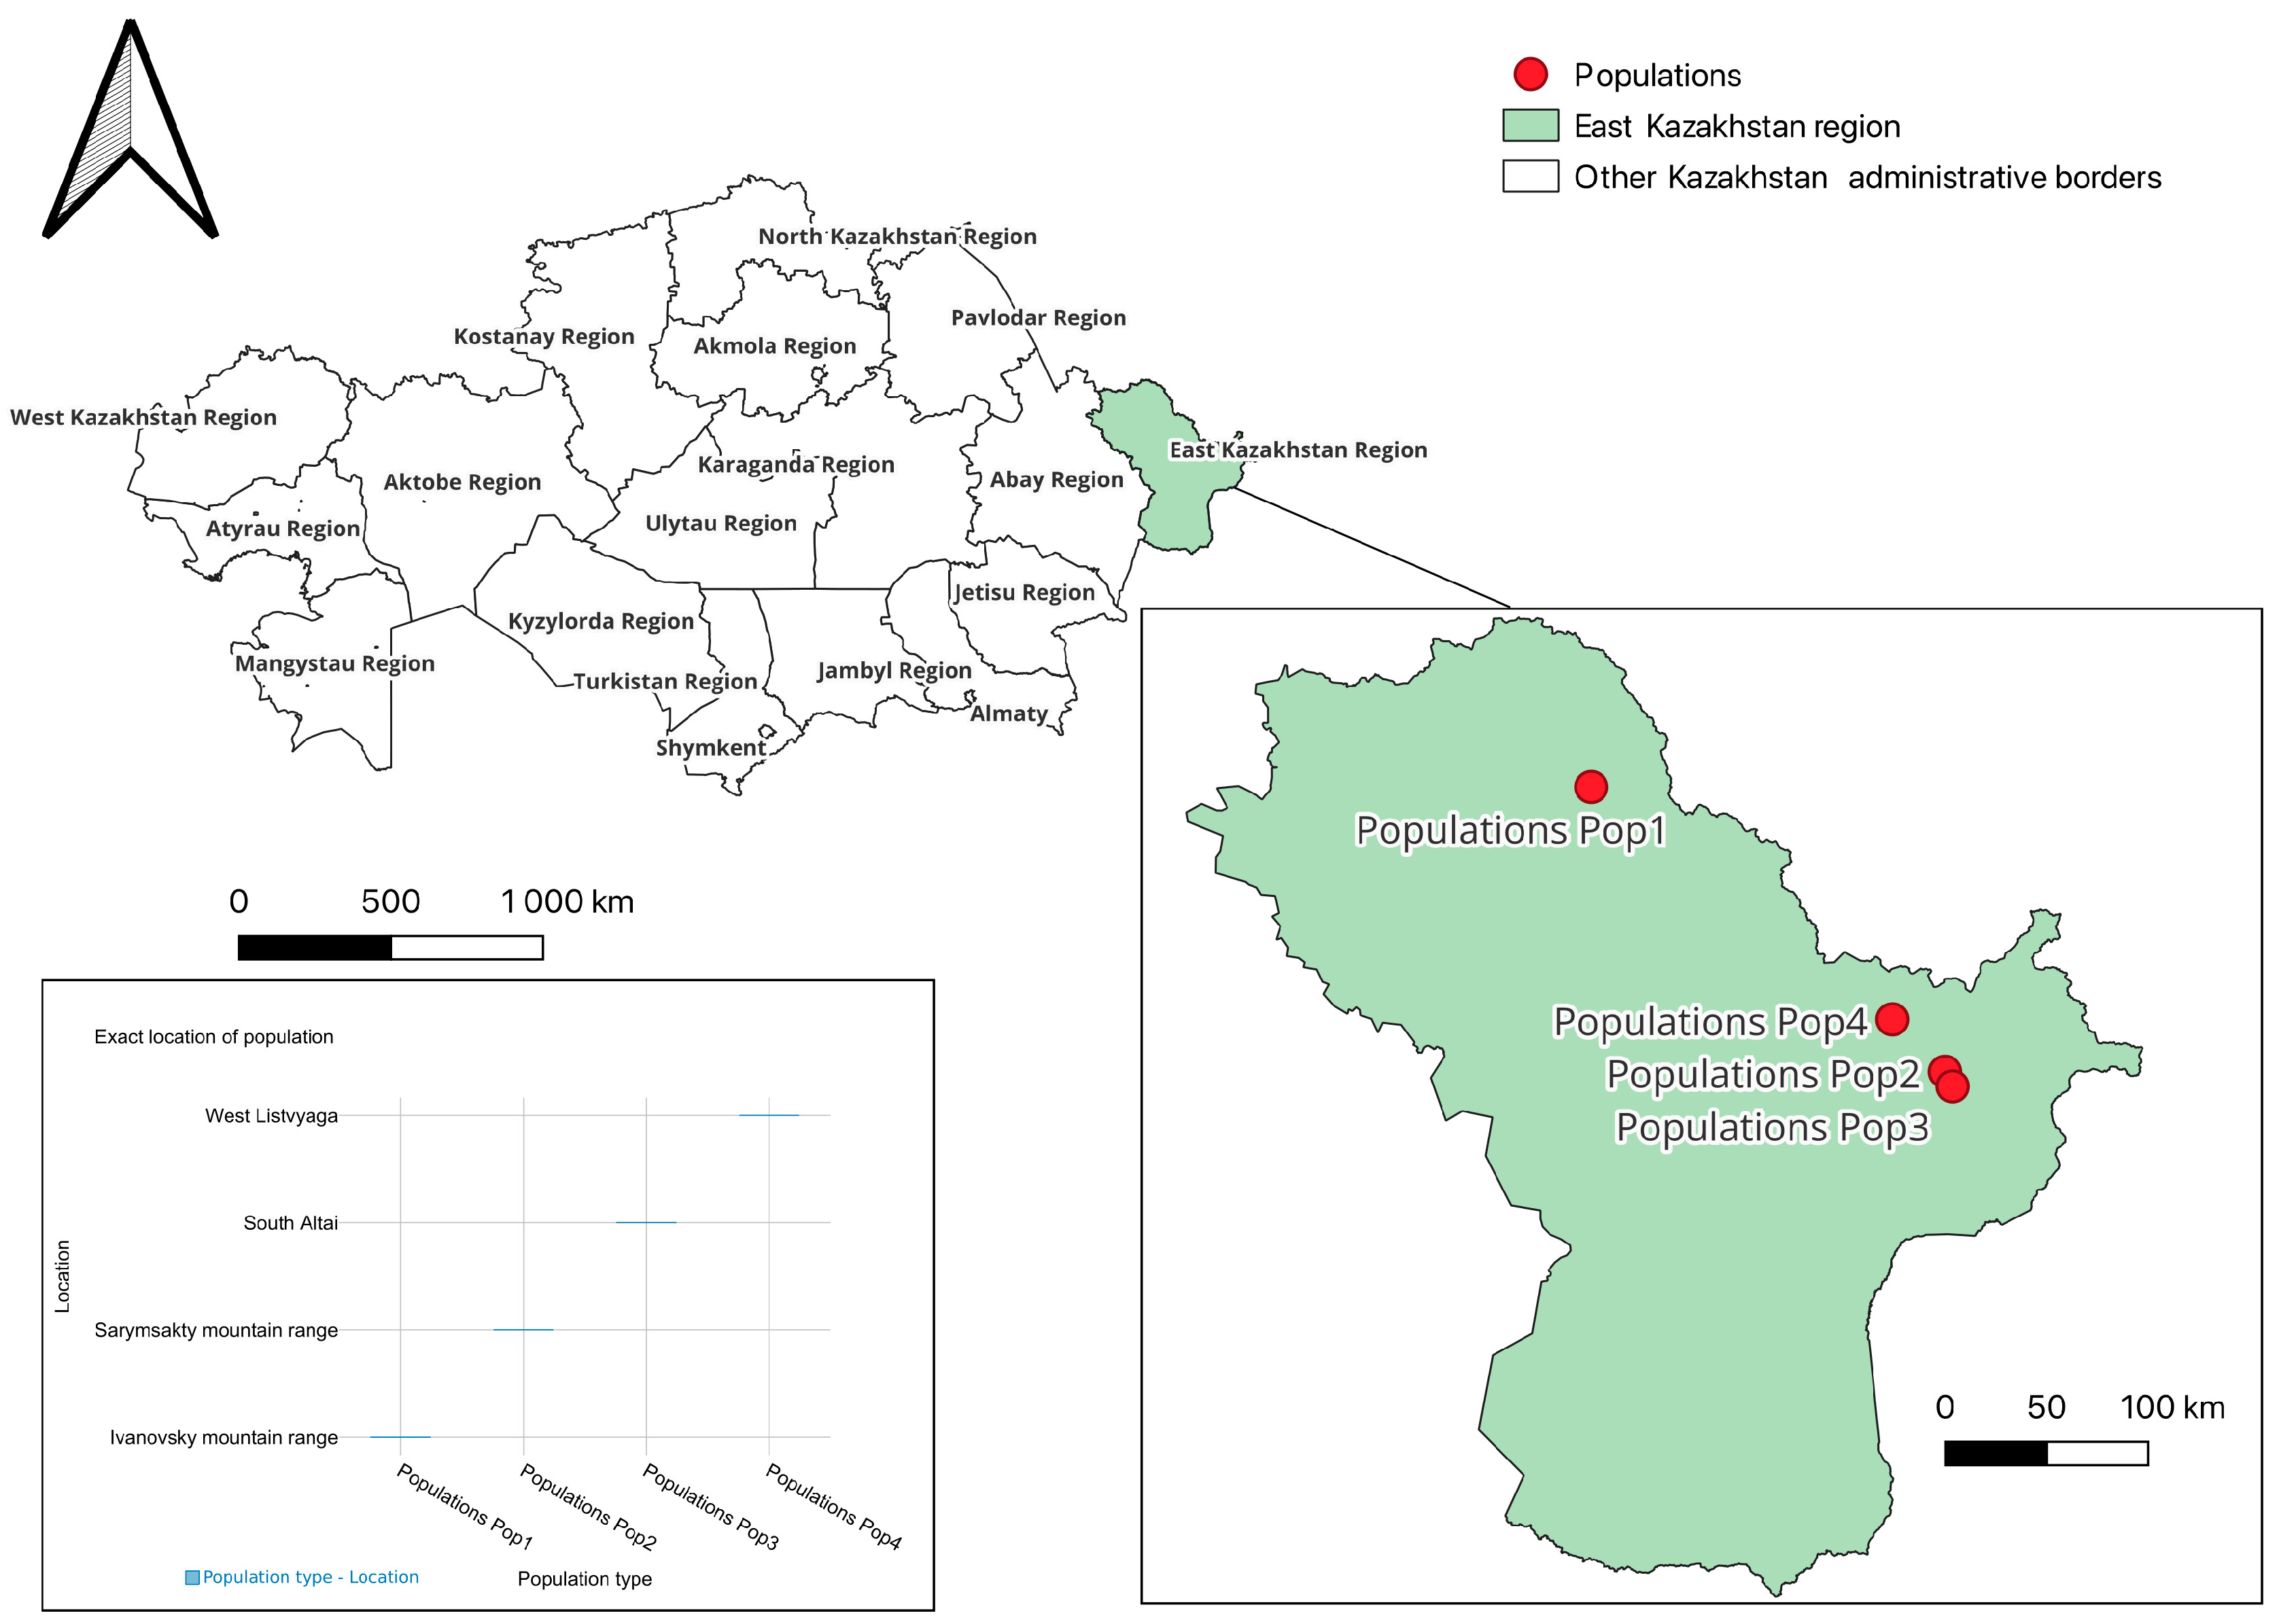
2.1. Plant Material
- (1)
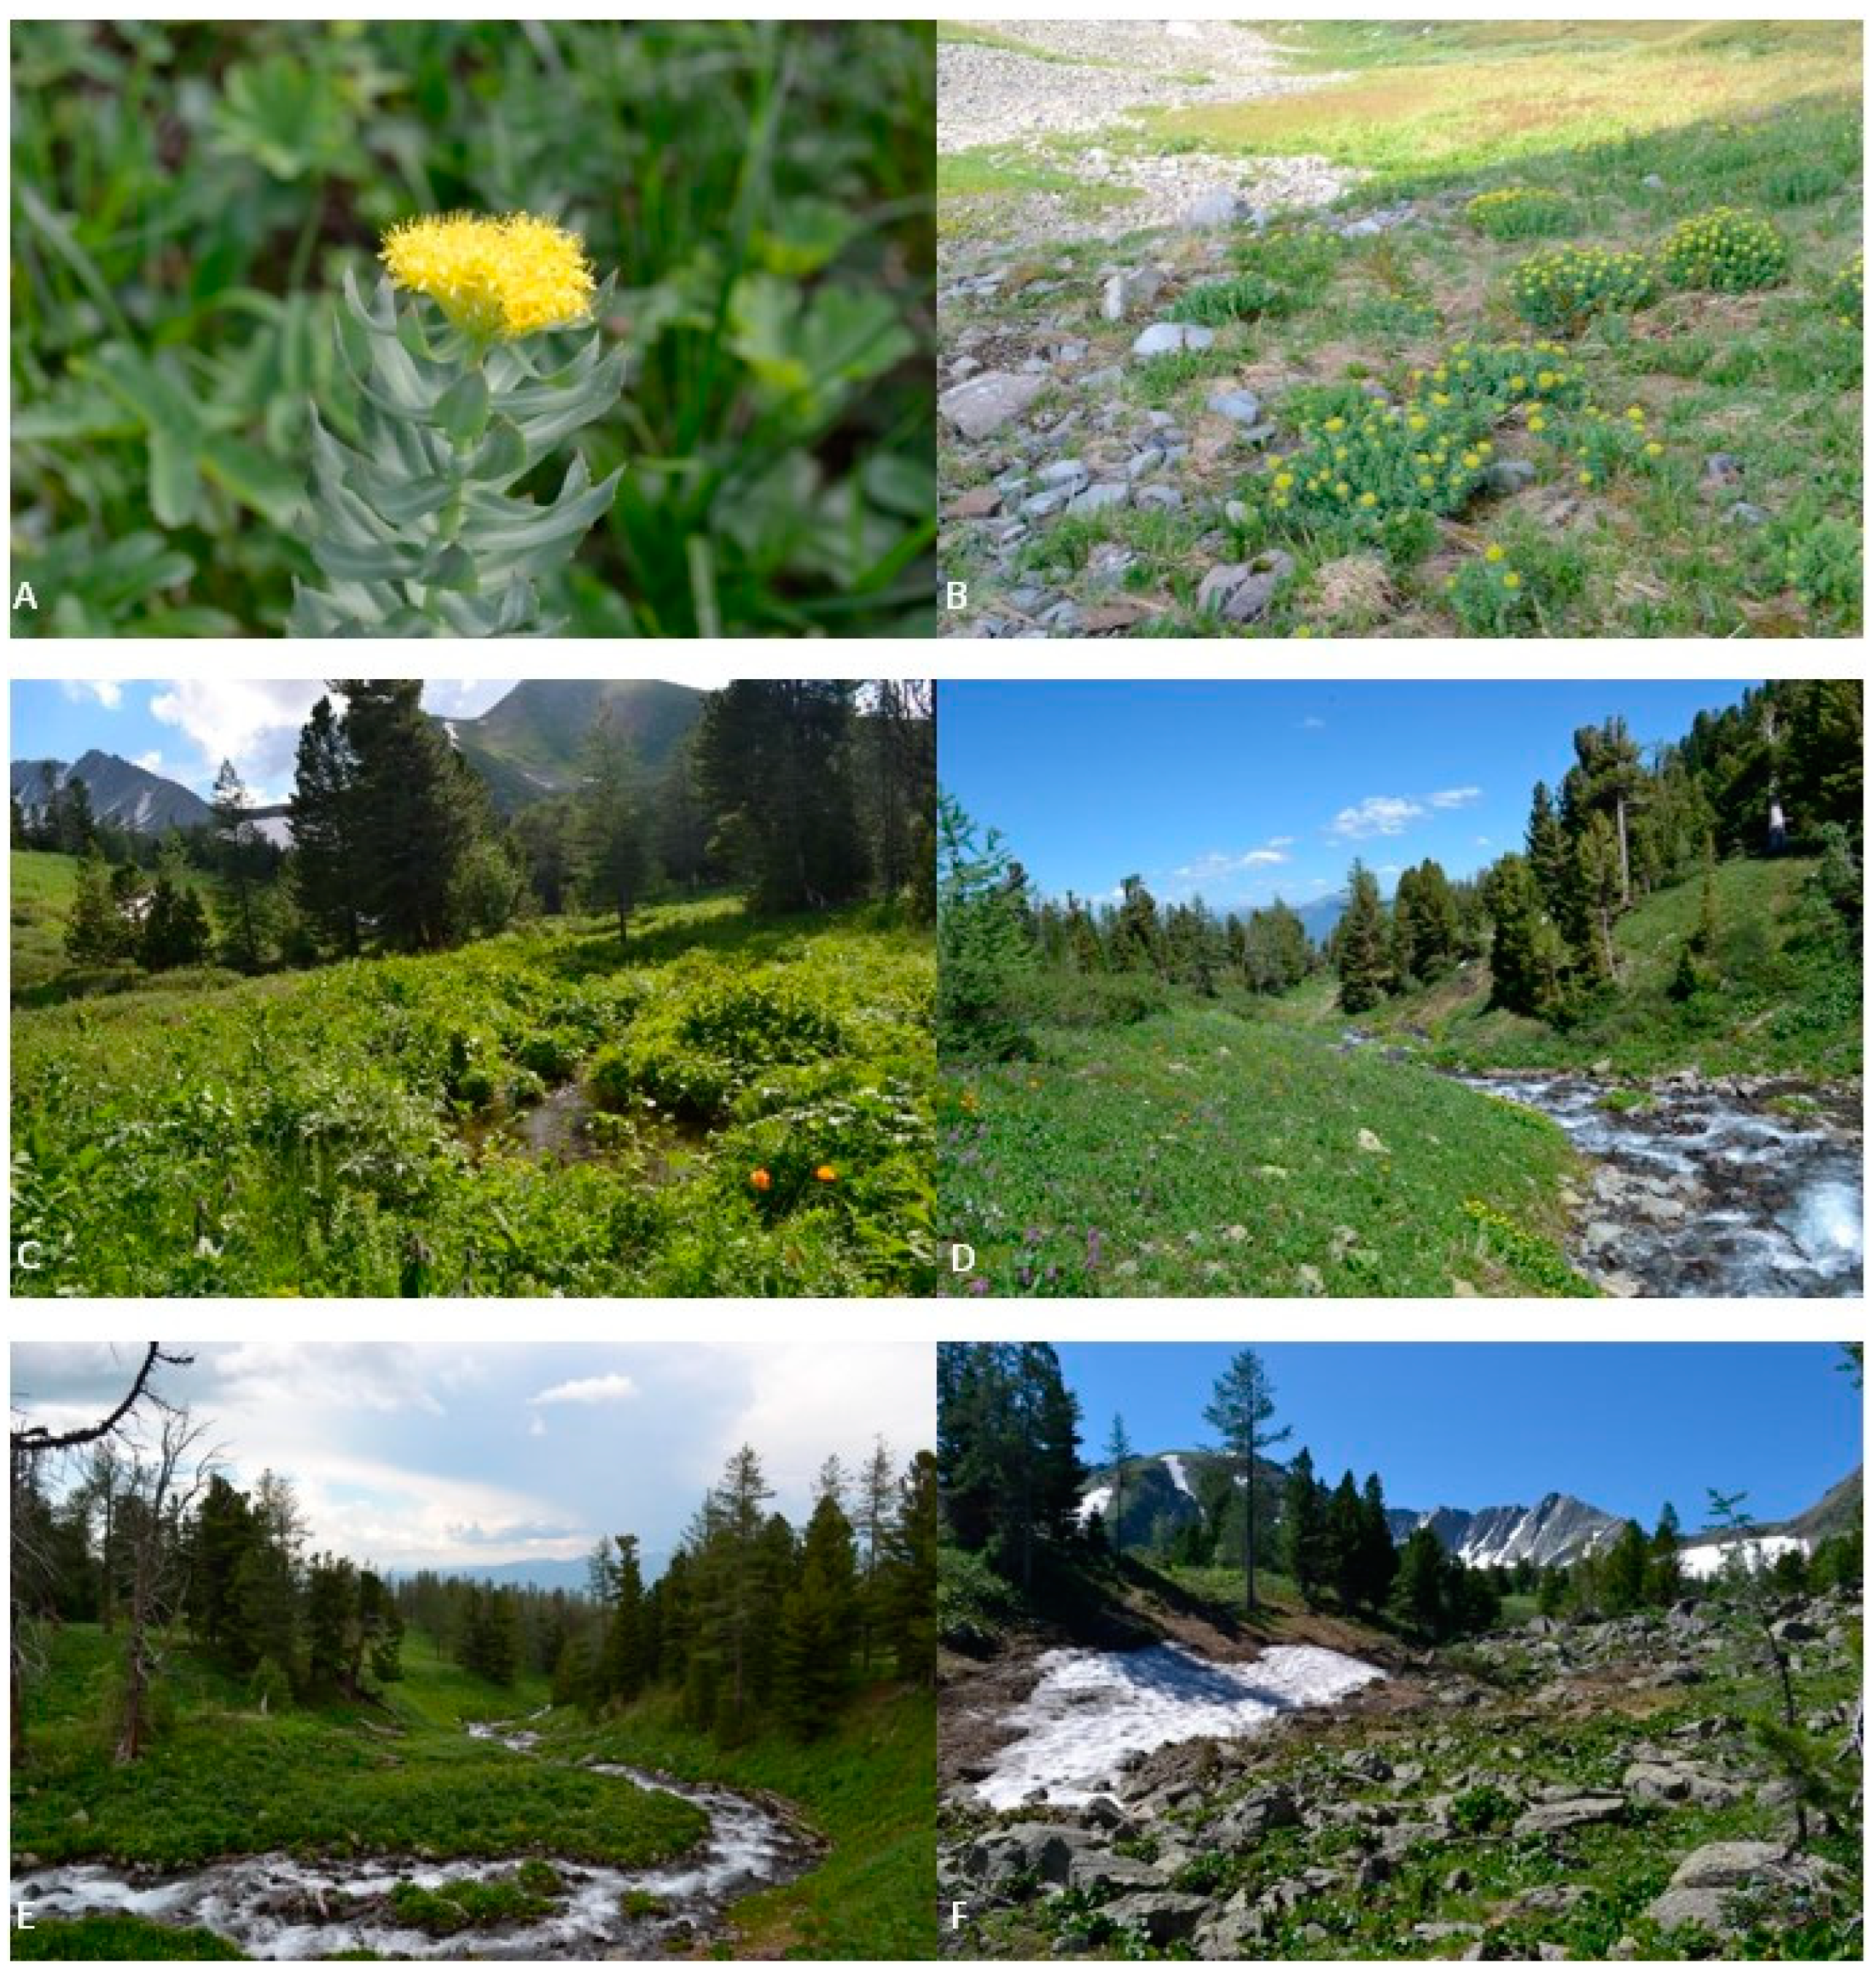
- Population 1 (Pop 1)—Ivanovsky mountain range (50°19′13.5″ N, 83°45′11.0″ E);
- (2)
- Population 2 (Pop 2)—Sarymsakty mountain range (49°07′49.9″ N, 86°02′19.8″ E);
- (3)
- Population 3 (Pop 3)—South Altai (49°04′06.8″ N, 86°05′14.8″ E);
- (4)
- Population 4 (Pop 4)—West Listvyaga (49°21′06.0″ N, 85°41′54.8″ E) (Figure 1).
2.2. Genetic Analysis
3. Results
4. Discussion
5. Conclusions
Author Contributions
Funding
Institutional Review Board Statement
Data Availability Statement
Conflicts of Interest
References
- Carvalho, Y.G.; Vitorino, L.C.; Souza, U.J.d.; Bessa, L.A. Recent trends in research on the genetic diversity of plants: Implications for conservation. Diversity 2019, 11, 62. [Google Scholar] [CrossRef]
- Miryeganeh, M.; Saze, H. Epigenetic inheritance and plant evolution. Popul. Ecol. 2020, 62, 17–27. [Google Scholar] [CrossRef]
- Gómez-Fernández, A.; Alcocer, I.; Matesanz, S. Does higher connectivity lead to higher genetic diversity? Effects of habitat fragmentation on genetic variation and population structure in a gypsophile. Conserv. Genet. 2016, 17, 631–641. [Google Scholar] [CrossRef]
- Ivy, J.A.; Lacy, R.C. A comparison of strategies for selecting breeding pairs to maximize genetic diversity retention in managed populations. J. Hered. 2012, 103, 186–196. [Google Scholar] [CrossRef] [PubMed]
- Barrett, S.C.; Harder, L.D. The ecology of mating and its evolutionary consequences in seed plants. Annu. Rev. Ecol. Evol. Syst. 2017, 48, 135–157. [Google Scholar] [CrossRef]
- Shefferson, R.P.; Salguero Gomez, R. Eco-evolutionary dynamics in plants: Interactive processes at overlapping time-scales and their implications. J. Ecol. 2015, 103, 789–797. [Google Scholar] [CrossRef]
- Schrieber, K.; Paul, S.C.; Hoche, L.V.; Salas, A.C.; Didszun, R.; Mossnang, J.; Muller, C.; Erfmeier, A.; Eilers, E.J. Inbreeding in a dioecious plant has sex- and population origin-specific effects on its interactions with pollinators. Elife 2021, 10, e65610. [Google Scholar] [CrossRef] [PubMed]
- Achrem, M.; Stepien, E.; Kalinka, A. Epigenetic Changes Occurring in Plant Inbreeding. Int. J. Mol. Sci. 2023, 24, 5407. [Google Scholar] [CrossRef]
- Howard, J.T.; Pryce, J.E.; Baes, C.; Maltecca, C. Invited review: Inbreeding in the genomics era: Inbreeding, inbreeding depression, and management of genomic variability. J. Dairy. Sci. 2017, 100, 6009–6024. [Google Scholar] [CrossRef] [PubMed]
- Panchal, S. Fundamentals of Genetics. In Genetics Fundamentals Notes; Springer: Berlin/Heidelberg, Germany, 2022; pp. 3–51. [Google Scholar]
- Arvas, Y.E.; Marakli, S.; Kaya, Y.; Kalendar, R. The power of retrotransposons in high-throughput genotyping and sequencing. Front. Plant Sci. 2023, 14, 1174339. [Google Scholar] [CrossRef] [PubMed]
- Kalendar, R.; Shevtsov, A.; Otarbay, Z.; Ismailova, A. In silico PCR analysis: A comprehensive bioinformatics tool for enhancing nucleic acid amplification assays. Front. Bioinform. 2024, 4, 1464197. [Google Scholar] [CrossRef] [PubMed]
- Kalendar, R.; Karlov, G.I. Editorial: Mobile elements and plant genome evolution, comparative analyses and computational tools, volume II. Front. Plant Sci. 2023, 14, 1308536. [Google Scholar] [CrossRef] [PubMed]
- Kalendar, R.; Kairov, U. Genome-Wide Tool for Sensitive de novo Identification and Visualisation of Interspersed and Tandem Repeats. Bioinform. Biol. Insights 2024, 18, 11779322241306391. [Google Scholar] [CrossRef] [PubMed]
- Kalendar, R.; Muterko, A.; Boronnikova, S. Retrotransposable Elements: DNA Fingerprinting and the Assessment of Genetic Diversity. Methods Mol. Biol. 2021, 2222, 263–286. [Google Scholar] [CrossRef]
- Kalendar, R.; Antonius, K.; Smykal, P.; Schulman, A.H. iPBS: A universal method for DNA fingerprinting and retrotransposon isolation. Theor. Appl. Genet. 2010, 121, 1419–1430. [Google Scholar] [CrossRef] [PubMed]
- Kalendar, R.; Schulman, A.H. Transposon-based tagging: IRAP, REMAP, and iPBS. Methods Mol. Biol. 2014, 1115, 233–255. [Google Scholar] [CrossRef] [PubMed]
- Zhang, D.Q.; Liu, X.Y.; Qiu, L.F.; Liu, Z.R.; Yang, Y.P.; Huang, L.; Wang, S.Y.; Zhang, J.Q. Two chromosome-level genome assemblies of Rhodiola shed new light on genome evolution in rapid radiation and evolution of the biosynthetic pathway of salidroside. Plant J. 2024, 117, 464–482. [Google Scholar] [CrossRef] [PubMed]
- Erst, A.A.; Petruk, A.A.; Erst, A.S.; Krivenko, D.A.; Filinova, N.V.; Maltseva, S.Y.; Kulikovskiy, M.S.; Banaev, E.V. Optimization of Biomass Accumulation and Production of Phenolic Compounds in Callus Cultures of Rhodiola rosea L. Using Design of Experiments. Plants 2022, 11, 124. [Google Scholar] [CrossRef] [PubMed]
- Bhardwaj, P.; Bhardwaj, G.; Raghuvanshi, R.; Thakur, M.S.; Kumar, R.; Chaurasia, O. Rhodiola: An overview of phytochemistry and pharmacological applications. In New Age Herbals: Resource, Quality and Pharmacognosy; Springer: Singapore, 2018. [Google Scholar] [CrossRef]
- Kosakowska, O.; Baczek, K.; Przybyl, J.L.; Pioro-Jabrucka, E.; Czupa, W.; Synowiec, A.; Gniewosz, M.; Costa, R.; Mondello, L.; Weglarz, Z. Antioxidant and Antibacterial Activity of Roseroot (Rhodiola rosea L.) Dry Extracts. Molecules 2018, 23, 1767. [Google Scholar] [CrossRef]
- Seczyk, L.; Sugier, D.; Dervisoglu, G.; Ozdemir, F.A.; Kolodziej, B. Phytochemical profile, in vitro bioaccessibility, and anticancer potential of golden root (Rhodiola rosea L.) extracts. Food Chem. 2023, 404, 134779. [Google Scholar] [CrossRef] [PubMed]
- The Red Book of Kazakhstan; Astana Ltd.: Astana, Kazakhstan, 2014; Volume 2, p. 452. (In Russian)
- Li, X.; Chen, W.; Xu, Y.; Liang, Z.; Hu, H.; Wang, S.; Wang, Y. Quality Evaluation of Randomized Controlled Trials of Rhodiola Species: A Systematic Review. Evid. Based Complement. Altern. Med. 2021, 2021, 9989546. [Google Scholar] [CrossRef] [PubMed]
- D’Amelia, V.; Docimo, T.; Crocoll, C.; Rigano, M.M. Specialized metabolites and valuable molecules in crop and medicinal plants: The evolution of their use and strategies for their production. Genes 2021, 12, 936. [Google Scholar] [CrossRef] [PubMed]
- Lianza, M.; Mandrone, M.; Chiocchio, I.; Tomasi, P.; Marincich, L.; Poli, F. Screening of ninety herbal products of commercial interest as potential ingredients for phytocosmetics. J. Enzym. Inhib. Med. Chem. 2020, 35, 1287–1291. [Google Scholar] [CrossRef] [PubMed]
- György, Z.; Vouillamoz, J.; Ladányi, M.; Pedryc, A. Genetic survey of Rhodiola rosea L. populations from the Swiss Alps based on SSR markers. Biochem. Syst. Ecol. 2014, 54, 137–143. [Google Scholar] [CrossRef]
- Elameen, A.; Klemsdal, S.S.; Dragland, S.; Fjellheim, S.; Rognli, O.A. Genetic diversity in a germplasm collection of roseroot (Rhodiola rosea) in Norway studied by AFLP. Biochem. Syst. Ecol. 2008, 36, 706–715. [Google Scholar] [CrossRef]
- Gyorgy, Z.; Toth, E.G.; Incze, N.; Molnar, B.; Hohn, M. Intercontinental migration pattern and genetic differentiation of arctic-alpine Rhodiola rosea L.: A chloroplast DNA survey. Ecol. Evol. 2018, 8, 11508–11521. [Google Scholar] [CrossRef] [PubMed]
- Terletskaya, N.V.; Turzhanova, A.S.; Khapilina, O.N.; Zhumagul, M.Z.; Meduntseva, N.D.; Kudrina, N.O.; Korbozova, N.K.; Kubentayev, S.A.; Kalendar, R. Genetic Diversity in Natural Populations of Rhodiola Species of Different Adaptation Strategies. Genes 2023, 14, 794. [Google Scholar] [CrossRef] [PubMed]
- Kalendar, R.; Ivanov, K.I.; Akhmetollayev, I.; Kairov, U.; Samuilova, O.; Burster, T.; Zamyatnin, A.A., Jr. An Improved Method and Device for Nucleic Acid Isolation Using a High-Salt Gel Electroelution Trap. Anal. Chem. 2024, 96, 15526–15530. [Google Scholar] [CrossRef] [PubMed]
- Kalendar, R.; Ivanov, K.I.; Samuilova, O.; Kairov, U.; Zamyatnin, A.A., Jr. Isolation of High-Molecular-Weight DNA for Long-Read Sequencing Using a High-Salt Gel Electroelution Trap. Anal. Chem. 2023, 95, 17818–17825. [Google Scholar] [CrossRef] [PubMed]
- Kalendar, R.; Boronnikova, S.; Seppanen, M. Isolation and Purification of DNA from Complicated Biological Samples. Methods Mol. Biol. 2021, 2222, 57–67. [Google Scholar] [CrossRef] [PubMed]
- Peakall, R.; Smouse, P.E. GENALEX 6: Genetic analysis in Excel. Population genetic software for teaching and research. Mol. Ecol. Notes 2006, 6, 288–295. [Google Scholar] [CrossRef]
- Ishaque, S.; Shamseer, L.; Bukutu, C.; Vohra, S. Rhodiola rosea for physical and mental fatigue: A systematic review. BMC Complement. Altern. Med. 2012, 12, 70. [Google Scholar] [CrossRef] [PubMed]
- Koc, J.; Androsiuk, P.; Chwedorzewska, K.J.; Cuba-Díaz, M.; Górecki, R.; Giełwanowska, I. Range-wide pattern of genetic variation in Colobanthus quitensis. Polar Biol. 2018, 41, 2467–2479. [Google Scholar] [CrossRef]
- Kubentayev, S.A.; Zhumagul, M.Z.; Kurmanbayeva, M.S.; Alibekov, D.T.; Kotukhov, J.A.; Sitpayeva, G.T.; Mukhtubayeva, S.K.; Izbastina, K.S. Current state of populations of Rhodiola rosea L. (Crassulaceae) in East Kazakhstan. Bot. Stud. 2021, 62, 19. [Google Scholar] [CrossRef]
- Milovanov, A.; Zvyagin, A.; Daniyarov, A.; Kalendar, R.; Troshin, L. Genetic analysis of the grapevine genotypes of the Russian Vitis ampelographic collection using iPBS markers. Genetica 2019, 147, 91–101. [Google Scholar] [CrossRef] [PubMed]
- Lei, Y.; Gao, H.; Tsering, T.; Shi, S.; Zhong, Y. Determination of genetic variation in Rhodiola crenulata from the Hengduan Mountains Region, China using inter-simple sequence repeats. Genet. Mol. Biol. 2006, 29, 339–344. [Google Scholar] [CrossRef]
- Kylin, M. Genetic diversity of roseroot (Rhodiola rosea L.) from Sweden, Greenland and Faroe Islands. 2010. Available online: https://stud.epsilon.slu.se/2049/ (accessed on 3 January 2025).
- Altukhov, Y.P. Intraspecific Genetic Diversity; Springer: Berlin/Heidelberg, Germany, 2006. [Google Scholar]
- Yan, T.-F. Genetic structure of endangered Rhodiola sachalinensis. Conserv. Genet. 2003, 4, 213–218. [Google Scholar] [CrossRef]
- Khapilina, O.; Turzhanova, A.; Danilova, A.; Tumenbayeva, A.; Shevtsov, V.; Kotukhov, Y.; Kalendar, R. Primer Binding Site (PBS) Profiling of Genetic Diversity of Natural Populations of Endemic Species Allium ledebourianum Schult. BioTech 2021, 10, 23. [Google Scholar] [CrossRef]
- Khapilina, O.; Raiser, O.; Danilova, A.; Shevtsov, V.; Turzhanova, A.; Kalendar, R. DNA profiling and assessment of genetic diversity of relict species Allium altaicum Pall. on the territory of Altai. PeerJ 2021, 9, e10674. [Google Scholar] [CrossRef] [PubMed]


| ID | Sequence | GC (%) * | Tm (°C) * | LC (%) * |
|---|---|---|---|---|
| 2221 | acctagctcacgatgcca | 55.6 | 58.0 | 89 |
| 2224 | atcctggcaatggaacca | 50.0 | 56.6 | 83 |
| 2228 | cattggctcttgatacca | 44.4 | 51.9 | 86 |
| 2230 | tctaggcgtctgatacca | 50.0 | 54.0 | 92 |
| 2232 | agagaggctcggatacca | 55.6 | 56.6 | 83 |
| 2237 | cccctacctggcgtgcca | 72.2 | 65.0 | 78 |
| 2238 | acctagctcatgatgcca | 50.0 | 55.5 | 83 |
| 2240 | aacctggctcagatgcca | 55.6 | 58.9 | 89 |
| 2241 | acctagctcatcatgcca | 50.0 | 55.5 | 78 |
| 2373 | gaacttgctccgatgcca | 55.6 | 57.9 | 86 |
| Population | Habitat Coordinates | Altitude | Projective Cover | Population Characteristics |
|---|---|---|---|---|
| Pop 1 | 50°18′36.9″ N, 83°44′44.7″ E Ivanovsky Ridge, near Lake Maloye | 2000–2100 m | 15–25%. | The thickets of R. rosea occupy a narrow coastal strip no wider than 1.5–2 m, right at the water’s edge. The vegetation cover is represented by individual plants or small groups of communities, where species such as Carex aterrima, Deschampsia cespitosa, Festuca borissii, Trisetum altaicum, Phleum alpinum, Swertia obtusa, Primula nivalis, Rhodiola algida, Sanguisorba alpina, Caltha palustris, Bistorta vivipara, Allium schoenoprasum, and Gentiana algida are often found. Salix lanata and Salix rectijulis are relatively rare. In the herbaceous layer, R. rosea occurs relatively abundantly, with habitat conditions for the species considered close to optimal. The population is of a normal type and fully structured. |
| Pop 2 | 49°07′49.9″ N, 86°02′19.8″ ESarymsakty Ridge, Burkhat Pass (Southern Altai) | 1950–2050 m. | 55%. | The standing herbaceous cover forms diffusely along rock crevices, between block fragments, and in depressions where a fertile soil layer accumulates. The community includes species such as Coptidium lapponicum, Aquilegia glandulosa, Sanguisorba alpina, Rumex acetosa, Bistorta elliptica, Trollius altaicus, Geranium albiflorum, and others. The R. rosea population comprises all age stages, with a predominance of mature generative individuals. The shrubs resemble small tussocks. The plants are stunted and suppressed, with poorly developed roots and an almost complete absence of adventitious roots. The condition of this R. rosea population is characterized as stable and capable of self-renewal. |
| Pop 3 | 49°04′06.8″ N, 86°05′14.8″ ESouth Altai Tarbagatai, Karakaba Depression, Kara-Kaba River Valley | 2000–2300 m. | 85%. | The vegetation cover is poorly developed and relatively species-poor. The most common herbaceous plants include Carex capillaris, C. orbicularis, C. rupestris, Schulzia crinita, Micranthes punctata, Papaver croceum, Salix rectijulis, Dryas oxydontha, Silene graminifolia, Koenigia alpina, Minuartia verna, and Patrinia sibirica, which are relatively common among the shrubs. In this population, R. rosea is predominantly represented by aging generative individuals and very old plants, with the generative individuals failing to produce fruit. An analysis of the development status of R. rosea at the upper boundary of its distribution suggests that these habitats can be considered extreme. |
| Pop 4 | 49°21′06.0″ N, 85°41′54.8″ EWestern Listvyaga range, upper reaches of the Repnaya River | 1700–1900 m | 65–80%. | Alchemilla altaica, Primula nivalis, Carex curaica, and C. aterrima are common in the community, while Carex orbicularis, Cerastium davuricum, Bistorta vivipara, Trollius altaicus, Deschampsia cespitosa, Allium schoenoprasum, Myosotis scorpioides, Delphinium elatum, and Caltha palustris are rarely encountered. R. rosea is associated with narrow strips 1.5–2 m wide along the shorelines. There are no shrubs here. In rare cases, Lonicera altaica is observed along the coastal line. R. rosea forms small clusters in areas devoid of grass. In this population type, generative individuals of R. rosea dominate. |
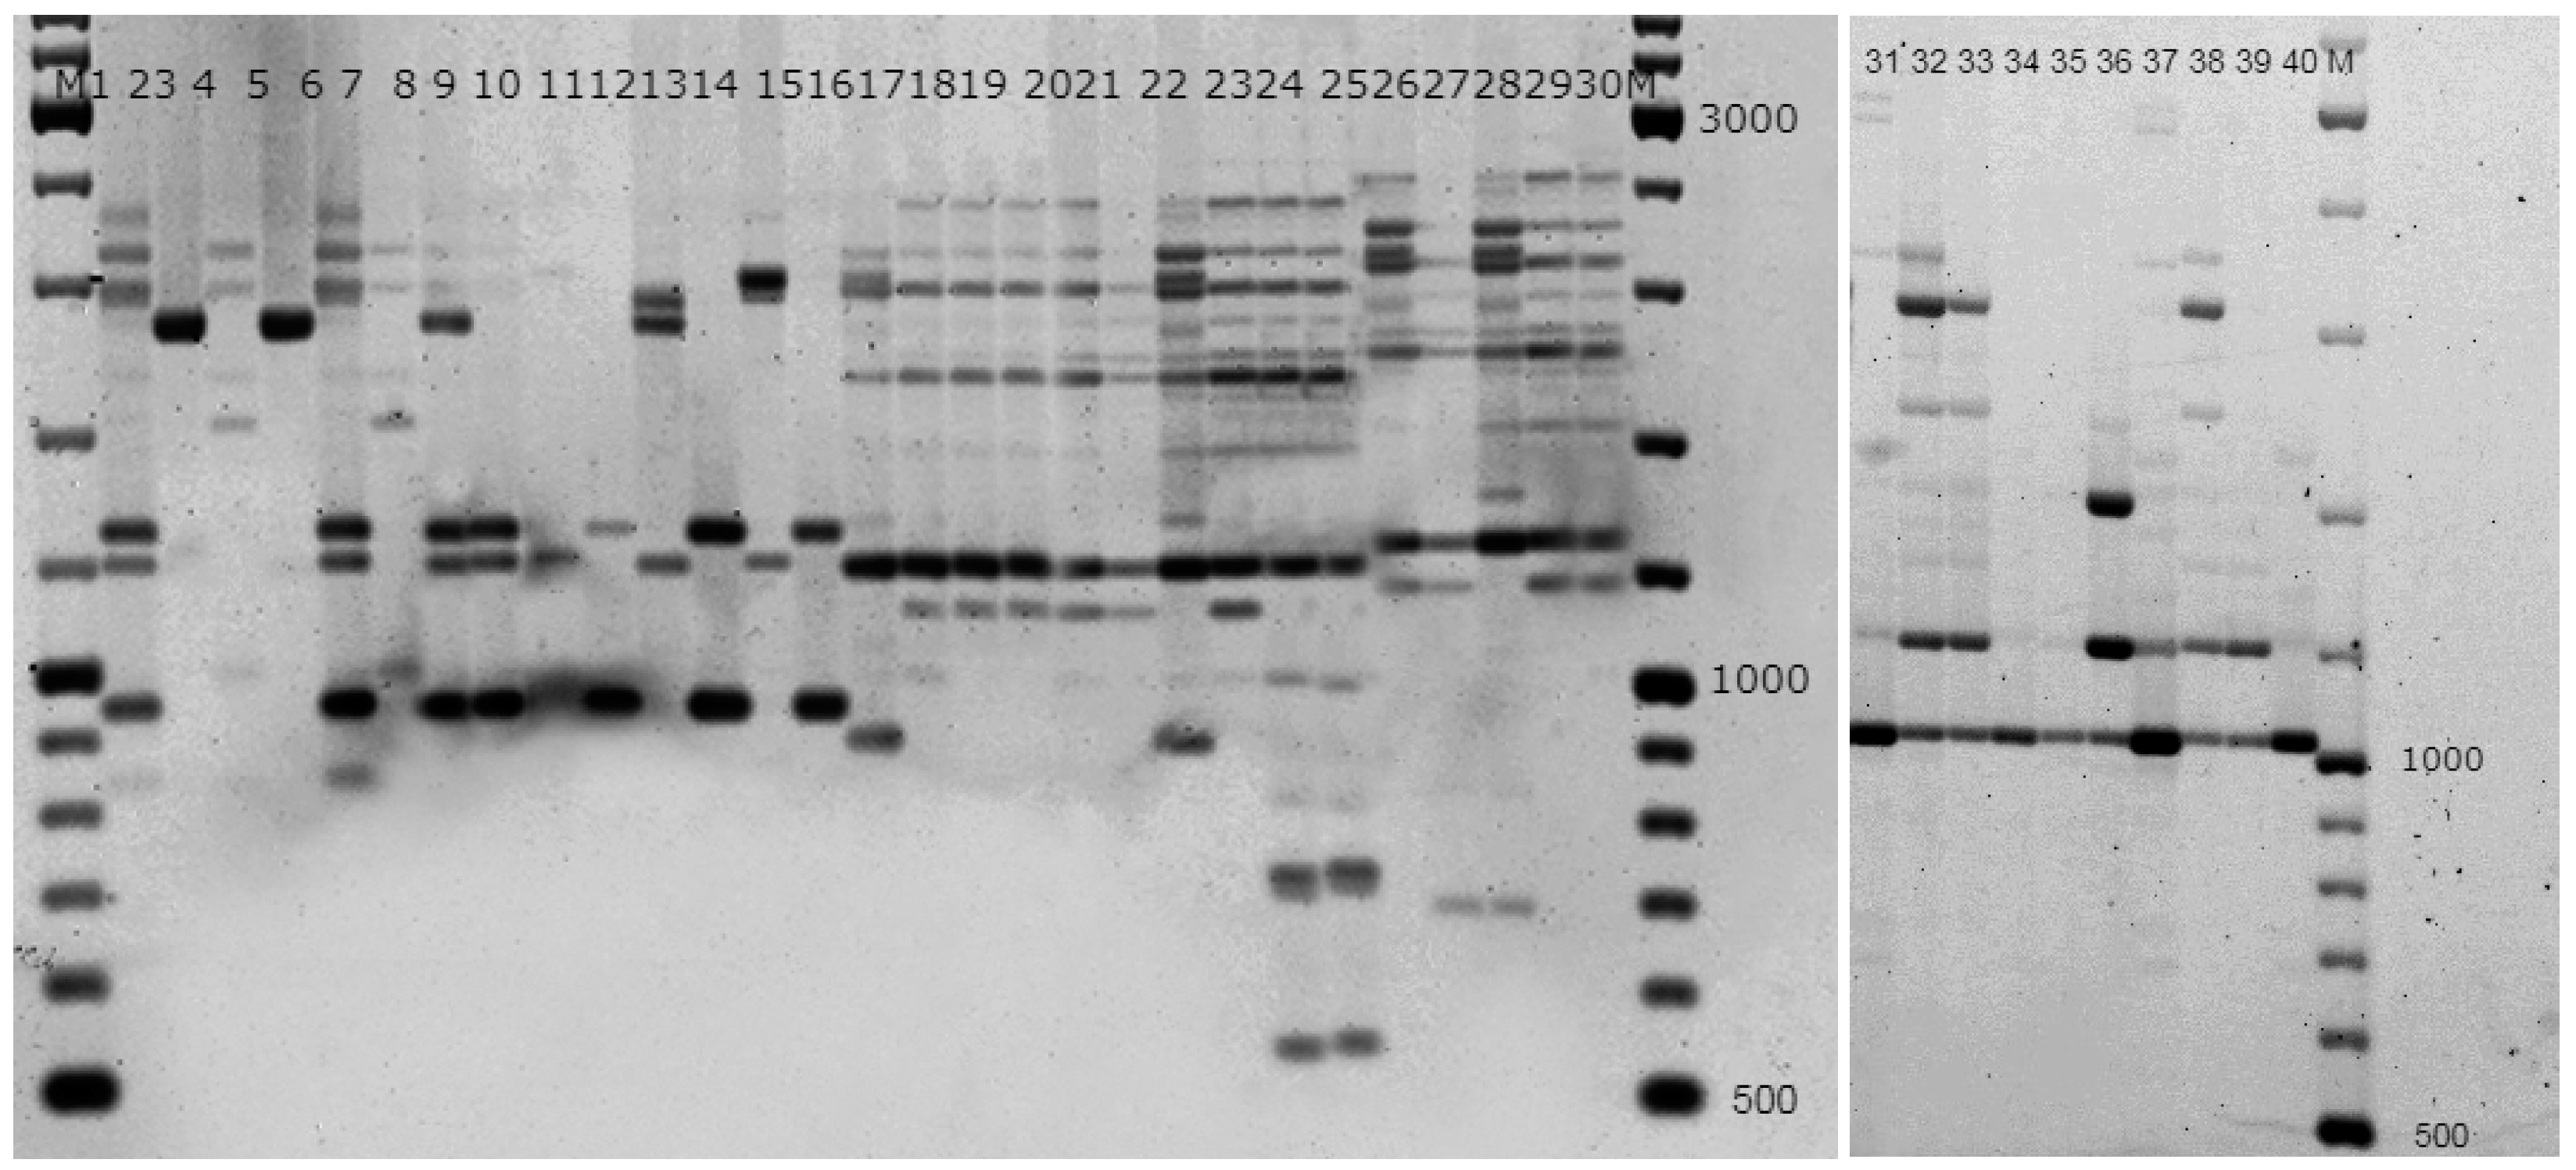
| ID | TL * | PL * | PPL (%) * | PIC * | Amplicon Lengths (bp) |
|---|---|---|---|---|---|
| 2228 | 140 | 46 | 32.8 | 0.472 | 550–3250 |
| 2230 | 384 | 127 | 33.1 | 0.405 | 400–2000 |
| 2232 | 143 | 81 | 56.6 | 0.455 | 550–4000 |
| 2240 | 136 | 54 | 39.7 | 0.408 | 400–3500 |
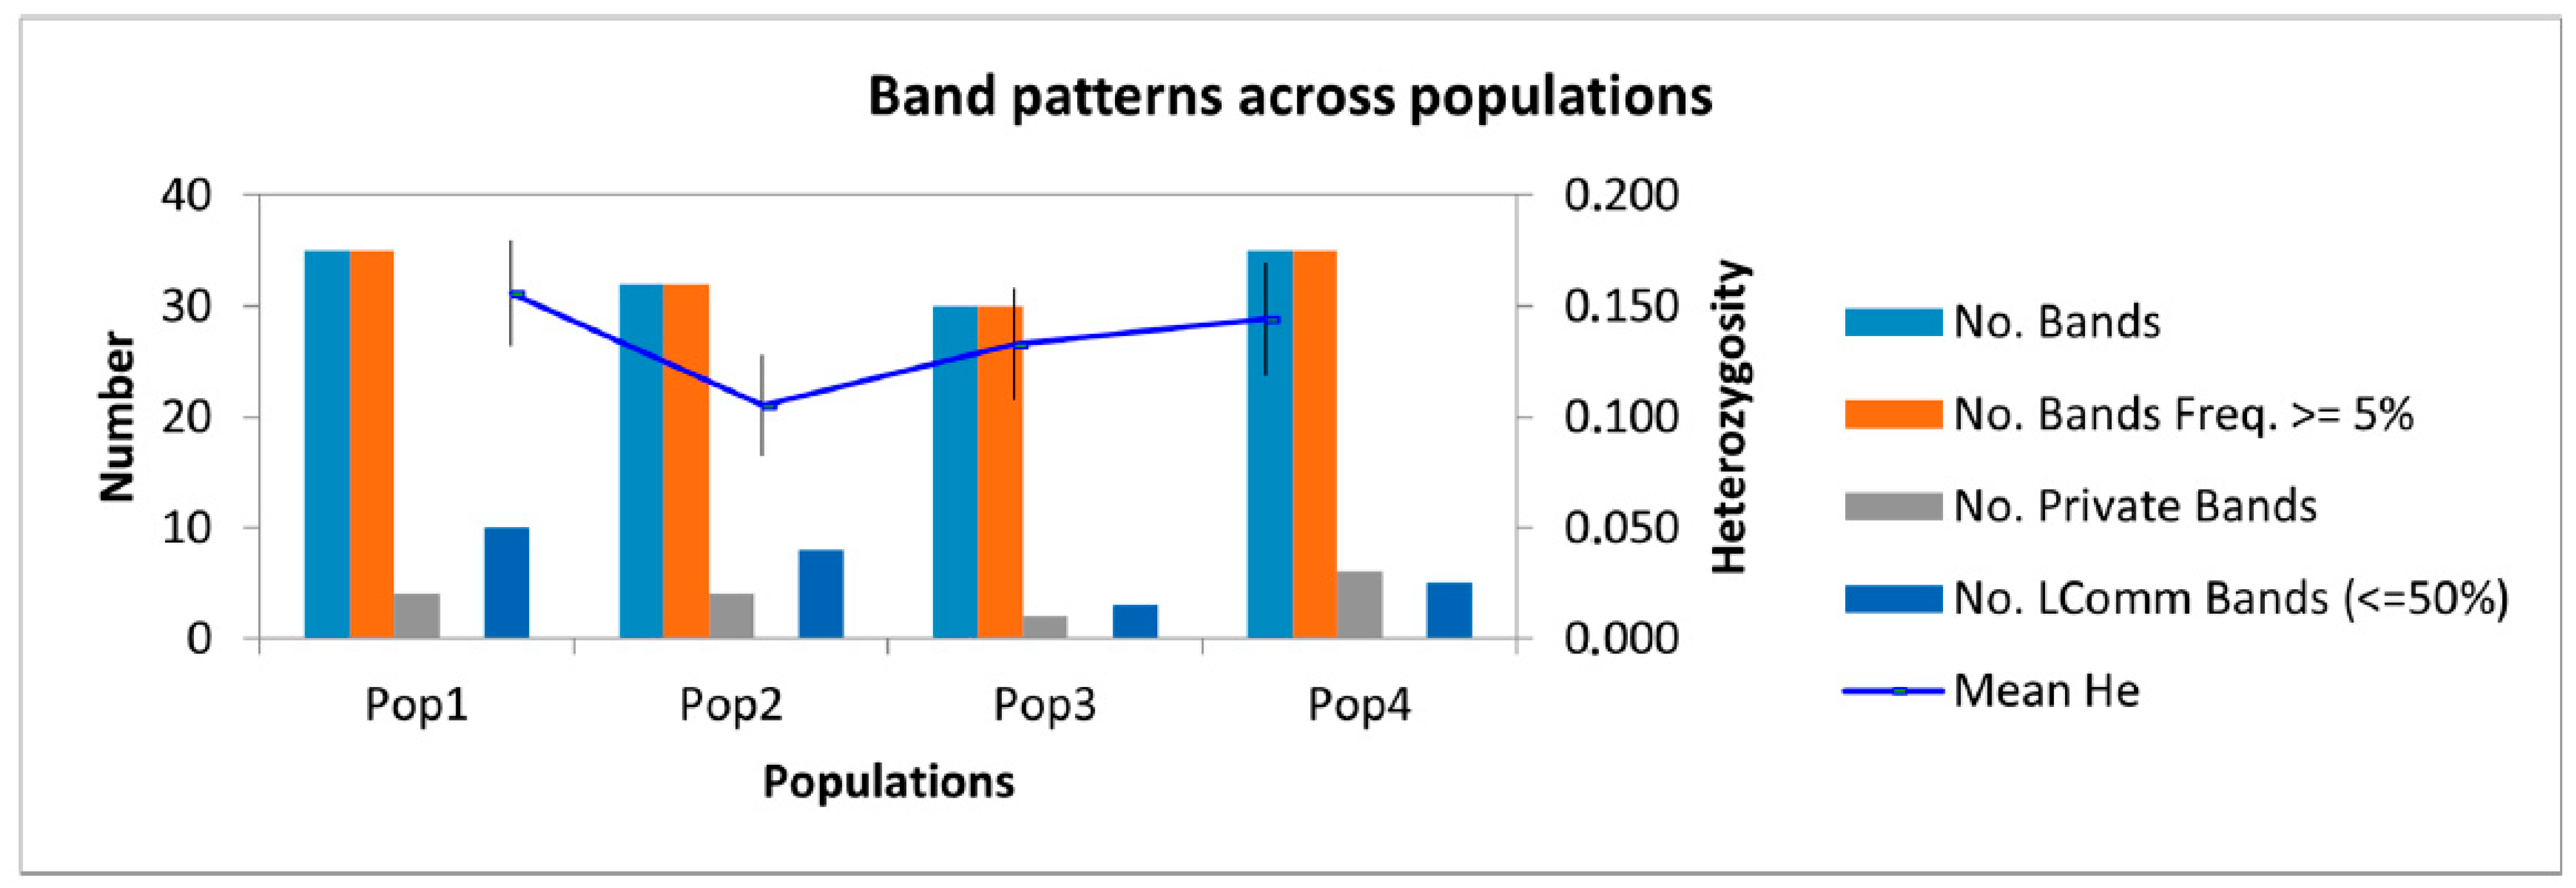
| Population | Na * | Ne * | I * | He * | uHe * | PPL (%) * | R * |
|---|---|---|---|---|---|---|---|
| Ivanovsky mountain range (Population 1) | 1.145 | 1.247 | 0.242 | 0.156 | 0.164 | 50.91 | 4 |
| Sarymsakty mountain range (Population 2) | 0.945 | 1.175 | 0.162 | 0.105 | 0.111 | 36.36 | 4 |
| South Altai (Population 3) | 0.945 | 1.227 | 0.200 | 0.133 | 0.140 | 40 | 2 |
| West Listvyaga (Population 4) | 1.055 | 1.242 | 0.217 | 0.144 | 0.152 | 41.82 | 6 |
| Average | 1.023 | 1.233 | 0.025 | 0.134 | 0.141 | 42.27 | 4 |
| Variability | Df * | SS * | MS * | Est. Var. * | % | PhiPT * | p (r and ≥ Data) |
|---|---|---|---|---|---|---|---|
| Between populations | 3 | 131.875 | 43.958 | 3.908 | 44% | 0.445 | 0.001 |
| Within populations | 36 | 175.700 | 4.881 | 4.881 | 56% | ||
| Overall | 39 | 307.575 | 8.788 | 100% |
| Pop 1 | Pop 2 | Pop 3 | Pop 4 | |
|---|---|---|---|---|
| 12,267 | 17,060 | 14,740 | 19,840 | Pop 1 |
| 17,060 | 7244 | 16,200 | 21,660 | Pop 2 |
| 14,740 | 16,200 | 9356 | 15,960 | Pop 3 |
| 19,840 | 21,660 | 15,960 | 10,178 | Pop 4 |
Disclaimer/Publisher’s Note: The statements, opinions and data contained in all publications are solely those of the individual author(s) and contributor(s) and not of MDPI and/or the editor(s). MDPI and/or the editor(s) disclaim responsibility for any injury to people or property resulting from any ideas, methods, instructions or products referred to in the content. |
© 2025 by the authors. Licensee MDPI, Basel, Switzerland. This article is an open access article distributed under the terms and conditions of the Creative Commons Attribution (CC BY) license (https://creativecommons.org/licenses/by/4.0/).
Share and Cite
Khapilina, O.; Turzhanova, A.; Zhumagul, M.; Tagimanova, D.; Raiser, O.; Kubentayev, S.; Shevtsov, V.; Hohn, M. Retrotransposon-Based Genetic Diversity of Rhodiola rosea L. (Crassulaceae) from Kazakhstan Altai. Diversity 2025, 17, 45. https://doi.org/10.3390/d17010045
Khapilina O, Turzhanova A, Zhumagul M, Tagimanova D, Raiser O, Kubentayev S, Shevtsov V, Hohn M. Retrotransposon-Based Genetic Diversity of Rhodiola rosea L. (Crassulaceae) from Kazakhstan Altai. Diversity. 2025; 17(1):45. https://doi.org/10.3390/d17010045
Chicago/Turabian StyleKhapilina, Oxana, Ainur Turzhanova, Moldir Zhumagul, Damelya Tagimanova, Olesya Raiser, Serik Kubentayev, Vladislav Shevtsov, and Maria Hohn. 2025. "Retrotransposon-Based Genetic Diversity of Rhodiola rosea L. (Crassulaceae) from Kazakhstan Altai" Diversity 17, no. 1: 45. https://doi.org/10.3390/d17010045
APA StyleKhapilina, O., Turzhanova, A., Zhumagul, M., Tagimanova, D., Raiser, O., Kubentayev, S., Shevtsov, V., & Hohn, M. (2025). Retrotransposon-Based Genetic Diversity of Rhodiola rosea L. (Crassulaceae) from Kazakhstan Altai. Diversity, 17(1), 45. https://doi.org/10.3390/d17010045