Article

Current and Future Distribution of the Cataglyphis nodus (Brullé, 1833) in the Middle East and North Africa

by
Remya Kottarathu Kalarikkal
1,
Hotaek Park
2,3,
Christos Georgiadis
4,
Benoit Guénard
5,
Evan P. Economo
6 and
Youngwook Kim
1,*
1
Department of Biology, College of Science, United Arab Emirates University, Al Ain 15551, United Arab Emirates
2
Institute of Arctic Climate and Environment Research, Research Institute for Global Change, Japan Agency for Marine–Earth Science and Technology, Yokosuka 236-0001, Japan
3
Institute for Space-Earth Environmental Research, Nagoya University, Nagoya 464-8601, Japan
4
Section of Zoology—Marine Biology, Department of Biology, Faculty of Science, National and Kapodistrian University of Athens, 15772 Athens, Greece
5
School of Biological Sciences, The University of Hong Kong, Hong Kong, China
6
Biodiversity and Biocomplexity Unit, Okinawa Institute of Science and Technology, Graduate University, Onna 904-0495, Japan
*
Author to whom correspondence should be addressed.
Diversity 2024, 16(9), 563; https://doi.org/10.3390/d16090563
Submission received: 25 July 2024 / Revised: 22 August 2024 / Accepted: 30 August 2024 / Published: 9 September 2024

Abstract

:
Climate change is a major threat to the Middle East and North Africa (MENA) region, which can cause significant harm to its plant and animal species. We predicted the habitat distribution of Cataglyphis nodus (Brullé, 1833) in MENA using MaxEnt models under current and future climate conditions. Our analysis indicates that the cooler regions of the MENA are projected to experience temperature increases of 1–2 °C by 2040 and 2–4 °C by the 2070s. Similarly, the warmer regions may anticipate rises of 0.5–2 °C by 2040 and 2–4 °C by the 2070s. MaxEnt model results for the current climate show good agreement with observations (mean area under the curve value of 0.975 and mean true statistical skill value of 0.8), indicating good potential habitat suitability for C. nodus. Significant factors affecting habitat suitability are elevation, mean monthly precipitation of the coldest quarter, temperature seasonality, and precipitation amount of the driest month. The research predicts that under Shared Socioeconomic Pathway (SSP) 1.2.6, the habitat suitability area may increase by 6% in 2040, while SSP 3.7.0 (0.3%) and SSP 5.8.5 (2.6%) predict a decrease. For 2070, SSP 5.8.5 predicts a 2.2% reduction in habitat suitability, while SSP 1.2.6 (0.4%) and SSP 3.7.0 (1.3%) predict slight increases. The results provide insight into the potential impacts of climate change on the species and regional biodiversity changes associated with the projected species distribution.

1. Introduction

From local to global scales, climate has a significant impact on the diversity and potential geographic range of organisms [1,2]. Across spatial and temporal scales, ecological communities and their composition are dynamic and complex [3]. However, the temporal dynamics of the communities are poorly understood, since it takes time to reflect the impacts of climate change on their habitat distribution [4]. Invertebrates are particularly susceptible to the variations in climatic conditions, including temperature, rainfall, relative humidity, and soil moisture [5,6]. Ants have been extensively studied, due to their species diversity including ~16,000 species [7]; global distribution [8]; and significance to terrestrial ecosystems by providing important ecological functions and services, such as predation, scavenging [9], soil turnover, nitrogen cycling, and pollination [10]. Furthermore, they are used as model taxa, due to their relative ease of sampling and predictable population dynamics in response to environmental stress and disturbance [11,12,13,14]. Ants generally influence physicochemical soil properties and have an impact on plants (such as in pollination and seed dispersal), microbes, and other soil life, being significantly involved in both below- and above-ground activities [15,16,17]. With higher latitudes, altitudes, and aridity, however, the number of ant species decreases [18,19,20,21]. Ants live in thermally defined microhabitats, making them potential bioindicators [22,23]. Foraging at high temperatures necessitates several behavioral, morphological, and physiological adaptations in ants, which can be seen at both individual and colony levels [24,25,26].
Different ant species can leverage a range of heat conditions in desert ecosystems to avoid competition with one another [27]. Species dominance determines how thermal niches are divided [28]. Dominant species can ferociously protect food resources and live in vast colonies, while subordinate species are less aggressive and have smaller colonies [29]. The majority of Cataglyphis Forster, 1850 species, fall into the subordinate species type, with colonies typically having less than a few hundred workers [27]. Cataglyphis is one of the common genera of thermophilic ants found throughout dry regions of the Old World [30] and among the most distinctive and noticeable insects in dry areas near the Mediterranean basin, especially in the Middle East and North Africa (MENA) region [31].
The MENA region is particularly vulnerable to the influence of climate change, since it experiences harsh weather, exceptionally high temperatures, limited groundwater and rainfall, and a lack of agricultural and arable land [32]. According to previous studies, the MENA region near the Mediterranean region is identified as one of the hotspots for climate change [33,34]. Specifically for agricultural and hydrological drought time scales, a study of the characteristics of drought in the Mediterranean under future climate change conditions shows a constantly growing tendency for drought occurrences in the summer months in the Mediterranean region [35].
Climate-based species distribution models offer a way to predict how climate influences the likelihood that a species may occur in a specific area [36]. Each species possesses a distinct set of climatic tolerances, and any changes to these characteristics could potentially affect the ecology and habitat preferences of that species, which would then modify its global range [37,38,39]. Species distribution models can estimate a species’ bioclimatic niche or envelope by combining the species occurrence records with climatic information [40]. These relationships are then utilized to produce predictions for the modeled species that can be seen as maps of habitat suitability or likelihood of occurrence [41]. Currently, a variety of species distribution models (SDMs) are accessible, depending on the species’ data (presence only, presence and absence, and abundance) availability [42,43]. Since presence-only records are the most easily accessible type of species data, these modeling techniques have undergone substantial research and have been shown to be effective for simulating species distributions [44,45,46]. The maximum entropy (MaxEnt) machine learning technique is a robust species distribution model that can be applied to derive the climate-based species distributions of both plants and animals [47,48,49,50,51,52,53]. According to Phillips et al. [45] and Elith et al. [46], the main goal of MaxEnt is to find a probability distribution with the highest entropy (most spread out) within the limitations imposed by the information currently available on the presence of species and the associated environmental (bioclimatic) conditions throughout the study area. Due to its capability and ease of use, MaxEnt has become a widely used tool for resource management and conservation planning [48,54,55]. MaxEnt outperforms most existing correlative modeling approaches and is widely employed for predicting the potential distribution of insect pests [56]. The main objectives of this study are to identify the key environmental (bioclimatic) factors that affect the potential range of the Cataglyphis nodus species in the MENA region. Additionally, the study aims to predict the areas that are suitable for the Cataglyphis nodus species under current and future climatic scenarios. Lastly, the study seeks to determine whether climate change has caused a shift in habitat suitability within the study area. The findings of this study are expected to provide valuable insights into the potential impact of climate change on the habitat suitability of the Cataglyphis nodus species. This study is a new attempt to use the MaxEnt model to assess the sensitivity of climate change in the MENA region and its potential impact on the habitat suitability of the Cataglyphis nodus species. The MaxEnt model considers various environmental factors and climate projections, resulting in a comprehensive evaluation of the potential effects on the species.

2. Materials and Methods

2.1. Study Area and Species Occurrence

Ants of the genus Cataglyphis are thermophilic and dwell in arid environments of Central and North Africa, the Mediterranean, the Middle East, and Central Asia, with peaks of diversity observed around the South Mediterranean and Middle East regions. Their native habitats include deserts, steppes, and Mediterranean habitats [30]. This study defined the MENA region, which was expanded to include some portions of central, eastern, and sub-Saharan African countries to encompass the arid regions (Figure 1). Cataglyphis taxonomy has proved historically challenging [57], and while at the species-group level, there is a general consensus of distinguishability based on morphology and genetic analyses, species are frequently described based on their affiliation to particular species groups [58,59,60]. In contrast to the typical response observed in desert-dwelling fauna, Cataglyphis ants exhibit a unique behavior. They do not seek to evade high temperatures; rather, they harness their remarkable heat tolerance to strategically avoid competitors and potential predators. Among the Cataglyphis species, we selected the C. nodus as our target taxon, since this species had a good number of occurrences in the MENA region, and the sample size of the species will influence the habitat suitability model accuracy. Cataglyphis nodus occurrence records were utilized from the Global Ant Biodiversity Informatics (GABI) database [61], as well as downloaded from the Global Biodiversity Information Facility (GBIF) website (https://www.gbif.org accessed on 17 June 2023). Records were pooled, curated, and verified whenever possible, while localities were georeferenced according to gazetteer entries, mainly from the GeoNames geographical database (https://www.geonames.org/ accessed on 17 June 2023). The 250 occurrence records pertaining to the study area were finally used for the model simulation after eliminating duplicate data records.

2.2. Environmental Data and Processing

The MaxEnt model was established using the 27 environmental variables, which were categorized into five groups, including topography (elevation), soil properties (root-zone soil moisture, soil organic carbon, and heterotrophic respiration), vegetation greenness (vegetation index), meteorology (day and night land surface temperatures), and bioclimate (19 bioclimatic variables). Long-term means (2015–2021 for soil properties; 2000–2021 for vegetation index and meteorology; and 1981–2010 for bioclimate group) of all environmental variables were used for the model simulation, except topography (Table S1).
The 1 km elevation data were produced by Shuttle Radar Topography Mission (SRTM) and obtained from WorldClim version 2.1 [62]. The SRTM data were derived from the X-band and C-band interferometric synthetic aperture radar. Soil parameters were extracted from the 9 km global NASA Soil Moisture Active–Passive Mission Level 4 (SMAP L4) products [63] using the Application for Extracting and Exploring Analysis Ready Samples [64]. SMAP L4 soil organic carbon (SOC), root-zone soil moisture (RZSM), and heterotrophic respiration data were used to calculate mean values from 2015 to 2021 using the cell statistics tool in the ArcGIS spatial analyst. Vegetation index and meteorological variables were extracted from the Moderate Resolution Imaging Spectroradiometer (MODIS) with a spatial resolution of 1 km. For the application of the MaxEnt machine learning model, all the environmental data were converted to a raster grid with a 1 km spatial resolution using the resampling method in ArcGIS (version 10.7.1) tool.

2.3. Bioclimatic Data and Processing

Climate is an important factor influencing organisms’ existence and habitats [40,65,66]. Bioclimatic variables used in this study included a group of 19 derived variables established for species distribution modeling and associated ecological applications that indicate annual trends, seasonality, and extreme or limiting environmental circumstances [67]. From the Climatologies at High Resolution for the Earth’s Land Surface Areas (CHELSA v.2.1) database, the 19 bioclimatic variables for the near current climate conditions (1981–2010) were extracted with a spatial resolution of 30 arc seconds (approximately 1 km) [68]. Five different climate models (Table 1) were selected from the CHELSA database for future projections (2040s and 2070s) and three potential Shared Socio-economic Paths (SSPs), including SSP 1.2.6 (Green Development Path), SSP 3.7.0 (Regional Competition Path), and SSP 5.8.5 (High Development Path). The five models utilized in this study included the core Inter-Sectoral Impact Model Intercomparison Project (ISIMIP3b) models. In terms of climate sensitivity, these models are good representations of the entire CMIP6 ensemble [39,69].
To assess the potential impact of climate change on the MENA region, we conducted an analysis of annual mean temperature (AMT) data from the CHELSA database. Specifically, present AMT data were compared against the future AMT data from five climate models. We averaged five model AMTs to determine the future AMT for each SSP on a grid cell-wise basis. Additionally, we calculated the temperature change by finding the difference between the future (2040s and 2070s) and present AMTs. This allowed us to calculate how the average temperature is expected to change over time.

2.4. Variables Selection

All 27 variables (Table S1) were extracted over the MENA area and resampled to a 1 km spatial resolution using the ArcGIS resampling and spatial analysis tool. If two independent variables have a significant correlation, it can create challenges in the process of MaxEnt modeling. This occurs because the model is based on the assumption that the independent variables are not correlated. When they are, it can result in inaccurate or misleading outcomes. Therefore, it is crucial to ensure that the independent variables used in the MaxEnt model are not highly correlated. While simulating possible habitat suitability, removing the multicollinearity among 27 variables is an important step. Unless this is performed, it will interfere with the species–variable relationship [75]. Using the SPSS statistical tool, a Pearson correlation matrix table was used to examine multicollinearity among the 27 variables. The variables with a correlation (r) value ≥ 0.8 were eliminated from the preliminary model execution [76,77,78]. The jackknife test was used to assess the relative strengths of these variables [79]. The variables with zero percentage contribution were eliminated, and the remaining variables (>0 percentage contribution) were used to run the MaxEnt model.

2.5. Model Simulation

Estimating environmental conditions for the target species is the main objective of species distribution and habitat modeling [80]. In this study, the MaxEnt distribution model version 3.4.4 was used. The MaxEnt machine learning technique utilizes a deterministic sequential-update technique that successively chooses and modifies the weights of predictors and is ensured to converge to the maximum entropy probability distribution [45]. The model simulation was performed with respect to present bioclimatic conditions (1981–2010), the near future (2040s), and the future (2070s). We employed 5-fold cross-validation, in which the occurrence data were randomly divided into a number of equal-sized groups called ‘folds’, and the models were built by excluding each fold in turn [81], along with the maximum number of iterations (5000) and an enabled clamping option. To obtain the relationship between environmental conditions and the suitability of the target species’ habitat, we also generated species response curves from the MaxEnt model. MaxEnt develops mathematical models that characterize the correlations between the probability of predicting a species and predictor variables and then converts these models into prospective distribution maps that indicate C. nodus habitat suitability [39]. The averaged potential suitability map for three climate scenarios (SSPs 1.2.6, 3.7.0, and 5.8.5) derived from the five different climate models were analyzed. The habitat or environmental suitability values simulated in the models ranged from 0 (unsuitable) to 1 (highly suitable), and then we classified the habitat suitability values into five categories (not suitable: 0–0.2, least suitable: 0.2–0.4, moderately suitable: 0.4–0.6, highly suitable: 0.6–0.8, very highly suitable: 0.8–1) [39,82,83]. We applied the jackknife approach to evaluate the impact of variables on the potential habitat suitability of C. nodus in the MENA region [84].

2.6. Model Performance

The average area under the curve (AUC) and true skill statistics (TSS) were utilized in this study to assess the model performance [53,85]. The AUC can evaluate the prediction performance quantitatively, ranging from 0 to 1, with values closer to 1 indicating a higher prediction performance. Values less than 0.5 imply a model that performed no better than random. Despite being a widely used measure of model performance, the AUC is frequently criticized for failing to reveal whether models differ in their performances of properly predicting presences and absences [40,80]. In addition to providing a balance between the model’s capacity to forecast presences and absences, TSS (calculated as sensitivity + specificity − 1) also provides a reliable indicator of model calibration [86]. TSS scores range from −1 to 1, with 1 denoting perfect model agreement and values of 0 or less indicating that a model performs no better than chance [87].

3. Result and Discussion

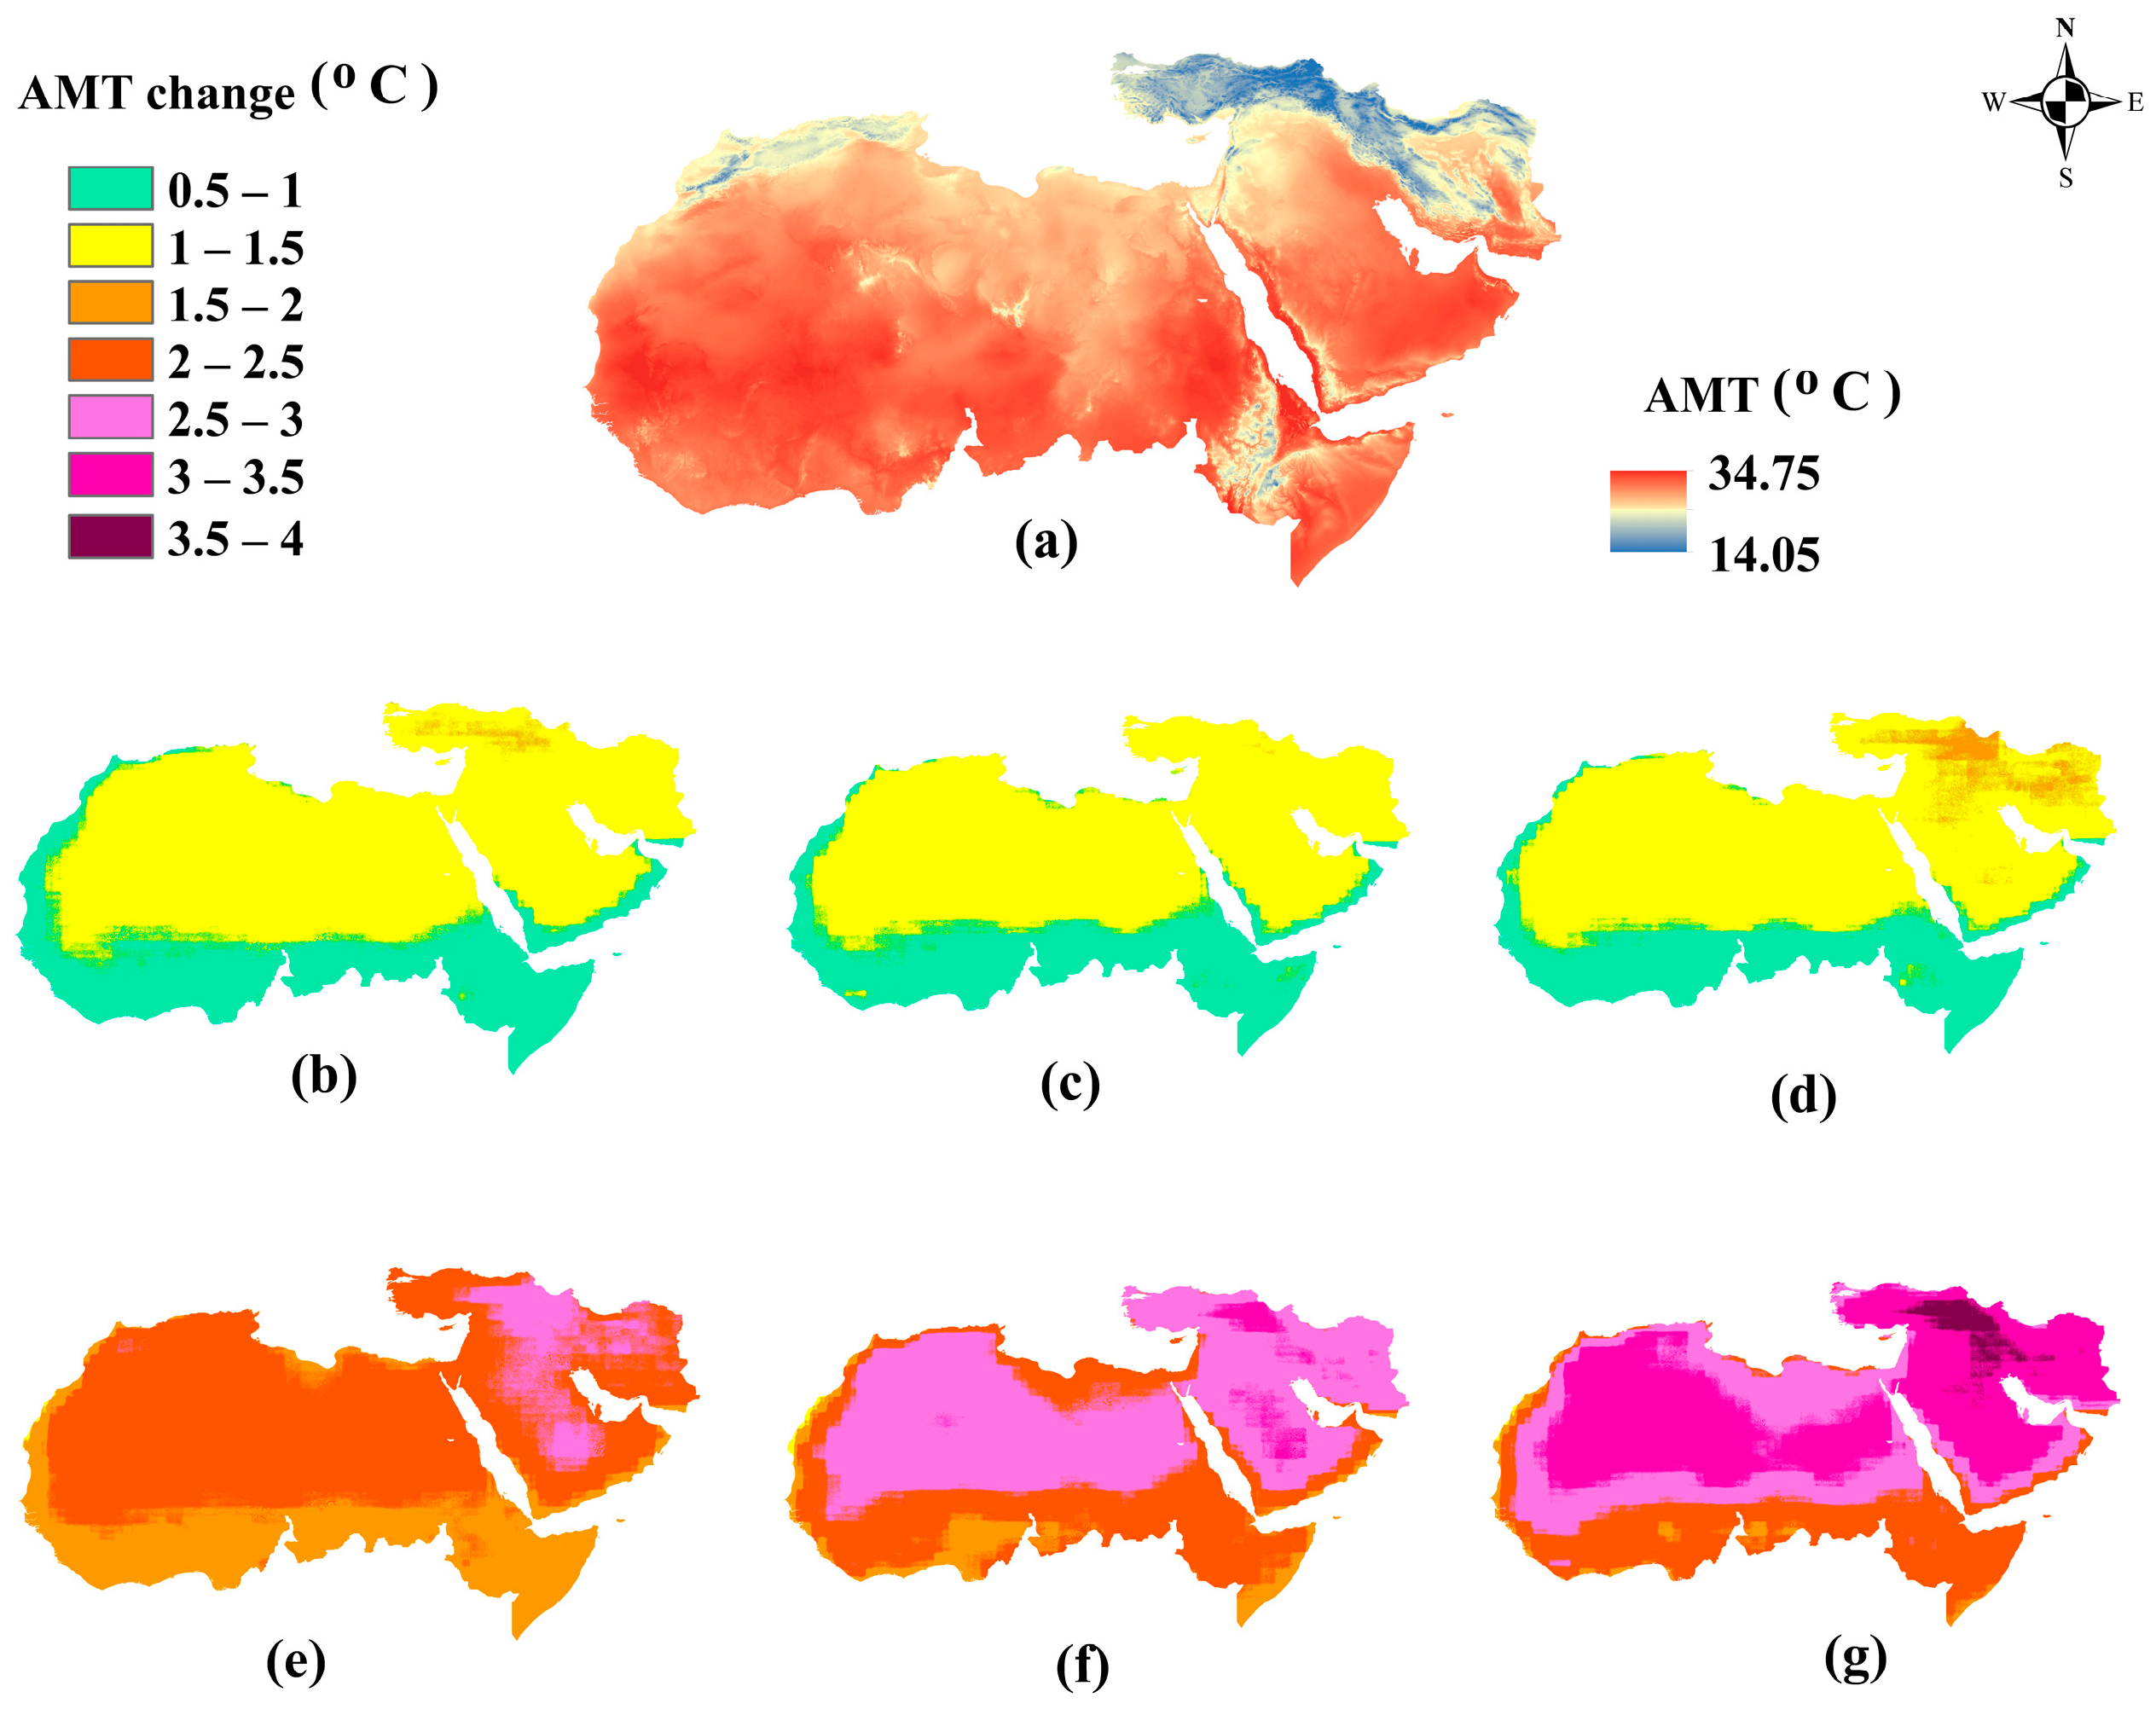
The analysis of the CHELSA data has revealed that the MENA region experiences a wide range of AMT variations. The present AMT varies from 14.1 °C in the cooler areas to 34.8 °C in the warmer regions (Figure 2a). The climate projections derived from three Shared Socioeconomic Pathways (SSPs) suggest that regions with a lower annual mean temperature (AMT) are expected to encounter elevated temperatures, while those with a higher AMT may be subject to the most extreme heat. Projections show that cooler regions of MENA experience a temperature rise of 1 to 2 °C, while warmer regions show an increase of 0.5 to 2 °C by the 2040s (Figure 2b–d). By the 2070s, cooler regions may experience an increase of 2 to 4 °C, while warmer regions may face an increase of 2 to 4 °C in temperature (Figure 2e–g). According to a similar study [88] on the CMIP6 projections over the MENA region, the temperature increases are between 0.8 and 1.4 °C for SSP3.7.0 and 0.9 and 1.6 °C for SSP5.8.5; the northeastern part of the MENA region might experience more changes, while the coastal areas and the margin of water resources might experience the least changes.

3.1. Variables Contribution and Model Performance

After the collinearity elimination, only 13 variables were retained for the model simulation (Table 2). According to the jackknife test results, elevation was the most significant environmental variable affecting C. nodus geographical distribution, followed by the mean monthly precipitation amount of the coldest quarter in the study area (Figure 3a). Elevation contributed 37.8%, followed by the mean monthly precipitation amount of the coldest quarter (26.8%) and temperature seasonality (17.6%) (Table 2). Previous studies revealed that workers of the Cataglyphis species dwell in hot, xeric habitats, due to their unusual capacity to survive in ground temperatures above 70 °C, which lessens their sensitivity to predators and competition from other ants and vertebrates [89]. In addition, the size of the worker, water content, water loss, and protein control play major roles in thermal resistance. As a result, larger Cataglyphis workers are better able to tolerate heat and desiccation stress, compared to smaller workers [90].
The AUC value obtained from the model replications was 0.901 (Figure 3b), indicating that the model performed well. The mean TSS value was 0.8, which fits with the model’s good performance [87,91].

3.2. Present Potential Habitat Suitability (PHS)

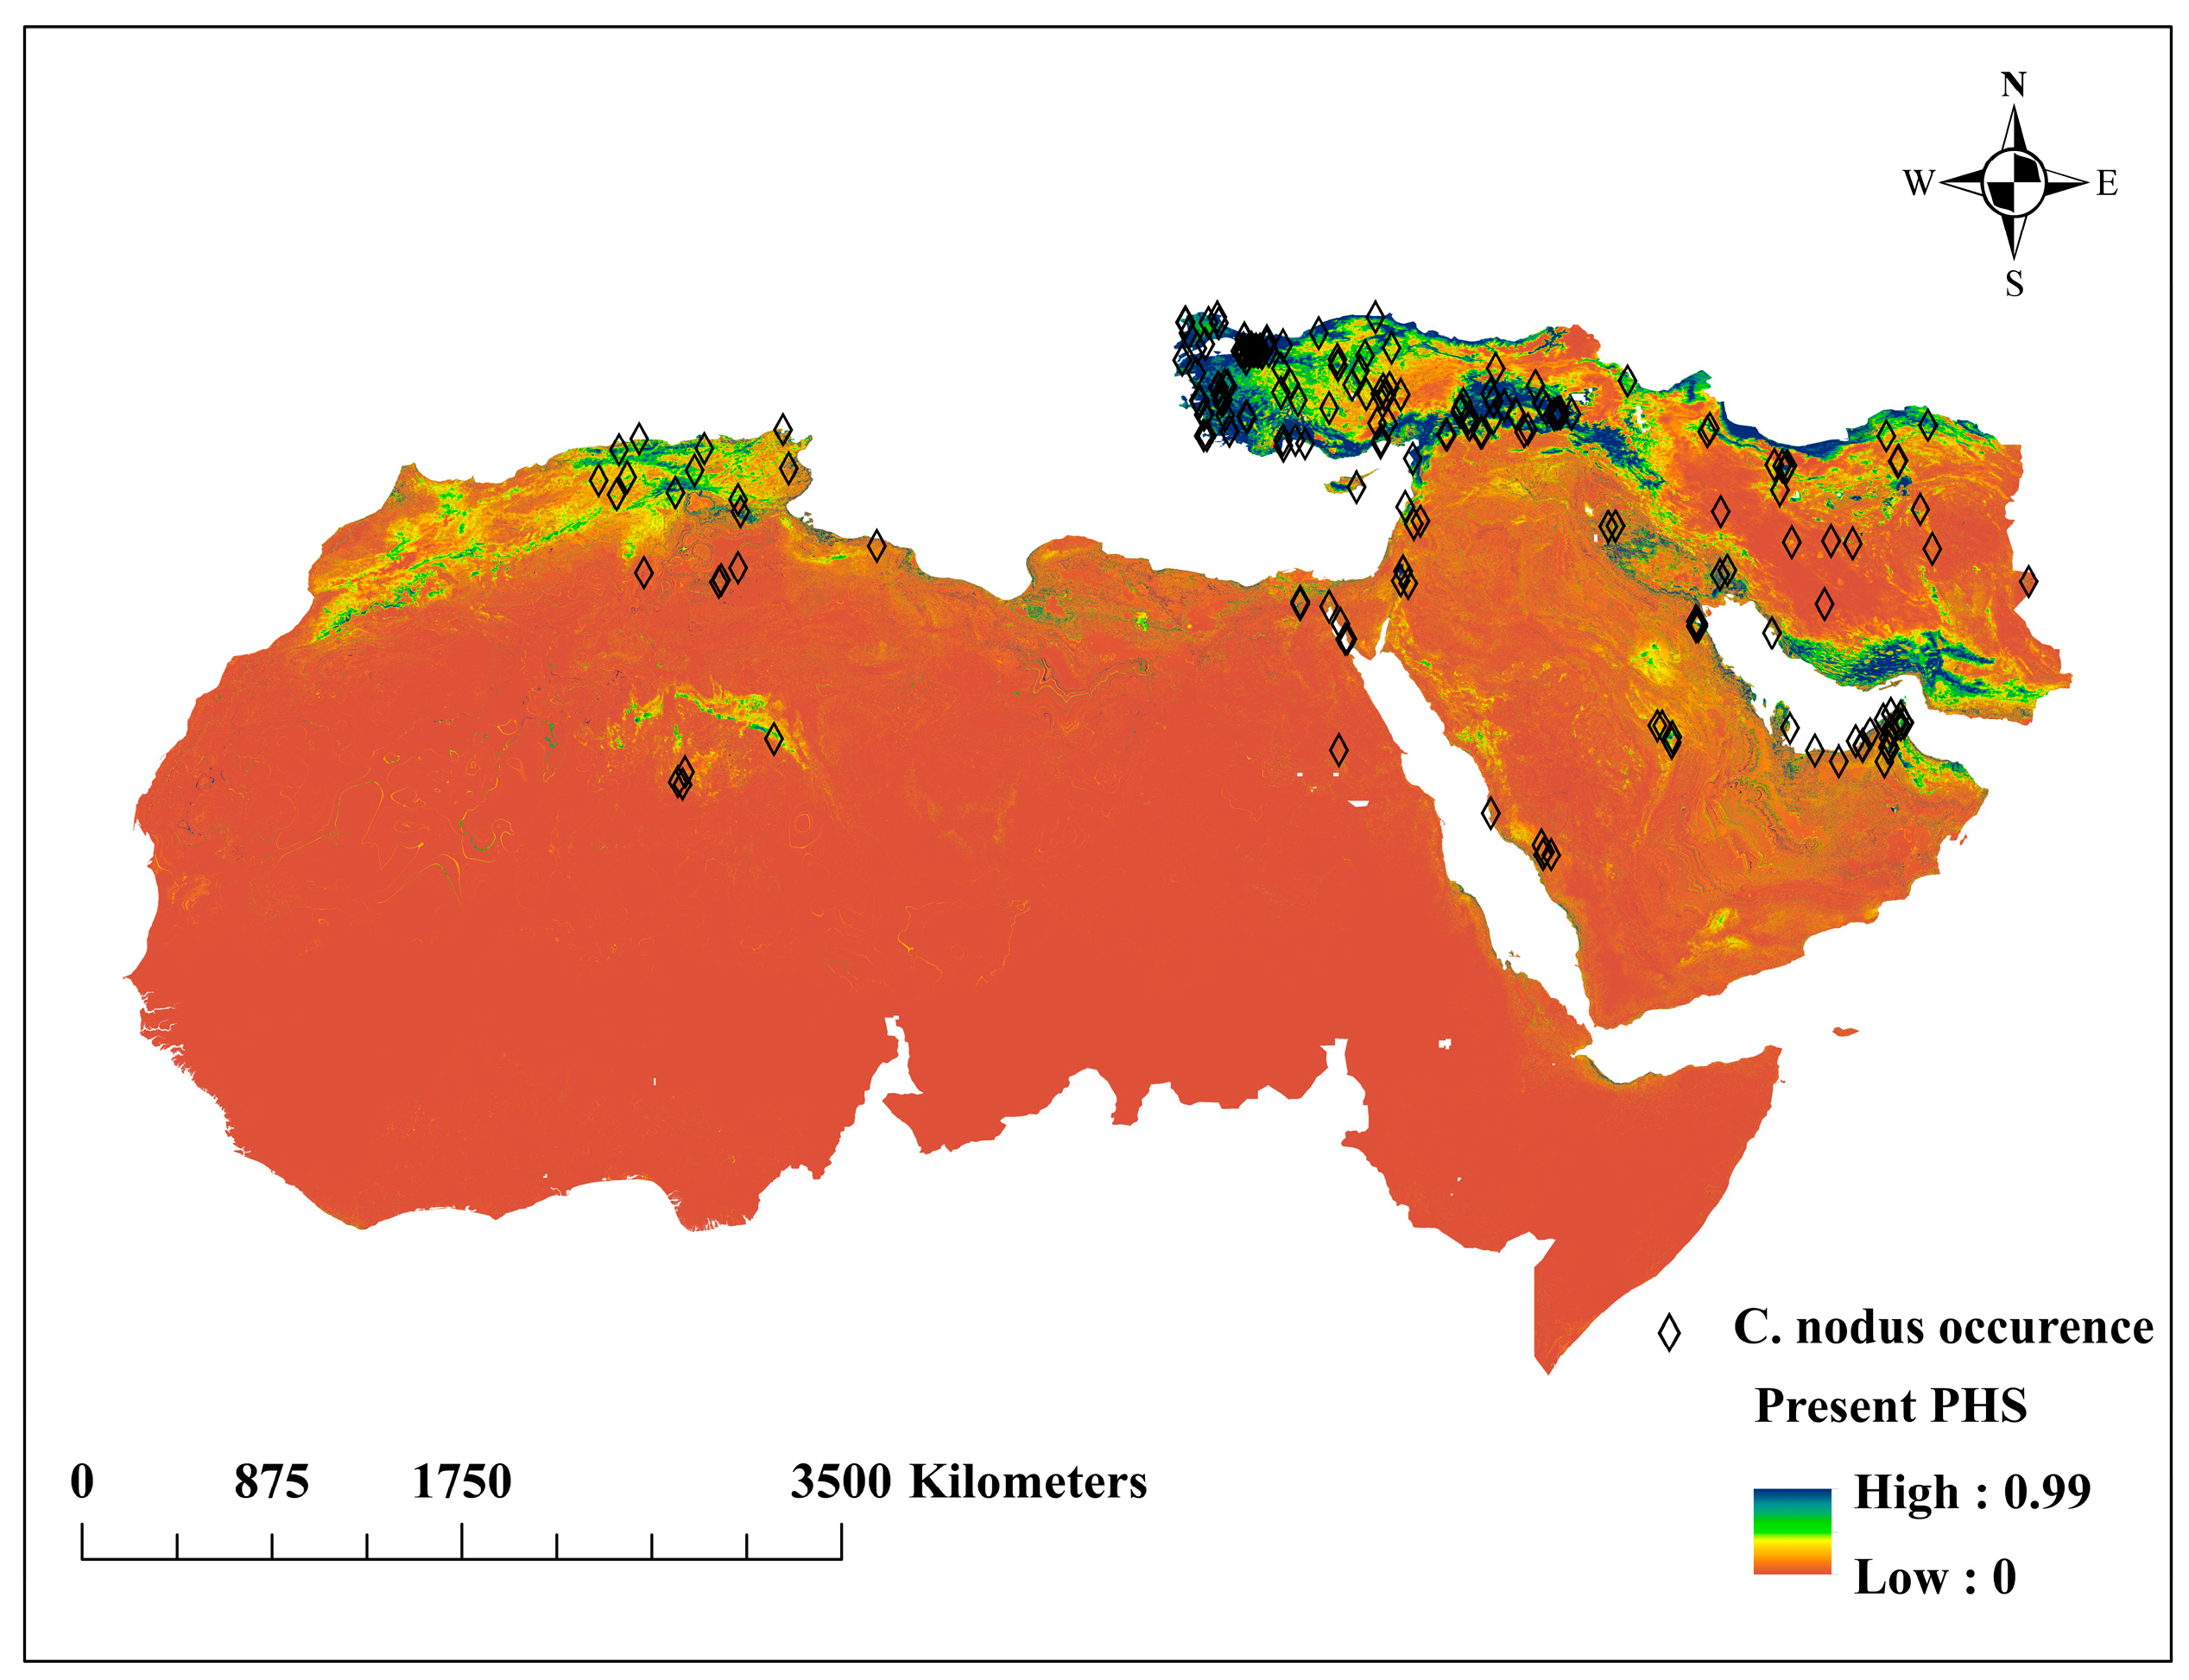
Model simulation with the present environmental conditions revealed that countries in the Northern African region, Turkey, UAE, Saudi, Oman, northern and southern parts Iran, Iraq, and Jordan have suitable potential habitat conditions for C. nodus (Figure 4). There were significant areas of extremely favorable habitat for C. nodus in the northern parts of the UAE, Turkey, and the southern part of Iran.
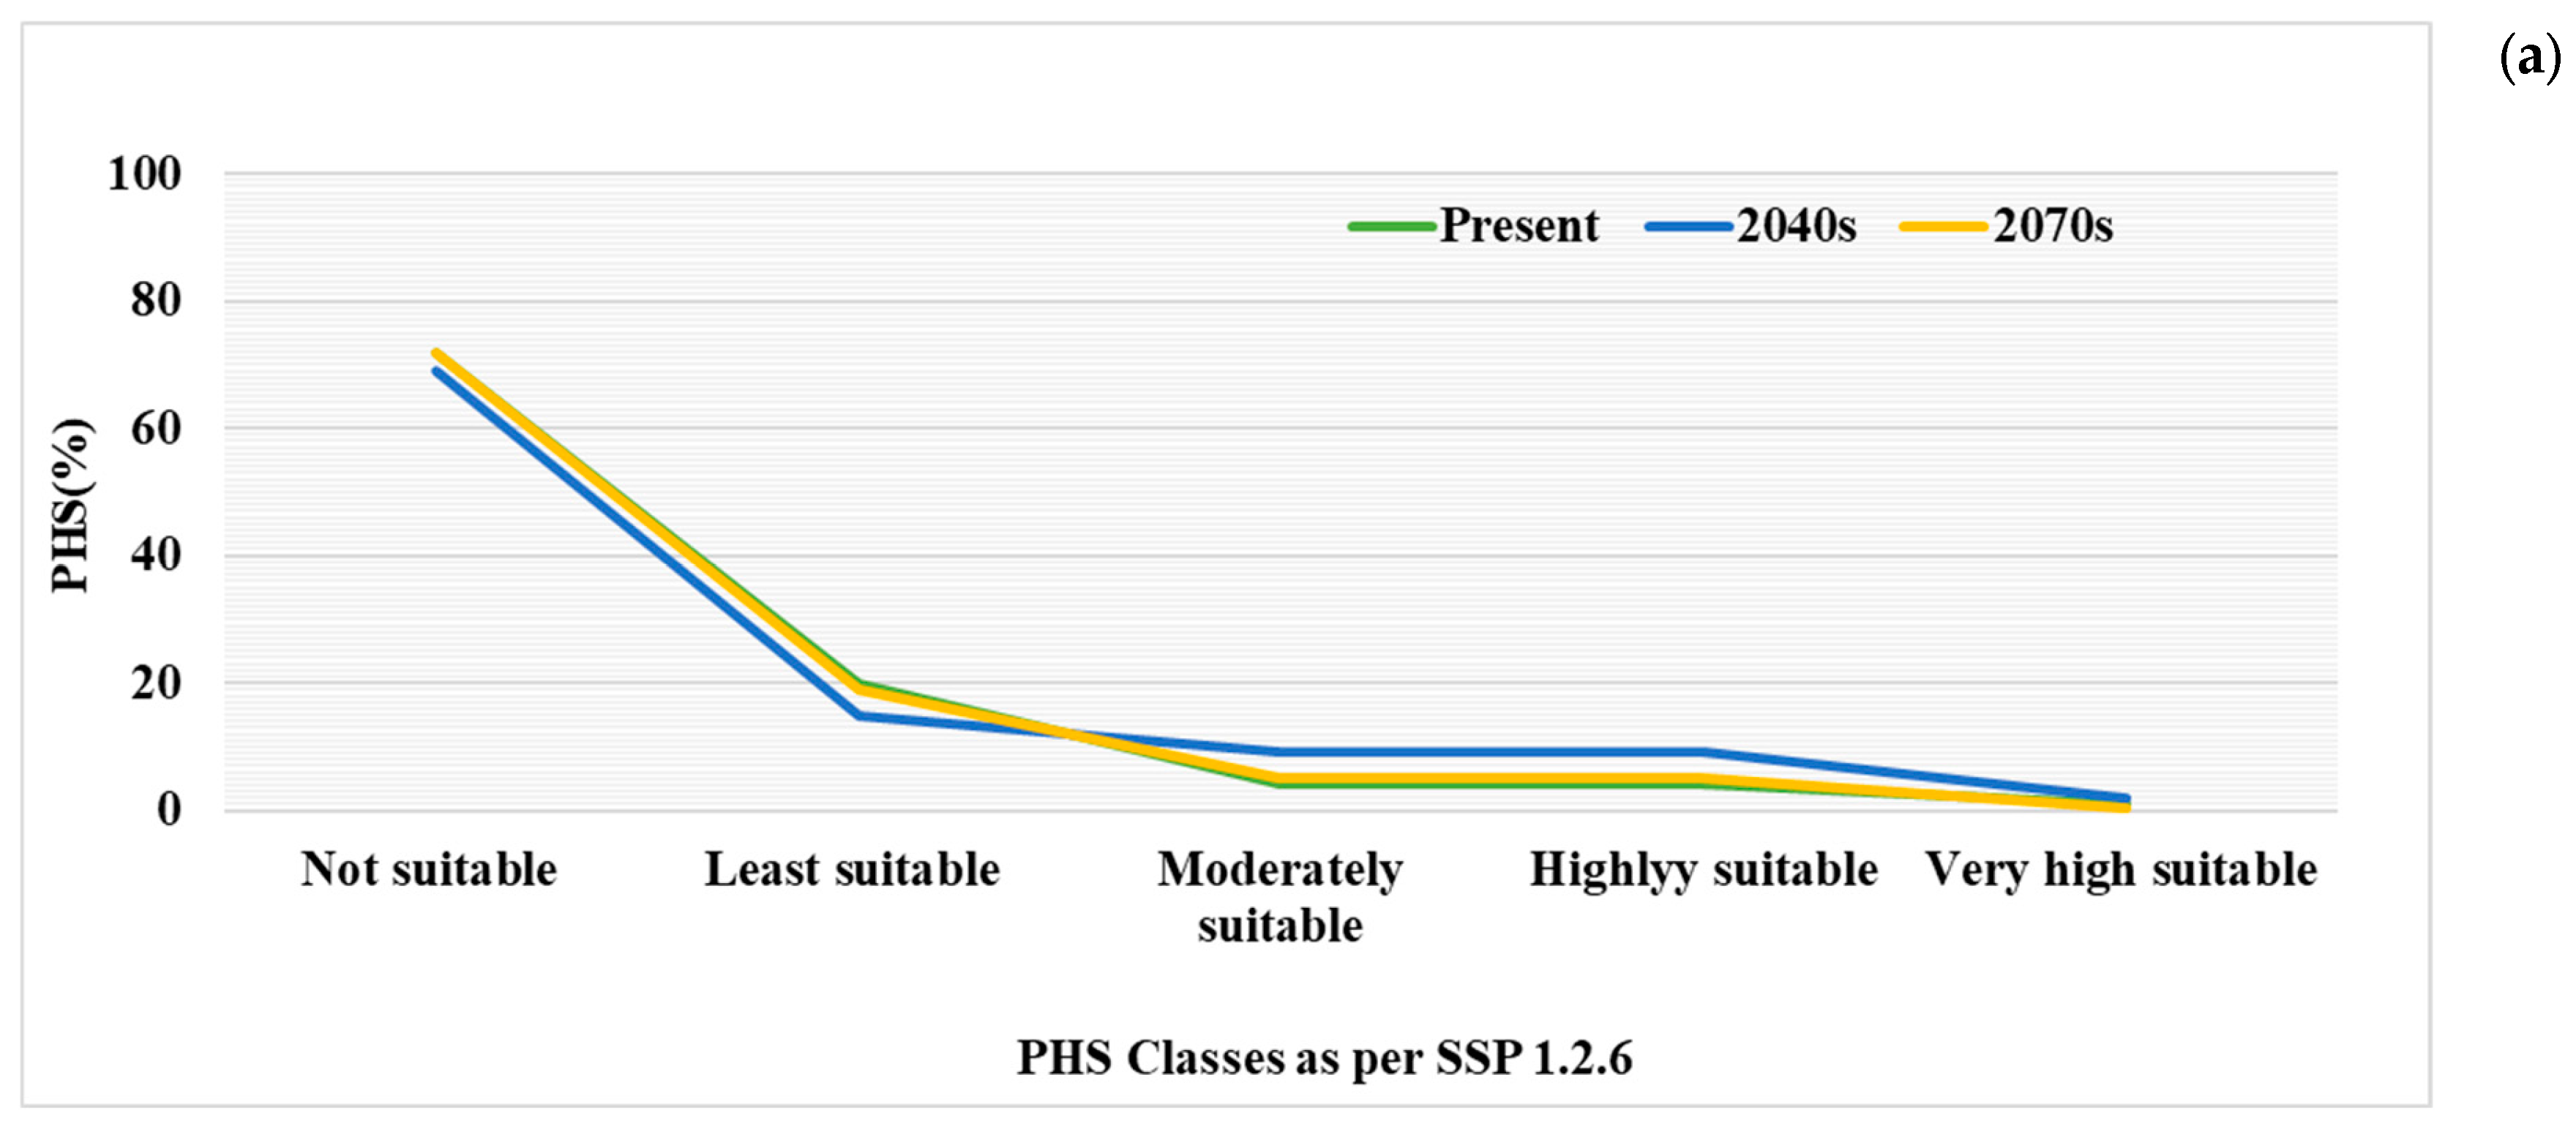
Previous studies reported that Cataglyphis ants are among the most abundant ants in the desert ecosystems of the Arabian Peninsula and Central Asia, where they build crater nests right in the ground [92] and are the most species-rich in this region [93]. This study reveals that only 5% of the study area is possibly highly favorable for C. nodus, 4% is moderately suitable, 19.9% is least suitable, and roughly 71.7% is not suitable.

3.3. Future Potential Habitat Suitability

Based on the future MaxEnt simulations, it appears that the PHS of C. nodus may shift from northern Turkey to the south, including Iran, Iraq, and parts of Saudi Arabia. Our projections suggest that the northern part of Turkey and the Atlas Mountains regions may experience changes of ±1 to 2 °C in the AMT by the 2040s and ±2 to 4 °C by the 2070s. This change in temperature could be a contributing factor to the spatial habitat suitability shift (from colder to warmer regions) of C. nodus in the MENA region (Figure 5).
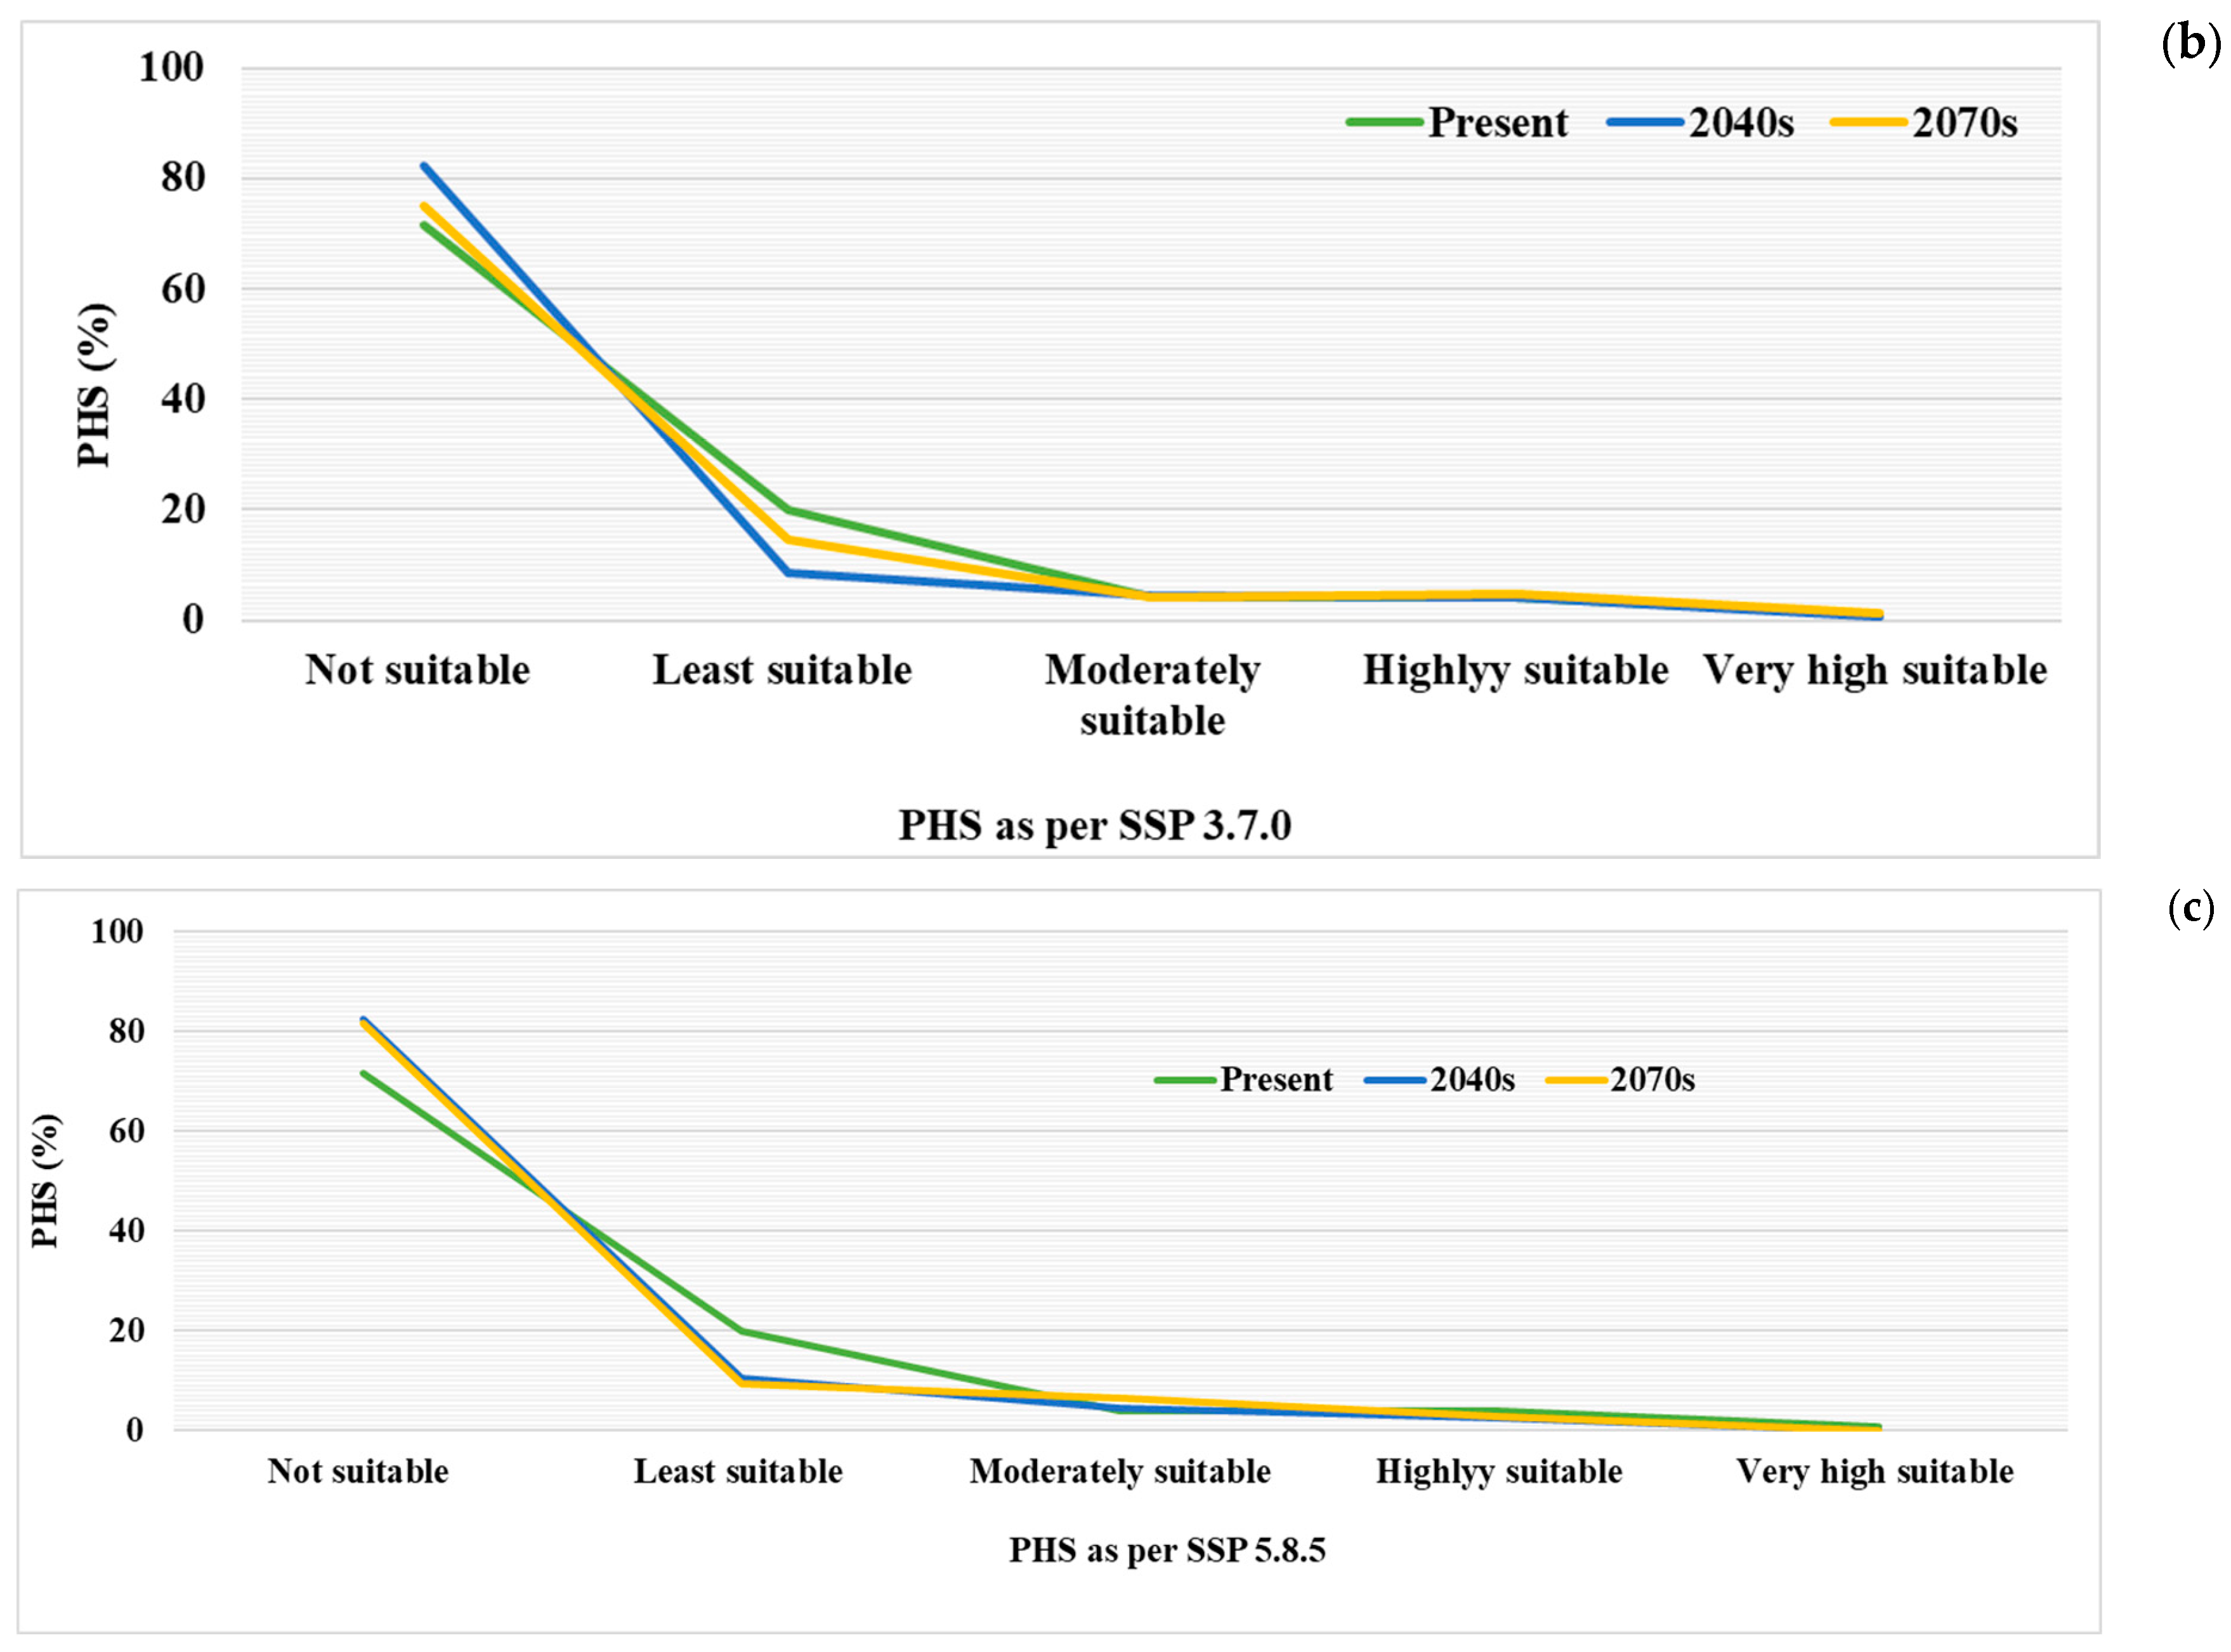
In the near future simulation (2040s), SSP 1.2.6 (Green Development Path) showed an increase in the high and very high suitable area, whereas SSP 3.7.0 (Regional Competition Path) and SSP 5.8.5 (High Development Path) revealed a slight reduction in the high suitability (Figure 6a–c). The far future (2070s) simulation showed reductions in the PHS with respect to the two SSPs, except 3.7.0 (Figure 6a–c). It may be the result of the increase in the AMT (±0.5 to 2 °C) and the associated changes in the bioclimatic conditions available for SSPs 3.7.0 and 5.8.5. Similarly, the habitat suitability modeling studies [56,94] of fire ants (Solenopsis geminate and Wasmannia auropunctata) predicted a slight decrease in the potential habitat under global warming, but favorable habitats are expected to expand to high latitudes under climate scenarios. A study by Saha et al. [95] revealed that the suitability of habitats for desert locusts will decrease in both the 2050s and the 2070s.

3.4. Uncertainty in Future Bioclimatic Conditions

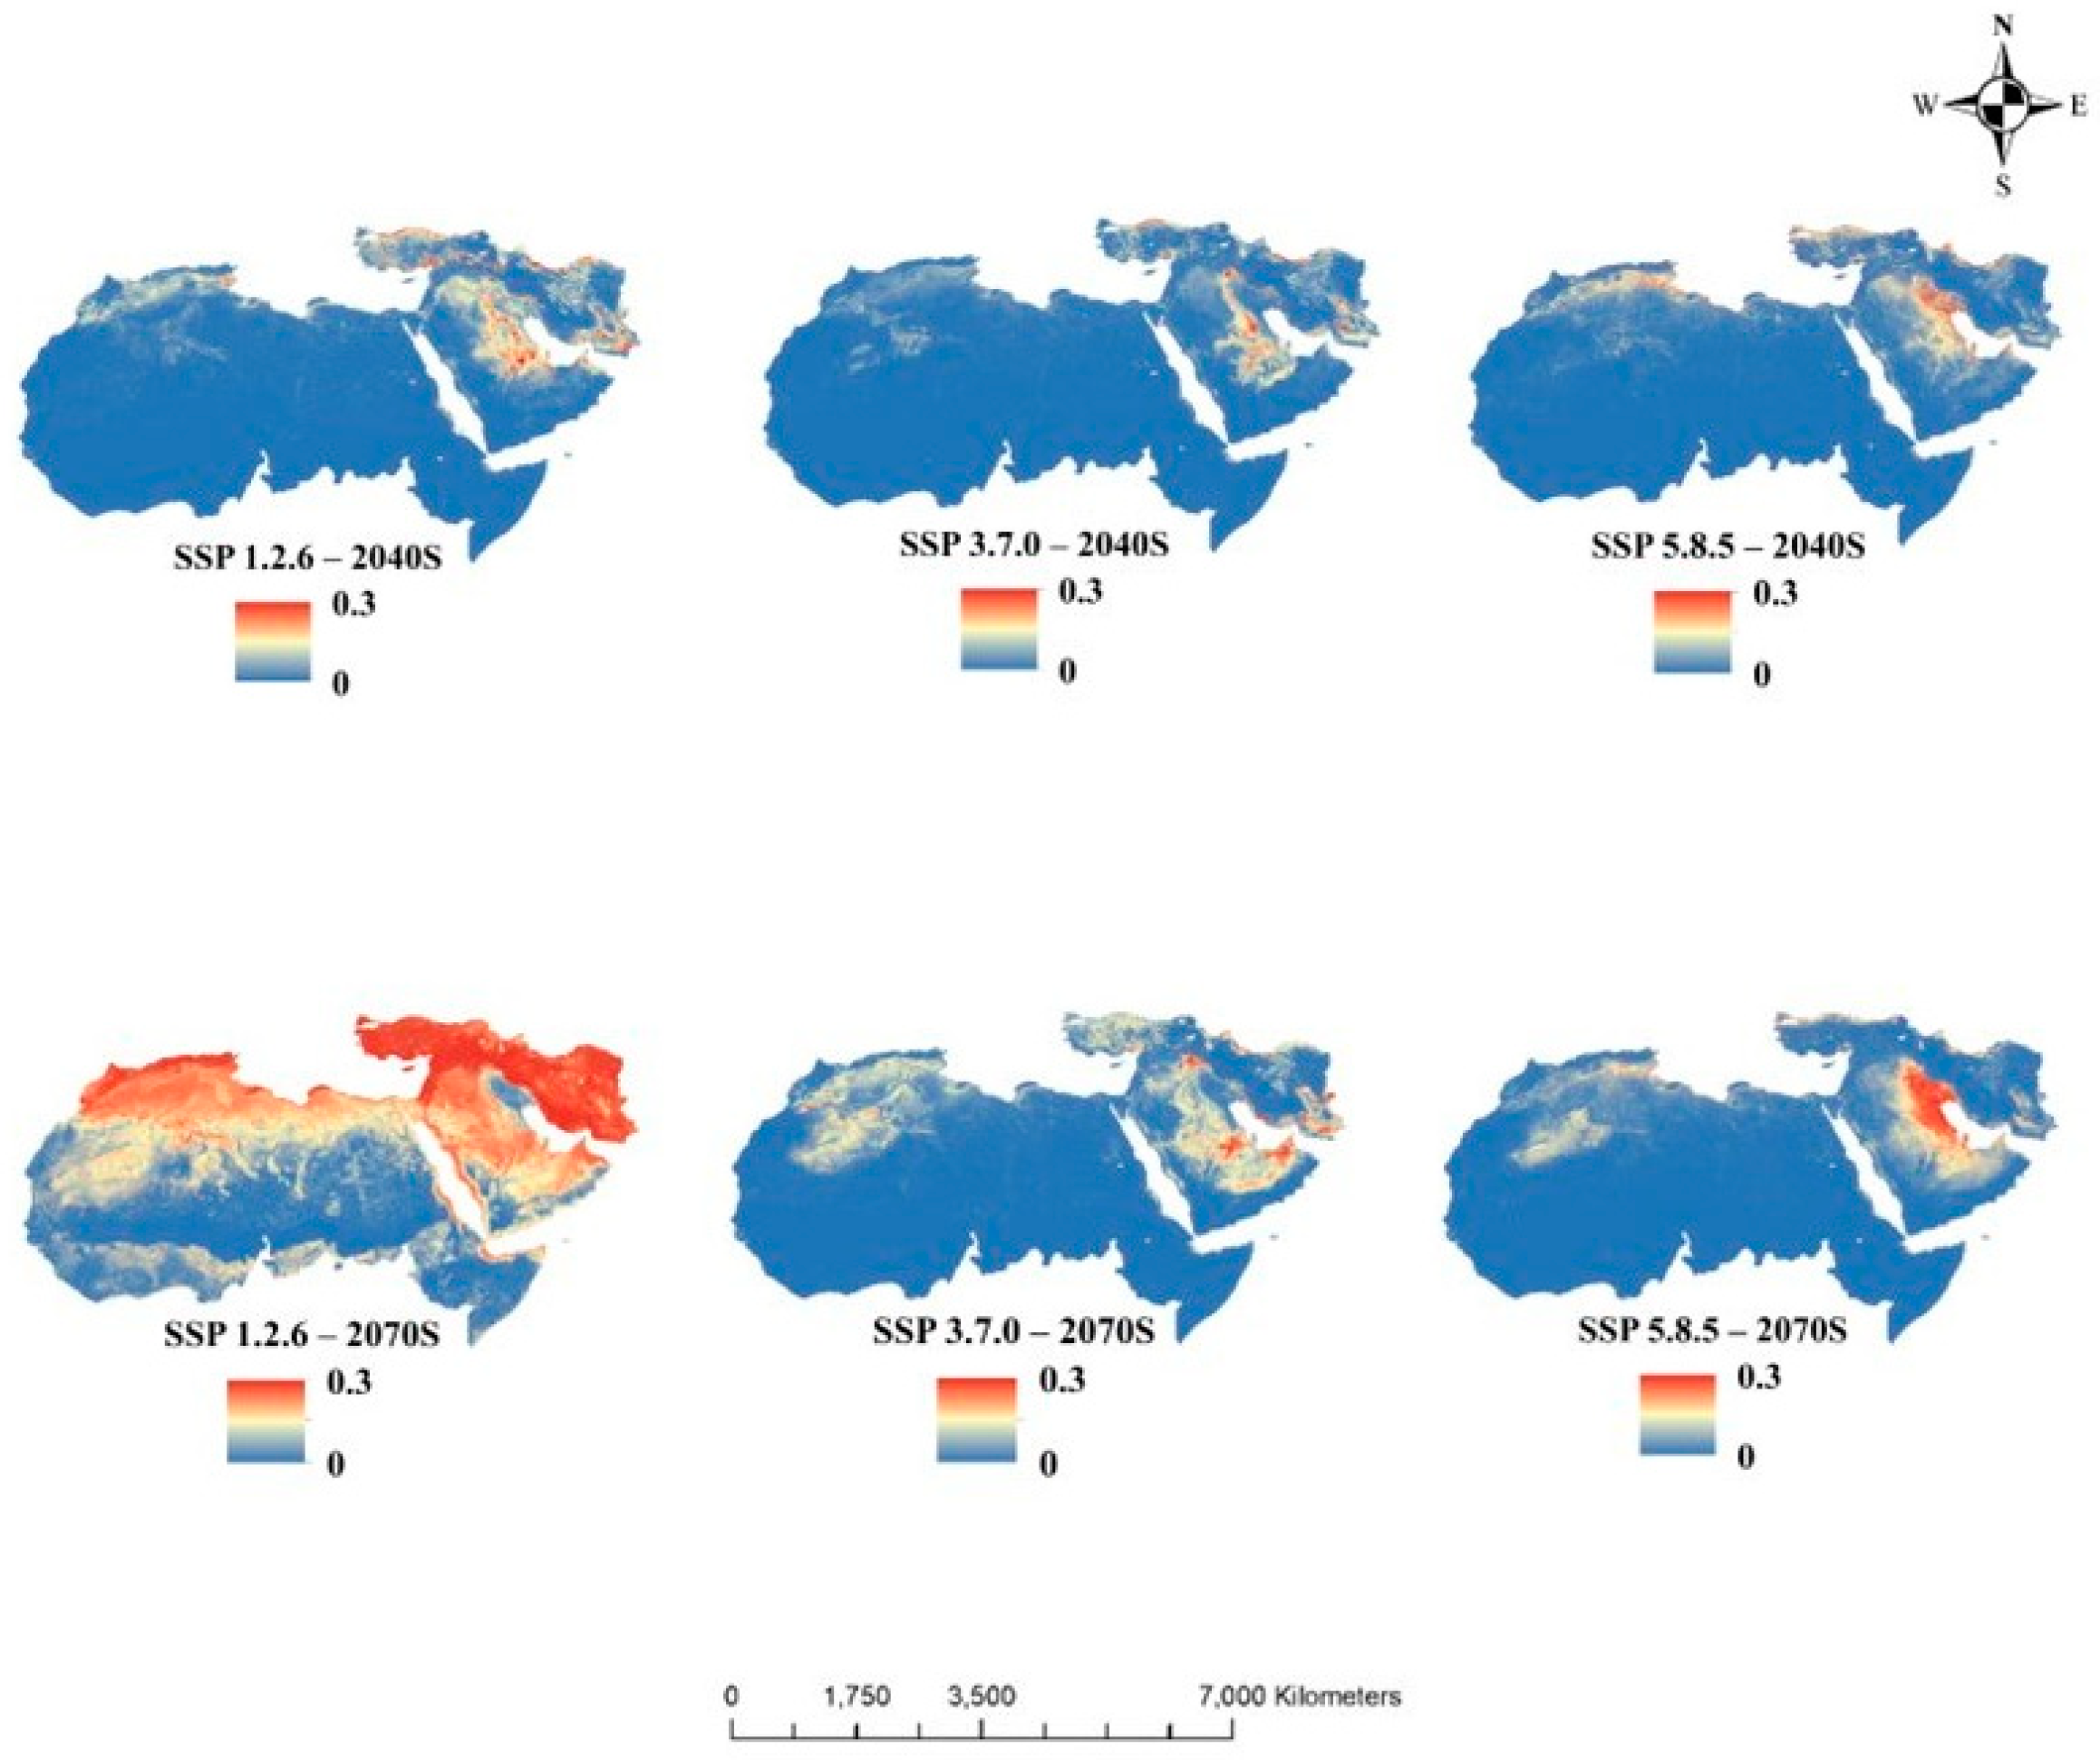
In this study, an analysis was conducted to examine the spatial standard deviation of the projected habitat suitability derived from the five climate models under three SSPs. This was achieved by utilizing the cell statistical function, which is available within the ArcGIS spatial analyst tool. The aim of the analysis was to evaluate the variation in habitat suitability predictions across the five different climate models, which can be useful for assessing the robustness of the projected results. The model uncertainty (Figure 7) was lower in the simulation for the near future (2040s). In the future (2070s), there was more uncertainty in the SSP 1.2.6 simulation for the UAE, Turkey, Iran, and the northern part of Africa, with a mean uncertainty of 0.16. This was due to differences in PHS simulation by the MPIESM12-HR model, compared to the other four models. However, the uncertainties in SSP 5.8.5 and 3.7.0 were low, with a mean uncertainty of 0.03.

4. Conclusions

The MENA area is one of the most vulnerable regions to the harmful effects under climate change. Cataglyphis desert ants are captivating organisms that thrive in arid conditions. With a preference for high temperatures, they can be spotted inhabiting areas such as dunes, steppes, and scrublands that stretch the Sahara and the Mediterranean Basin. As a first study in the MENA region, we modeled the current and future PHSs of Cataglyphis nodus based on three SSPs. The findings of this study suggest that the present suitable habitat for C. nodus is distributed over Turkey, Morocco, northern and southern parts of Iran, and the northern parts of the UAE, Oman, and Saudi Arabia. This study also reveals a habitat suitability shift in all future projected scenarios, which is from northern Turkey to the south, including Iran, Iraq, and parts of Saudi Arabia. Future PHS simulations reveal an overall decrease in the high suitability area, except SSP 1.2.6 in the 2040s and SSP 3.7.0 in the 2070s in the MENA region. Similarly, several species of lizards are found in the Sahara–Sahel region of the MENA, including the Tarentola mauritanica (Linnaeus 1758)
However, these lizards will move to higher latitudes but will not extend their territory in the 2061s and 2080s, according to a study [96]. Future habitat suitability of Spogostylum ocyale in the Middle East also revealed a progressive decline in the extent of suitable habitats with global warming [39]. A study of Brachyponera nigrita from Pakistan showed that the habitat suitability might increase in the suitable habitats of this species [97]. In 2015, Vale and Brito [98] discovered that desert-adapted species with low adaptive capacity are more vulnerable to climate change. This highlights the significance of assessing the effects of climate change on vulnerable species and the need for further research to identify management strategies to mitigate these impacts. Our results suggest that elevation, the mean monthly precipitation amount of the coldest quarter, and temperature seasonality are the major contributing environmental variables. In the future 2040s PHS simulations, it would increase by 5% in the high and 1% in very high suitable areas under SSP 1.2.6, while there would be a reduction under other SSPs.
The results show considerable uncertainties in future bioclimatic variables (0 to 0.3), particularly in SSP 1.2.6 of the 2070s, and large different spatial patterns, implying that the future prediction using a single climate model may not provide an accurate assessment of the habitat distribution pattern. It is highly recommended to utilize multiple climate models and environmental variables in MaxEnt future simulations for improving model performance and understanding uncertainty patterns. Plants and animals in hot and arid environments suffer from severe heat and desiccation stress. Thus, it is significant to know the favorable and adverse habitat benchmarks to withstand and survive the variations. The results of this study are significant, as they provide valuable insights that can be utilized to develop effective conservation and management strategies for this captivating species of insects thriving in the hyper-arid region. The findings of this comprehensive study can be used to inform and guide future conservation and management plans for this species, ensuring their continued survival and contributing to the overall biodiversity of the region.

5. Limitations of the Study

The study focused only on one species and did not consider a group of related species. To better understand the impacts of climate change on desert ecosystems, we highly recommend adopting a multi-species approach rather than relying on a single species alone. Such an approach will help to yield more accurate and comprehensive data, enabling a more nuanced understanding of the complex interactions between species and their environment.

Supplementary Materials

The following supporting information can be downloaded at: https://www.mdpi.com/article/10.3390/d16090563/s1, Table S1: Environmental variables used for Cataglyphis nodus potential habitat suitability simulation.

Author Contributions

Conceptualization, R.K.K. and Y.K.; Methodology, R.K.K. and Y.K.; Software, R.K.K.; Validation, H.P., C.G., B.G. and E.P.E.; Formal analysis, R.K.K. and Y.K.; Investigation, R.K.K., H.P., C.G., B.G. and E.P.E.; Resources, R.K.K.; Writing—original draft, R.K.K.; Writing—review & editing, H.P., C.G., B.G., E.P.E. and Y.K.; Funding acquisition, Y.K. All authors have read and agreed to the published version of the manuscript.

Funding

This research and the APC were funded by the 2020 ASPIRE and 2023 UPAR research program grant number [12S120].

Institutional Review Board Statement

Not applicable.

Data Availability Statement

The environmental satellite data records used in this study are publicly accessible from the following repositories: Land parameter data records (LPDR) (https://nsidc.org/data/nsidc-0451/versions/3 accessed on 17 June 2023), SMAP L4_SM Geophysical data (https://doi.org/10.5067/EVKPQZ4AFC4D), Climate variables used for this study are available at Climatologies at high resolution for the earth’s land surface areas (https://chelsa-climate.org/). Data will be made available upon request.

Acknowledgments

This work was conducted at the United Arab Emirates University under contract to the 2020 ASPIRE and 2023 UPAR grants.

Conflicts of Interest

The authors declare that they have no conflicts of interest.

References

  1. Mantyka-Pringle, C.S.; Martin, T.G.; Rhodes, J.R. Interactions between climate and habitat loss effects on biodiversity: A systematic review and meta-analysis. Glob. Chang. Biol. 2012, 18, 1239–1252. [Google Scholar] [CrossRef]
  2. Burrows, M.T.; Schoeman, D.S.; Richardson, A.J.; García, J. Climate velocity and geographical limits to shifts in species’ distributions. Nature 2014, 507, 492–495. [Google Scholar] [CrossRef] [PubMed]
  3. Rosenweig, M.L. Species Diversity in Space and Time; Cambridge University Press: New York, NY, USA, 1995. [Google Scholar]
  4. Dornelas, M.; Magurran, A.E.; Buckland, S.T.; Chao, A.; Chazdon, R.L.; Colwell, R.K.; Curtis, T.; Gaston, K.J.; Gotelli, N.J.; Kosnik, M.A.; et al. Quantifying temporal change in biodiversity: Challenges and opportunities. Proc. R. Soc. B Biol. Sci. 2013, 280, 20121931. [Google Scholar] [CrossRef] [PubMed]
  5. Chen, C.; Xia, Q.W.; Fu, S.; Wu, X.F.; Xue, F.S. Effect of photoperiod and temperature on the intensity of pupal diapause in the cotton bollworm, Helicoverpa armigera (Lepidoptera: Noctuidae). Bull. Entomol. Res. 2014, 104, 12–18. [Google Scholar] [CrossRef]
  6. Macfadyen, S.; McDonald, G.; Hill, M.P. From species distributions to climate change adaptation: Knowledge gaps in managing invertebrate pests in broad-acre grain crops. Agric. Ecosyst. Environ. 2018, 253, 208–219. [Google Scholar] [CrossRef]
  7. Schultheiss, P.; Nooten, S.S.; Wang, R.; Wong, M.K.; Brassard, F.; Guénard, B. The abundance, biomass, and distribution of ants on Earth. Proc. Natl. Acad. Sci. USA 2022, 119, 2201550119. [Google Scholar] [CrossRef]
  8. Brian, M.V. (Ed.) Production Ecology of Ants and Termites; Cambridge University Press: Cambridge, UK, 1978; Volume 13. [Google Scholar]
  9. Griffiths, H.M.; Ashton, L.A.; Walker, A.E.; Hasan, F.; Evans, T.A.; Eggleton, P.; Parr, C.L. Ants are the major agents of resource removal from tropical rainforests. J. Anim. Ecol. 2018, 87, 293–300. [Google Scholar] [CrossRef]
  10. Frouz, J.; Jilková, V. The effect of ants on soil properties and processes (Hymenoptera: Formicidae). Myrmecol. News 2008, 11, 191–199. [Google Scholar]
  11. Grodsky, S.M.; Roeder, K.A.; Campbell, J.W. Effects of solar energy development on ants in the Mojave Desert. Ecosphere 2023, 14, 4668. [Google Scholar] [CrossRef]
  12. Hoffmann, B.D. Using ants for rangeland monitoring: Global patterns in the responses of ant communities to grazing. Ecol. Indic. 2010, 10, 105–111. [Google Scholar] [CrossRef]
  13. Schultz, T.R. In search of ant ancestors. Proc. Natl. Acad. Sci. USA 2000, 97, 14028–14029. [Google Scholar] [CrossRef] [PubMed]
  14. Andersen, A.N. The use of and communities to evaluate change in Australian terrestrial ecosystems: A review and a recipe. Proc. Ecol. Soc. Aust. 1990, 16, 347–357. [Google Scholar]
  15. Hansen, R.R.; Kristiansen, S.M.; Damgaard, C.F.; Offenberg, J. Effects of ant mounts (Formica exsecta) on subsoil properties, in a heathland. Eur. J. Soil Sci. 2024, 120, 103597. [Google Scholar] [CrossRef]
  16. Folgarait, P.J.; Perelman, S.; Gorosito, N.; Pizzio, R.; Fernández, J. Effects of Camponotus punctulatus ants on plant community composition and soil properties across land-use histories. Plant Ecol. 2002, 163, 1–13. [Google Scholar] [CrossRef]
  17. Folgarait, P.J. Ant biodiversity and its relationship to ecosystem functioning: A review. Biodivers. Conserv. 1998, 7, 1221–1244. [Google Scholar] [CrossRef]
  18. Dantas, A.; Fonseca, C.R. Global biogeographical patterns of ants and their abiotic determinants. Perspect. Ecol. Conserv. 2023, 21, 237–246. [Google Scholar] [CrossRef]
  19. Economo, E.P.; Narula, N.; Friedman, N.R.; Weiser, M.D.; Guénard, B. Macroecology and macroevolution of the latitudinal diversity gradient in ants. Nat. Commun. 2018, 9, 1778. [Google Scholar] [CrossRef]
  20. Samson, D.A.; Rickart, E.A.; Gonzales, P.C. Ant Diversity and Abundance along an Elevational Gradient in the Philippines. Biotropica 1997, 29, 349–363. [Google Scholar] [CrossRef]
  21. Brener, A.G.F.; Ruggiero, A. Leaf-cutting ants (Atta and Acromyrmex) inhabiting Argentina: Patterns in species richness and geographical range sizes. J. Biogeogr. 1994, 21, 391–399. [Google Scholar] [CrossRef]
  22. Gerlach, J.; Samways, M.; Pryke, J. Terrestrial invertebrates as bioindicators: An overview of available taxonomic groups. J. Insect Conserv. 2013, 17, 831–850. [Google Scholar] [CrossRef]
  23. Schmidt, F.A.; Ribas, C.R.; Schoereder, J.H. How predictable is the response of ant assemblages to natural forest recovery? Implications for their use as bioindicators. Ecol. Indic. 2013, 24, 158–166. [Google Scholar] [CrossRef]
  24. Nascimento, G.; Câmara, T.; Arnan, X. Critical thermal limits in ants and their implications under climate change. Biol. Rev. 2022, 97, 1287–1305. [Google Scholar] [CrossRef] [PubMed]
  25. Parr, C.L.; Bishop, T.R. The response of ants to climate change. Glob. Change Biol. 2022, 28, 3188–3205. [Google Scholar] [CrossRef] [PubMed]
  26. Perez, R.; Aron, S. Adaptations to thermal stress in social insects: Recent advances and future directions. Biol. Rev. 2020, 95, 1535–1553. [Google Scholar] [CrossRef] [PubMed]
  27. Boulay, R.; Aron, S.; Cerdá, X.; Doums, C.; Graham, P.; Hefetz, A.; Monnin, T. Social life in arid environments: The case study of Cataglyphis ants. Annu. Rev. Entomol. 2017, 62, 305–321. [Google Scholar] [CrossRef]
  28. Cerda, X.; Arnan, X.; Retana, J. Is competition a significant hallmark of ant (Hymenoptera: Formicidae) ecology. Myrmecol. News 2013, 18, 131–147. [Google Scholar]
  29. Boulay, R.; Arnan, X.; Cerdá, X.; Retana, J. The ecological benefits of larger colony size may promote polygyny in ants. J. Evol. Biol. 2014, 27, 2856–2863. [Google Scholar] [CrossRef] [PubMed]
  30. Agosti, D. Review and reclassification of Cataglyphis (Hymenoptera, Formicidae). J. Nat. Hist. 1990, 24, 1457–1505. [Google Scholar] [CrossRef]
  31. Lenoir, A.; Aron, S.; Cerda, X.; Hefetz, A. Cataglyphis desert ants: A good model for evolutionary biology in Darwin’s anniversary year—A review. Isr. J. Entomol. 2009, 39, 1–32. [Google Scholar]
  32. Borghesi, S.; Ticci, E. Climate change in the MENA region: Environmental risks, socioeconomic effects and policy challenges for the future. In IEMed Mediterranean Yearbook 2019; IEMed: Barcelona, Spain, 2019; pp. 289–292. Available online: http://hdl.handle.net/11365/1121314 (accessed on 16 January 2023).
  33. Waha, K.; Krummenauer, L.; Adams, S.; Aich, V.; Baarsch, F.; Coumou, D.; Fader, M.; Hoff, H.; Jobbins, G.; Marcus, R.; et al. Climate change impacts in the Middle East and Northern Africa (MENA) region and their implications for vulnerable population groups. Reg. Environ. Chang. 2017, 17, 1623–1638. [Google Scholar] [CrossRef]
  34. Giorgi, F.; Lionello, P. Climate change projections for the Mediterranean region. Glob. Planet. Chang. 2008, 63, 90–104. [Google Scholar] [CrossRef]
  35. Essa, Y.H.; Hirschi, M.; Thiery, W.; El-Kenawy, A.M.; Yang, C. Drought characteristics in Mediterranean under future climate change. NPJ Clim. Atmos. Sci. 2023, 6, 133. [Google Scholar] [CrossRef]
  36. Abdulwahab, U.A.; Hammill, E.; Hawkins, C.P. Choice of climate data affects the performance and interpretation of species distribution models. Ecol. Model. 2022, 471, 110042. [Google Scholar] [CrossRef]
  37. Almarinez, B.J.M.; Fadri, M.J.A.; Lasina, R.; Tavera, M.A.A.; Carvajal, T.M.; Watanabe, K.; Legaspi, J.C.; Amalin, D.M. A bioclimate-based maximum entropy model for Comperiella calauanica Barrion, Almarinez and Amalin (Hymenoptera: Encyrtidae) in the Philippines. Insects 2021, 12, 26. [Google Scholar] [CrossRef]
  38. Khatri-Chhetri, P.; Hendryx, S.M.; Hartfield, K.A.; Crimmins, M.A.; Leeuwen, W.J.V.; Kane, V.R. Assessing vegetation response to multi-scalar drought across the Mojave, Sonoran, Chihuahuan deserts and Apache highlands in the Southwest United States. Remote Sens. 2021, 13, 1103. [Google Scholar] [CrossRef]
  39. Soliman, M.M.; Al-Khalaf, A.A.; El-Hawagry, M.S. Effects of Climatic Change on Potential Distribution of Spogostylum ocyale (Diptera: Bombyliidae) in the Middle East Using Maxent Modelling. Insects 2023, 14, 120. [Google Scholar] [CrossRef]
  40. Pearson, R.G.; Dawson, T.P. Predicting the impacts of climate change on the distribution of species: Are bioclimate envelope models useful? Glob. Ecol. Biogeogr. 2003, 12, 361–371. [Google Scholar] [CrossRef]
  41. Elith, J.; Leathwick, J.R. Species distribution models: Ecological explanation and prediction across space and time. Annu. Rev. Ecol. J. Syst. Evol. 2009, 40, 677–697. [Google Scholar] [CrossRef]
  42. Brambilla, M.; Bazzi, G.; Ilahiane, L. The effectiveness of species distribution models in predicting local abundance depends on model grain size. Ecology 2024, 105, 4224. [Google Scholar] [CrossRef]
  43. Eastman, J.R. Idrisi Selva Tutorial; Idrisi Production, Clark Labs-Clark University: Worcester, MA, USA, 2012; Volume 45, pp. 51–63. [Google Scholar]
  44. Hosseini, N.; Ghorbanpour, M.; Mostafavi, H. Habitat potential modelling and the effect of climate change on the current and future distribution of three Thymus species in Iran using MaxEnt. Sci. Rep. 2024, 14, 3641. [Google Scholar] [CrossRef] [PubMed]
  45. Phillips, S.J.; Anderson, R.P.; Schapire, R.E. Maximum entropy modeling of species geographic distributions. Ecol. Model. 2006, 190, 231–259. [Google Scholar] [CrossRef]
  46. Elith, J.; Phillips, S.J.; Hastie, T.; Dudík, M.; Chee, Y.E.; Yates, C.J. A statistical explanation of MaxEnt for ecologists. Divers. Distrib. 2011, 17, 43–57. [Google Scholar] [CrossRef]
  47. Guisan, A.; Zimmermann, N.E. Predictive habitat distribution models in ecology. Ecol. Model. 2000, 135, 147–186. [Google Scholar] [CrossRef]
  48. Kalarikkal, R.K.; Kim, Y.; Ksiksi, T. Incorporating satellite remote sensing for improving potential habitat simulation of Prosopis cineraria (L.) Druce in United Arab Emirates. Glob. Ecol. Conserv. 2022, 37, e02167. [Google Scholar] [CrossRef]
  49. Sallam, M.F.; Al Ahmed, A.M.; Abdel-Dayem, M.S.; Abdullah, M.A. Ecological niche modeling and land cover risk areas for rift valley fever vector, Culex tritaeniorhynchus Giles in Jazan, Saudi Arabia. PLoS ONE 2013, 8, 65786. [Google Scholar] [CrossRef]
  50. Macedo, F.L.; Ragonezi, C.; Reis, F.; de Freitas, J.G.; Lopes, D.H.; Aguiar, A.M.F.; Cravo, D.; Carvalho, M.A.P.D. Prediction of the Potential Distribution of Drosophila suzukii on Madeira Island Using the Maximum Entropy Modeling. Agriculture 2023, 13, 1764. [Google Scholar] [CrossRef]
  51. Holuša, J.; Kaláb, O. The habitat-suitability models of the European mole cricket (Gryllotalpa gryllotalpa) as information tool for conservation and pest management. Heliyon 2023, 9, e14826. [Google Scholar] [CrossRef] [PubMed]
  52. Lee, W.H.; Song, J.W.; Yoon, S.H.; Jung, J.M. Spatial evaluation of machine learning-based species distribution models for prediction of invasive ant species distribution. Appl. Sci. 2022, 12, 10260. [Google Scholar] [CrossRef]
  53. Istifanus, A.P.; Abdelmutalab, A.G.; Pirk, C.W.; Yusuf, A.A. Predicting the Habitat Suitability and Distribution of Two Species of Mound-Building Termites in Nigeria Using Bioclimatic and Vegetation Variables. Diversity 2023, 15, 157. [Google Scholar] [CrossRef]
  54. Kim, J.H.; Park, S.; Kim, S.H.; Lee, E.J. Identifying high-priority conservation areas for endangered waterbirds using a flagship species in the Korean DMZ. Ecol. Eng. 2021, 159, 106080. [Google Scholar] [CrossRef]
  55. Morales, N.; Fernández, I.C.; Baca-González, V. MaxEnt’s parameter configuration and small samples: Are we paying attention to recommendations? A systematic review. PeerJ 2017, 5, e3093. [Google Scholar] [CrossRef] [PubMed]
  56. Lee, C.M.; Lee, D.S.; Kwon, T.S.; Athar, M.; Park, Y.S. Predicting the global distribution of Solenopsis geminata (Hymenoptera: Formicidae) under climate change using the MaxEnt model. Insects 2021, 12, 229. [Google Scholar] [CrossRef] [PubMed]
  57. Brodetzki, R.T.; Inbar, S.; Cohen, P.; Aron, S.; Privman, E.; Hefetz, A. The Interplay between Incipient Species and Social Polymorphism in the Desert Ant Cataglyphis. Sci. Rep. 2019, 9, 9495. [Google Scholar] [CrossRef]
  58. Knaden, M.; Tinaut, A.; Stoekl, J.; Cerda, X.; Wehner, R. Molecular phylogeny of the desert ant genus Cataglyphis (Hymenoptera: Formicidae), Myrmecol. News 2012, 16, 123–132. [Google Scholar]
  59. Aron, S.; Mardulyn, P.; Leniaud, L. Evolution of reproductive traits in Cataglyphis desert ants: Mating frequency, queen number, and thelytoky. Behav. Ecol. Sociobiol. 2016, 70, 1367–1379. [Google Scholar] [CrossRef]
  60. Ionescu, A.; Eyer, P.A. Notes on Cataglyphis Foerster, 1850 of the bicolor species-group in Israel, with description of a new species (Hymenoptera: Formicidae). Isr. J. Entomol. 2016, 46, 109–131. [Google Scholar]
  61. Guénard, B.; Weiser, M.D.; Gomez, K.; Narula, N.; Economo, E.P. The Global Ant Biodiversity Informatics (GABI) Database: Synthesizing Data on the Geographic Distribution of Ant Species (Hymenoptera: Formicidae). Ph.D. Thesis, Okinawa Institute of Science and Technology Graduate University, Okinawa, Japan, 2017. [Google Scholar]
  62. Fick, S.E.; Hijmans, R.J. WorldClim 2: New 1 km spatial resolution climate surfaces for global land areas. Int. J. Climatol. 2017, 37, 4302–4315. [Google Scholar] [CrossRef]
  63. Reichle, R.; De Lannoy, G.; Koster, R.D.; Crow, W.T.; Kimball, J.S.; Liu, Q. SMAP L4 Global 3-Hourly 9 km EASE-Grid Surface and Root Zone Soil Moisture Analysis Update, Version 6. [Indicate Subset Used]; NASA National Snow and Ice Data Center Distributed Active Archive Center: Boulder, CO, USA, 2021. [Google Scholar] [CrossRef]
  64. AppEEARS Team. Application for Extracting and Exploring Analysis Ready Samples (AppEEARS); NASA EOSDIS Land Processes Distributed Active Archive Center (LP DAAC), USGS/Earth Resources Observation and Science (EROS) Center: Sioux Falls, SD, USA, 2023. Available online: https://appeears.earthdatacloud.nasa.gov/ (accessed on 16 January 2023).
  65. Woodward, F.I. Climate and Plant Distribution; Cambridge University Press: Cambridge, UK, 1987. [Google Scholar]
  66. Davis, M.B.; Shaw, R.G. Range shifts and adaptive responses to Quaternary climate change. Science 2001, 292, 673–679. [Google Scholar] [CrossRef]
  67. Karger, D.N.; Conrad, O.; Böhner, J.; Kawohl, T.; Kreft, H.; Soria-Auza, R.W.; Zimmermann, N.E.; Linder, H.P.; Kessler, M. Climatologies at high resolution for the earth’s land surface areas. Sci. Data 2017, 4, 170122. [Google Scholar] [CrossRef]
  68. Brun, P.; Zimmermann, N.E.; Hari, C.; Pellissier, L.; Karger, D.N. CHELSA-BIOCLIM+ A Novel Set of Global Climate-Related Predictors at Kilometre-Resolution; EnviDat, 2022. [Google Scholar] [CrossRef]
  69. Lange, S. Trend-preserving bias adjustment and statistical downscaling with ISIMIP3BASD (v1. 0). Geosci. Model Dev. 2019, 12, 3055–3070. [Google Scholar] [CrossRef]
  70. Dunne, J.P.; John, J.G.; Adcroft, A.J.; Griffies, S.M.; Hallberg, R.W.; Shevliakova, E.; Stouffer, R.J.; Cooke, W.; Dunne, K.A.; Harrison, M.J.; et al. GFDL’s ESM2 global coupled climate–carbon earth system models. Part I: Physical formulation and baseline simulation characteristics. J. Clim. 2012, 25, 6646–6665. [Google Scholar] [CrossRef]
  71. Boucher, O.; Servonnat, J.; Albright, A.L.; Aumont, O.; Balkanski, Y.; Bastrikov, V.; Bekki, S.; Bonnet, R.; Bony, S.; Bopp, L.; et al. Presentation and evaluation of the IPSL-CM6A-LR climate model. J. Adv. Model. Earth Syst. 2020, 12, e2019MS002010. [Google Scholar] [CrossRef]
  72. Gutjahr, O.; Putrasahan, D.; Lohmann, K.; Jungclaus, J.H.; von Storch, J.-S.; Brüggemann, N.; Haak, H.; Stössel, A. Max Planck Institute Earth System Model (MPI-ESM1.2) for the High-Resolution Model Intercomparison Project (HighResMIP). Geosci. Model Dev. 2019, 12, 3241–3281. [Google Scholar] [CrossRef]
  73. Yukimoto, S.; Kawai, H.; Koshiro, T.; Oshima, N.; Yoshida, K.; Urakawa, S.; Tsujino, H.; Deushi, M.; Tanaka, T.; Hosaka, M.; et al. The Meteorological Research Institute Earth System Model version 2.0, MRI-ESM2.0: Description and basic evaluation of the physical component. J. Meteorol. Soc. Jpn. Ser. II 2019, 97, 931–965. [Google Scholar] [CrossRef]
  74. Sellar, A.A.; Jones, C.G.; Mulcahy, J.P.; Tang, Y.; Yool, A.; Wiltshire, A.; O’connor, F.M.; Stringer, M.; Hill, R.; Palmieri, J.; et al. UKESM1: Description and evaluation of the UK Earth System Model. J. Adv. Model. Earth Syst. 2019, 11, 4513–4558. [Google Scholar] [CrossRef]
  75. Thapa, A.; Wu, R.; Hu, Y.; Nie, Y.; Singh, P.B.; Khatiwada, J.R.; Yan, L.; Gu, X.; Wei, F. Predicting the potential distribution of the endangered red panda across its entire range using MaxEnt modeling. Ecol. Evol. 2018, 8, 10542–10554. [Google Scholar] [CrossRef] [PubMed]
  76. Shaban, M.; Ghehsareh Ardestani, E.; Ebrahimi, A.; Borhani, M. Climate change impacts on optimal habitat of Stachys inflata medicinal plant in central Iran. Sci. Rep. 2023, 13, 6580. [Google Scholar] [CrossRef] [PubMed]
  77. Bowen, A.K.M.; Stevens, M.H.H. Temperature, topography, soil characteristics, and NDVI drive habitat preferences of a shade-tolerant invasive grass. Ecol. Evol. 2020, 10, 10785–10797. [Google Scholar] [CrossRef] [PubMed]
  78. Jarnevich, C.S.; Reynolds, L.V. Challenges of predicting the potential distribution of a slow-spreading invader: A habitat suitability map for an invasive riparian tree. Biol. Invasions 2011, 13, 153–163. [Google Scholar] [CrossRef]
  79. Wei, B.O.; Wang, R.; Hou, K.; Wang, X.; Wu, W. Predicting the current and future cultivation regions of Carthamus tinctorius L. using MaxEnt model under climate change in China. Glob. Ecol. Conserv. 2018, 16, e00477. [Google Scholar] [CrossRef]
  80. Tesfamariam, B.G.; Gessesse, B.; Melgani, F. MaxEnt-based modeling of suitable habitat for rehabilitation of Podocarpus forest at landscape-scale. Environ. Syst. Res. 2022, 11, 4. [Google Scholar] [CrossRef]
  81. Mahato, R.; Abujam, S.; Bushi, D.; Dai Nimasow, O.; Nimasow, G.; Das, D.N. Distribution modelling of Tor putitora (Hamilton, 1822), an endangered cyprinid in the Himalayan river system using MaxEnt. Acta Ecol. Sin. 2023, 43, 343–351. [Google Scholar] [CrossRef]
  82. Li, Y.; Li, M.; Li, C.; Liu, Z. Optimized maxent model predictions of climate change impacts on the suitable distribution of Cunninghamia lanceolata in China. Forests 2020, 11, 302. [Google Scholar] [CrossRef]
  83. Gebrewahid, Y.; Abrehe, S.; Meresa, E.; Eyasu, G.; Abay, K.; Gebreab, G.; Kidanemariam, K.; Adissu, G.; Abreha, G.; Darcha, G. Current and future predicting potential areas of Oxytenanthera abyssinica (A. Richard) using MaxEnt model under climate change in Northern Ethiopia. Ecol. Process. 2020, 9, 6. [Google Scholar] [CrossRef]
  84. Phillips, S.J. A Brief Tutorial on Maxent. 2017. Available online: http://biodiversityinformatics.amnh.org/open_source/maxent/ (accessed on 12 December 2023).
  85. Dahlsjö, C.A.; Valladares Romero, C.S.; Espinosa Iñiguez, C.I. Termite diversity in Ecuador: A comparison of two primary forest national parks. J. Insect Sci. 2020, 20, 4. [Google Scholar] [CrossRef] [PubMed]
  86. Vezza, P.; Muñoz-Mas, R.; Martinez-Capel, F.; Mouton, A. Random forests to evaluate biotic interactions in fish distribution models. Environ. Model. Softw. 2015, 67, 173–183. [Google Scholar] [CrossRef]
  87. Allouche, O.; Tsoar, A.; Kadmon, R. Assessing the accuracy of species distribution models: Prevalence, kappa and the true skill statistic (TSS). J. Appl. Ecol. 2006, 43, 1223–1232. [Google Scholar] [CrossRef]
  88. Majdi, F.; Hosseini, S.A.; Karbalaee, A.; Kaseri, M.; Marjanian, S. Future projection of precipitation and temperature changes in the Middle East and North Africa (MENA) region based on CMIP6. Theor. Appl. Climatol. 2022, 147, 1249–1262. [Google Scholar] [CrossRef]
  89. Cerdá, X.; Retana, J. Alternative strategies by thermophilic ants to cope with extreme heat: Individual versus colony level traits. Oikos 2000, 89, 155–163. [Google Scholar] [CrossRef]
  90. Perez, R.; Benbachir, M.; Decroo, C.; Mascolo, C.; Wattiez, R.; Aron, S. Cataglyphis desert ants use distinct behavioral and physiological adaptations to cope with extreme thermal conditions. J. Therm. Biol. 2023, 111, 103397. [Google Scholar] [CrossRef]
  91. Pearson, R.G. Species’ distribution modeling for conservation educators and practitioners. Synthesis. Am. Mus. Nat. Hist. 2007, 50, 54–89. [Google Scholar]
  92. Sharaf, M.R.; Collingwood, C.A.; Aldawood, A.S. Notes on the ant genus Cataglyphis Foerster, 1850 (Hymenoptera, Formicidae) in the Arabian Peninsula with description of a new species and a key to species of the C. pallida-group. ZooKeys 2015, 545, 101. [Google Scholar] [CrossRef]
  93. Paknia, O.; Pfeiffer, M. Steppe versus desert: Multi-scale spatial patterns in diversity of ant communities in Iran. Insect Conserv. Divers. 2011, 4, 297–306. [Google Scholar] [CrossRef]
  94. Mao, M.; Chen, S.; Ke, Z.; Qian, Z.; Xu, Y. Using MaxEnt to predict the potential distribution of the little fire ant (Wasmannia auropunctata) in China. Insects 2022, 13, 1008. [Google Scholar] [CrossRef] [PubMed]
  95. Saha, A.; Rahman, S.; Alam, S. Modeling current and future potential distributions of desert locust Schistocerca gregaria (Forskål) under climate change scenarios using MaxEnt. J. Asia-Pac. Biodivers. 2021, 14, 399–409. [Google Scholar] [CrossRef]
  96. Rato, C.; Silva-Rocha, I.; Sillero, N. What does the future hold for a thermophilic and widely introduced gecko, Tarentola mauritanica (Squamata: Phyllodactylidae)? Biol. Invasions 2024, 26, 1061–1074. [Google Scholar] [CrossRef]
  97. Gull, E.; Fareen, A.; Mahmood, T.; Bodlah, I.; Rashid, A.; Khalid, A.; Mahmood, S. Modeling potential distribution of newly recorded ant, Brachyponera nigrita using Maxent under climate change in Pothwar region, Pakistan. PLoS ONE 2022, 17, 0262451. [Google Scholar]
  98. Vale, C.G.; Brito, J.C. Desert-adapted species are vulnerable to climate change: Insights from the warmest region on Earth. Glob. Ecol. Conserv. 2015, 4, 369–379. [Google Scholar] [CrossRef]
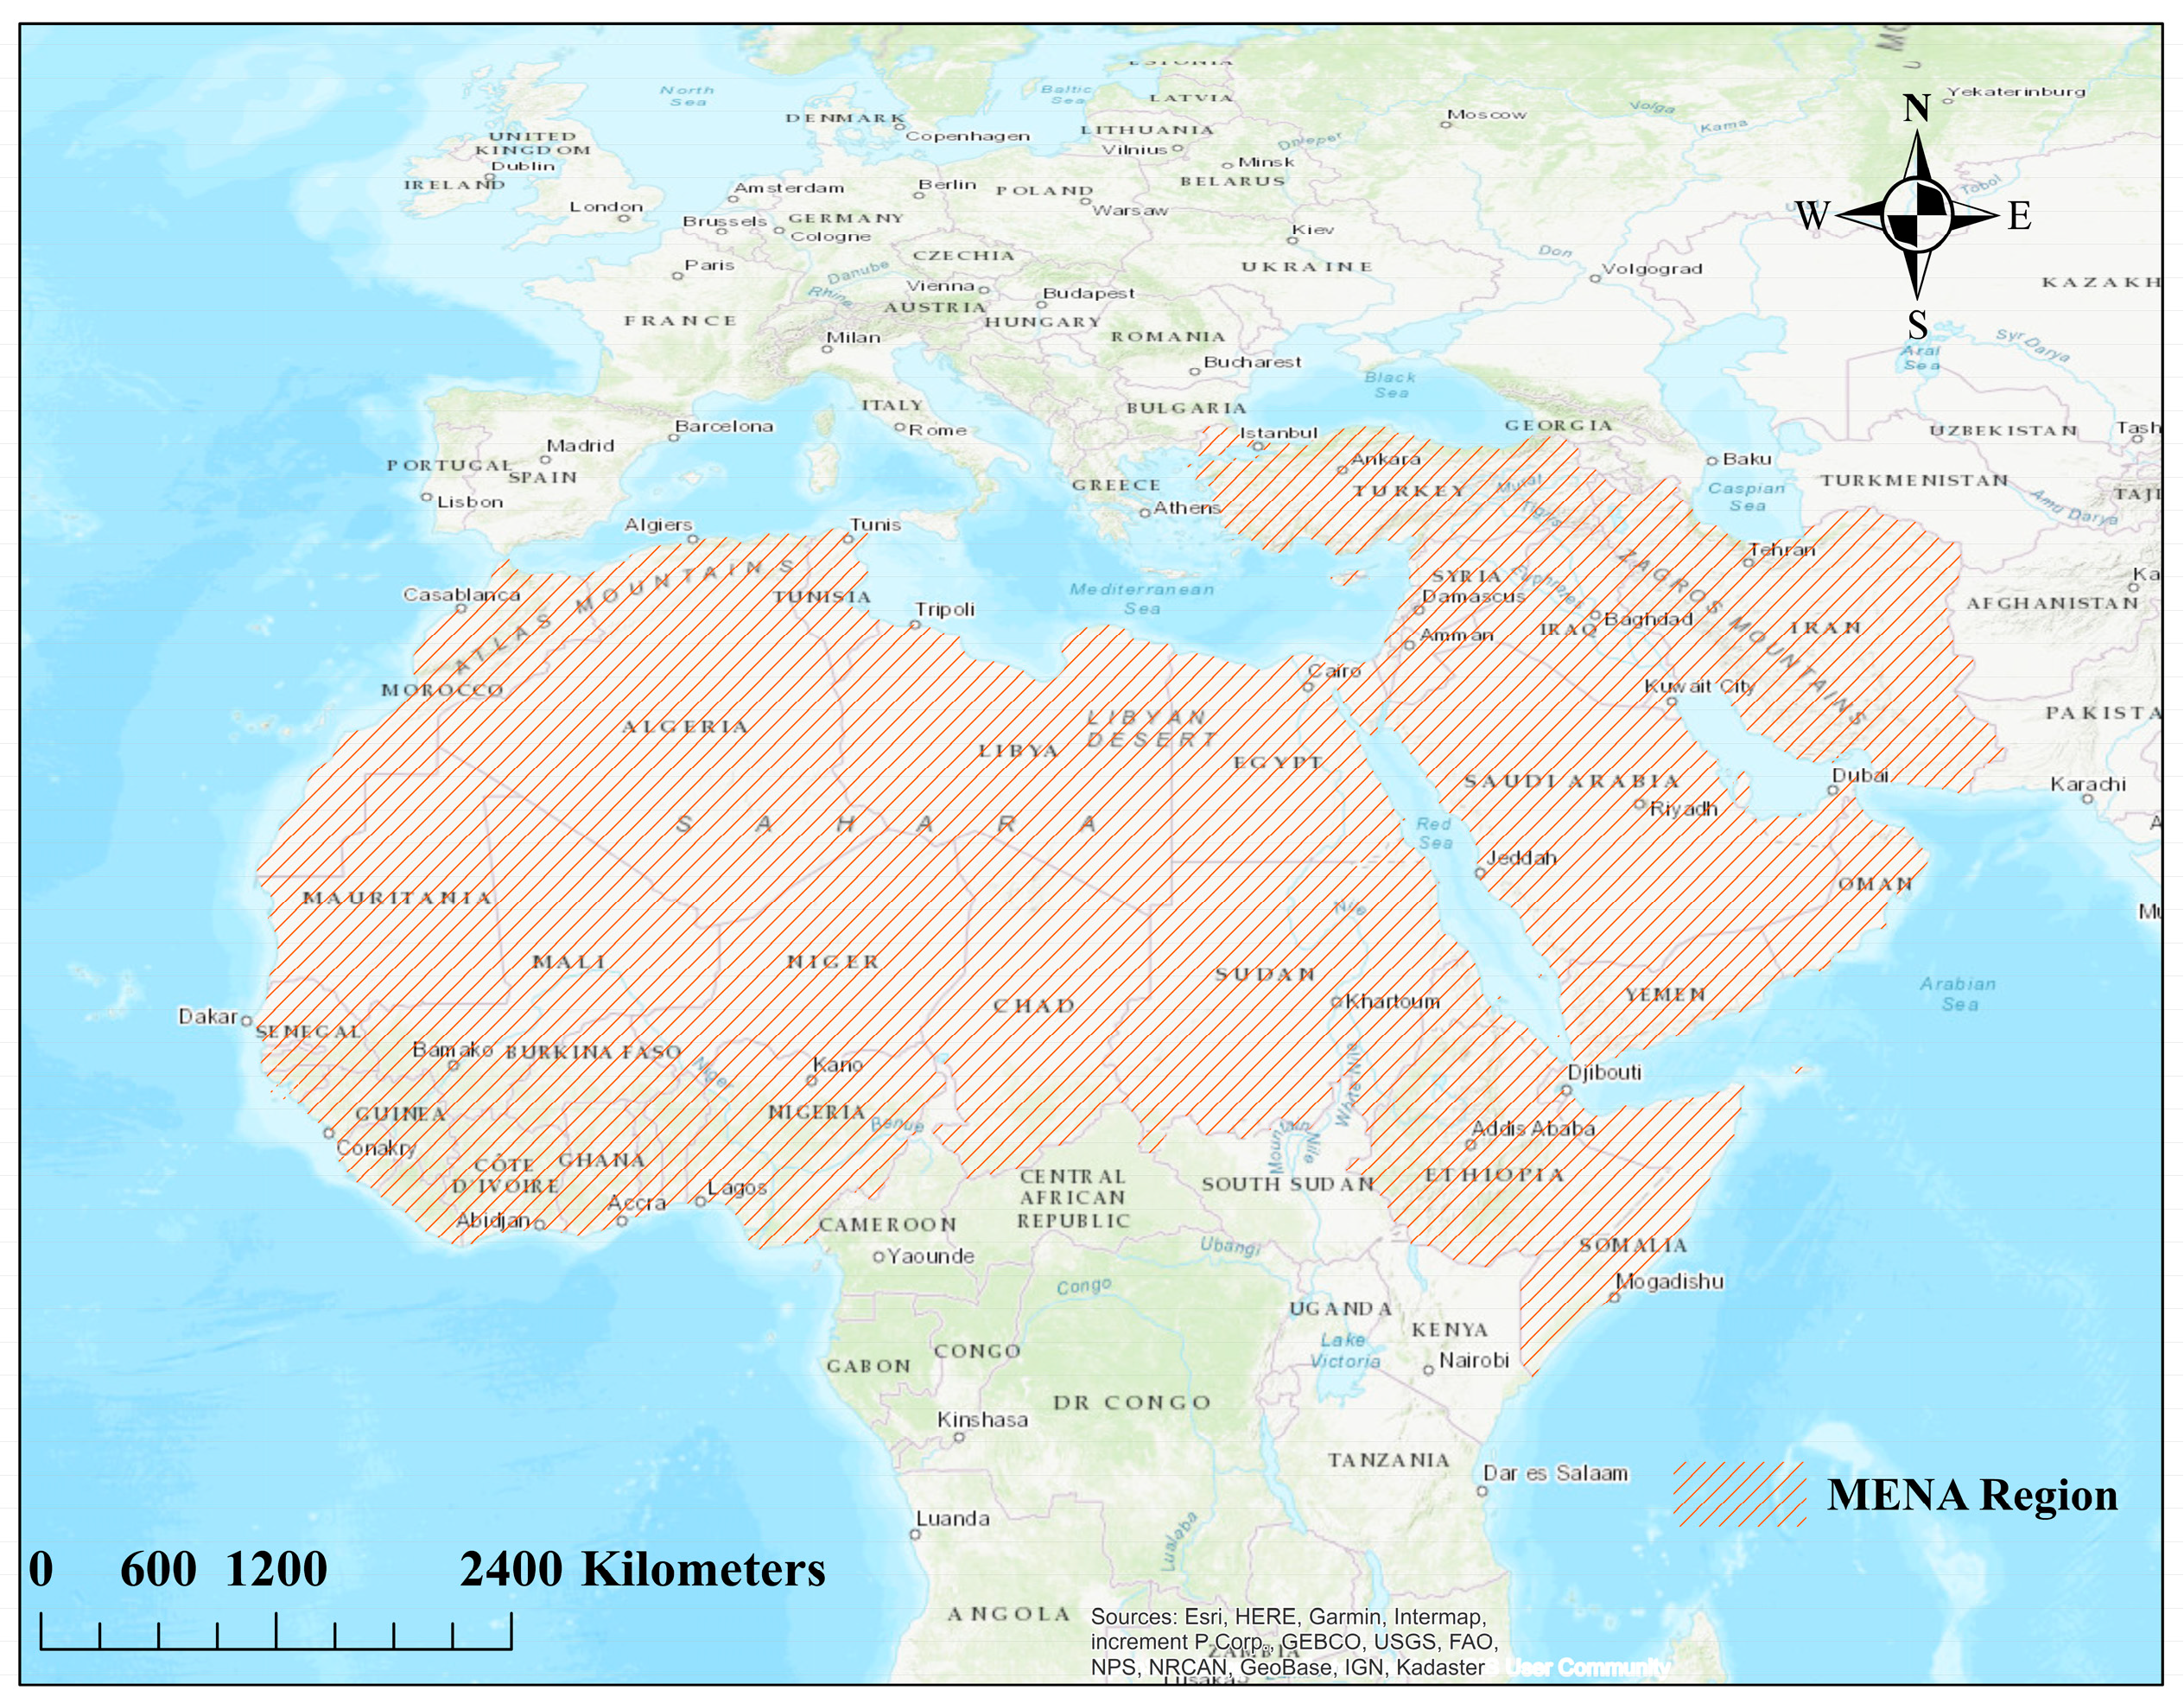
Figure 1. Study location: Middle East and North Africa (MENA) region from where the occurrence of C. nodus was selected. Topographic map sources: Esri, DigitalGlobe, GeoEye, i-cubed, USDA FSA, USGS, AEX, Getmapping, Aerogrid, IGN, IGP, swisstopo, and the GIS User Community.
Diversity 16 00563 g001
Figure 2. Annual mean temperature (AMT) change in the MENA region: (a) present AMT, (b) AMT change in the 2040s SSP 1.2.6; (c) AMT change in the 2040s SSP 3.7.0; (d) AMT change in the 2040s SSP5.8.5; (e) AMT change in the 2070s SSP 1.2.6; (f) AMT change in the 2070s SSP 3.7.0; (g) AMT change in the 2070s SSP 3.7.0 (Source of current and future AMT data: CHELSA v.2.1; [68]).
Diversity 16 00563 g002
Figure 3. Jackknife variable contribution test and model simulation accuracy: (a) the relative predictive power of environmental variables. (Without variable)—the importance of the other environmental variables when this variable is omitted; (With only variable)—the importance of the environmental variable when used in isolation; (With all variables)—the importance of all environmental variables. (b) Performance test of the distribution model created for C. nodus with its AUC value.
Diversity 16 00563 g003
Figure 4. Present potential habitat suitability (PHS) of Cataglyphis nodus, along with the occurrence records of C. nodus in the study area.
Diversity 16 00563 g004
Figure 5. Mean future potential habitat suitability of Cataglyphis nodus from the MaxEnt model simulation with respect to the selected three Shared Socioeconomic Pathways (SSPs) from five climate models for the 2040s and the 2070s.
Diversity 16 00563 g005
Figure 6. Present and future potential habitat suitability changes of Cataglyphis nodus in the MENA region: (a) SSP 1.2.6 (Green Development Path); (b) SSP 3.7.0 (Regional Competition Path); and (c) SSP 5.8.5 (High Development Path). The habitat suitability values are categorized into five groups: not suitable (0–0.2); least suitable (0.2–0.4); moderately suitable (0.4–0.6); highly suitable (0.6–0.8); and very high suitable (0.8–1).
Diversity 16 00563 g006aDiversity 16 00563 g006b
Figure 7. Uncertainty in the selected habitat suitability simulation while using five different climate models to represent three Shared Socioeconomic Pathways (SSPs).
Diversity 16 00563 g007
Table 1. Climate forcing data and sources used for the CHELSA database in the 2040s and 2070s projections.
SI No.Model NameDevelopers
1GFDLGeophysical Fluid Dynamics Laboratory Earth System Model version 4.1 [70]
2IPSLCM6Institute Pierre-Simon Laplace Climate Model [71]
3MPIESM12-HRMax Planck Institute for Meteorology Earth System Models [72]
4MRIESMMeteorological Research Institute-Earth System Model Version 2 [73]
5UKESMUK Earth System Model [74]
Table 2. Final variables used for model simulation and their contribution.
SI No.Final Variables UsedAbbreviationsContribution (%)
1ElevationELEV37.8
2Mean monthly precipitation amount of the coldest quarterBio1926.8
3Temperature seasonalityBio417.6
4Precipitation amount of the driest monthBio147.7
5Mean diurnal air temperature rangeBio24
6Nighttime land surface temperatureLSTN2.7
7Mean daily mean air temperatures of the driest quarterBio91
8Root-zone soil moistureSM1
9Mean daily mean air temperatures of the warmest quarterBio100.5
10Mean daily maximum air temperature of the warmest monthBio50.4
11Enhanced vegetation indexEVI0.3
12Precipitation seasonalityBio150.2
13Mean monthly precipitation amount of the warmest quarterBio180.1
Disclaimer/Publisher’s Note: The statements, opinions and data contained in all publications are solely those of the individual author(s) and contributor(s) and not of MDPI and/or the editor(s). MDPI and/or the editor(s) disclaim responsibility for any injury to people or property resulting from any ideas, methods, instructions or products referred to in the content.