Abstract
The Chinese government has undertaken a significant forest restoration project, leading to a notable increase in forested areas. Despite this achievement, there is uncertainty regarding its impact on wildlife protection. To assess this, we utilized high-resolution remote sensing data to gather information on land use, bioclimatic conditions, geography, and human activity. This information was used to model and analyze changes in suitable habitats for Chinese endemic brown-eared pheasants over the past 30 years to determine the effects of the forest restoration project on wildlife habitats. Our analysis revealed that although the suitable habitat area for the brown-eared pheasant has expanded, the increased forested area did not influence their distribution. Our study also found that increasing elevation and decreasing grassland area in landscape patches promoted the distribution of brown-eared pheasants. Furthermore, the annual variation of the min temperature of coldest month and annual precipitation is an important factor affecting the suitable habitat distribution of brown-eared pheasants. Research showed that the suitable habitat of brown-eared pheasant is seriously fragmented, and the connectivity between habitats should be strengthened in the future. Based on our findings, we believe that existing forest restoration project policies cannot effectively protect wildlife due to neglecting key environmental factors at the landscape scale. Therefore, we recommend developing refined land use management policies at the landscape level to guide future ecological protection and biodiversity conservation. These findings significantly affect policy and future research on wildlife protection and forest restoration.
1. Introduction
Rapid loss of biodiversity, large-scale decline in ecosystem services, dramatic climate change, severe natural disasters, and land use (or land cover) caused by human interference have led to global action to strengthen land use management policies [1]. Human-induced changes in land use and land cover have been widely considered the leading cause of habitat quality degradation [2]. The increase in agricultural land and the development of natural resources have significantly impacted biodiversity and ecosystem functions worldwide [3].
The Chinese government has tried to reverse the decline in biodiversity and ecosystem function and has implemented the policy of returning farmland to forests since 1999 [4]. During the last two decades, the continuous construction of forest restoration projects has led to a significant increase in forest area [4]. However, the precise impact of policy implementation on biodiversity needs to be further analyzed. Understanding and monitoring the distribution and dynamics of land use types is essential for environmental research. In particular, the latest ecological and environmental information is necessary for governments, non-governmental organizations, and other stakeholders to help formulate and implement sustainable and effective environmental policies [5]. It is necessary to continuously optimize and deepen land use management policies to realize the short-term or long-term goals proposed by the Post-2020 Global Biodiversity Framework [6]. Quantifying the protective effect of land use policy on endangered species or focus species can be used as a clear indicator to evaluate the implementation effect of land use policy and formulate refined and effective policies.
The brown-eared pheasant (Crossoptilon mantchuricum) is a terrestrial bird found only in China, with a small population [7]. The brown-eared pheasant was most recently assessed on the IUCN red list of threatened species in 2016 and evaluated as Vulnerable on the list updated in 2024 (https://www.iucnredlist.org). Its distribution area is narrow. Currently, it is distributed mainly in the mountains of Lyuliang Mountain in Shanxi Province, Huanglong Mountain in Shaanxi Province, Xiaowutai Mountain in Hebei Province, and Dongling Mountain in Beijing [7]. The brown-eared pheasant distribution area is one of the key areas for restoring farmland to forests and ecological restoration in China. Based on the rarity of the species and the distribution area, the change in the distribution of suitable brown-eared pheasant habitat can be used as a critical indicator to assess whether the current forest restoration project has a positive effect on wildlife protection. The brown-eared pheasant mainly inhabits forest ecosystems at an elevation of 1000~2600 m, and its suitable habitat is significantly affected by food, shelter, and water sources [8]. Although much research has been conducted on the suitable habitat selection and population distribution of this species, there is still a lack of a comprehensive assessment of the overall distribution area.
Remote sensing data can be used to model and analyze suitable habitats on different scales, so it has been widely used to evaluate the distribution of suitable habitats for wildlife [9]. High-precision remote sensing products (such as elevation, average temperature, land use, etc.) have been successfully applied to study a suitable habitat distribution of species on different research scales, thus accelerating the study of habitat management of species on the landscape scale [10]. Long-term high-precision land use data provide us with the ability to verify land management policies and also enable us to accurately predict the suitable habitat distribution of wildlife in different periods [11]. At the same time, considering historical climate data, human footprint, and night lamp variables can more accurately quantify the impact of environmental variables on wildlife [12,13]. The Maximum Entropy Algorithm (MaxEnt) is the most widely used method in the study of species distribution models, and its results have been proven to be reliable [14]. Since the MaxEnt model can simplify the complex relationship between species and variables, it can also obtain more robust results when predicting small sample size data [15].
This study collected existing brown-eared pheasant occurrence sites to determine its complete distribution area. Based on high-precision remote sensing data on land use, historical climate, and human activities in the last 30 years, the suitable habitat distribution of brown-eared pheasants was modeled and analyzed in different years. We try to reveal whether the current forest restoration project and land use policy positively impact the distribution of suitable habitats for brown-eared pheasants. Then, we analyze the key variables that are crucial to the distribution of suitable habitats for brown-eared pheasants. Finally, the suitable habitat distribution of brown-eared pheasants was comprehensively evaluated for the first time, and suggestions for corridor construction were given. The hypothesis of this study is as follows: (1) the expansion of forest area on its own does not lead to the enlargement of suitable habitat for the brown-eared pheasant; it is essential to consider additional factors to promote the expansion of their habitat; (2) additionally, at the landscape scale, critical environmental factors, including temperature and precipitation, significantly impact the suitability of the brown-eared pheasant’s habitat. These factors play a crucial role in determining the general suitability of the habitat for the brown-eared pheasant.
2. Materials and Methods
2.1. Study Area
The study area includes the currently known brown-eared pheasant distribution provinces (108°~119° E, 35°~43° N). The study covers all areas of Shanxi Province and some areas such as Shaanxi, Inner Mongolia, Hebei, and Liaoning. The analysis area of this study is 533,590 km2 (Figure 1). The study area exhibits a temperate monsoon climate characterized by concentrated precipitation during the summer months. It is distinguished by hot summers, cold winters, and four distinct seasons. The annual average temperature is about 8~13 °C, and the annual precipitation is about 450~1100 mm [16]. Vegetation cover in the study area shows an overall growth trend. However, soil erosion and desertification in the study area is still severe [17]. Given that the climate in the study area tends to be warm and dry for a long time, the relationship between the change in vegetation and the change in precipitation in North China is more closely related to the change in temperature, indicating that the change in vegetation cover is greatly affected by precipitation. North China is one of the regions with a high population density in China, so the vegetation cover is also greatly affected by human activities [18].
Figure 1.
Study area and brown pheasant occurrence point.
2.2. Data Source
2.2.1. Brown Pheasant Occurrence Point
At each of the brown-eared pheasant occurrence points, we make a log on the eBird website (ebird.org/home), with a search of the Latin name of the brown-eared pheasant. Then, we download all the data for the point and perform a subsequent screening. eBird is an online database for observing birds. It was established by the Cornell University Bird Research Laboratory and the Audubon Society in 2002. However, there have been doubts about using citizen data for analysis [19]. The eBird data have been considered relatively reliable for analyzing suitable bird habitats [20]. We searched for relevant news reports published in the past ten years to collect more comprehensive occurrences. We confirmed the GPS points reported on Google Maps as Supplementary Information on occurrences.
2.2.2. Sources of Environmental Variables
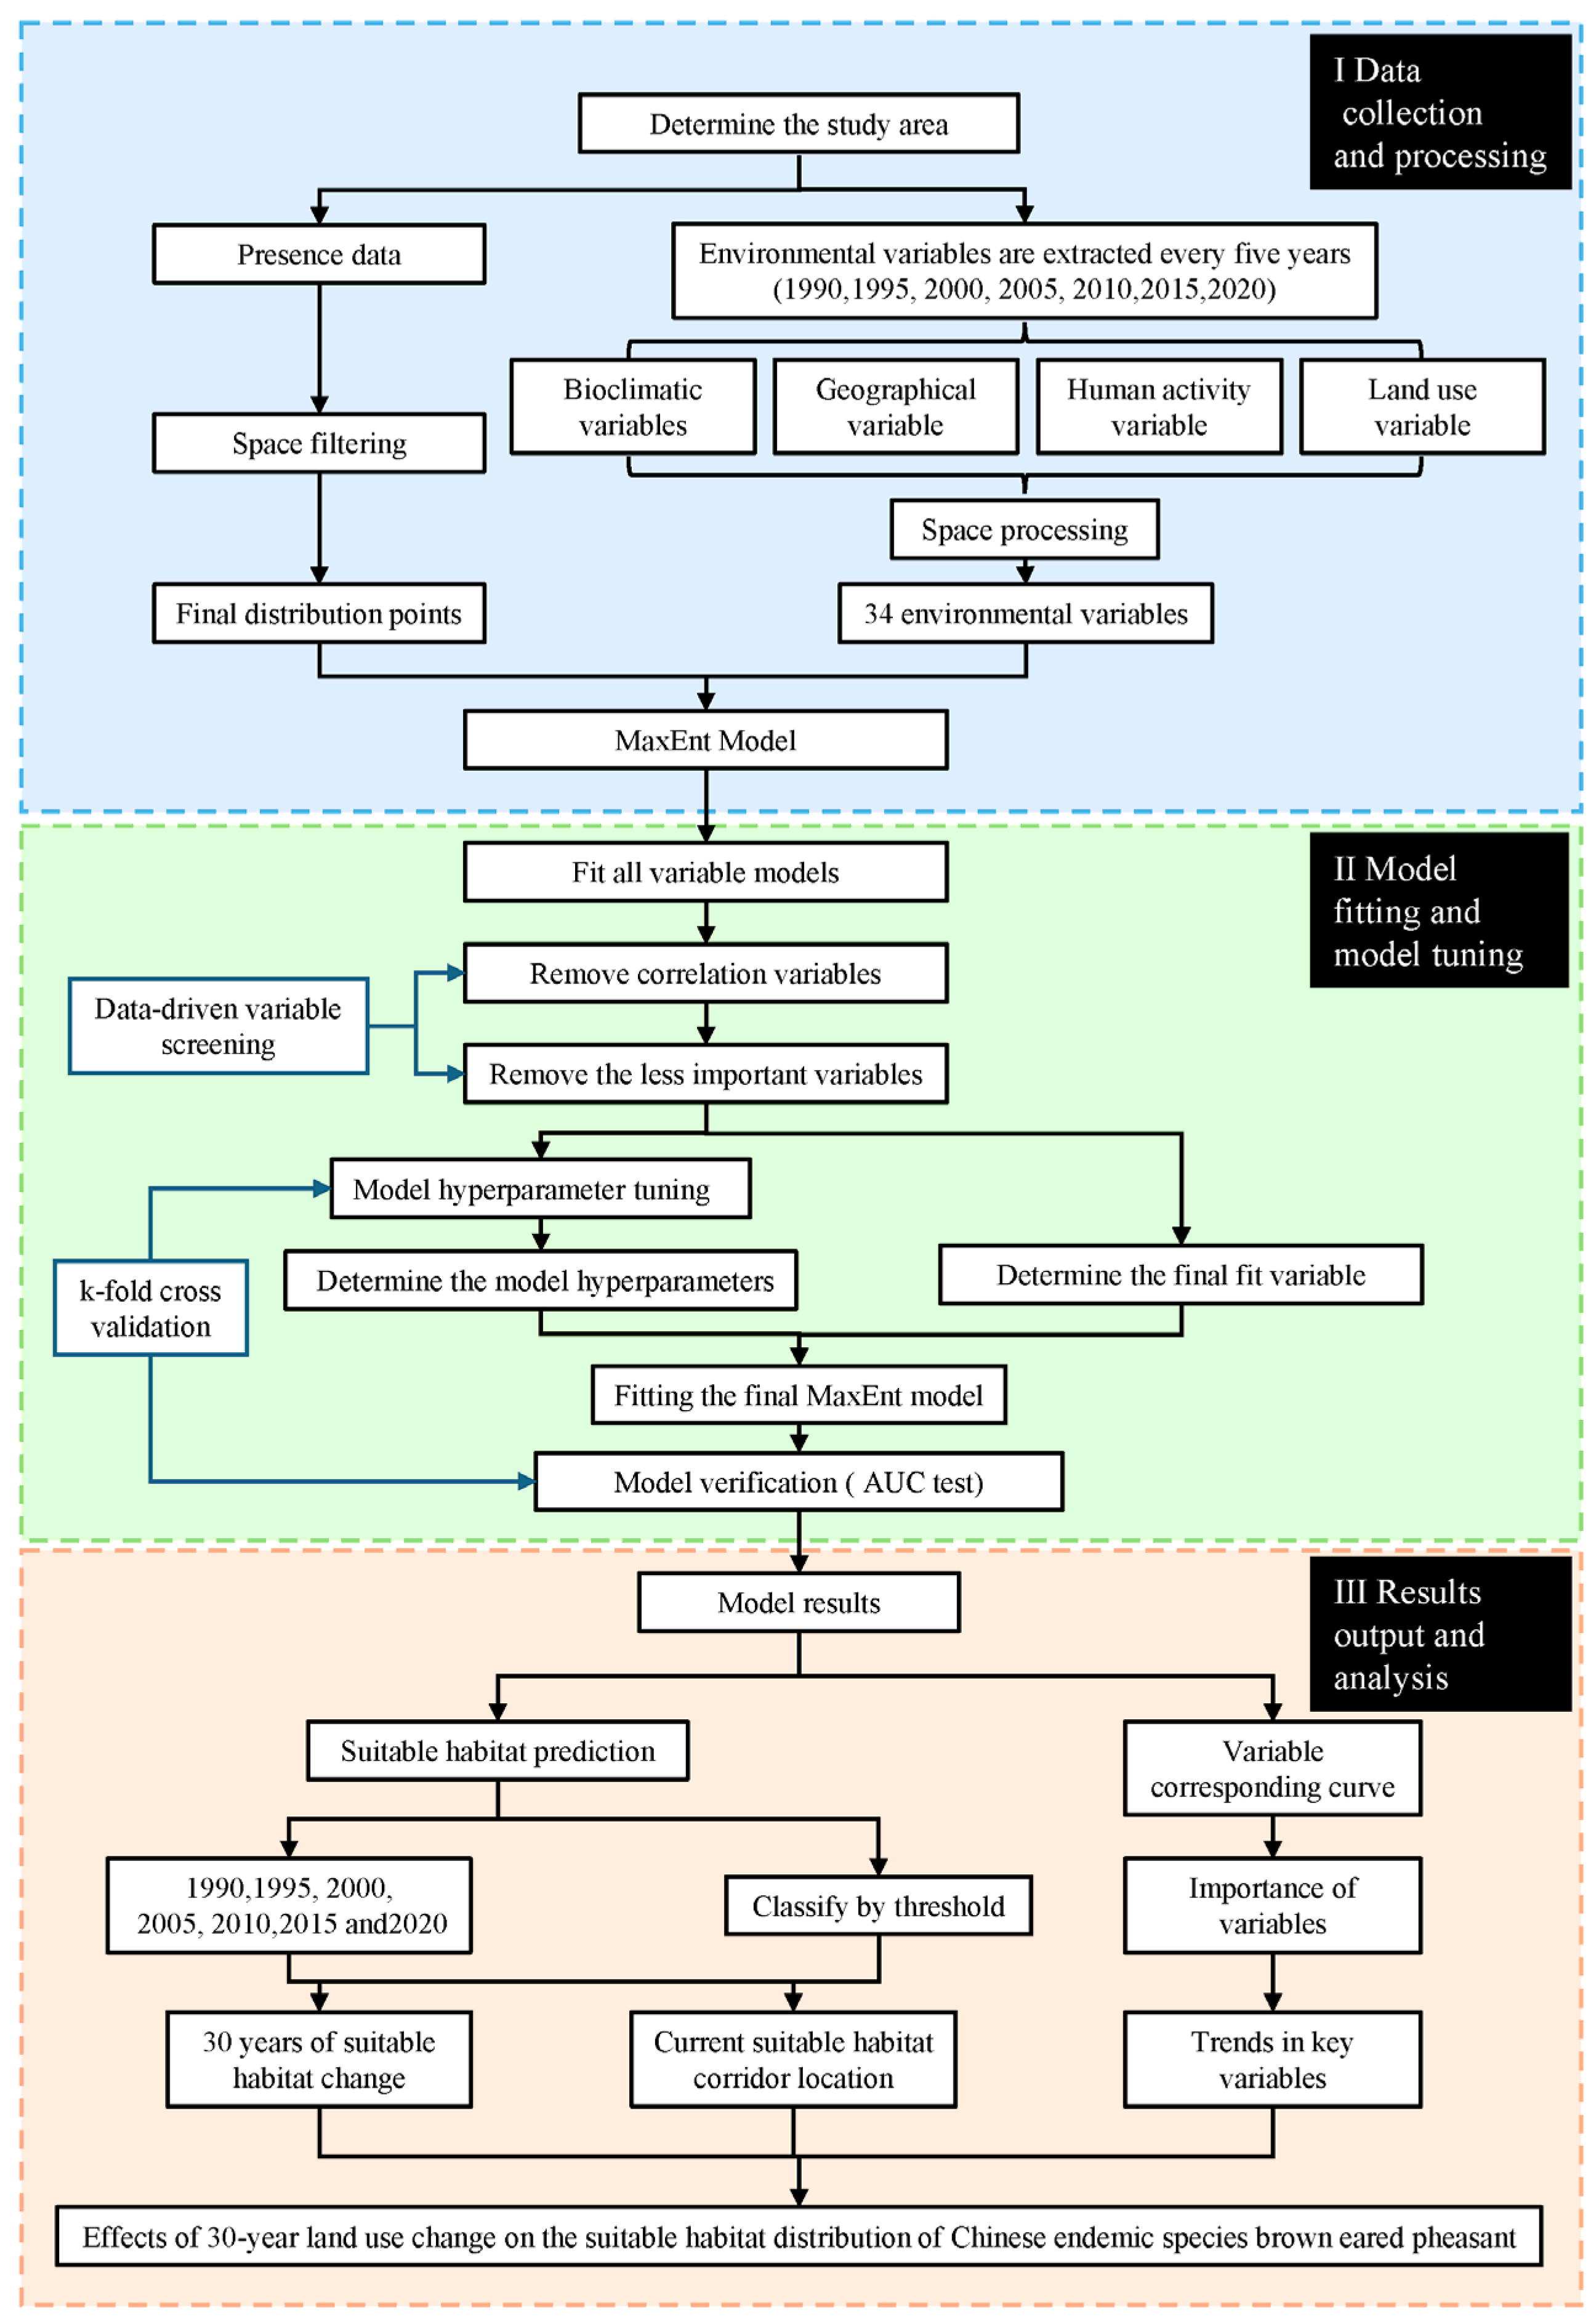
In this study, 34 variables were selected from four major groups (Table 1). Land use and bioclimatic variables were used for seven years with data, distributed every five years in 1990, 1995, 2000, 2005, 2010, 2015, and 2020. Bioclimatic variables are calculated with monthly precipitation, min temperature, and maximum temperature variables, which will be more biologically significant [21]. The 30 m annual land cover datasets were used for land use data [22]. These data are derived from Landsat images on an open platform to construct China’s first land use product based on Landsat images in 1985 and 2022. These data allow us to quickly quantify China’s land use changes in the past 30 years. The night light data are also derived from the data from these seven years. For the human footprint data, because the data source is only nearly 20 years old, only feature five years of data from 2000, 2005, 2010, 2015, and 2020. We believe that elevation data will stay the same over time, so we use higher precision and newer elevation data and use ArcGIS software to calculate other geographic variables based on elevation data [23].
Table 1.
Variable description for species distribution model analysis.
2.3. Methodologies
Our research framework is divided into data collection and processing, model fitting and tuning, and output and analysis of results (Figure 2). First, the required data are collected, and the necessary screening and resampling are performed to meet the research needs of this study. Then, the species distribution model for each year was established, and the model’s accuracy was optimized to obtain an accurate, suitable habitat distribution. Based on the analysis of the relationship between the suitable habitat and environmental variables in each year, the influence of the variables on the suitable habitat of the brown-eared pheasant was clarified. Finally, we identified critical corridors between the habitats of brown-eared pheasants to clarify current protection needs. This study applied ArcGIS Pro 3.2.2 and R-Programming (version 4.2.1) to all data extraction, modeling analysis, and mapping.
Figure 2.
The research framework.
2.3.1. Data Processing
Based on the range of population activities of the brown-eared pheasant and the size of the study area, we divided the study area into 5 km × 5 km grids and took 25 km2 as the landscape scale of this study [24,25]. According to this landscape scale, 34 environmental variables collected in Table 1 were resampled in a 5 km × 5 km grid layer for subsequent modeling analysis. We assess the suitability of each grid for the distribution of brown-eared pheasants based on their habitat preferences. We then filter the eBird data to remove any incorrect information (such as data from urban areas). Lastly, we retain only one data point per grid to avoid overly focusing on environmental factors in specific areas [26].
2.3.2. Modeling Analysis and Model Tuning
We use the dismo package (version 1.3.14) in the R software to establish the MaxEnt model [27]. We use the SDMtune (version 1.3.1) package in the R software for variable selection and model tuning [28]. The same research process was performed for each year’s species distribution model fitting.
First, the correlation coefficient between the variables is tested, and the variables are selected according to the contribution of the variables to the model [28]. When there is collinearity between multiple variables, only the variables with the highest contribution to the model are retained until the correlation coefficients between the variables involved in the modeling are less than 0.8 [29]. To avoid overfitting and simplifying the model, we use variables to perform further variable selection work on the vital indicator of the importance of the model and screen all variables with a relative contribution of less than 5% while ensuring the accuracy of the model [28]. The value of the area under the curve (AUC) showed significant advantages in the evaluation of SDM. We used the average AUC value after k-fold cross-validation as the test AUC to evaluate the precision of the model [28]. The AUC value range is 0.5~1, and the maximum value of 1 represents the most accurate model in theory [26].
After determining the final variable type involved in the final modeling, the MaxEnt model needs to tune the hyperparameters to fit the model accurately. The hyperparameters of the MaxEnt model include the combination of characteristics, the regularization multiplier, and the number of iterations [26]. The combination of features is selected from all permutations and combinations of l (linear features), t (threshold features), q (quadratic features), p (product features), and h (hinge features). The regularization multiplier was selected as 0.1~4, and the number of iterations was selected as 100~3000. Similarly, we use the AUC test after k-fold cross-validation to test the accuracy of the model and use the combination of hyperparameters with the most significant AUC to fit the final model [28].
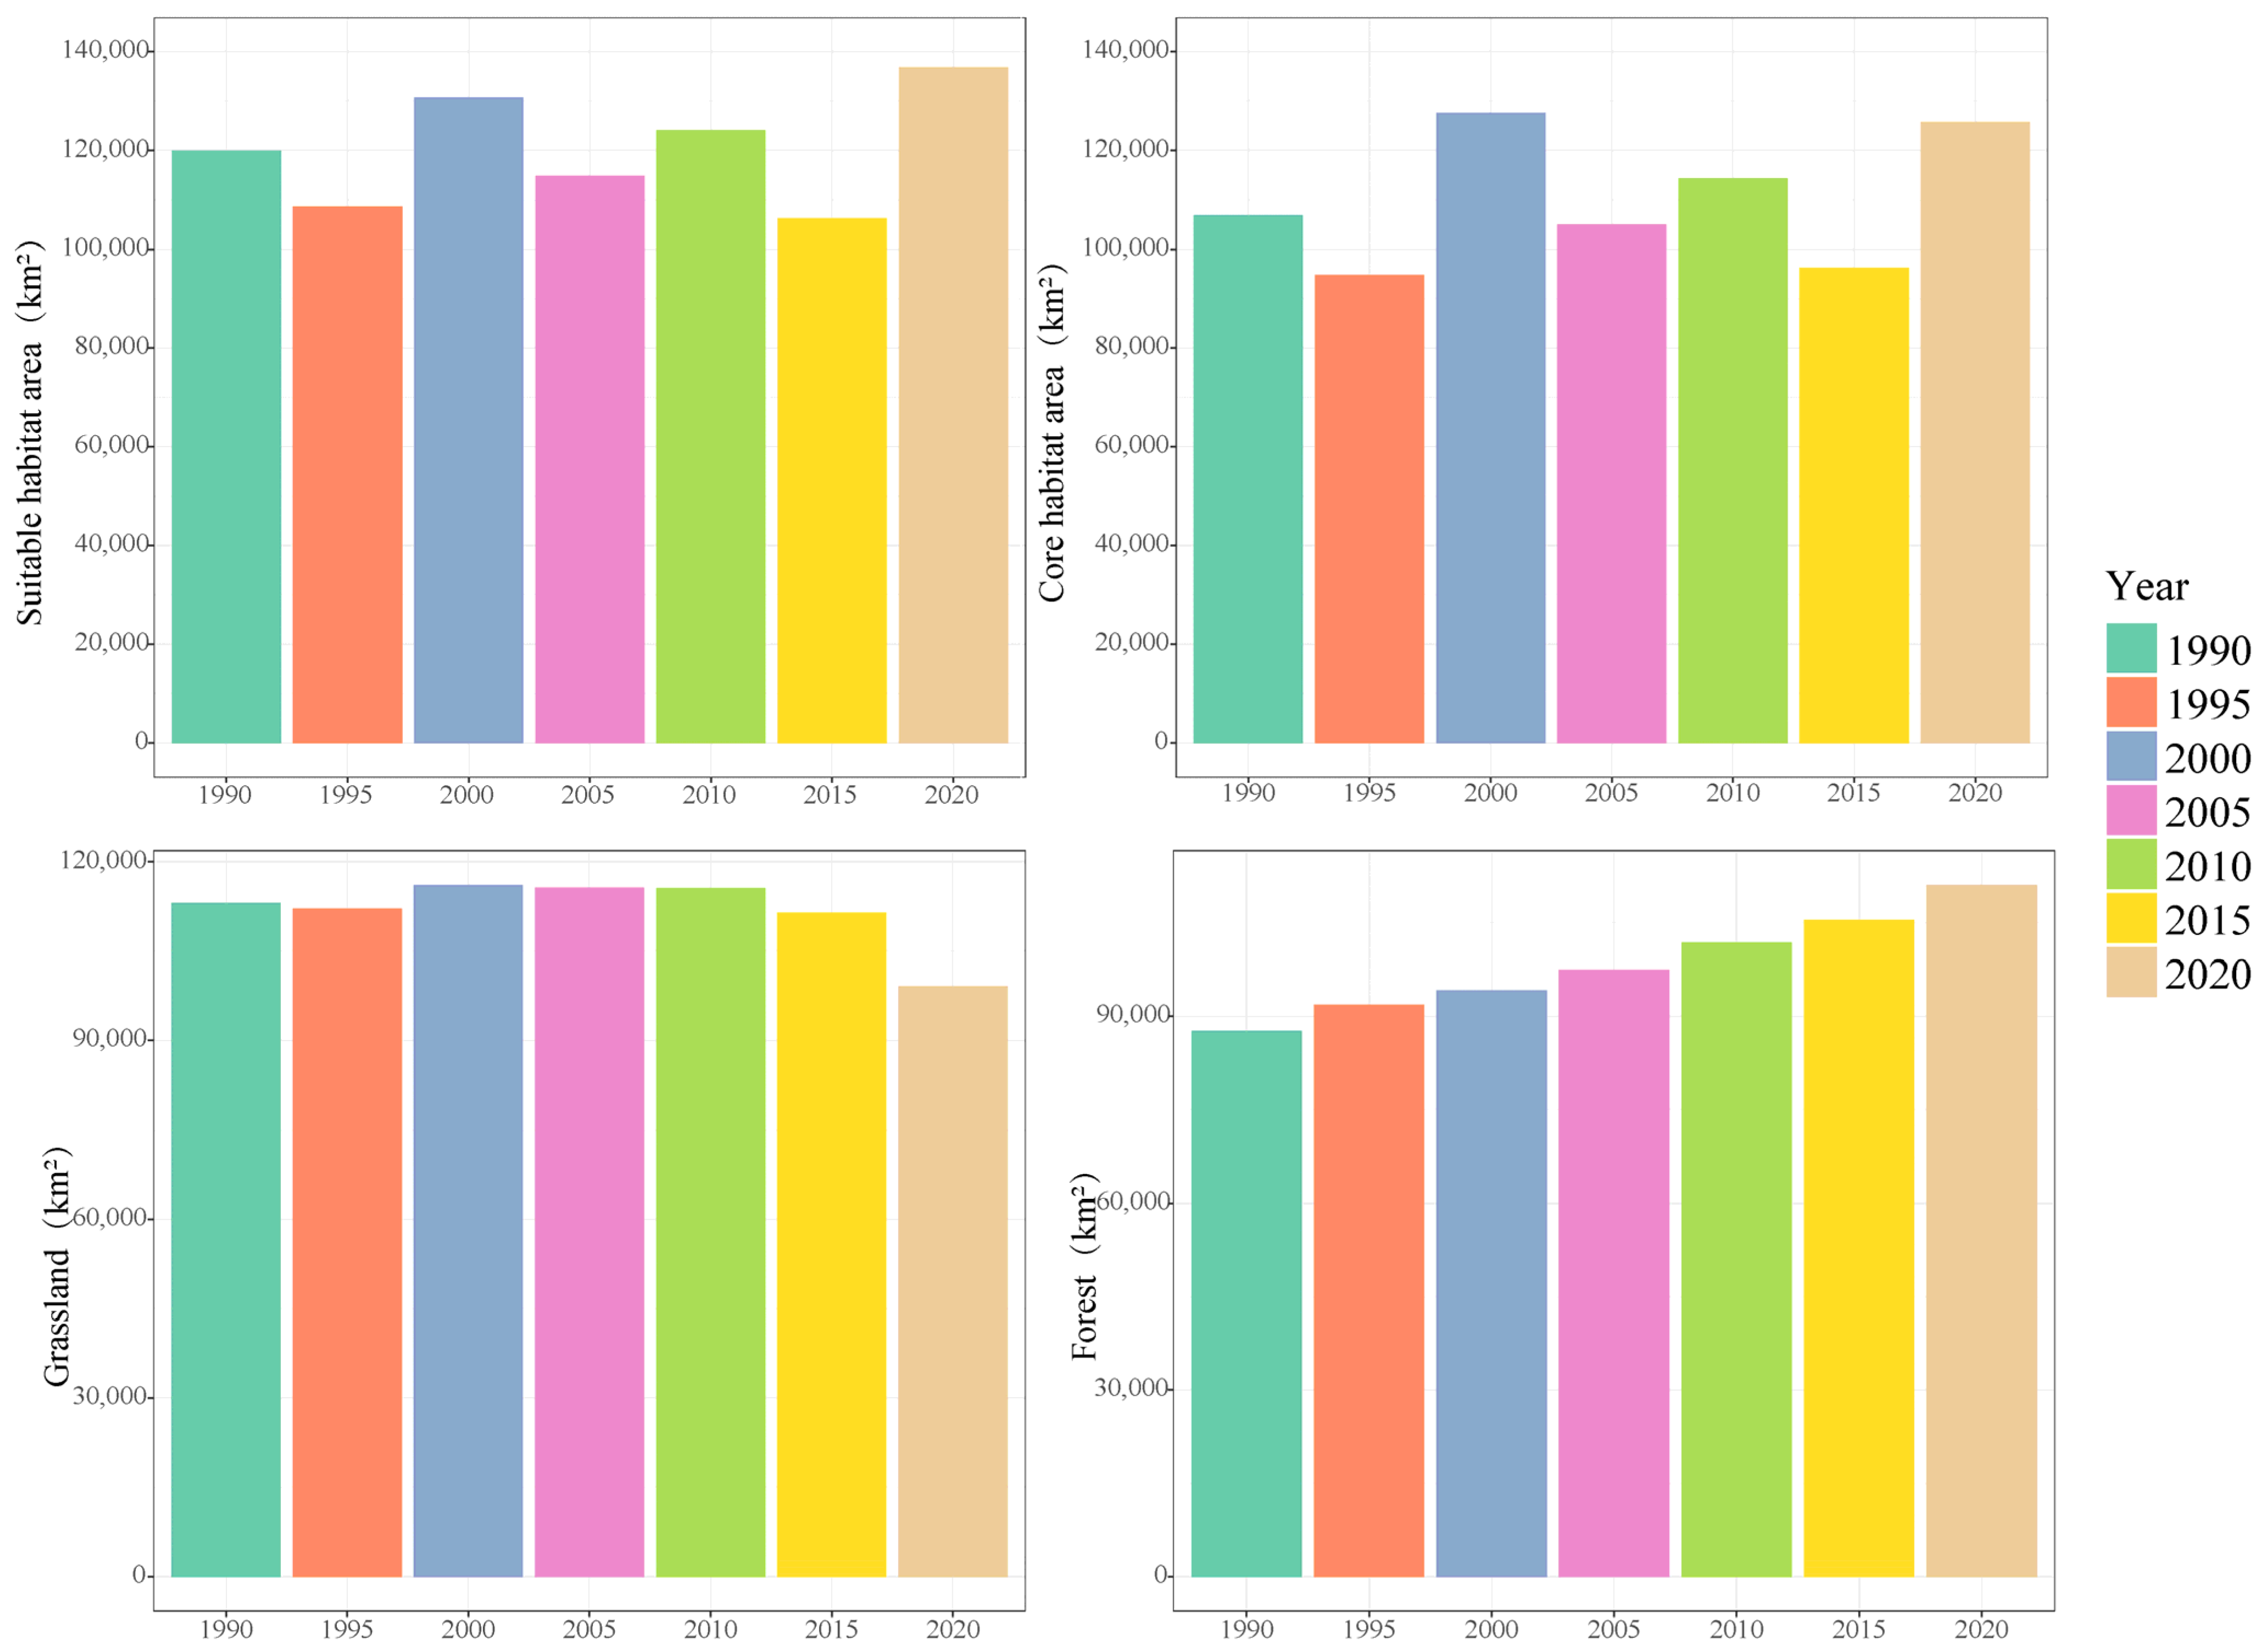
2.3.3. Analysis of the Influence of Suitable Habitat Distribution
We use equal training sensitivity and specificity as the threshold for model prediction. The suitable habitat patch identified for the brown-eared pheasant encompasses the area where the prediction result exceeds this threshold [29]. The suitable area predicted by the model is transformed into the surface layer in ArcGIS Pro, and the area of each patch is calculated [30]. Considering the size of the suitable distribution area and whether there is a brown-eared pheasant distribution record, we identified an area greater than 100 km2 with a brown-eared pheasant distribution as the core habitat for the brown-eared pheasant distribution [31]. We map the habitat suitability distribution map of brown-eared pheasants in different years to spatially evaluate the distribution changes of brown-eared pheasant habitat in the past 30 years. Next, we counted the changes in the suitable habitat and the core suitable habitat area of the brown-eared pheasant in the last three decades, as well as the changes in grassland and forest area in the study area to assess whether changes in land use have an impact on the distribution of suitable habitat for the brown-eared pheasant [29].
On the other hand, to evaluate which environmental variables impact the distribution of suitable habitats for brown-eared pheasants, the model results of the importance of environmental variables were drawn each year [28]. The jackknife method is a common and effective method to analyze the reliability of the established model [26]. Therefore, we used this method to draw the test chart and analyze the importance of different environmental variables in the species distribution for each year [28]. Then, we plotted the response curves of different variables in different years to the habitat suitability of brown-eared pheasants to clarify the response interval of the suitable habitat distribution of brown-eared pheasants to each variable [28].
Finally, we will determine how environmental variables impact the distribution of brown-eared pheasants at a specific landscape level. We rigorously tested the distribution of environmental variables on the landscape scale of each year in the study area. We visually analyzed them to explore the changes that affect the distribution of suitable habitat patches on the landscape scale. Consequently, we will determine the key variables that cause changes in suitable habitats for brown-eared pheasants [29].
2.3.4. Corridor Analysis
We applied the min resistance model to identify the core corridors between the suitable habitats of brown-eared pheasants. We use Linkage Mapper 3.1.0. (https://linkagemapper.org, accessed on 10 February 2024) for a minimal-cost path simulation and habitat corridor extraction. The appropriate habitat patches and resistance layers must be entered according to the software requirements. Suitable habitat patches use the results of the MaxEnt model output for 2020 in this study. We use the reciprocal of the habitat suitability index as the friction layer to avoid subjective opinions from experts, which has been shown to be feasible in previous studies [24]. The predicted results of the species distribution model served as the suitable habitat index, integrating the effects of all environmental variables on the suitable habitat for the brown-eared pheasant. The reciprocal of the suitable habitat index indicates that higher values correspond to lower distribution probabilities for the brown-eared pheasant, highlighting its reliability as an indicator of the resistance layer [32]. We hope to further clarify the need for brown-eared pheasant protection by analyzing the current suitable habitat corridor construction to better guide the construction of the protection project for this species.
3. Results
3.1. Modeling Results and Model Evaluation
In this study, a total of 424 brown-eared pheasant occurrence sites with clear coordinate information were collected. After spatial deduplication, 153 sites were obtained for subsequent analysis of species distribution modeling (Figure 1, Table S1). The final annual accuracy index of the AUC of the fitting model is 0.77~0.80, so the effect of the model fitting is good (Table 2). Each year’s model hyperparameter combinations are primarily multi-type feature combinations. There is a particular difference between the regularization multiplier and the number of iterations, indicating the importance of hyperparameter tuning (Table 2).
Table 2.
Fitting parameters of the species distribution model.
The total number of variables involved in the final fitting model of each year is at least four (2000), and the largest number of variables for a fitting model is nine (1995) (Figure 3). The importance of a single variable to the model is about 5~30% (Figure 3). Among the variables used in the fitting model of each year, the grassland and the min temperature of the coldest month were included in the model most frequently (seven times), followed by annual precipitation and elevation (five times) (Figure 3). It can be seen that changes in land use, temperature, and precipitation significantly affect the suitable habitat of brown-eared pheasants.
Figure 3.
The final model for each year uses variables and the importance of the variables.
We use the jackknife method to examine the effects of environmental variables on the distribution of suitable habitats for brown-eared pheasants (Figure 4). The four variables of grassland, the min temperature of the coldest month, annual precipitation, and elevation were the most frequently included in the final model each year, and their independent contribution to the model was higher. This further illustrates the importance of these four variables for the suitable habitat distribution of brown-eared pheasants (Figure 4).
Figure 4.
The jackknife test results indicated the relative importance of environmental factors on the distribution of the brown-eared pheasant in different years. The red dotted line represents the inclusion of all variables.
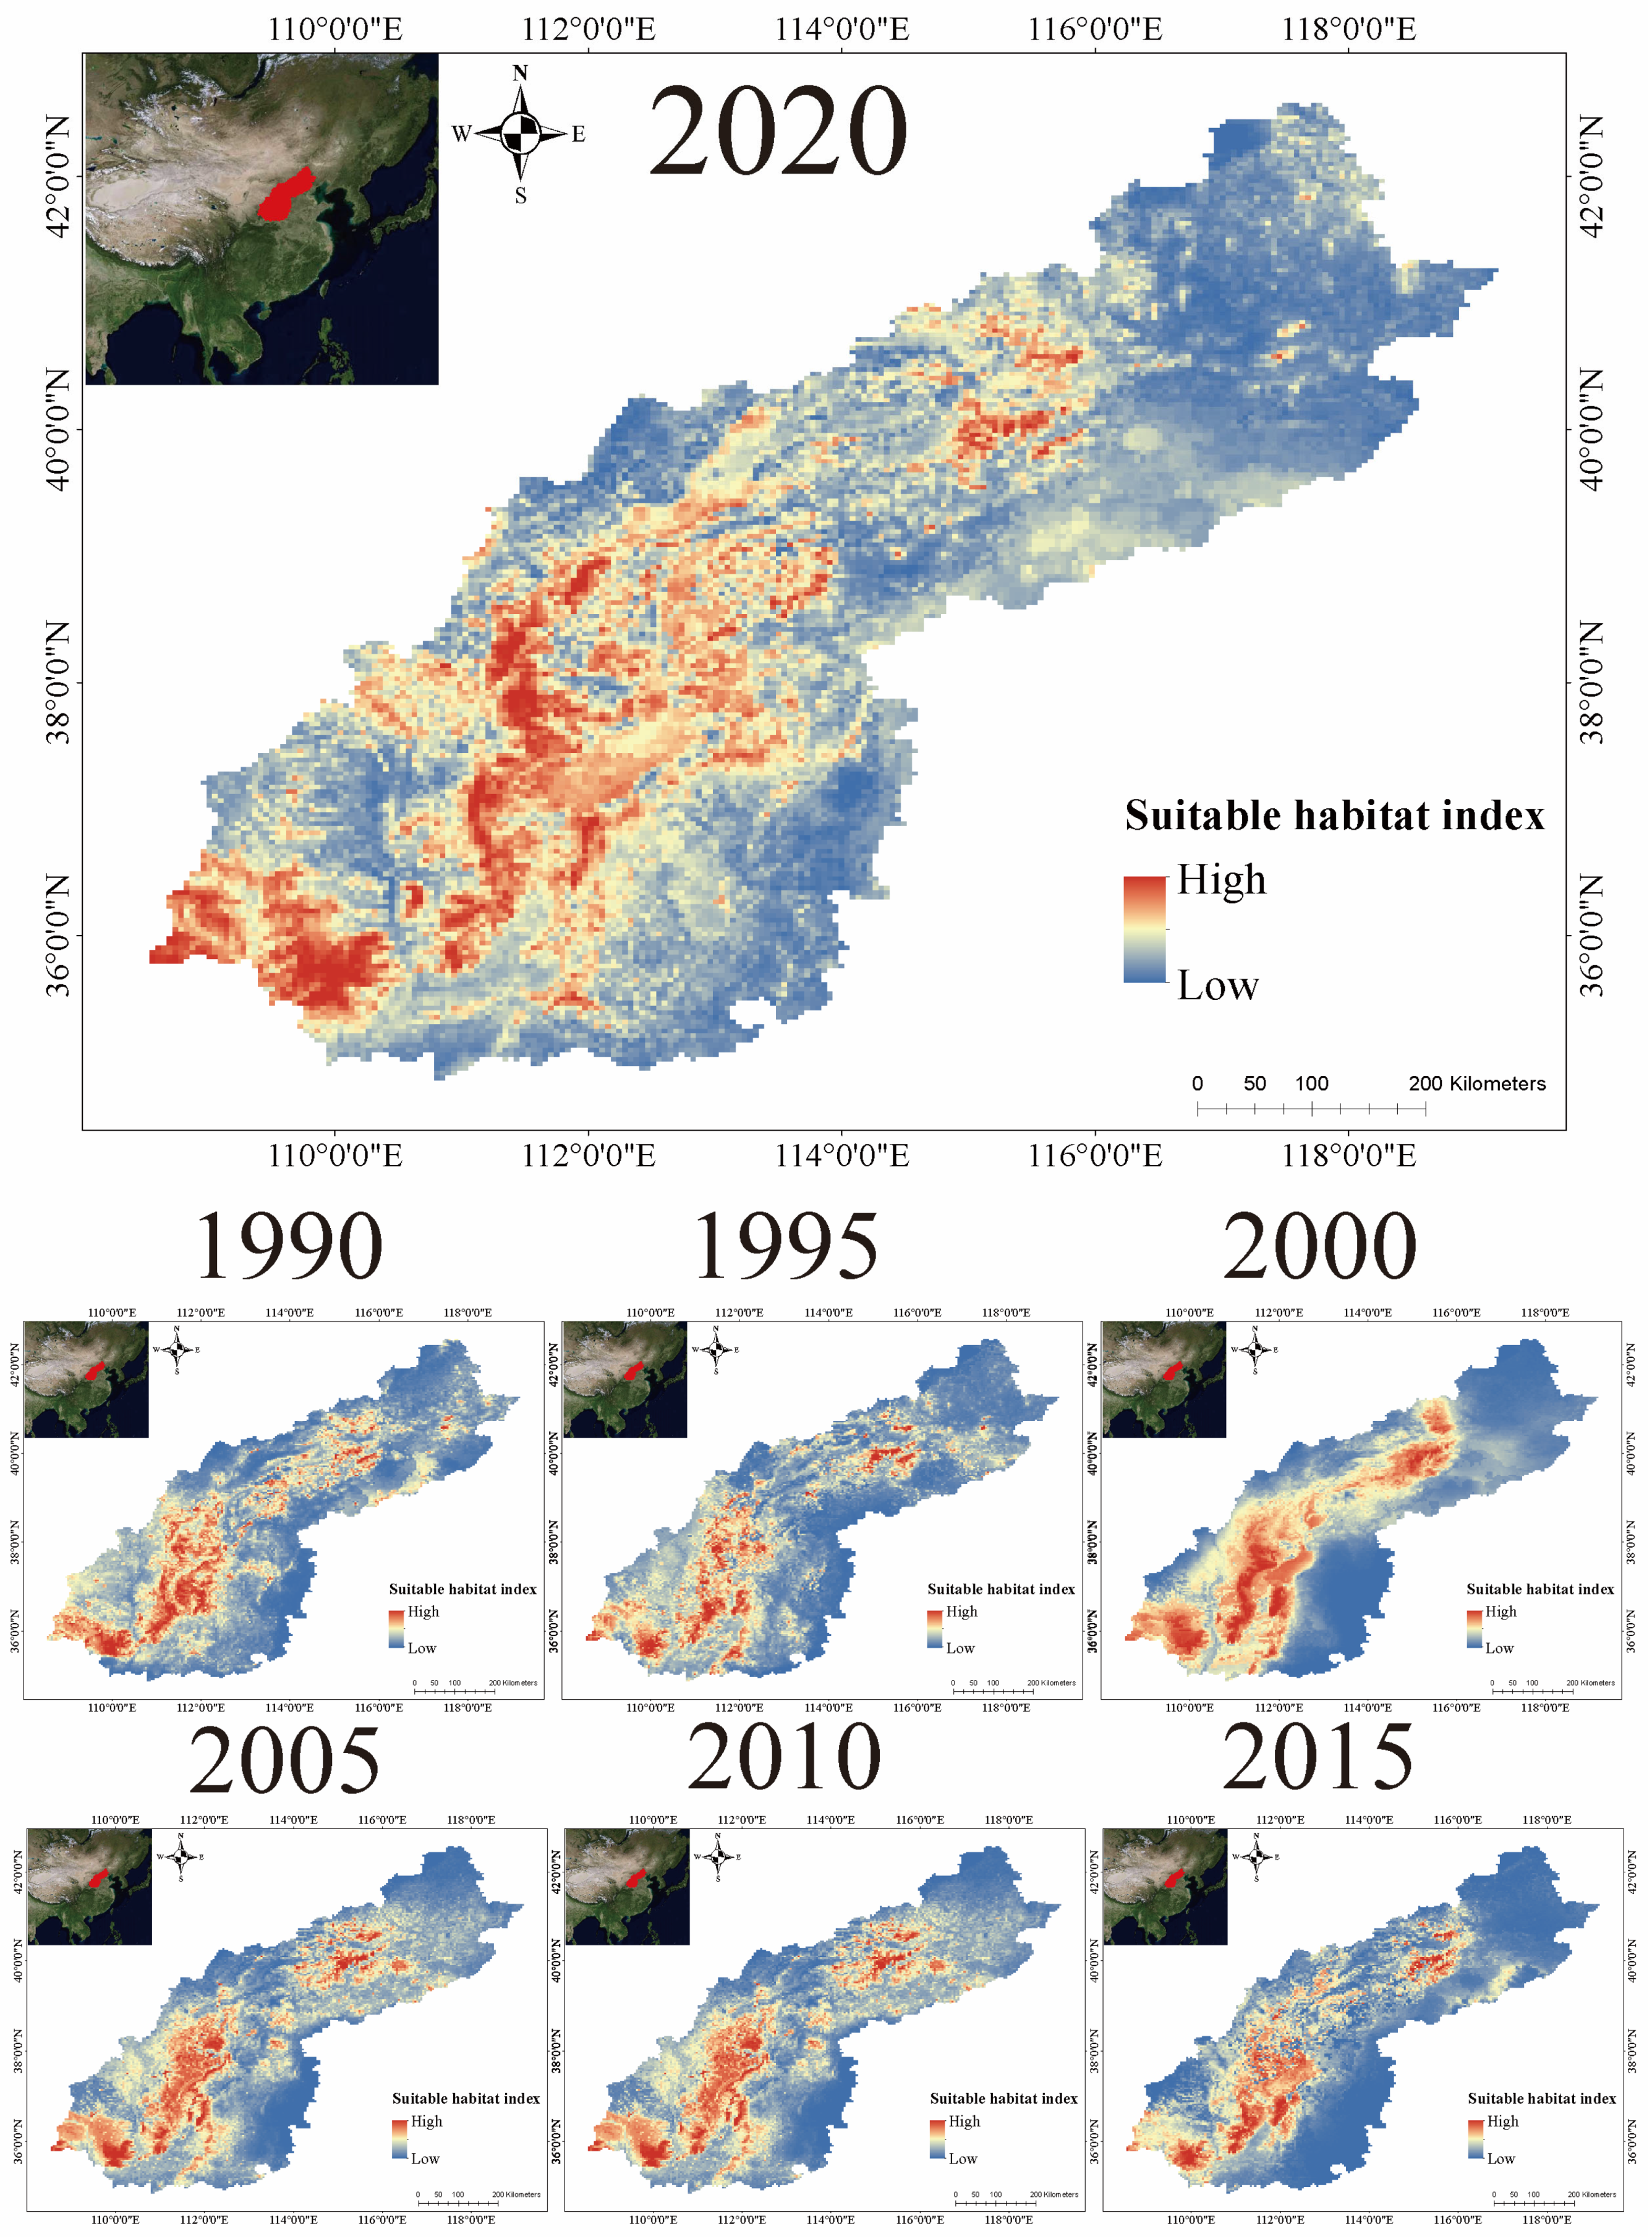
3.2. Distribution of Suitable Habitats
According to the final model parameters, we used the mean value of the output of the ten fold cross-validation model as the habitat suitability index of the brown-eared pheasant. We map the changes in the distribution of suitable habitats over the last three decades (Figure 5). The suitable habitat index of brown-eared pheasants fluctuated over 30 years, decreasing and gradually increasing from 1990 to 2020. Geographically, the habitat suitability of the western and central regions is generally higher than that of the eastern region. In the last 30 years, the suitable habitat in the central area of the distribution area gradually increased, and the degree of fragmentation gradually recovered. However, the distribution of suitable habitats in the eastern region is scattered and has not improved. The suitable habitat range of brown-eared pheasants in the west region (west of the Yellow River) is gradually increasing (Figure 5).
Figure 5.
Spatial distribution of the habitat suitability for the brown-eared pheasant each year.
In the last 30 years, the suitable habitat area for the brown-eared pheasant has gradually recovered from 120,000 km2 to 140,000 km2, and the core habitat has gradually recovered from 100,000 square km2 to 120,000 km2 (Figure 6). Although the total forest area in the study area has increased year by year, it has recovered from nearly 90,000 square kilometers to approximately 110,000 square kilometers. However, the increase in forest area was not significant for the growth of suitable habitats for brown-eared pheasants. The brown-eared pheasant’s suitable habitat and core habitat areas changed over time in response to varying climatic factors. It is crucial to monitor the impact of climate change on this bird in the future.
Figure 6.
Changes in the area of suitable habitats, core habitats, grasslands, and brown-eared pheasant forests in the study area over the past 30 years.
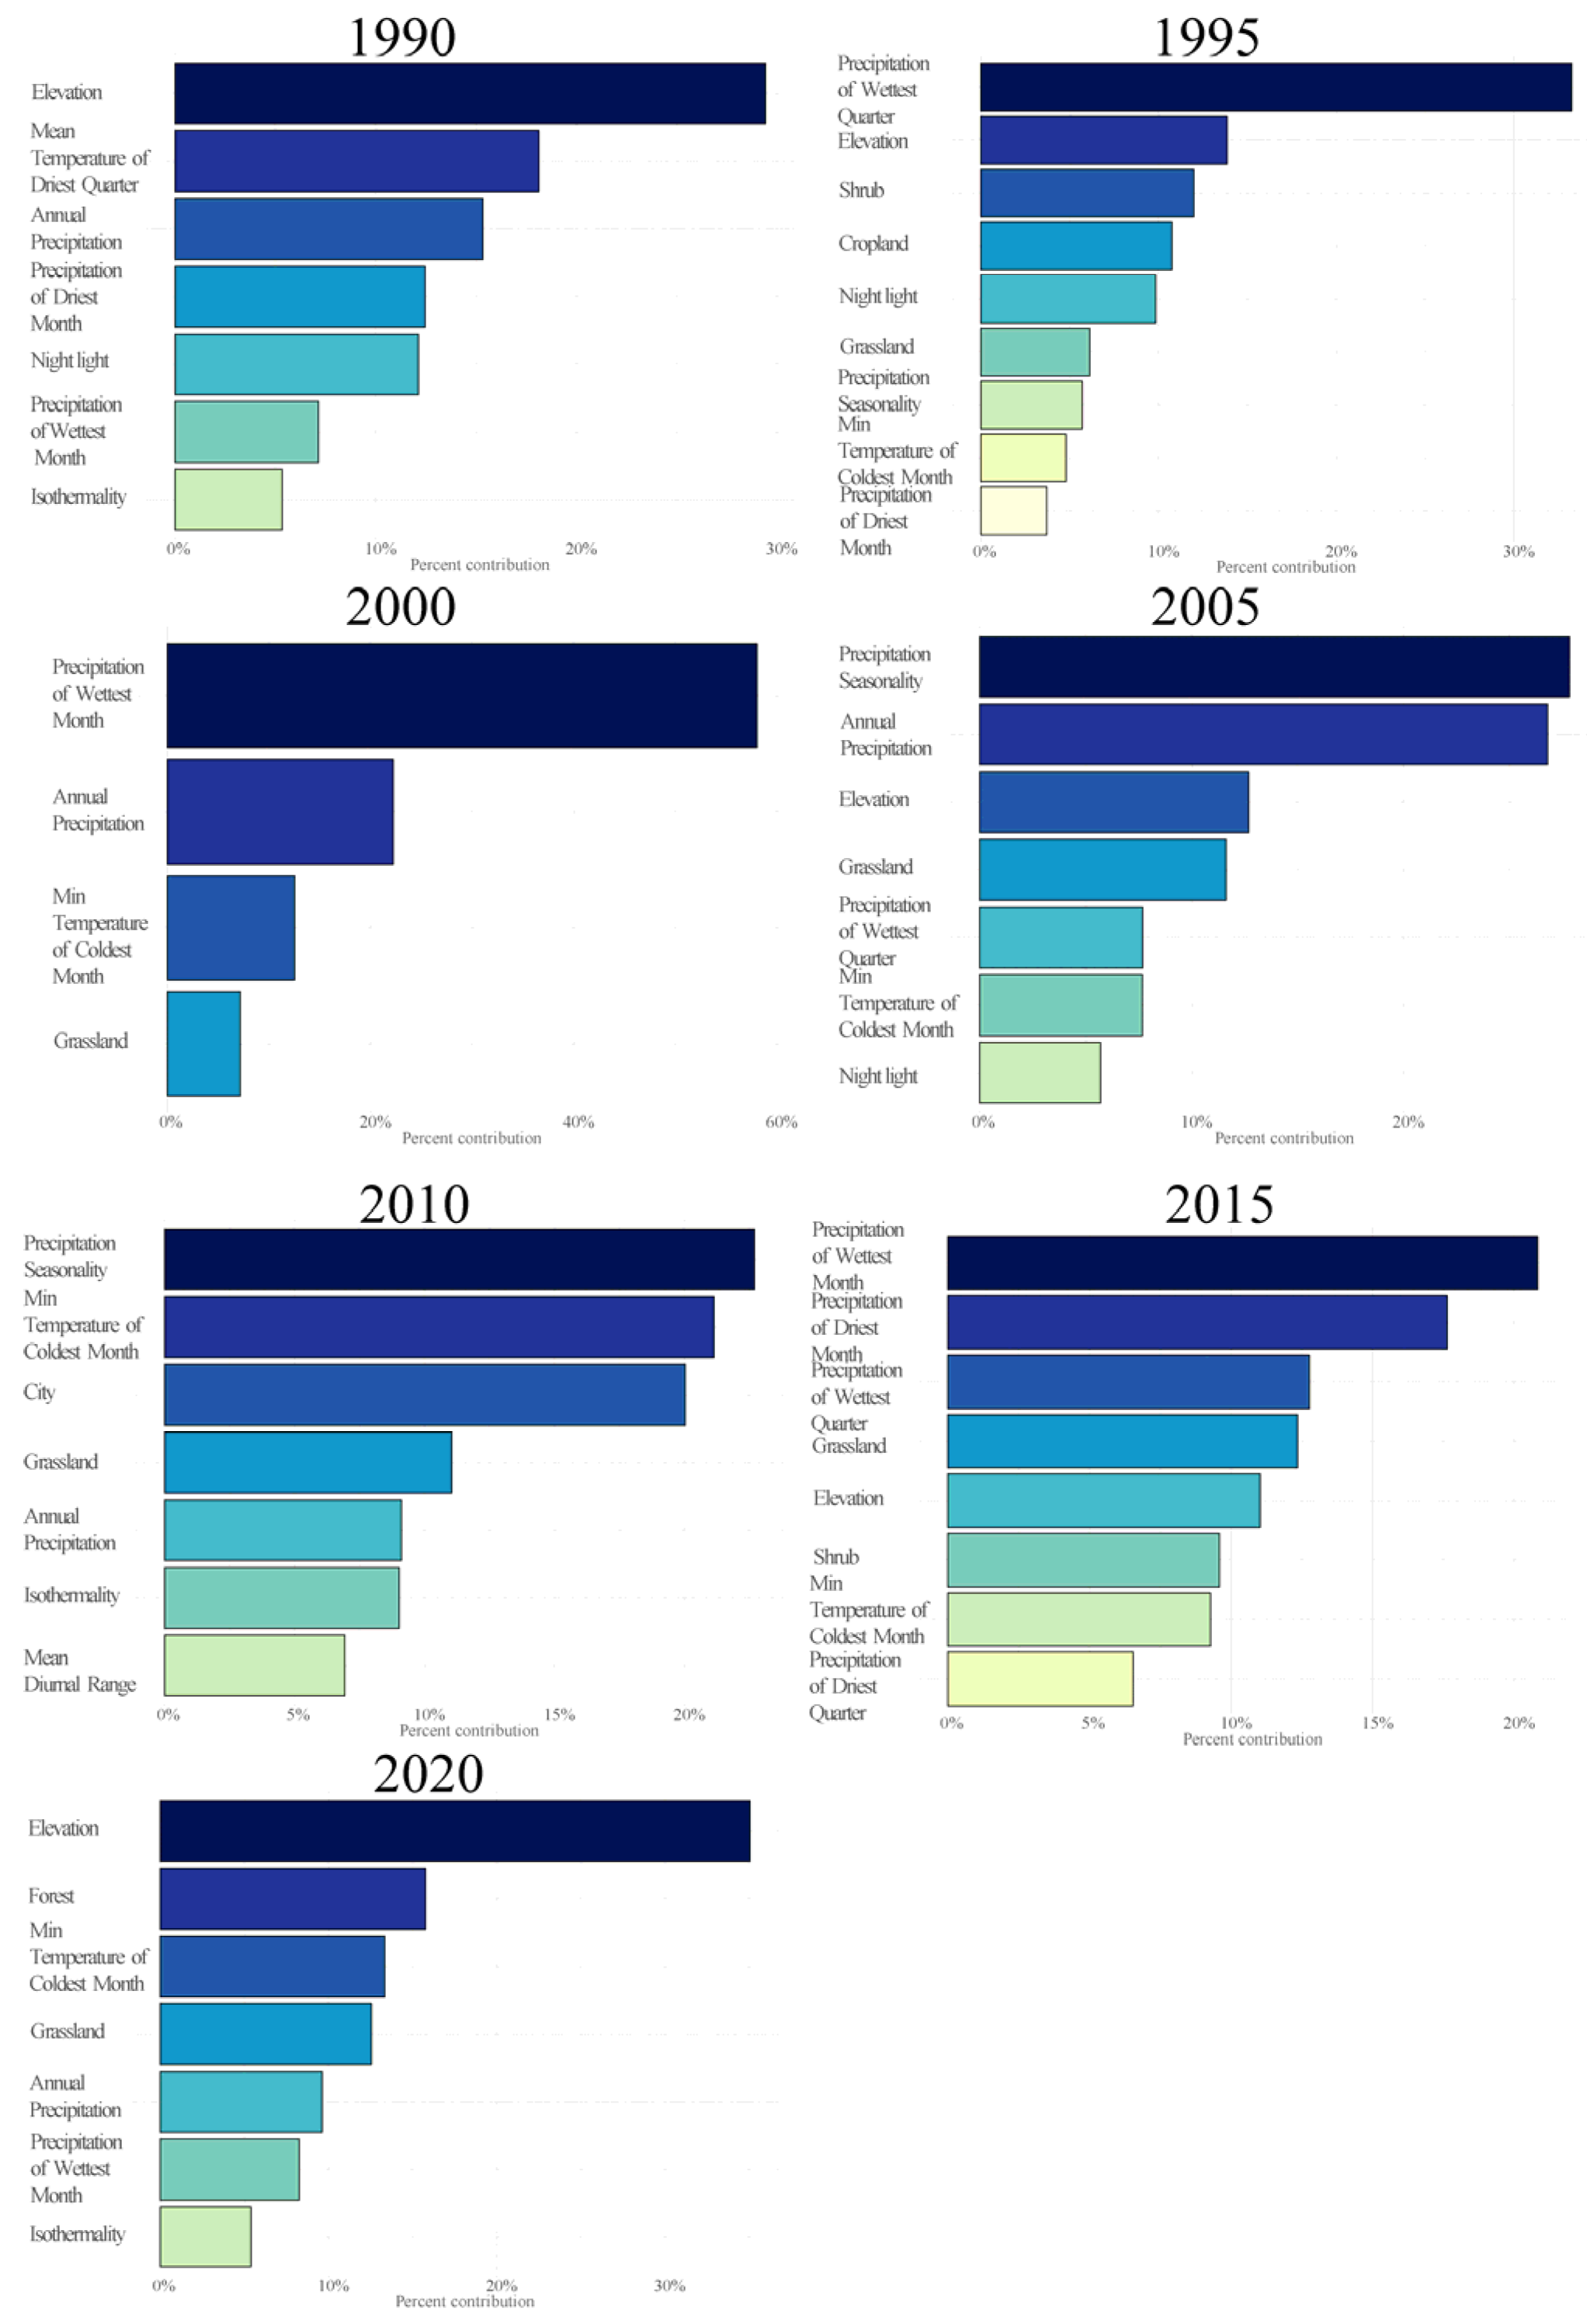
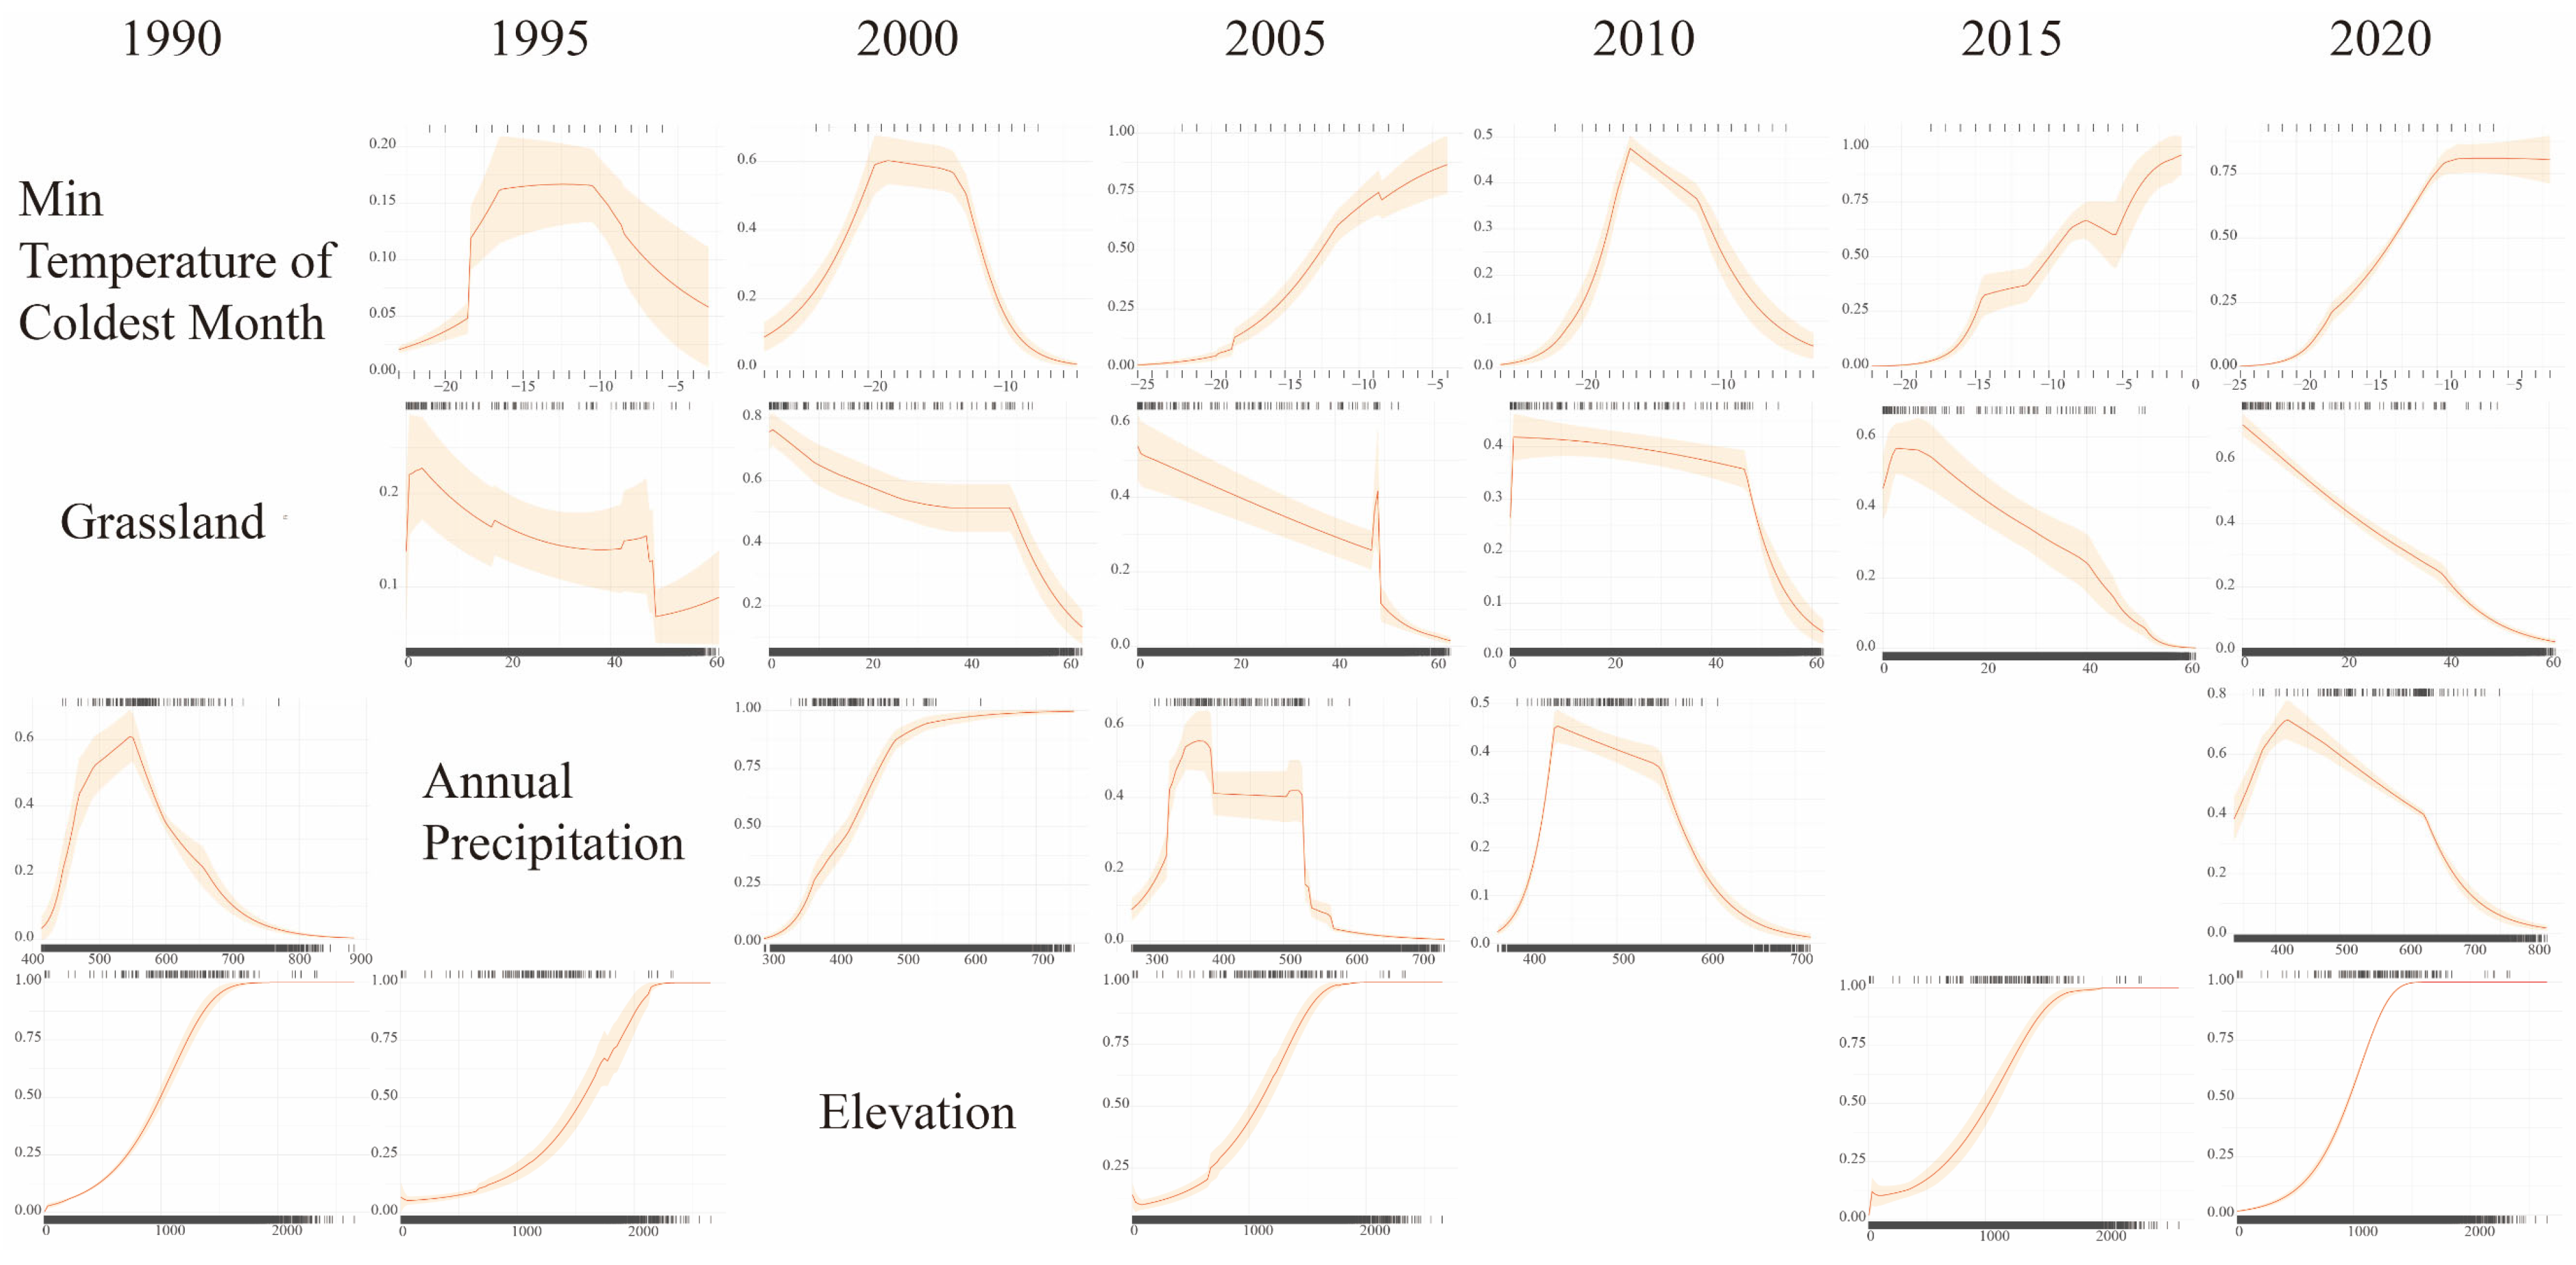
3.3. The Influence of Environmental Variables
We draw the response curve for each variable in each year (Figure S1). The suitable habitat distribution in most of these years showed different degrees of response to grassland, the min temperature of the coldest month, annual precipitation, and elevation. Therefore, we focus on drawing the response curves of these four variables (Figure 7). The brown-eared pheasant showed a strong avoidance of grasslands, and the response curves for all years were negatively correlated. With the increase in the proportion of grassland area in landscape patches, the probability of brown-eared pheasants decreased. The optimal response range of the suitable habitat for the brown-eared pheasant to the min temperature of the coldest month is approximately −10 °C to −20 °C, and the optimal response range to annual precipitation is approximately 400~600 mm. With increasing elevation, the probability of the appearance of a brown-eared pheasant gradually increased.
Figure 7.
The response curve shows the critical environmental factors that affect the distribution of brown-eared pheasants. The horizontal axis represents the distribution range of each variable, while the vertical axis represents the probability of occurrence. The complete response curve can be found in Figure S1.
To clarify the critical factors for the change in suitable habitat for the brown-eared pheasant population between different years, we map the changing trend of the main variables at the landscape level (Figure 8). We examined discrepancies in the distribution of environmental variables between years (Figure S2) and found that the differences were highly significant. Because elevation does not change significantly over time, only changes in grassland, min temperature of the coldest month, and annual precipitation are drawn. To clarify the relationship between the distribution of suitable habitat for the brown-eared pheasant and the change in forest area, we also map the change in forest area at the landscape level in the study area between different years (Figure 8).
Figure 8.
The trend of distribution of key variables that affect the suitable habitat distribution of brown-eared pheasants at the landscape scale in the study area.
Although the forest area in the study area has gradually increased and the grassland area has gradually decreased in the last 30 years, on the landscape scale, the patches with reduced grassland area in the brown-eared pheasant habitat patches have slowly increased (Figure 8). The overall change in the proportion of forest area on the landscape scale in the study area is small (Figure 8). Therefore, from the perspective of the suitable restoration of the habitat of brown-eared pheasant, refined forest restoration policies at the landscape level should be continuously increased.
There are some fluctuations in the min temperature of the coldest month between different years in the study area; most patches are distributed in the range of suitable brown-eared pheasant distribution (−10 °C to −20 °C). The temperature in the study area has been increasing yearly, and it is worth worrying about what impact this will have in the future (Figure 8). In the future, due to the impact of climate change, the distribution of suitable habitat for the brown-eared pheasant will be threatened. The variation in annual precipitation in different years in the study area is very different, which may be an essential reason for the periodic distribution of the suitable habitat for the brown-eared pheasant. When the precipitation distribution fluctuates significantly, the patches suitable for the habitat of brown-eared pheasants on the landscape scale are significantly reduced (400~600 mm).
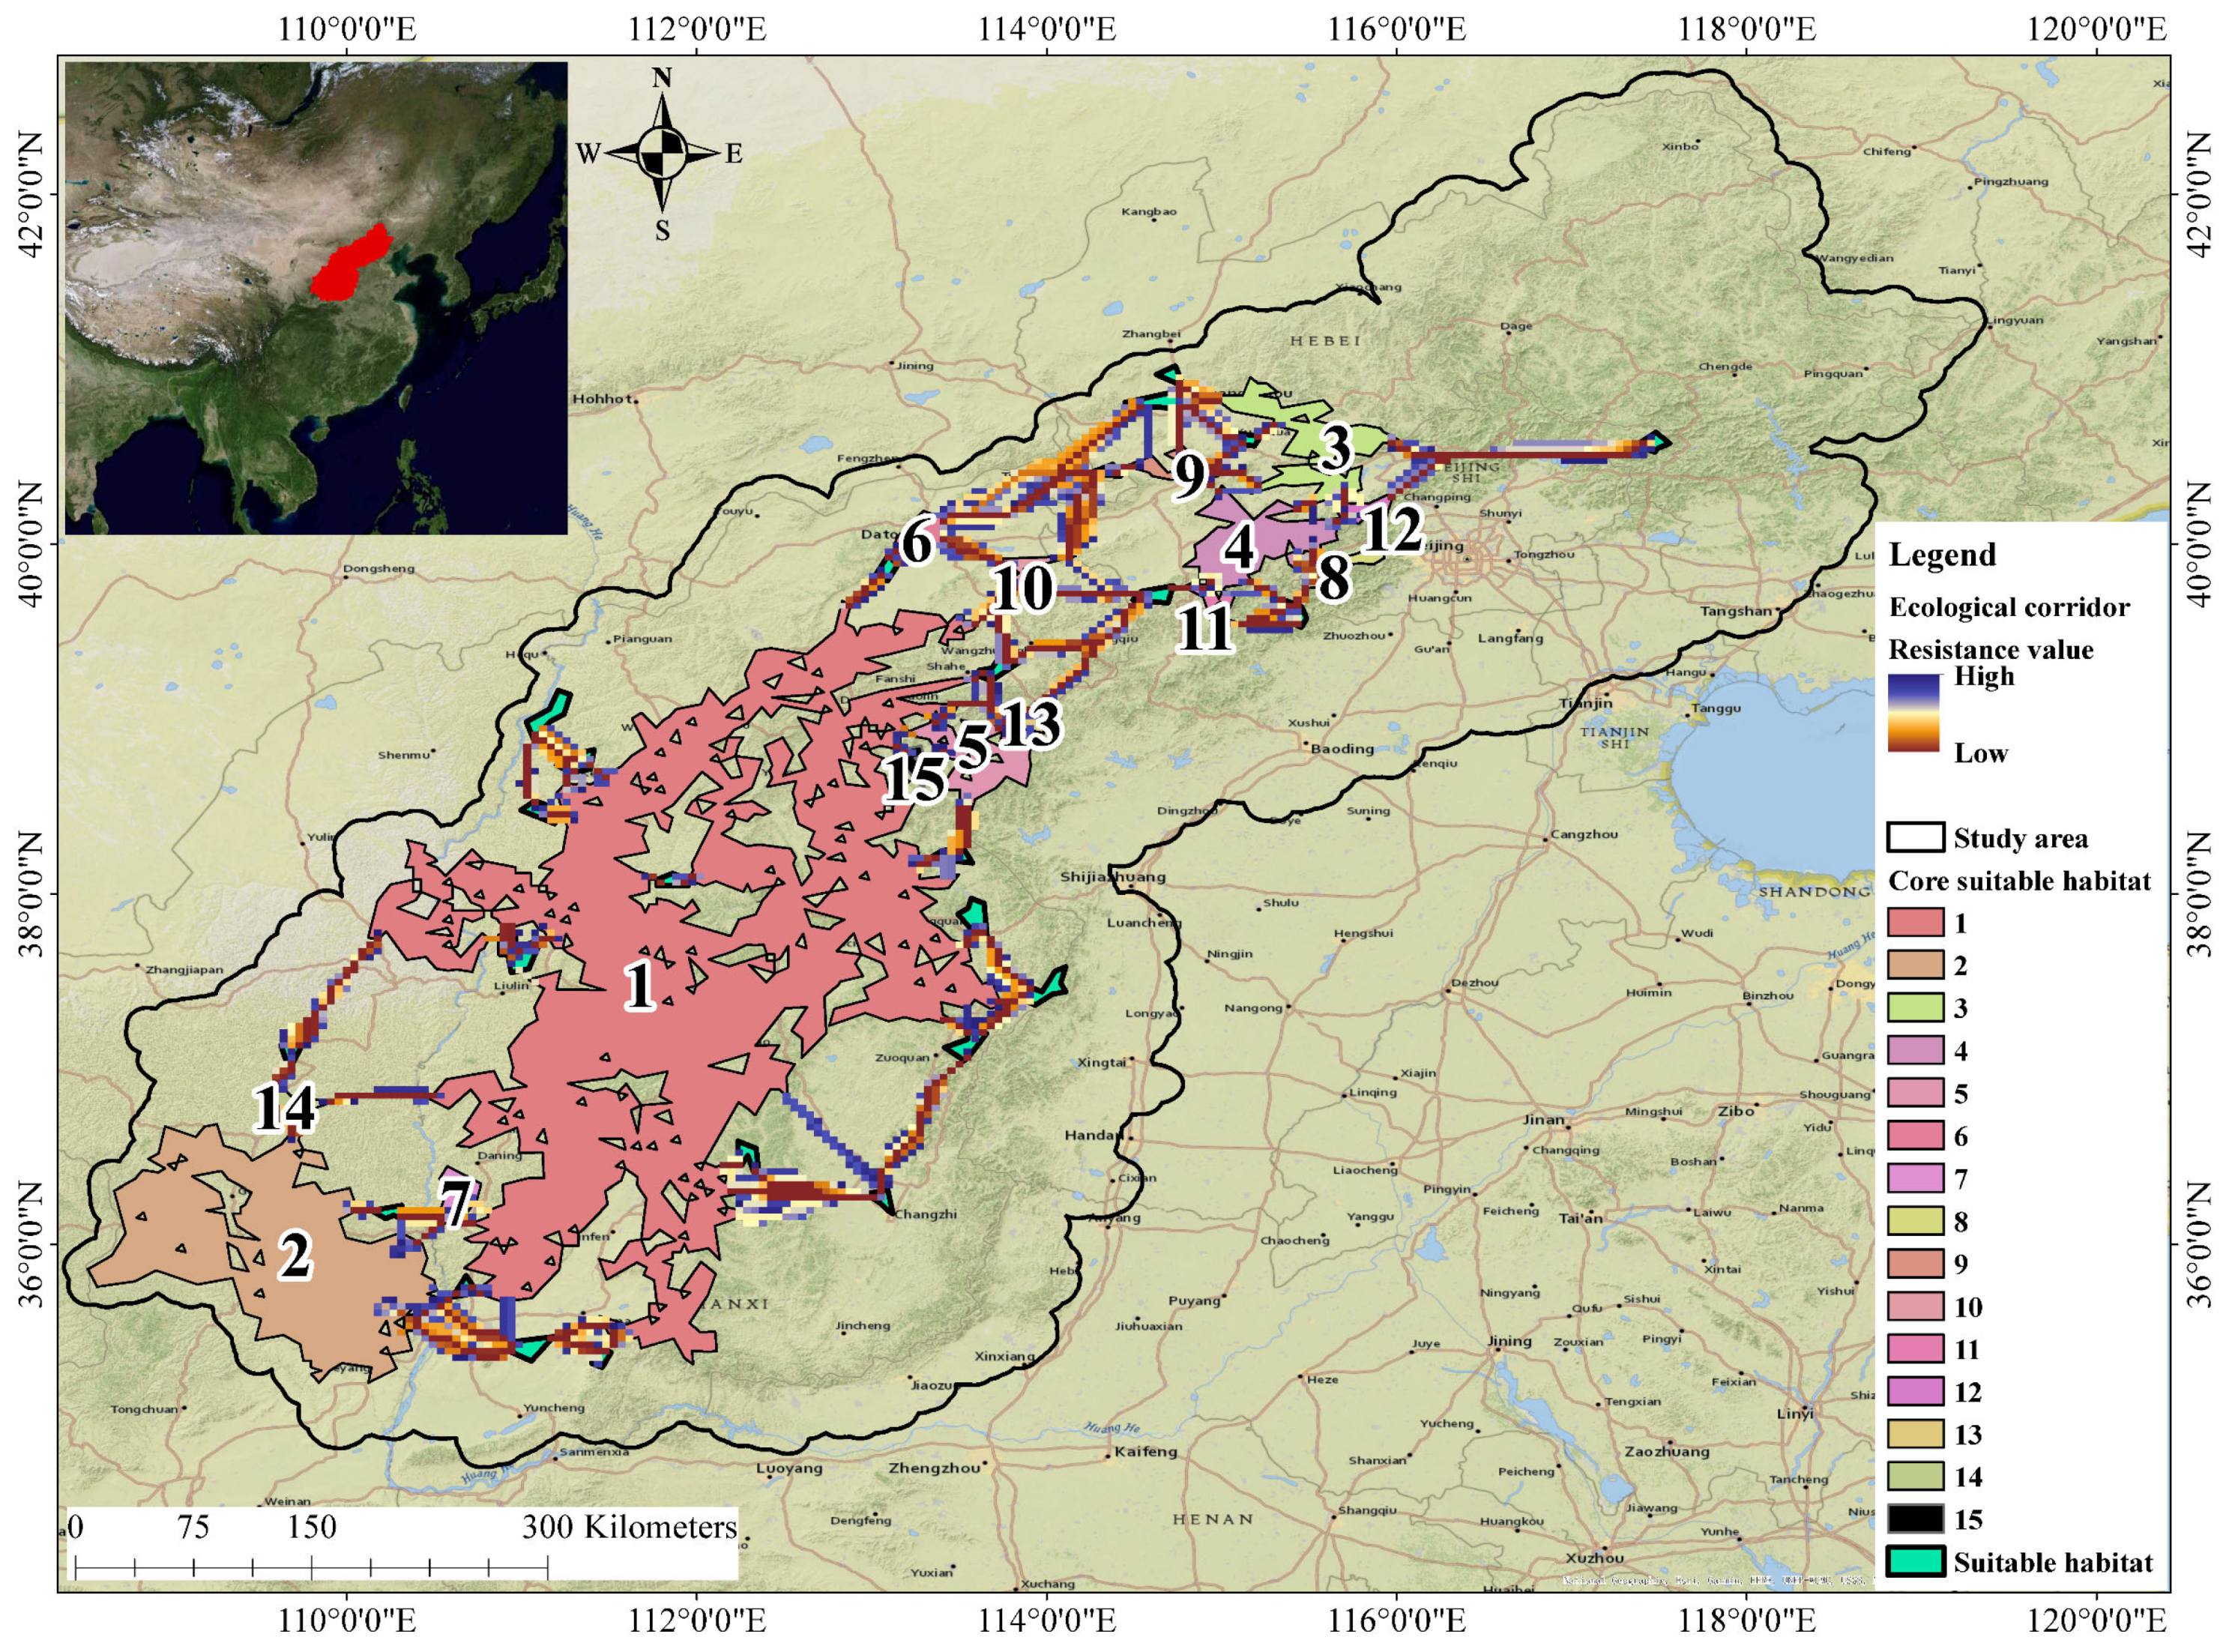
3.4. Results of the Current Analysis of the Construction of the Corridor between Suitable Habitats
In this study, 15 brown-eared pheasant core habitats were identified (Figure 9), of which the largest core habitat was Shanxi Province in the middle of the study area, indicating that Shanxi Province is the core area of the brown-eared pheasant distribution. The second largest core habitat is located in northern Shaanxi Province. The remaining core habitats are scattered, and the area is significantly reduced. In general, the distribution of the core habitat in the northeast of the study area is severely fragmented.
Figure 9.
Distribution of the core habitat of the brown-eared pheasant and the recommended location for the construction of the corridor.
In constructing the overall corridor, the No.7 core habitat is the critical area linking the No.1 and 2 core habitats. In the future, priority should be given to constructing corridors in this area to open the two most significant core habitats. The construction of the core habitat corridor in the northern part of the study area is complex, and habitat fragmentation and island phenomena are severe. Whether the northern region can smoothly construct the core habitat corridor should be the focus of future work on protecting the brown-eared pheasant population. In the future, targeted land use policies will be implemented in the northern region to restore habitat quality and connectivity.
4. Discussion
4.1. Distribution Dynamics of Suitable Habitat for Brown-Eared Pheasant
The general habitat of brown-eared pheasants showed fluctuating changes, and our study showed that this could be mainly due to the uncertainty of precipitation. The brown-eared pheasant distribution area is in North China, and annual precipitation in this area is significantly variable [18]. Precipitation also affects the source of wild food for brown-eared pheasants by affecting the quality of vegetation, making annual precipitation significantly impact the distribution of brown-eared pheasants [33]. On the other hand, moderate annual precipitation will allow vegetation to flourish, and canopy concealment will improve, which is more conducive to the nesting of brown-eared pheasants during the breeding period [34]. Therefore, when the annual precipitation in the study area changes significantly, it will affect the suitable habitat of brown-eared pheasant. Although the total area of suitable habitats fluctuated, it has been on the rise since 2000, especially with respect to the favorable factors suitable for brown-eared pheasants on the landscape scale. This shows that the current policy of returning farmland to forests has played a positive role [35]. Decreased grassland in landscape patches reduces the possibility of direct exposure of brown pheasants, which can somewhat alleviate the conflict between brown pheasants and predators [36]. At the same time, due to the policy of returning farmland to forests, the forest area in the study area showed an increasing trend both on the whole scale and on the landscape scale [37], providing the necessary habitat environment and a sufficient food source for brown-eared pheasants [38].
In recent decades, the brown-eared pheasant distribution area in the central and western regions has gradually increased while maintaining a large area of suitable habitat, indicating that the protection effect on these two areas is better. However, the northern region is always a tiny and fragmented area. There are many urban distributions in the northern part of the study area, making the level of human activity in the region relatively high, and human activities hinder the effective diffusion of the population of brown-eared pheasants [39]. The appropriate fragmentation distribution area is worth considering, especially in the case of the recovery of forest distribution year by year; how to effectively promote the spread of endangered species is an urgent problem to consider [40]. Measures such as raising citizen awareness of protection, increasing the construction of urban ecological environments, and establishing dedicated wildlife corridors may be necessary to recover brown-eared pheasant populations.
It should be noted that there is no significant correlation between the change in the suitable habitat area and the restoration of the forest area. It shows that existing forest restoration projects and land use management policies need to be further optimized and improved from the perspective of wildlife protection. A simple expansion of the forest area effectively prevents soil erosion, reduces wind and sand, and promotes biological carbon sequestration [36]. However, it may not be conducive to the conservation of biodiversity. Further management policies should be considered from the perspective of wildlife habitats. We found that a moderate reduction in the proportion of grassland area in landscape patches will increase the habitat suitability for brown-eared pheasants. However, this does not mean that a large area of grassland distribution should be reduced in the entire distribution area [41]. Protected resources are often limited, so the refined implementation of land use management policies on the landscape scale may be resource-saving and more effective.
4.2. Effects of Critical Variables on Habitat Suitability of Brown-Eared Pheasant
Brown-eared pheasants showed obvious avoidance of grassland areas, consistent with previous studies that brown-eared pheasants are a typical forest distribution species [42]. The policy of returning farmland to the forest has gradually restored the forest area in recent years [43], which benefits brown-eared pheasants. However, it should be noted that the downward trend of grassland area on the landscape scale is relatively slow and that suitable habitat patches have not increased significantly. This part explains the non-linear changes in suitable habitats. In the gradual recovery of the forest area, we must focus on improving the suitable habitat for wild animals and maximizing the positive role of the policy of returning farmland to the forest.
Previous studies have shown that the brown-eared pheasant inhabits an elevation range of 1500~2000 m, consistent with the effect of elevation on the suitable habitat for brown-eared pheasants in our research results [24]. Furthermore, the brown-eared pheasant has a clear and suitable range for the lowest temperature of the coldest month, and its suitable habitat is likely to shrink to high-elevation areas under the backdrop of accelerated global change in the future [44]. This will bring more severe protection challenges to the area where the north has been fragmented. In particular, we found that the temperature has gradually increased in the past three decades, which is detrimental to the population distribution of brown-eared pheasants [45]. To reverse the trend of global warming, the Chinese government is actively participating in global climate governance and has introduced a carbon neutrality policy [46]. Supposing that the policy can achieve the expected goal and reverse the increase in temperature [46], in that case, it will have a hugely positive effect on protecting the unique species of brown-eared pheasant in China.
The brown-eared pheasant also has a suitable range for annual precipitation. Precipitation brings the necessary water for the survival of wildlife [47]. Generally speaking, it has a significant impact on wildlife. When precipitation is too little, vegetation quality will be significantly reduced, the food source of wild animals will be reduced, survival pressure will increase, and migration and other behaviors will be generated, thus changing the distribution of suitable habitats [48]. Excess precipitation can cause severe damage to the habitat. Rainstorms can cause devastating damage to the nests or habitats of brown-eared pheasants, affecting the distribution of suitable habitats [49]. The variation in annual precipitation in the study area is quite large, which should be one of the main reasons for the fluctuation in suitable habitat areas. In response to differential changes in precipitation, precise wildlife management policies should be strengthened, such as artificially increasing field feeding sites and increasing habitat concealment when precipitation is insufficient.
4.3. The Current Status of Suitable Habitats for Brown-Eared Pheasants and Corridor Planning
We selected and evaluated the core habitat of brown-eared pheasants according to the suitable habitat area and the location information for brown-eared pheasants. The western and central regions retain a large core habitat area. The core habitat area in the northern region is smaller, showing a fragmented distribution. Long-term habitat isolation may be due to the inbreeding of brown-eared pheasants, which reduces genetic diversity [50]. If this situation cannot be improved, a population decline may occur. The northern region should immediately conduct relevant landscape genetic research to assess whether the genetic diversity of the brown-eared pheasant population has been affected. Habitat isolation should be addressed by building ecological corridors to establish connectivity between habitats [51]. As a terrestrial bird, the brown-eared pheasant has limited flight mobility, highlighting the importance of corridor construction. Ecological corridors can connect ecological patches and landscape units distributed in different geographical locations, thus promoting species migration and reproduction and enhancing the integrity and stability of ecosystems [52]. Planning corridor construction locations has been proven to be effective. In the future, we should increase the in-depth study of corridor width and construction effectiveness [32].
4.4. Limitations of the Study
The accuracy of the MaxEnt model is based on the reliability of the distribution points of the sampled species. We used eBird data for our MaxEnt modeling analysis and noted a possible sampling bias due to some uploaders only observing sampling on the roadside [19]. To investigate the suitable habitat distribution of the brown-eared pheasant on a landscape scale, we analyzed a 25 km2 grid to help mitigate any data point inaccuracies. The results of our model test demonstrate that it effectively reflects the distribution characteristics of the suitable habitat for the brown-eared pheasant [53]. Although 153 points were selected, these data may be insufficient considering the rarity of brown-eared pheasants. A unified large-scale distribution survey will be necessary to meet the model’s requirements for this relatively rare bird. However, our findings indicate the potential to use citizen data [54]. To obtain higher quality and more reliable analysis results, conducting a unified national survey on the distribution of brown-eared pheasants is crucial. We look forward to this in the following steps.
5. Conclusions
We evaluated changes in suitable habitats for brown-eared pheasants over the past 30 years to assess the impact of forest restoration projects and land use management policies on wildlife conservation. Our findings suggest that simply increasing the forest area has limited benefits for wildlife conservation. Instead, we should focus on improving habitat quality at the landscape level while also considering the effects of climate change. In the future, it is essential to implement forest restoration projects on a landscape scale and enforce precise land use management policies to enhance wildlife protection. Our assessment of the suitable habitat of the brown-eared pheasant revealed that although the habitat area has been restored, the distribution status in the eastern region remains a concern. To further restore brown-eared pheasant habitat, expediting the corridor construction process is crucial to improve habitat connectivity.
Supplementary Materials
The following supporting information can be downloaded at: https://www.mdpi.com/article/10.3390/d16090514/s1. Figure S1: Response curves of brown-eared pheasants to environmental variables in different years; Figure S2: The significance test of the key variables affecting the suitable habitat distribution of brown-eared pheasants in different years; Table S1: Brown-eared pheasant occurrence site.
Author Contributions
Conceptualization, M.Z.; Methodology, M.Z.; Software, Y.Z.; Validation, C.D.; Formal analysis, Y.L.; Investigation, S.X.; Data curation, Y.Z.; Writing—original draft, M.Z.; Writing—review and editing, M.Z.; Visualization, M.Z. All authors have read and agreed to the published version of the manuscript.
Funding
This research was funded by the Shaanxi Provincial Department of Science and Technology for its financial support, grant number 2024JC-YBQN-0187; this research was funded by the scientific research project of Shaanxi Institute of Basic Science, grant number 23JHQ031; the Doctoral research start-up project of Yan’an University, grant number YDBK2021-13 funded this research.
Data Availability Statement
All of the data is contained within the article and the Supplementary Materials.
Acknowledgments
Thank you to all those who helped the author grow. Thank you to the wildlife conservation managers who have worked there for many years. Finally, I want to thank Chen Huan who provided help to the author.
Conflicts of Interest
The authors declare no conflicts of interest.
References
- Malik, A.A.; Puissant, J.; Buckeridge, K.M.; Goodall, T.; Jehmlich, N.; Chowdhury, S.; Gweon, H.S.; Peyton, J.M.; Mason, K.E.; Van Agtmaal, M.; et al. Land Use Driven Change in Soil pH Affects Microbial Carbon Cycling Processes. Nat. Commun. 2018, 9, 3591. [Google Scholar] [CrossRef] [PubMed]
- Chen, X.; Yu, L.; Du, Z.; Xu, Y.; Zhao, J.; Zhao, H.; Zhang, G.; Peng, D.; Gong, P. Distribution of Ecological Restoration Projects Associated with Land Use and Land Cover Change in China and Their Ecological Impacts. Sci. Total Environ. 2022, 825, 153938. [Google Scholar] [CrossRef] [PubMed]
- Cao, S.; Chen, L.; Yu, X. Impact of China’s Grain for Green Project on the Landscape of Vulnerable Arid and Semi-arid Agricultural Regions: A Case Study in Northern Shaanxi Province. J. Appl. Ecol. 2009, 46, 536–543. [Google Scholar] [CrossRef]
- Choi, C.; Shi, X.; Shi, J.; Gan, X.; Wen, C.; Zhang, J.; Jackson, M.V.; Fuller, R.A.; Gibson, L. China’s Ecological Conservation Redline Policy Is a New Opportunity to Meet Post-2020 Protected Area Targets. Conserv. Lett. 2022, 15, e12853. [Google Scholar] [CrossRef]
- Grace, M.K.; Akçakaya, H.R.; Bennett, E.L.; Brooks, T.M.; Heath, A.; Hedges, S.; Hilton-Taylor, C.; Hoffmann, M.; Hochkirch, A.; Jenkins, R.; et al. Testing a Global Standard for Quantifying Species Recovery and Assessing Conservation Impact. Conserv. Biol. 2021, 35, 1833–1849. [Google Scholar] [CrossRef] [PubMed]
- Visconti, P.; Butchart, S.H.M.; Brooks, T.M.; Langhammer, P.F.; Marnewick, D.; Vergara, S.; Yanosky, A.; Watson, J.E.M. Protected Area Targets Post-2020. Science 2019, 364, 239–241. [Google Scholar] [CrossRef]
- Song, K.; Mi, C.-R.; Zhao, Y.-Z.; Yang, N.; Sun, Y.-H.; Xu, J.-L. Zonation of Nature Reserve According to the Habitat Requirement of Conservation Target: A Case Study on the Endangered Brown Eared-Pheasant at Baihuashan Nature Reserve. Glob. Ecol. Conserv. 2021, 32, e01941. [Google Scholar] [CrossRef]
- Li, H.; Liu, X.; Han, Z.; Wu, S.; Cao, C. Foraging and Day-Roosting Sites Selection by the Endangered Brown-Eared Pheasant Crossoptilon Mantchuricum during Autumn in the Huanglong Mountains, Shaanxi Province, China. Pak. J. Zool. 2021, 53, 401–800. [Google Scholar] [CrossRef]
- Huang, T.; Yang, T.; Wang, K.; Huang, W. Assessing the Current and Future Potential Distribution of Solanum rostratum Dunal in China Using Multisource Remote Sensing Data and Principal Component Analysis. Remote Sens. 2024, 16, 271. [Google Scholar] [CrossRef]
- Zhang, J.; Li, H.; Tian, Y.; Qiu, H.; Zhou, X.; Ma, H.; Yuan, L. Assessing Rice Sheath Blight Disease Habitat Suitability at a Regional Scale through Multisource Data Analysis. Remote Sens. 2023, 15, 5530. [Google Scholar] [CrossRef]
- Riddell, E.A.; Iknayan, K.J.; Hargrove, L.; Tremor, S.; Patton, J.L.; Ramirez, R.; Wolf, B.O.; Beissinger, S.R. Exposure to Climate Change Drives Stability or Collapse of Desert Mammal and Bird Communities. Science 2021, 371, 633–636. [Google Scholar] [CrossRef]
- Ditmer, M.A.; Iannarilli, F.; Tri, A.N.; Garshelis, D.L.; Carter, N.H. Artificial Night Light Helps Account for Observer Bias in Citizen Science Monitoring of an Expanding Large Mammal Population. J. Anim. Ecol. 2021, 90, 330–342. [Google Scholar] [CrossRef] [PubMed]
- Shi, X.; Wang, J.; Zhang, L.; Chen, S.; Zhao, A.; Ning, X.; Fan, G.; Wu, N.; Zhang, L.; Wang, Z. Prediction of the Potentially Suitable Areas of Litsea Cubeba in China Based on Future Climate Change Using the Optimized MaxEnt Model. Ecol. Indic. 2023, 148, 110093. [Google Scholar] [CrossRef]
- Ab Lah, N.Z.; Yusop, Z.; Hashim, M.; Mohd Salim, J.; Numata, S. Predicting the Habitat Suitability of Melaleuca Cajuputi Based on the MaxEnt Species Distribution Model. Forests 2021, 12, 1449. [Google Scholar] [CrossRef]
- Li, J.; Fan, G.; He, Y. Predicting the Current and Future Distribution of Three Coptis Herbs in China under Climate Change Conditions, Using the MaxEnt Model and Chemical Analysis. Sci. Total Environ. 2020, 698, 134141. [Google Scholar] [CrossRef]
- Kang, S.; Eltahir, E.A.B. North China Plain Threatened by Deadly Heatwaves Due to Climate Change and Irrigation. Nat. Commun. 2018, 9, 2894. [Google Scholar] [CrossRef]
- Liu, J.; Rühland, K.M.; Chen, J.; Xu, Y.; Chen, S.; Chen, Q.; Huang, W.; Xu, Q.; Chen, F.; Smol, J.P. Aerosol-Weakened Summer Monsoons Decrease Lake Fertilization on the Chinese Loess Plateau. Nat. Clim. Change 2017, 7, 190–194. [Google Scholar] [CrossRef]
- Ruan, H.; Wu, X.; Wang, S.; Yang, J.; Zhu, H.; Guo, Q.; Wang, L.; Wang, D. The Responses of Different Insect Guilds to Grassland Degradation in Northeastern China. Ecol. Indic. 2021, 133, 108369. [Google Scholar] [CrossRef]
- Kadmon, R.; Farber, O.; Danin, A. Effect of Roadside Bias on the Accuracy of Predictive Maps Produced by Bioclimatic Models. Ecol. Appl. 2004, 14, 401–413. [Google Scholar] [CrossRef]
- Johnston, A.; Hochachka, W.M.; Strimas-Mackey, M.E.; Ruiz Gutierrez, V.; Robinson, O.J.; Miller, E.T.; Auer, T.; Kelling, S.T.; Fink, D. Analytical Guidelines to Increase the Value of Community Science Data: An Example Using eBird Data to Estimate Species Distributions. Divers. Distrib. 2021, 27, 1265–1277. [Google Scholar] [CrossRef]
- Amiri, M.; Tarkesh, M.; Jafari, R.; Jetschke, G. Bioclimatic Variables from Precipitation and Temperature Records vs. Remote Sensing-Based Bioclimatic Variables: Which Side Can Perform Better in Species Distribution Modeling? Ecol. Inform. 2020, 57, 101060. [Google Scholar] [CrossRef]
- Yang, J.; Huang, X. The 30 m Annual Land Cover Dataset and Its Dynamics in China from 1990 to 2019. Earth Syst. Sci. Data 2021, 13, 3907–3925. [Google Scholar] [CrossRef]
- Mills, S.C.; Socolar, J.B.; Edwards, F.A.; Parra, E.; Martínez-Revelo, D.E.; Quintero, J.M.O.; Haugaasen, T.; Freckleton, R.P.; Barlow, J.; Edwards, D.P. High Sensitivity of Tropical Forest Birds to Deforestation at Lower Altitudes. Ecology 2023, 104, e3867. [Google Scholar] [CrossRef] [PubMed]
- Cao, A.; Shi, X. The Effects of Climate Change on Habitat Connectivity: A Case Study of the Brown-Eared Pheasant in China. Land 2022, 11, 806. [Google Scholar] [CrossRef]
- Ghoddousi, A.; Bleyhl, B.; Sichau, C.; Ashayeri, D.; Moghadas, P.; Sepahvand, P.; Hamidi, A.K.; Soofi, M.; Kuemmerle, T. Mapping Connectivity and Conflict Risk to Identify Safe Corridors for the Persian Leopard. Landsc. Ecol. 2020, 35, 1809–1825. [Google Scholar] [CrossRef]
- Merow, C.; Smith, M.J.; Silander, J.A. A Practical Guide to MaxEnt for Modeling Species’ Distributions: What It Does, and Why Inputs and Settings Matter. Ecography 2013, 36, 1058–1069. [Google Scholar] [CrossRef]
- Hijmans, R.J.; Phillips, S.; Leathwick, J.; Elith, J. Dismo: Species Distribution Modeling; R Core Team: Vienna, Austria, 2023. [Google Scholar]
- Vignali, S.; Barras, A.G.; Arlettaz, R.; Braunisch, V. SDMtune: An R Package to Tune and Evaluate Species Distribution Models. Ecol. Evol. 2020, 10, 11488–11506. [Google Scholar] [CrossRef]
- Zhu, M.; Zhao, Y.; Li, W.; Han, X.; Wang, Z.; Yang, X.; Dang, C.; Liu, Y.; Xu, S. Impact of Carbon Neutralization Policy on the Suitable Habitat Distribution of the North China Leopard. Sci. Rep. 2024, 14, 18821. [Google Scholar] [CrossRef]
- Xu, L.; Fan, Y.; Zheng, J.; Guan, J.; Lin, J.; Wu, J.; Liu, L.; Wu, R.; Liu, Y. Impacts of Climate Change and Human Activity on the Potential Distribution of Aconitum Leucostomum in China. Sci. Total Environ. 2024, 912, 168829. [Google Scholar] [CrossRef]
- Vale, C.G.; Tarroso, P.; Brito, J.C. Predicting Species Distribution at Range Margins: Testing the Effects of Study Area Extent, Resolution and Threshold Selection in the Sahara-Sahel Transition Zone. Divers. Distrib. 2014, 20, 20–33. [Google Scholar] [CrossRef]
- Hofman, M.P.G.; Hayward, M.W.; Kelly, M.J.; Balkenhol, N. Enhancing Conservation Network Design with Graph-Theory and a Measure of Protected Area Effectiveness: Refining Wildlife Corridors in Belize, Central America. Landsc. Urban Plan. 2018, 178, 51–59. [Google Scholar] [CrossRef]
- He, F.; Tong, Z.; Hannaway, D.B.; Li, X. Erratic Precipitation and Clipping Frequency Reshape the Community Structure and Species Stability of Leymus Chinensis Steppe. Ecol. Indic. 2021, 133, 108432. [Google Scholar] [CrossRef]
- Zou, B.; Luo, G.; Zhu, B.; Ran, J.; Fang, C. The spatial distribution relationship between three pheasant species and mutual predator, the red fox (Vulpes vulpes), on the Western Sichuan Plateau. Biodivers. Sci. 2021, 29, 918–926. [Google Scholar] [CrossRef]
- Hu, W.; Wang, Y.; Zhang, D.; Yu, W.; Chen, G.; Xie, T.; Liu, Z.; Ma, Z.; Du, J.; Chao, B.; et al. Mapping the Potential of Mangrove Forest Restoration Based on Species Distribution Models: A Case Study in China. Sci. Total Environ. 2020, 748, 142321. [Google Scholar] [CrossRef] [PubMed]
- Kittle, A.M.; Watson, A.C.; Cushman, S.A.; Macdonald, D.W. Forest Cover and Level of Protection Influence the Island-Wide Distribution of an Apex Carnivore and Umbrella Species, the Sri Lankan Leopard (Panthera Pardus Kotiya). Biodivers. Conserv. 2018, 27, 235–263. [Google Scholar] [CrossRef]
- Yi, Z.; Zhou, W.; Razzaq, A.; Yang, Y. Land Resource Management and Sustainable Development: Evidence from China’s Regional Data. Resour. Pol. 2023, 84, 103732. [Google Scholar] [CrossRef]
- Zhu, M.; Zhao, Y.; Wang, M.; Zaman, M.; Jiang, G. Response of Wildlife Communities to Human Activities in the Distribution Area of the North China Leopard. Glob. Ecol. Conserv. 2024, 51, e02872. [Google Scholar] [CrossRef]
- Wang, J.; Lin, Y.; Glendinning, A.; Xu, Y. Land-Use Changes and Land Policies Evolution in China’s Urbanization Processes. Land. Use Policy 2018, 75, 375–387. [Google Scholar] [CrossRef]
- Amburgey, S.M.; Miller, D.A.W.; Rochester, C.J.; Delaney, K.S.; Riley, S.P.D.; Brehme, C.S.; Hathaway, S.A.; Fisher, R.N. The Influence of Species Life History and Distribution Characteristics on Species Responses to Habitat Fragmentation in an Urban Landscape. J. Anim. Ecol. 2021, 90, 685–697. [Google Scholar] [CrossRef]
- Zheng, K.; Wei, J.-Z.; Pei, J.-Y.; Cheng, H.; Zhang, X.-L.; Huang, F.-Q.; Li, F.-M.; Ye, J.-S. Impacts of Climate Change and Human Activities on Grassland Vegetation Variation in the Chinese Loess Plateau. Sci. Total Environ. 2019, 660, 236–244. [Google Scholar] [CrossRef]
- Li, Y.; Li, X.; Song, Z.; Ding, C. Determining the Distribution Loss of Brown Eared-Pheasant (Crossoptilon Mantchuricum) Using Historical Data and Potential Distribution Estimates. PeerJ 2016, 4, e2556. [Google Scholar] [CrossRef]
- Guo, X.; Zhang, Y.; Guo, D.; Lu, W.; Xu, H. How Does Ecological Protection Redline Policy Affect Regional Land Use and Ecosystem Services? Environ. Impact Assess. Rev. 2023, 100, 107062. [Google Scholar] [CrossRef]
- Beissinger, S.R.; MacLean, S.A.; Iknayan, K.J.; Valpine, P.D. Concordant and Opposing Effects of Climate and Land-Use Change on Avian Assemblages in California’s Most Transformed Landscapes. Sci. Adv. 2023, 9, eabn0250. [Google Scholar] [CrossRef] [PubMed]
- Fourcade, Y.; WallisDeVries, M.F.; Kuussaari, M.; Swaay, C.A.M.; Heliölä, J.; Öckinger, E. Habitat Amount and Distribution Modify Community Dynamics under Climate Change. Ecol. Lett. 2021, 24, 950–957. [Google Scholar] [CrossRef] [PubMed]
- Zhao, X.; Ma, X.; Chen, B.; Shang, Y.; Song, M. Challenges toward Carbon Neutrality in China: Strategies and Countermeasures. Resour. Conserv. Recycl. 2022, 176, 105959. [Google Scholar] [CrossRef]
- Brown, G.S.; DeWitt, P.D.; Dawson, N.; Landriault, L. Threshold Responses in Wildlife Communities and Evidence for Biodiversity Indicators of Sustainable Resource Management. Ecol. Indic. 2021, 133, 108371. [Google Scholar] [CrossRef]
- Ferreira, I.J.M.; Campanharo, W.A.; Fonseca, M.G.; Escada, M.I.S.; Nascimento, M.T.; Villela, D.M.; Brancalion, P.; Magnago, L.F.S.; Anderson, L.O.; Nagy, L.; et al. Potential Aboveground Biomass Increase in Brazilian Atlantic Forest Fragments with Climate Change. Glob. Change Biol. 2023, 29, 3098–3113. [Google Scholar] [CrossRef]
- Fletcher, R.J.; Robertson, E.P.; Poli, C.; Dudek, S.; Gonzalez, A.; Jeffery, B. Conflicting Nest Survival Thresholds across a Wetland Network Alter Management Benchmarks for an Endangered Bird. Biol. Conserv. 2021, 253, 108893. [Google Scholar] [CrossRef]
- Sinha, A.; Menzies, R.K.; Chatterjee, N.; Rao, M.; Naniwadekar, R. Drivers of Taxonomic, Phylogenetic, and Functional Beta Diversity of Himalayan Riverine Birds. Front. Ecol. Evol. 2022, 10, 788184. [Google Scholar] [CrossRef]
- Puri, M.; Srivathsa, A.; Karanth, K.K.; Patel, I.; Kumar, N.S. Links in a Sink: Interplay between Habitat Structure, Ecological Constraints and Interactions with Humans Can Influence Connectivity Conservation for Tigers in Forest Corridors. Sci. Total Environ. 2022, 809, 151106. [Google Scholar] [CrossRef]
- Sun, X.; Shen, J.; Xiao, Y.; Li, S.; Cao, M. Habitat Suitability and Potential Biological Corridors for Waterbirds in Yancheng Coastal Wetland of China. Ecol. Indic. 2023, 148, 110090. [Google Scholar] [CrossRef]
- Tian, Z.; Huo, D.; Yi, K.; Que, J.; Lu, Z.; Hou, J. Evaluation of Suitable Habitats for Birds Based on MaxEnt and Google Earth Engine—A Case Study of Baer’s Pochard (Aythya baeri) in Baiyangdian, China. Remote Sens. 2023, 16, 64. [Google Scholar] [CrossRef]
- Johnston, A.; Matechou, E.; Dennis, E.B. Outstanding Challenges and Future Directions for Biodiversity Monitoring Using Citizen Science Data. Methods Ecol. Evol. 2023, 14, 103–116. [Google Scholar] [CrossRef]
Disclaimer/Publisher’s Note: The statements, opinions and data contained in all publications are solely those of the individual author(s) and contributor(s) and not of MDPI and/or the editor(s). MDPI and/or the editor(s) disclaim responsibility for any injury to people or property resulting from any ideas, methods, instructions or products referred to in the content. |
© 2024 by the authors. Licensee MDPI, Basel, Switzerland. This article is an open access article distributed under the terms and conditions of the Creative Commons Attribution (CC BY) license (https://creativecommons.org/licenses/by/4.0/).