Article

Using Historical Habitat Shifts Driven by Climate Change and Present Genetic Diversity Patterns to Predict Evolvable Potentials of Taxus wallichiana Zucc. in Future

1
Institute of Ecology and Geobotany, Yunnan University, Kunming 650500, China
2
School of Ecology and Environmental Science, Yunnan University, Kunming 650500, China
3
Weixin National Basic Meteorological Station, Zhaotong 657900, China
*
Author to whom correspondence should be addressed.
Diversity 2024, 16(9), 511; https://doi.org/10.3390/d16090511
Submission received: 27 June 2024 / Revised: 16 August 2024 / Accepted: 19 August 2024 / Published: 23 August 2024

Abstract

:
Climate change is altering the geographical distribution and abundance of species. Abundant genetic variation generally indicates a stronger adaptability and evolutionary potentiality, especially in case of sharply changing climates or environments. With the past global climate fluctuations, especially the climate oscillation since the Quaternary, the global temperature changes related to glaciation, many relict plant species have formed possible refugia in humid subtropical/warm temperate forests, thus retaining a high level of genetic diversity patterns. Based on the contraction and expansion of the geographical distribution of Taxus wallichiana Zucc. in the past driven by climate change, combined with the contemporary genetic diversity modeling, the distribution performance of Taxus wallichiana Zucc. in future climate change was predicted. The areas of highly suitable habitat will increase with climate change in the future. There were continuous and stable high suitable areas of T. wallichiana in the southeastern Tibet and northwestern Yunnan as long-term stable climate refugia. We made the genetic landscape surface of T. wallichiana complex and discovered geographical barriers against gene flow. Genetic barriers spatially isolated the center of genetic diversity into three regions: west (east Himalaya), middle (Yunnan plateau, Sichuan basin, Shennongjia, and the junction of Guizhou and Guangxi provinces), and east (Mt. Huangshan and Fujian). Southern Tibet was isolated from other populations. The central and western Yunnan, the Sichuan basin, and surrounding mountains were isolated from the southern China populations. We found that the positive correlationships between the present species genetic diversity and suitability index during LGM, MH, and 2070. This infers that T. wallichiana has provisioned certain genetic diversity and has strong evolutionary potential under conditions of climate change.

1. Introduction

Contemporary genetic diversity of a species is the result of historical evolution, and plays an important role in the long-term survival of species, present micro-evolution processes, and future evolutionary flexibility [1,2,3,4,5,6]. Abundant genetic variation generally indicates a strong adaptability and evolutionary potentiality, especially in case of sharply changing climates or environments [4,7]. Maintenance of the genetic diversity in a species is vital for its adaptation to environmental changes, e.g., habitat loss and/or fragmentation, anthropogenic climate change, or diseases, as these processes might lead to population decline and even to species extinctions worldwide [8,9].
Climate change is capable of producing large habitat shifts of many species [10,11,12], thus altering their geographical distribution [9,13,14,15]. For example, during the Quaternary climatic oscillations, plant distribution ranges went through repeated episodes of contraction and expansion, following global changes in temperature and precipitation [13,16,17,18,19,20]. Such climate-driven patterns had dramatic effects on species ranges, causing isolation, migration, and extinction of populations, often promoting differentiation [18,21,22]. Plant species usually shifted to higher latitudes and elevations to sustain their populations in climate warming periods [23]. Meanwhile, the repeated glacial cycles dramatically shaped the pattern of genetic diversity and genetic structure of many temperate plant species [16,17,19]. In the future, global warming may lead to significant changes in regional and seasonal climate patterns. Such changes can strongly influence the distribution of species, with the associated changes in species diversity patterns and in ecosystem composition [14,24]. Médail and Diadema (2009) defined these special areas that have often persisted through several palaeogeographical and climatic events as ‘cumulative refugia’ and ‘microhabitats’ [25].
The Himalayan yew, Taxus wallichiana Zucc. (Taxaceae), is a relict tree species that originated in the late Miocene–early Pliocene [26], or perhaps, somewhat later [27]. At the same time, it is a rare and endangered tree species and distributed mainly in Nepal, North India, Bhutan, and southwest China [28,29]. According to Flora of China [30], T. wallichiana includes three varieties, T. w. var. wallichiana, T. w. var. mairei (Lemée and H. Léveillé) L.K. Fu and Nan Li, and T. w var. chinensis (Pilger) Florin [30,31], although some authors consider that the three taxa should be recognized as T. wallichiana complex [32,33] or at this specific rank [34]. Taxus is economically important as the source of paclitaxel (commercially known as Taxol), a cancer-inhibiting compound in the bark of yew trees [18], which has led to an overexploitation of T. wallichiana along the Himalaya and in China. Illegal overexploitation of the species due to ever-increasing demand for Taxol has endangered the species [23]. It is seriously threatened with extinction at a global level, and has been listed in Appendix II of CITES (Convention on International Trade in Endangered Species of Wild Fauna and Flora; available from http://www.cites.org/eng/app/appendices.shtml#10 (accessed on 13 June 2024)) and as an “endangered” (EN) species in the International Union for Conservation of Nature (IUCN) Red List of Threatened Species [28]. In China, T. wallichiana is included within the Grade I category in National Protected Plants (available from https://www.forestry.gov.cn/c/www/gkzcjd/1115.jhtml (accessed on 20 May 2023)), and according to the most updated national red list of gymnosperms, the three taxa are listed as either “vulnerable” (VU) or EN [35].
Predicting the impact of climate change on species distribution of endangered species is the basis for identifying priority areas and putting in place strategies to conserve them (e.g., nature reserves) [36,37]. These priority areas could be long-term stable refugia (climatically suitable areas that allowed the persistence of a given species in the past but also in the future) and/or genetic refugia (i.e., regions with high levels of genetic diversity). Ecological niche modeling (ENM), which allows predicting species’ niches in changing environmental conditions, has been successfully used to detect long-term stable refugia, both for single species [38] or when a large number of species are combined [21,39]. Although there are some ENM attempts to predict the potential distribution range of T. wallichiana [9,16,36], they are partially either regarding the geographic range or time scale. Identifying areas suitable for the occurrence of T. wallichiana along time scale is crucial, as it has a relatively restricted and scattered geographical distribution [28,40], and a weak ecological adaptability, e.g., poor seed regeneration, and, a long pre-reproductive phase in nature [36]. Global warming, in addition, greatly has accelerated, especially in some of the areas supporting habitats suitable for T. wallichiana [41,42,43]. Regarding its genetic variation, the various surveys of T. wallichiana using different markers (SSR, RAPD, ISSR, and AFLP [29,44,45,46,47]; see Table 1) provide us a very valuable set of data to visualize the geographic variation of genetic diversity, i.e., we could create “genetic landscape” surfaces from multiple sources of genetic data [48,49,50]. According to Laurie et al. (2014), a successful landscape genetics study should combine genetic and landscape or environmental data to make spatially explicit conclusions about factors affecting gene flow or selection, and these data have to be obtained through hypothesis-driven research [51].
Due to similar morphological characteristics, high phenotypic plasticity within species, and hybridization in evolutionary history, the taxonomic history of Taxus species has been complicated and uncertain [26,27,52]. Here, we take T. wallichiana as a species complex to integrate its genetic variation pattern at the population level. Combining ENM [16] and genetic landscape changes visualized by the distribution of genetic diversity across geographic space [53], we wanted to fully understand the distribution pattern of T. wallichiana and the evolutionary processes affecting the species under different climatic conditions (i.e., past periods and future climate scenarios). Specifically, we aimed to shed light on the following questions: (1) Does T. wallichiana show a higher habitat suitability in the past, as would be expected for a relict species? (2) Is the genetic variation spatially correlated with suitable habitats in the past, or at present? (3) Have the various climatic variables had a differential contribution to T. wallichiana habitat shift?
Table 1. Summary of genetic diversity (GD) of Taxus wallichiana complex by different genetic markers.
SpeciesMarkersPopulationsIndividualsPrimersGD (Mean ± SE)
T. wallichiana. var. wallichianaRFLP [18]501235190.2518 (0.0301)
T. wallichiana. var. maireiISSR [54]17464120.2071 (0.0098)
T. wallichiana. var. wallichianaAFLP [2]972300.3193 (0.0120)
T. wallichiana. var. maireiISSR [55]1530080.3685 (0.0045)
T. wallichiana. var. maireiISSR [56]712280.1666 (0.0118)
T. wallichiana. var. maireiAFLP [57]550150.5188 (0.0098)
T. wallichiana. var. maireiSSR [4]13130160.5378 (0.0193)
T. wallichiana. var. wallichianaSSR [29]399100.4483 (0.0833)
T. wallichiana. var. wallichianaHaplotype [19]481230190.2627 (0.0320)
T. wallichiana. var. maireiISSR [58]11219130.2015 (0.0031)
T. wallichiana. var. wallichianaSSR [8]14288110.3704 (0.0253)
T. wallichiana. var. wallichiana & T. wallichiana. var. maireiSSR [41]20330100.4076 (0.0135)
T. wallichiana. var. wallichianaSSR [59]2136110.4850 (0.0320)
T. wallichiana. var. maireiRAPD [60]6NA100.2671 (0.0146)
T. wallichiana. var. wallichiana & T. wallichiana var. chinensisSSR [61]1029760.1165 (0.0052)
T. wallichiana. var. maireiSSR [6]25533130.4110 (0.0415)
T. wallichiana. var. maireiSSR [62]22339290.1452 (0.0420)

2. Materials and Methods

2.1. Data Collection

Genetic diversity of T. wallichiana complex was fully surveyed in the literature by using the terms ‘Taxus wallichiana’ and ‘genetic diversity’ as keywords in the Web of Science (http://webofscience.com (accessed on 12 March 2021)). A total of 17 scientific papers with 255 sampled populations, each one with the species name, population genetic diversity, sampling sites with longitude and latitude, were retrieved (Table 1) (see Table S1).
The current distribution information of T. wallichiana was obtained from the GBIF database (http://www.gbif.org (accessed on 12 March 2021), 16 occurrence records), the Chinese Virtual Herbarium (CVH, http://www.cvh.org.cn (accessed on 12 March 2021), 76 records), field survey (80 records), and 55 records from a previous study [36]. Finally, 482 occurrences were used (Table S2).
Climate data of five periods based on 19 bioclimatic variables (Table 2) were obtained from the WorldClim database (http://www.worldclim.org (accessed on 11 May 2021)) [63]. The five periods are: the last interglacial (LIG, 120–140 ka), the last glacial maximum (LGM; ~21 ka), mid-Holocene (MH, ~6000 year), current time (~1970–2000), and future climate scenarios (~2070, average for 2061–2080, RCP2.6, RCP4.5, RCP8.5). For the past (LGM and the mid-Holocene) and future (~2070), we employed data derived from the Community Climate System Model Version 4 (CCSM4) [64]. The data resolution of LGM is 2.5 arc min, the other four periods are 30 arc seconds.

2.2. Data Cleaning

The buffer analysis was used to screen and proofread the distribution data of T. wallichiana, and exclude the data with too many distribution records caused by artificial factors [65]. Since the lowest spatial resolution used in this paper was 2.5 arc min (ca. 4.5 km), the buffer zone was set to 4 km. When two or more distribution occurrences were in the same buffer zone, one point was reserved. According to the requirements of Maxent software (3.4.4), the distribution points with longitude and latitude were generated as a csv format file.
Due to the variety in the genetic diversity index, there were different dimensions and orders of magnitude in population genetic variation by different genetic markers. If the original values were directly used for analysis, it would highlight the role of indicators with higher numerical values in the comprehensive analysis, and relatively weaken the role of indicators with lower numerical levels. Therefore, in order to ensure the reliability of the results, it was necessary to standardize the original genetic diversity index data. We use the min-max normalization method to standardize the diversity data [66]. A low standard error (SE) is suggestive of consistent patterns across multiple molecular markers. Finally, we obtained 343 points of the species distribution, in which 255 points (populations) had genetic diversity values (Figure 1).

2.3. Data Analysis

2.3.1. Ecological Niche Modeling (ENM)

Distribution data and environmental variables were put into species distribution models (SDMs) to estimate species niches based on a species algorithm, and then the results were projected onto the landscape which could be interpreted as the probability of species occurrence, habitat suitability, or species richness [19,20,67]. The maximum entropy (MaxEnt 3.4.4) model was used to analyze the integration of related environmental data and actual species occurrences. It showed species suitability under different environmental variables in each grid, and the grid shows the regions which have the most suitable climatic and environmental conditions for the survival of a certain species [68].
We used all the 19 bioclimatic layers as predictor variables to build the initial models. In order to remove multicollinearity among variables, a Pearson’s correlation (r) matrix (Table S3) was computed with the R package for all bioclimatic variables [36]. Then, on the basis of importance values of predictors (Table S4) and Pearson’s correlation coefficient between the predictor variables [16], the input variables for distribution simulation were selected according to the rule |r| < 0.80 [36]. Finally, seven variables, Bio5, Bio7, Bio11, Bio12, Bio13, Bio15, and Bio19 were used for building the final models.
The study area was first classified as either a non-suitable area (0–0.05) or a suitable area (0.05–1.00), and the suitable areas were further classified as marginally suitable (0.05–0.33), moderately suitable (0.33–0.66), and highly suitable (0.66–1.00) [36]. Model performance was evaluated using the area under the receiver operating characteristic curve (AUC) which was calculated by Maxent. The values that are greater than 0.9 indicate good discrimination [69]. The key parameter was set as follows: random test percentage = 25. Finally, the importance of environmental variables was determined by a jackknife test during modeling [70].

2.3.2. Identifying Long-Term Stable Refugia

Refugium is regarded as the geographical region where a species inhabits during the period of a glacial/interglacial cycle that represents the species’ maximum contraction in geographical range so that distinct genetic lineages have always existed [70]. Refugia can also be defined as “areas where local populations of a species can persist through periods of unfavorable regional climate”, and being habitats where species may survive or potentially expand under a changing environment [21]. Meanwhile, there is large variation in both the size of refugia and the duration during which species are confined to them. This has implications for the role of refugia in the evolution of species and their genetic diversity [70]. We overlapped the high and moderate suitability of the past (the LIG, LGM, and the mid-Holocene), the present, and the future (2070 RCP4.5) to identify T. wallichiana’s long-term stable climate refugia.

2.3.3. Mapping the Genetic Diversity Pattern of T. wallichiana

We mapped genetic diversity patterns using the Genetic Landscape GIS Toolbox [49,50] in ArcGIS. This single species diversity tool creates a genetic landscape similar to the genetic divergence tool, but it is based on within-site population genetic diversity for multiple populations or sampling points within a species. Dependent on population distribution coordinates and its genetic diversity measure, the inverse distance weighted (IDW) interpolation was used to generate a landscape surface with genetic diversity values. To avoid extrapolating beyond the original collection locations, the genetic landscape was clipped to the extent of the input occurrences (sampling extent) and to the boundaries of the analyzed area. Two output surfaces will be created, one with the raw values and another with the values scaled between 0 and 1 [48].

2.3.4. Identify Geographic Barriers

The computational geometry method was used to identify geographic barriers, for it provided the location and direction of obstacles, and it could show the similarity of the geographic patterns of two or more variables. We implemented the Monmonier’s (1973) maximum difference algorithm in BARRIER v2.2 software [71] to identify genetic barriers. The algorithm is highly reliable and can also be applied to non-genetic data, if sampling locations and a distance matrix between corresponding data are available. Therefore, genetically associated populations could be visualized on a geographic map and the areas where genetic barriers of more robust could be identified. With several higher genetic discontinuities obtained, the genetic discontinuities were then adjusted spatially in ArcGIS.

2.3.5. Statistic Analysis

Genetic diversity status of T. wallichiana responding to the present and historical climate condition was used to infer potential adaptation capacity in future climate scenarios. Points extracted from the genetic diversity landscape raster and the potential niche model prediction raster were used to analyze the correlationship between them. Correlation and significance tests were analyzed by “Hmisc” package in R 4.5 [72].
The contribution rate for each factor was automatically computed with the Maxent model by jackknife method. Then, a random forest model (randomForest 4.6–14 in R) was used to analyze the contribution rate of 7 climatic factors (variables used in the second Maxent modeling) to the level of genetic diversity of T. wallichiana complex and compared with the results of the jackknife method.

3. Results

3.1. Potential Suitable Distribution

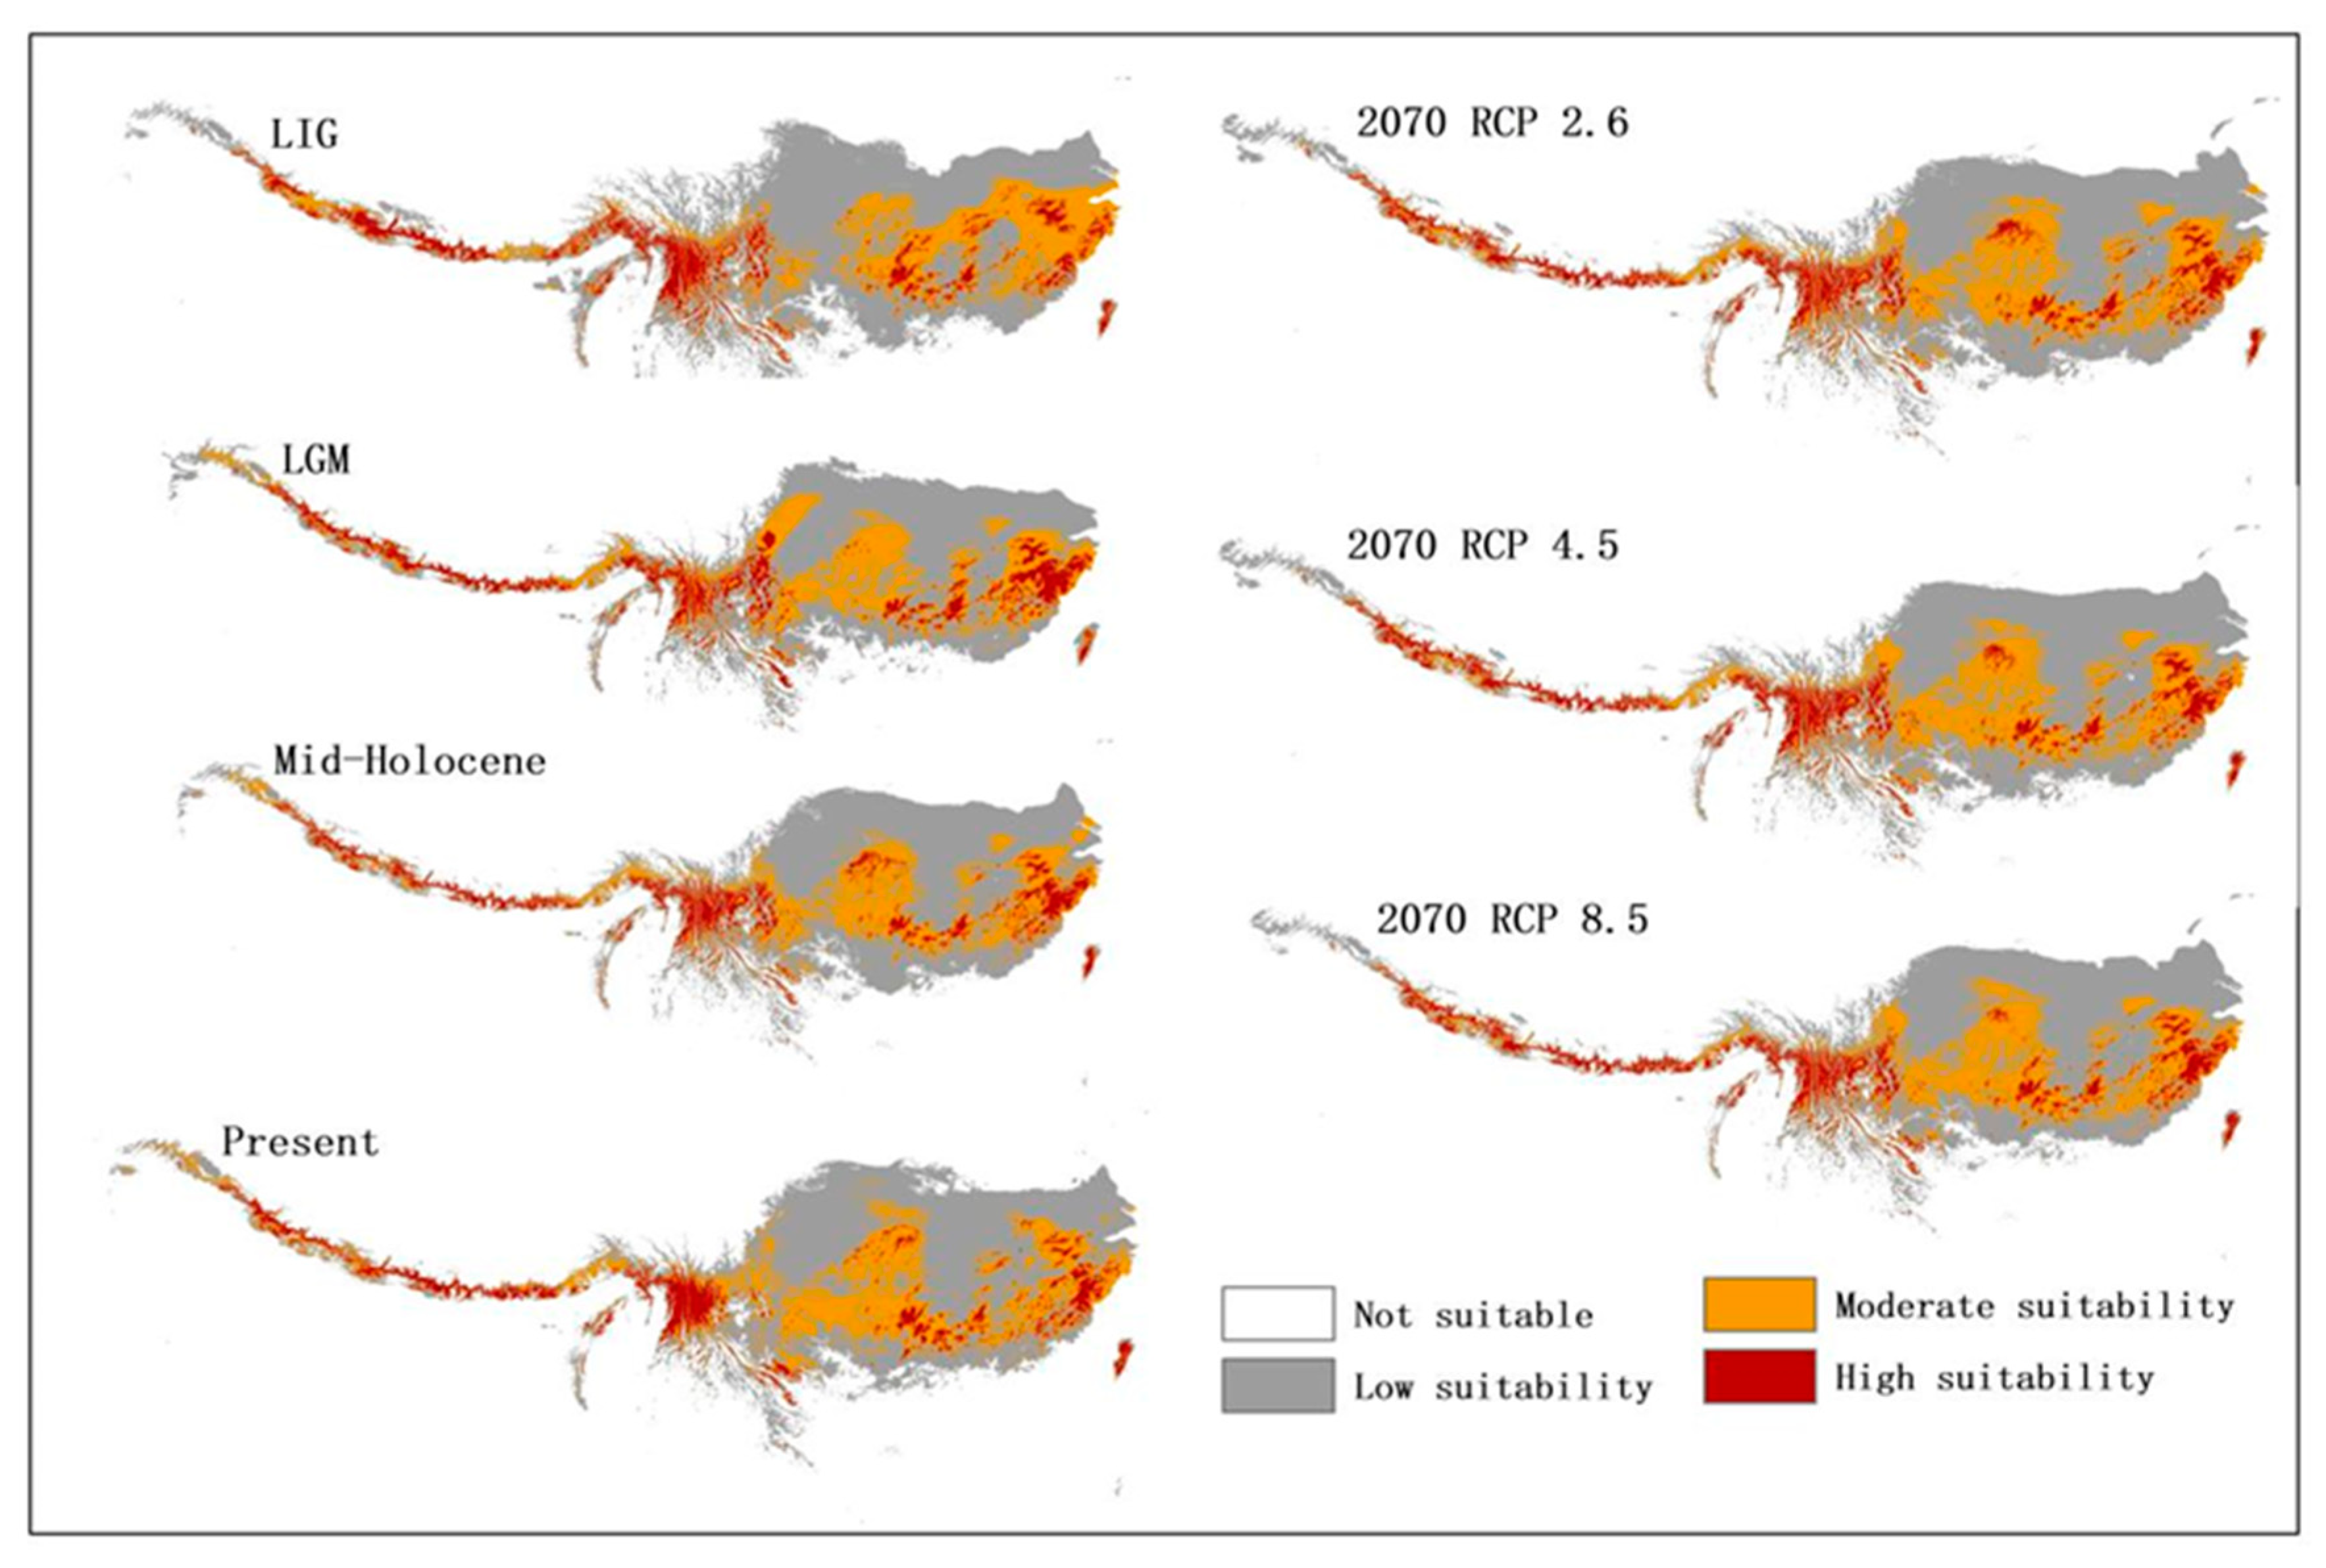
Among the 343 simulations, the average AUC of the simulated training data and test data were 0.921 and 0.911, indicating that all the training data and test data simulations showed good performance. T. wallichiana complex was mainly distributed in Nepal, north India, northeastern/northwestern Yunnan, southern Sichuan, and the border between Fujian and Zhejiang region in China during historical phases (LIG, ~120–140 ka; LGM, ~21 ka; MH, ~6000 year), contemporary phase (1970–2000), and in the future scenarios (2070s) (Figure 2). Comparing the highly suitable areas in each period, it was 17.10 × 10⁴ km2 in the LIG, 18.45 × 10⁴ km2 in the LGM, 19.42 × 10⁴ km2 in the MH, 16.84 × 10⁴ km2 at present, and respectively 18.55 × 10⁴ km2, 17.60 × 10⁴ km2, and 18.86 × 10⁴ km2 in the future scenarios of 2070RCP2.6, 2070RCP4.5, 2070RCP8.5. The area of the highly suitable habitat increased since the LIG period. It had the largest area in the MH period. Then, it dropped to the lowest area in contemporary time. Under the RCP2.6, RCP4.5, and RCP8.5 scenarios, the areas of highly suitable habitat will increase with climate change in the future (Table S5).

3.2. Habitat Suitability Change and the Centroid Shifts

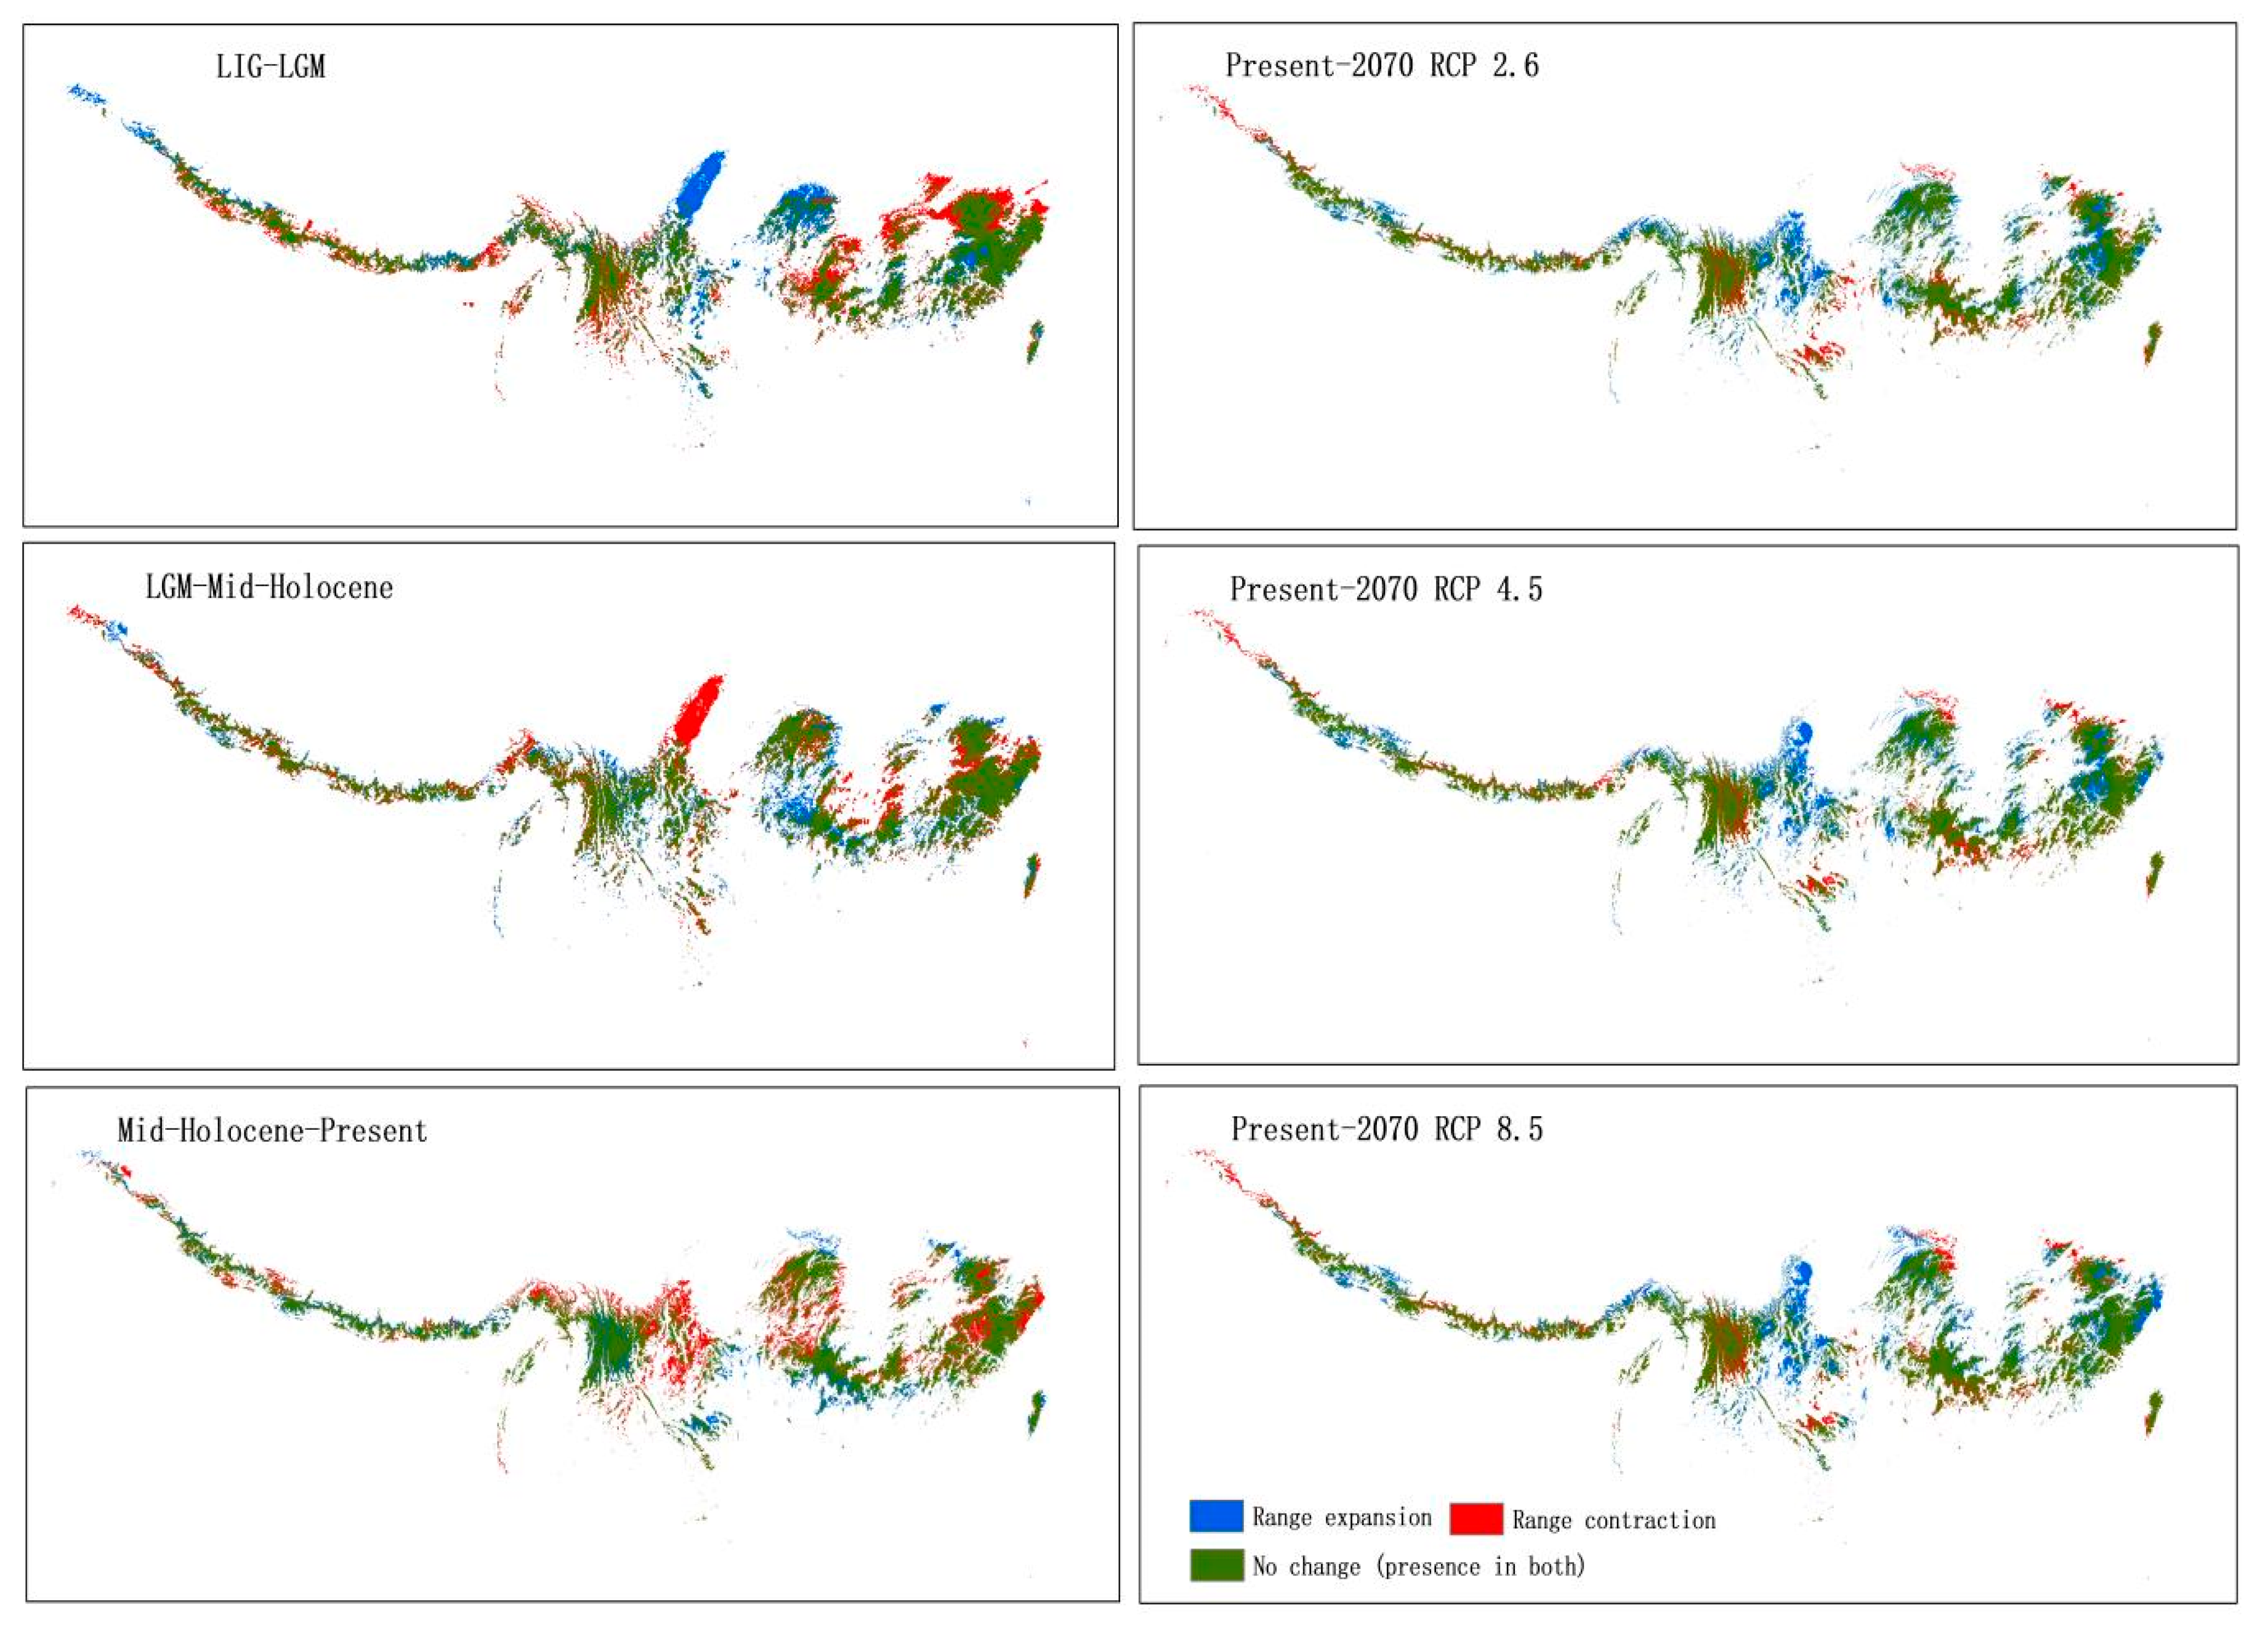
During the LIG–LGM period, the T. wallichiana populations contracted and expanded more significantly than in other periods (suitable levels > 0.5). In the LIG–LGM period, the range of T. wallichiana’s ecologically suitable areas had the largest area of contraction, as well as of expansion. From the present to the future, there was an increase in its ecologically suitable zone (Figure 3). The specific expansion and contraction areas for each period are shown in Table 3. Climate change in historical periods has produced a more obvious contraction of T. wallichiana than expansion. However, under future climate warming scenarios, T. wallichiana will expand greater than it will contract.
From the past to the present period, the contraction areas mainly occurred in the surrounding mountains of the Sichuan basin and south China (south of the Yangtze River). Similarly, under different RCPs in the future, the expansion of T. wallichiana’s suitable areas would still occur in these areas. On the contrary, there were consistent highly suitable areas of T. wallichiana complex in southeastern Tibet and northwestern Yunnan (Figure 3).
Although the expansion and contraction of T. wallichiana were obvious in each period, the distance of its centroid shift was not great, i.e., the distribution center of suitable areas had not changed much (Figure 4). The distribution range of its centroid was maintained at around 27° N–105° E. Also, in the RCP 8.5 scenario, the centroid shift distance was the largest, followed by the LIG–LGM period. This indicated that the amplitude of the climate oscillation had less influence on the distance of the center of mass transfer in the suitable region. We observed that the populations of T. wallichiana underwent a westward shift during the last glaciation, mid-Holocene, and present time. Correspondingly, the center would shift eastward if the temperature rose up in the future, and if the temperature rose up more, the change would be greater. Therefore, it might infer that the center would move westward as the temperature decreased, and it would move eastward as climate warming persisted (Table S6).

3.3. Long-Term Stable Refugia of Taxus wallichiana

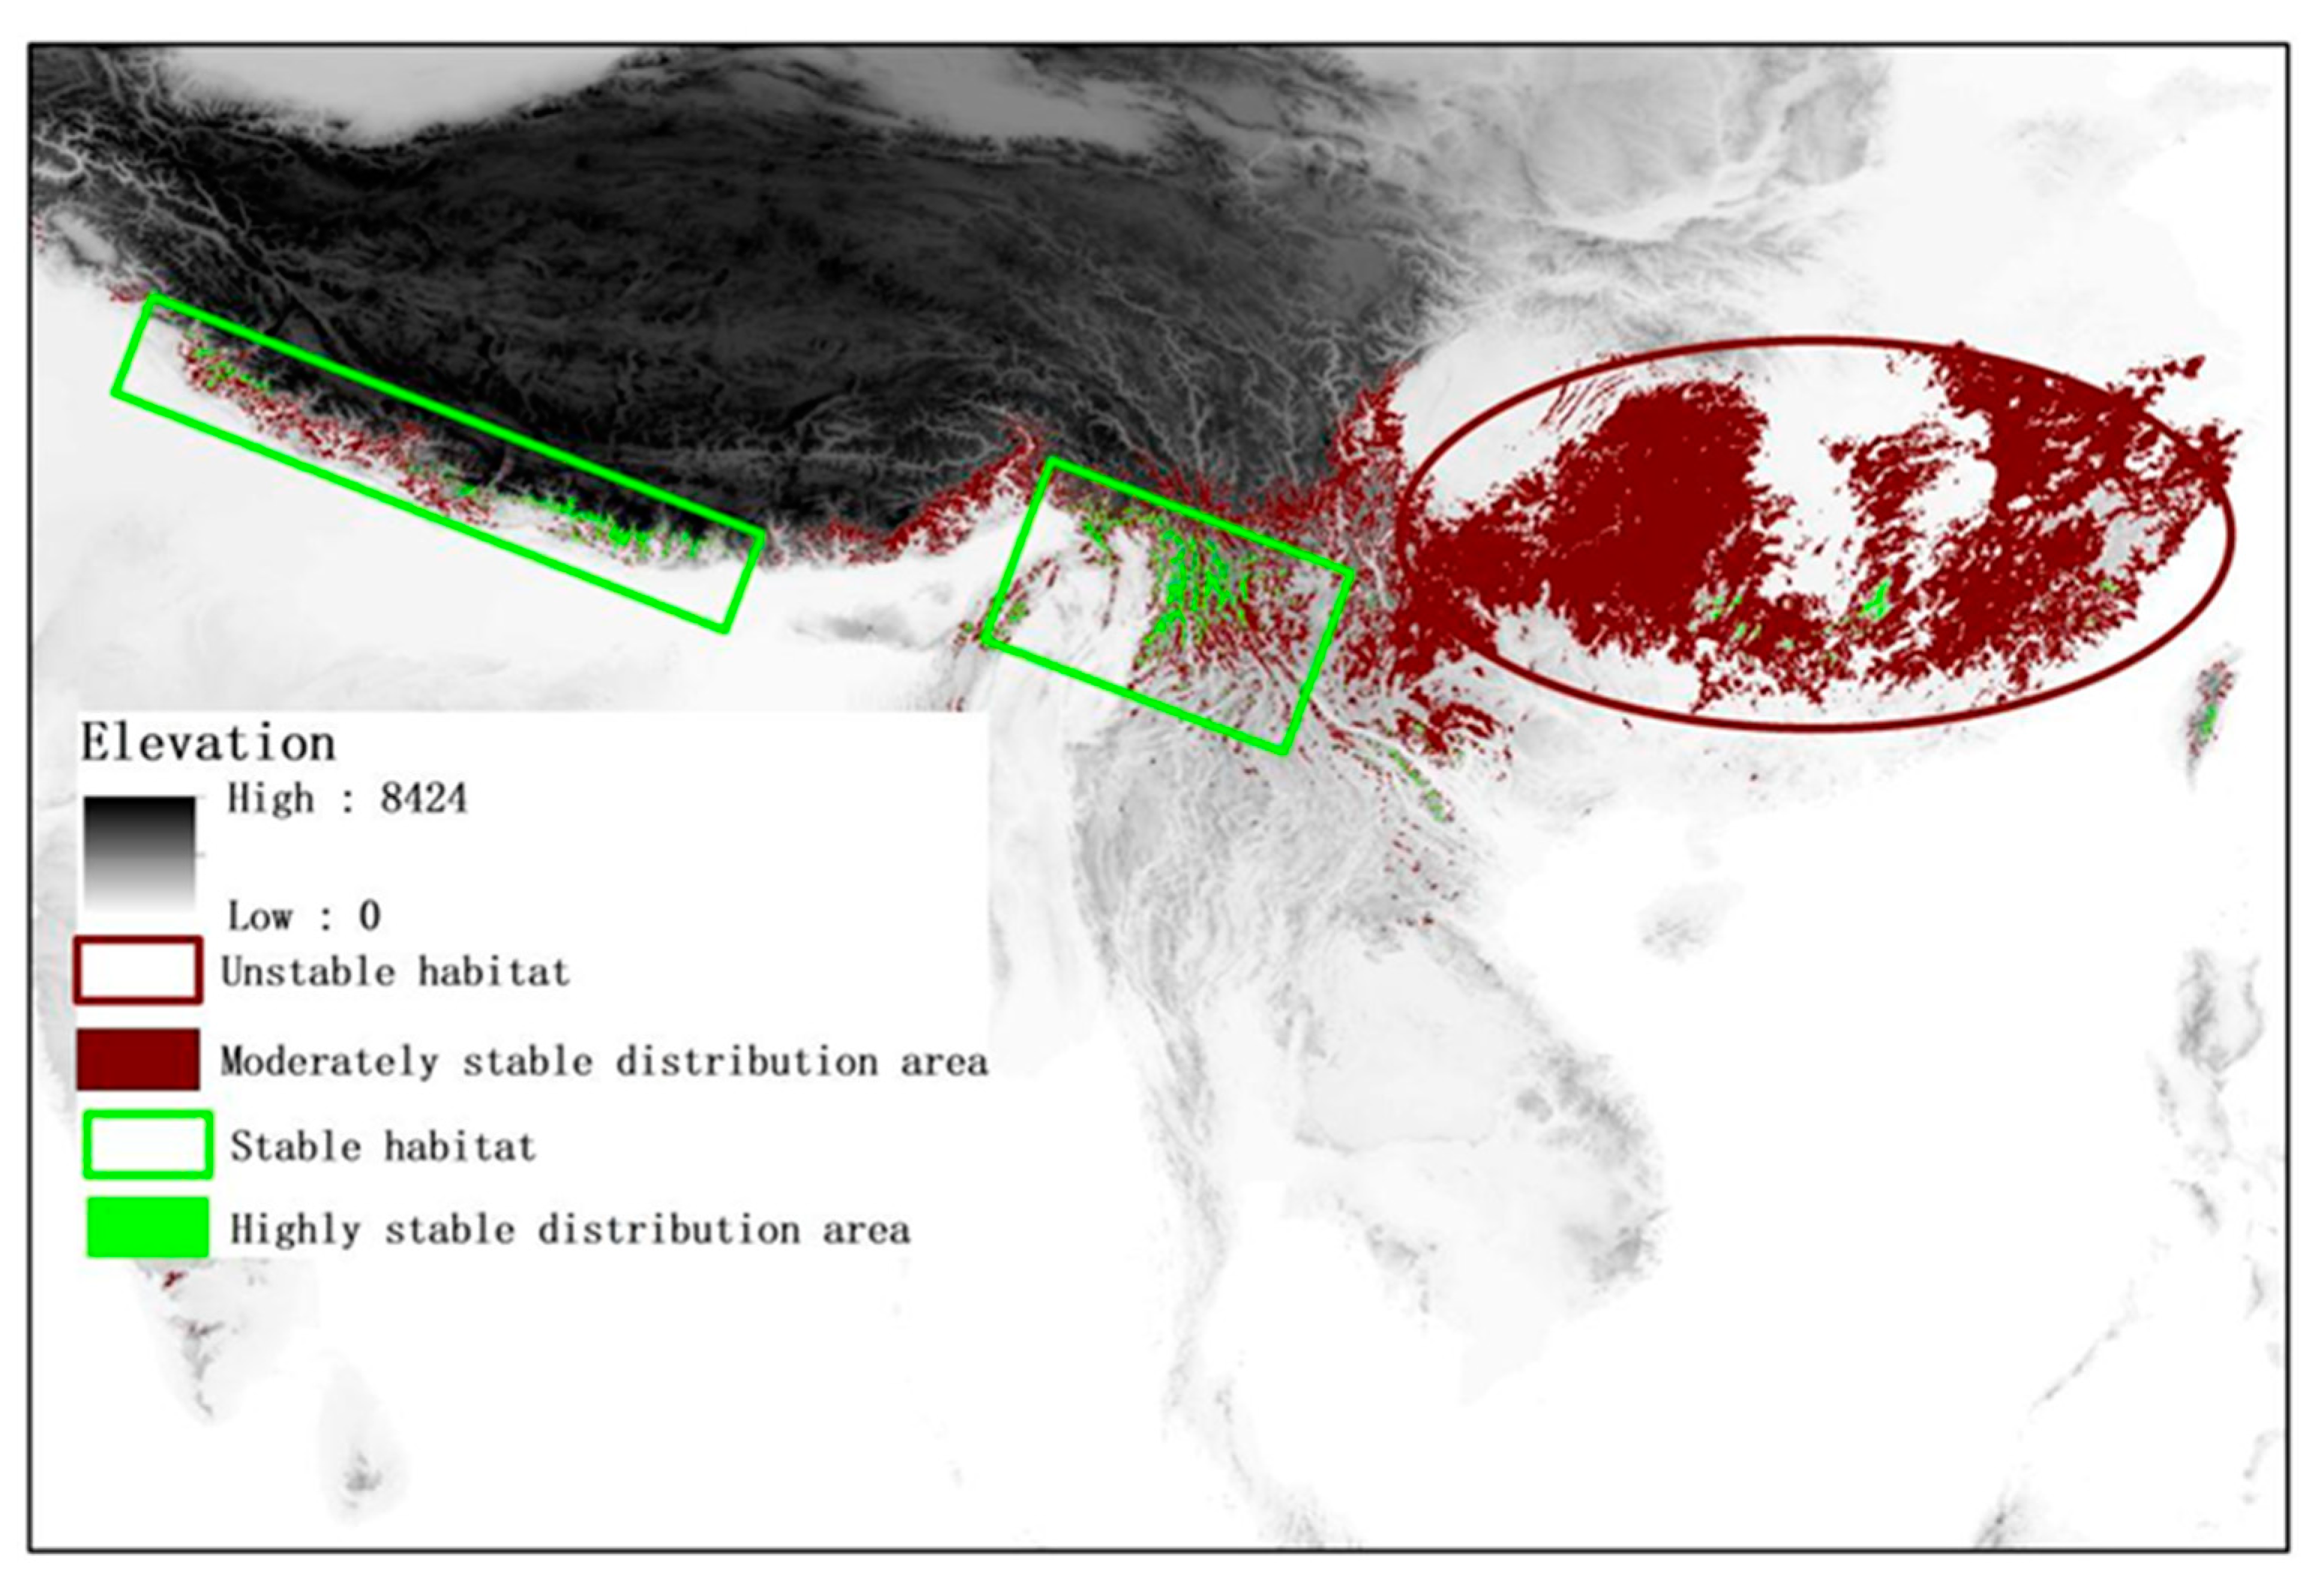
The modeling results of the predicted species distributions under past, present, and future climate conditions were intersected to predict stable areas (in which the species always potentially occupied) and unstable areas. The overlapping of the five climate periods high and moderate suitable zone (LIG, LGM, MH, present, and 2070 RCP 4.5, suitable levels > 0.33) was treated as long-term refugia for the species under climate change (Figure 5). The high suitability level (>0.66) had a stable area of 37,039.83 km2, the moderate suitability level (>0.33) showed that the potential areas was 945,232.60 km2. The refugia which overlapped in the highly suitable areas were more consistent with the distribution of refugia for actual species under climate changes, which mainly occupied mountainous areas, e.g., Nepal, north India, northwestern Yunnan and Gaoligong Mountains (Figure 5).
The moderately stable distribution areas were concentrated in the surrounding mountains of the Sichuan basin and south China (Figure 5). South China had the largest moderately stable area, but it was unstable and was disturbed more by climate change. Furthermore, there might be periodic extinctions of local populations. There were long-term stable climate refugia in southeast Tibet and northwest Yunnan with the largest area, and some small climate refugia also existed in southern China.

3.4. Patterns of Contemporary Genetic Diversity in Taxus wallichiana Complex

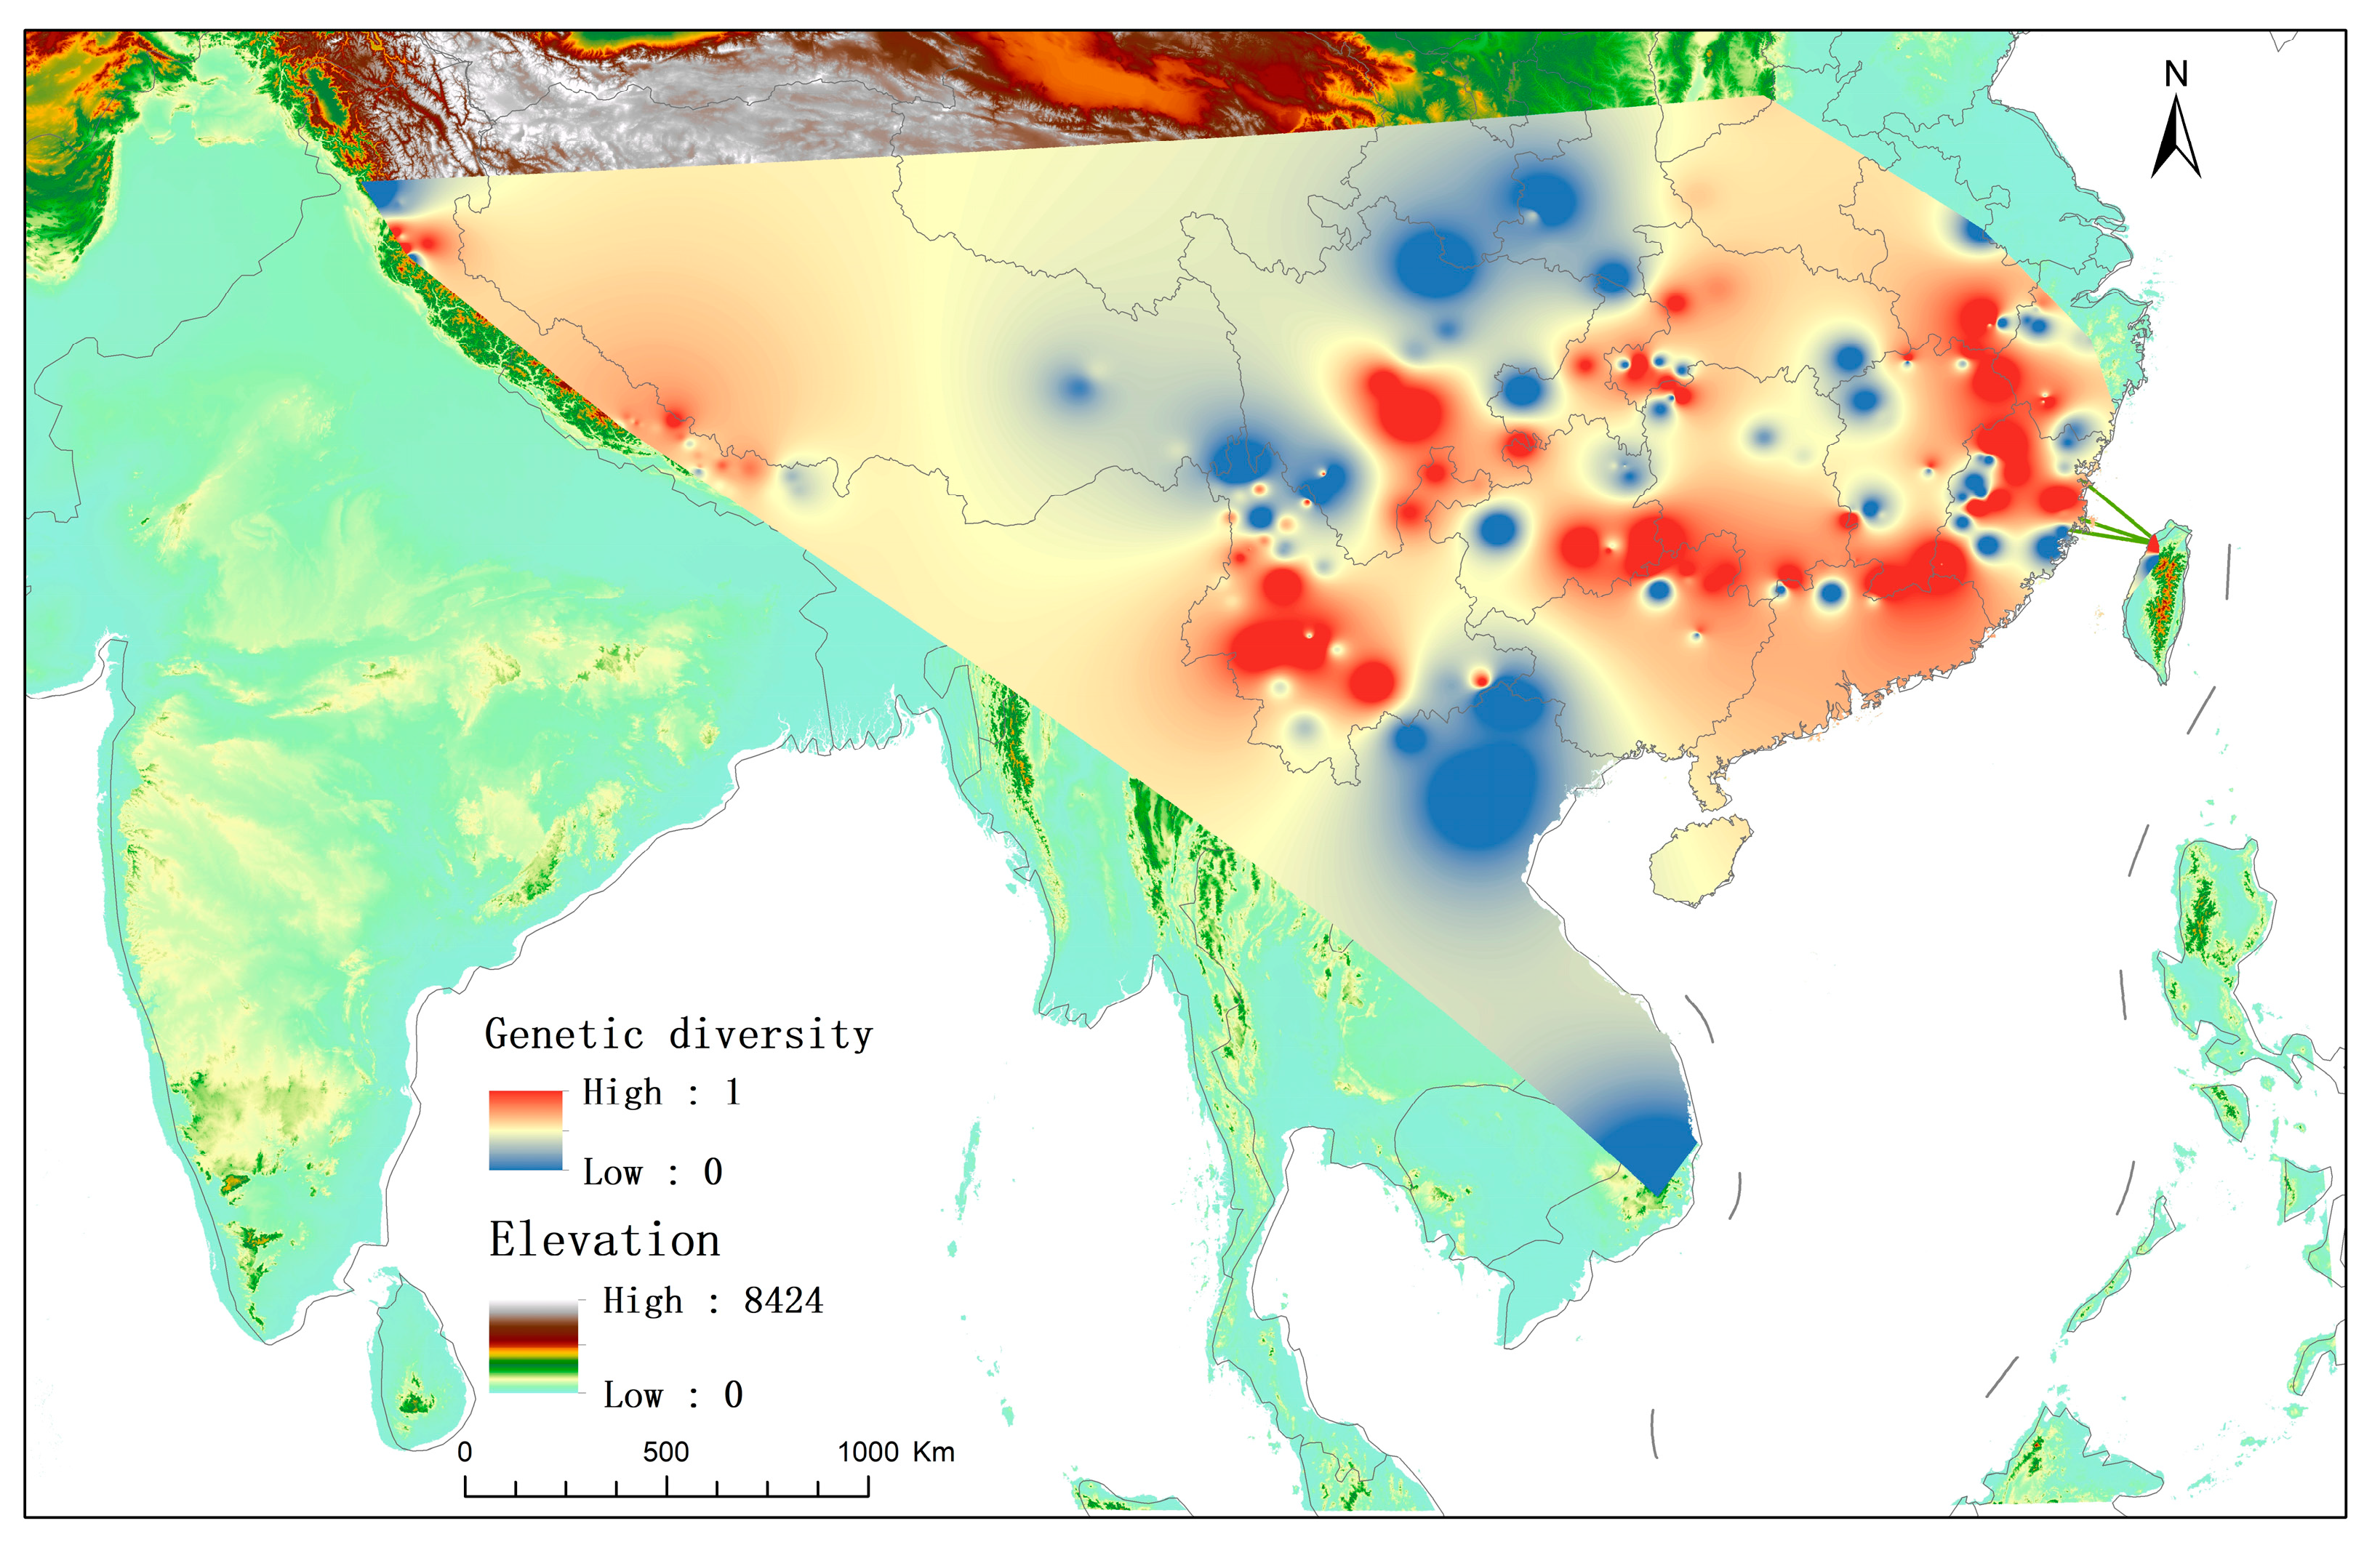
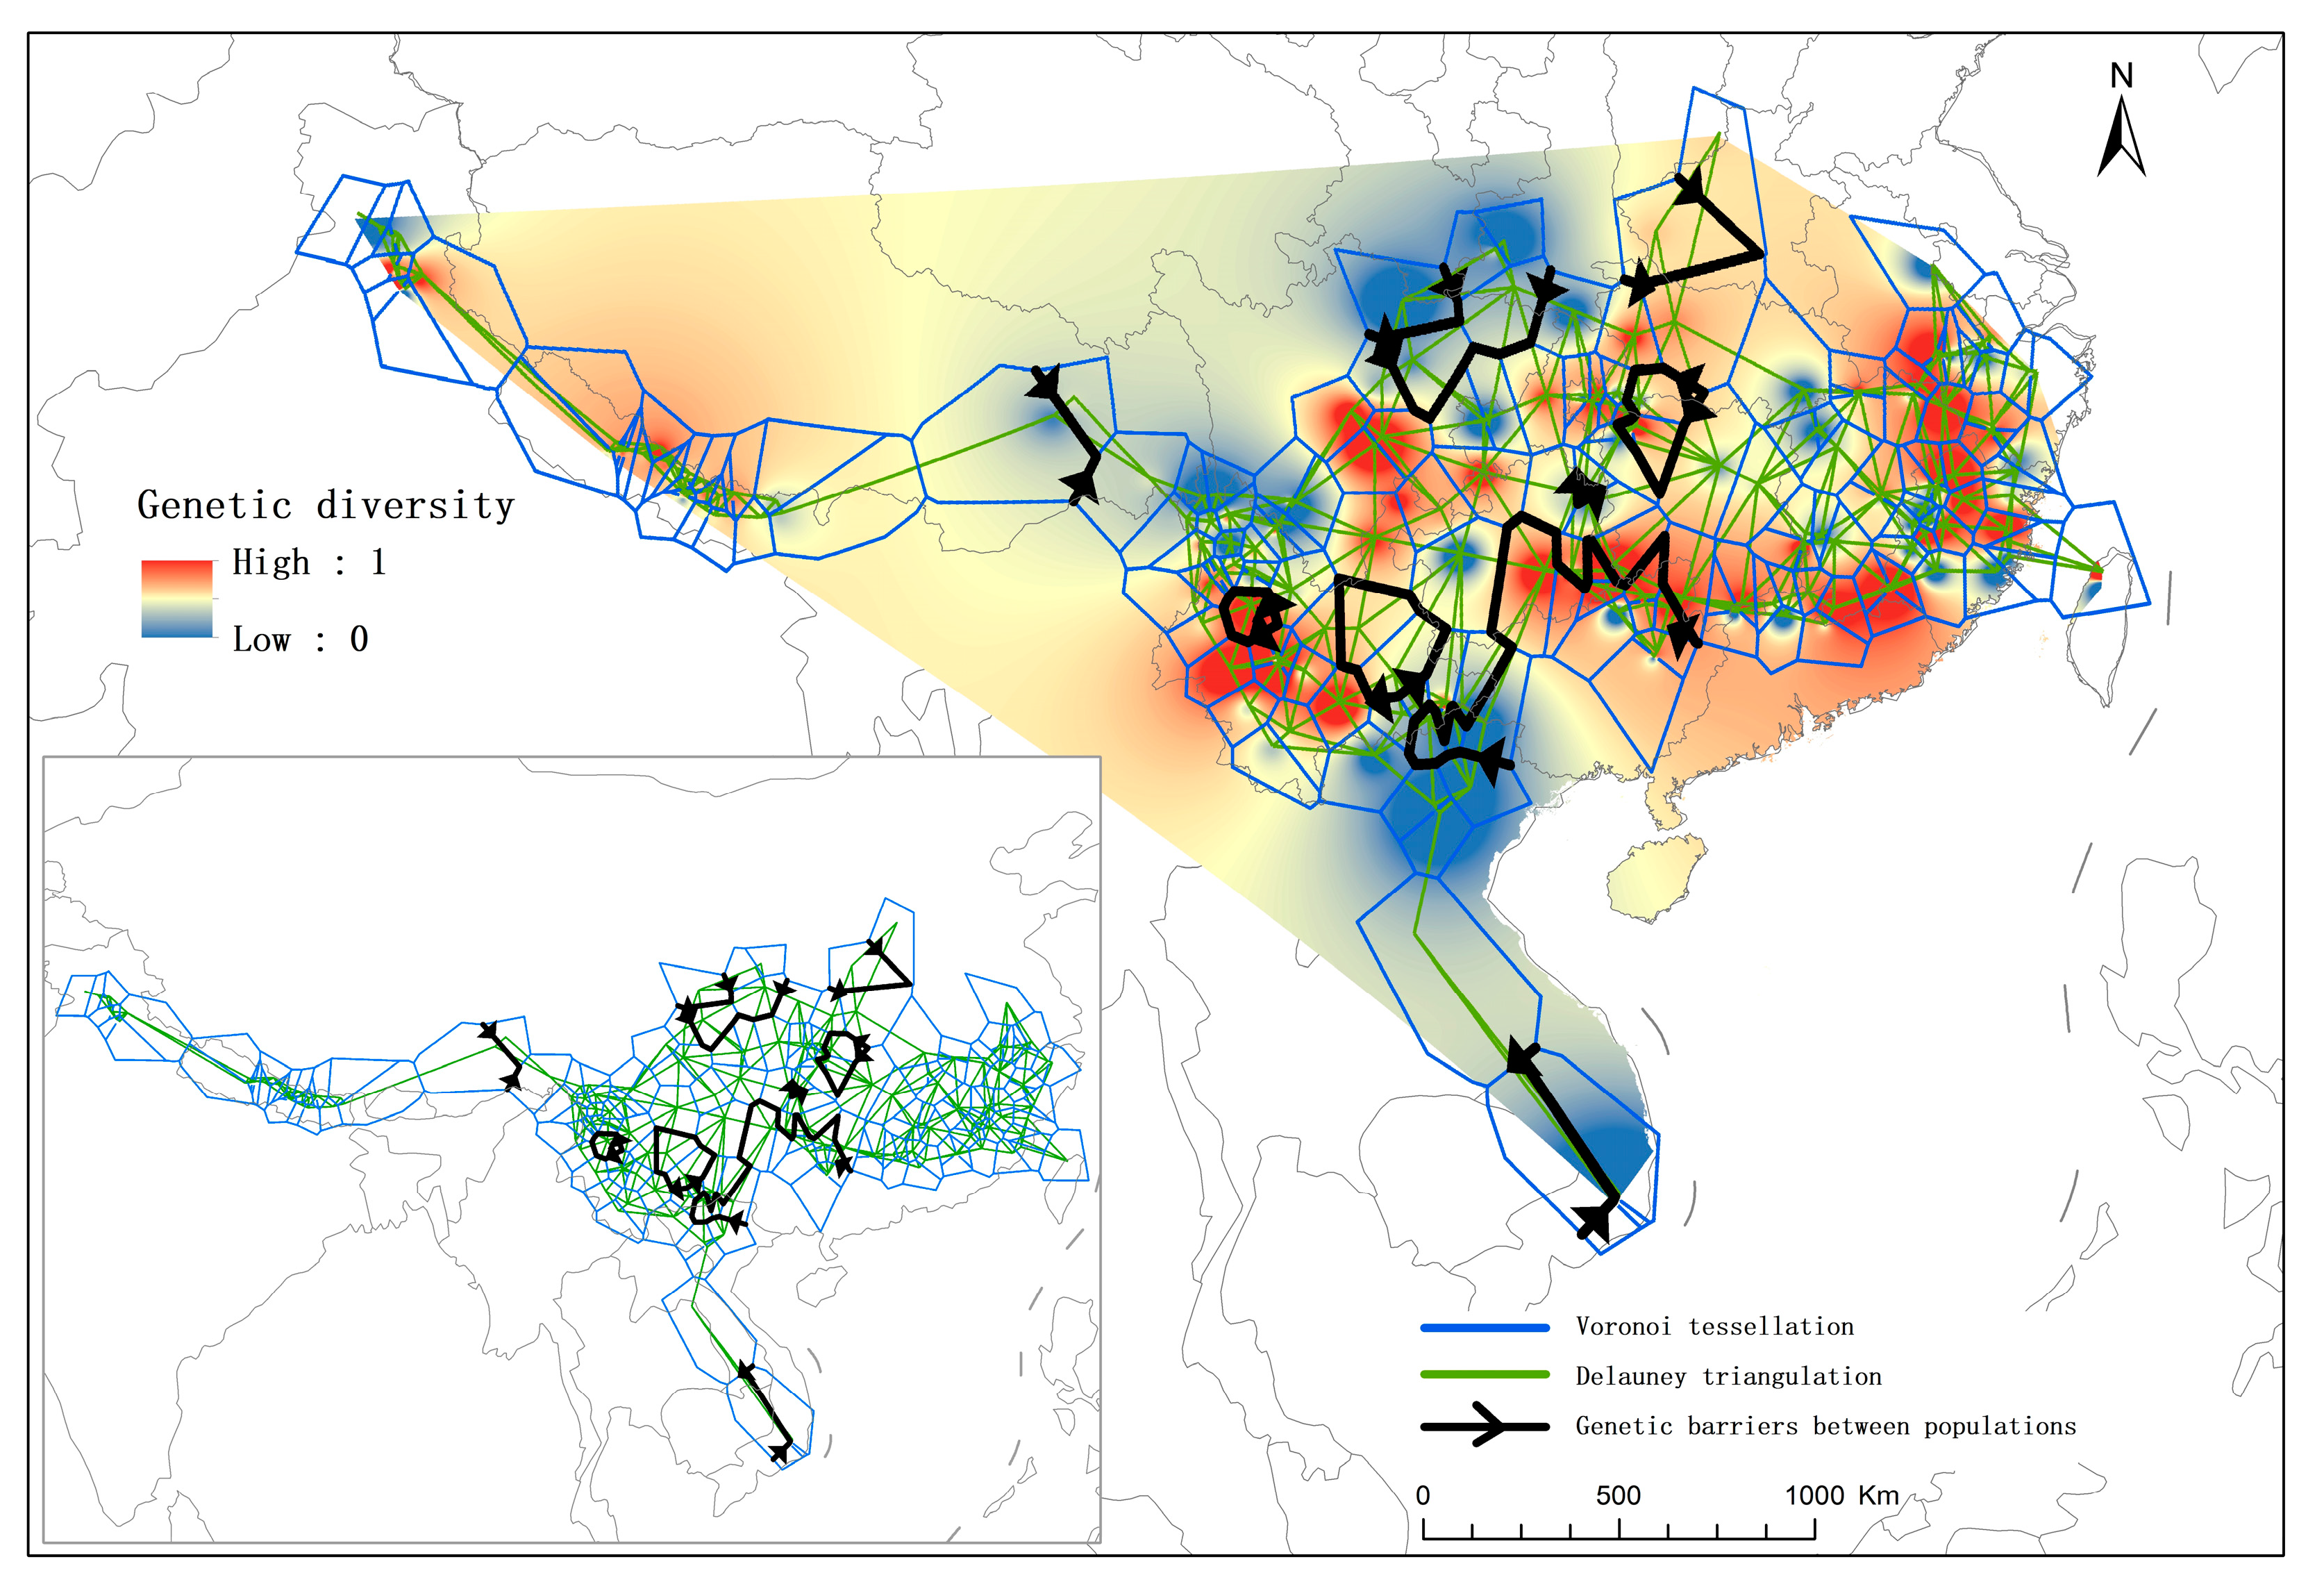
The genetic diversity of 255 populations in T. wallichiana complex ranged from 0.00 to 1.00 (min-max normalization). Based on the genetic diversity indices using ArcGIS Genetic Landscape GIS Toolbox [50], the genetic diversity pattern was revealed, as well as several areas of high genetic diversity, namely Himalaya, Yunnan Plateau, Sichuan basin, Shenlongjia, Mt. Huangshan, Fujian, the adjacent area between Guangdong and Hunan. In addition, we observed that areas with low genetic diversity were located in the north of Shenlongjia, Chongqing, northeast Yunnan and northwest Guizhou, and northern Vietnam (Figure 6).
There is little difference in mean genetic diversity between the two regions. The stable zone is 0.41184 and the unstable zone is 0.42604. However, the coefficient of variation (CV) of the genetic diversity of the two regions is quite different. The CV of the stable region is 0.18730 and the CV of the stable region is 0.20422. It shows that the genetic diversity variation of T. wallichiana in the unstable region is greater than that of the stable region (Table 4).

3.5. Genetic Barriers and Gene Flow

Spatial analysis of inferred barriers to gene flow was indicated through Monmonier’s maximum algorithm analysis [71]. The largest genetic discontinuities were highlighted with heavy black lines with arrows. The green lines represent the Delauney triangulation and the blue lines represent the Voronoi tessellation (Figure 7). We overlapped genetic barriers and genetic diversity layers to show the geographic patterns between them. Genetic landscape patches of T. wallichiana were relatively fragmented and isolated by genetic barriers, and the aggregated genetic landscape patches of T. wallichiana could be found more without genetic barriers.
Genetic barriers spatially isolated the center of genetic diversity into three regions: west, middle, and east. Southern Tibet was isolated from other populations, the central and western Yunnan, the Sichuan basin, and surrounding mountains were isolated from the southern China populations (Figure 7).

3.6. The Landscape of Genetic Diversity Response to the Climate Changes

The genetic diversity landscape responded significantly to climate change. Contemporary genetic diversity had a significant response to the ecologically suitable areas under historical and future climate scenarios. We found that the relationships between the present genetic diversity and suitability index during LGM, MH, and 2070 had a highly significant positive linear correlation (p < 0.01), and during LIG and present time it had a significant positive linear correlation (p < 0.05). Although there was a correlation in all periods, the degree of correlationship was low (r < 0.2). The current genetic diversity had the lowest correlation coefficient with the present suitable areas. The LGM had the highest coefficient, and it would increase under future climate scenarios. The climate since the LGM had a profound impact on the current pattern of genetic diversity, and genetic diversity also had a significant response to future climate warming (Table 5).

3.7. The Factors Controlling Distribution and Genetic Diversity of Taxus wallichiana

It would be valuable to identify the climatic variables that have the most significant impact on its distribution. The relative contribution of the variables to predicting the suitability of the environment is presented in Figure 8. The Bio11 (mean temperature of the coldest quarter) contributed most to the distribution probability of T. wallichiana, followed by Bio12 (mean annual precipitation), with additional contributions from Bio7 (temperature annual range), Bio19 (precipitation of coldest quarter), and Bio5 (maximum temperature of the warmest month) in contemporary time. The model evaluation results revealed that the model was reliable for both current and future predictions. The AUC was close to 1 for both the testing data and the training data sets (Table S7).
The relative contribution of the variables in shaping genetic diversity landscape is also presented in the Figure 8. The contribution rate of Bio11 was not the largest, but the Bio12, Bio13 (precipitation of wettest month), and Bio19 contribution rate were larger at present, i.e., the contribution rate of precipitation to genetic diversity landscape was greater than the contribution rate of temperature (Figure 8).
Finally, we compared the changes in the contribution rate of the bioclimatic variables calculated by the jackknife method to the T. wallichiana suitable area in each period in the Maxent model (based on contemporary results, Figure 9). Compared to the contribution rate of contemporary climate variables, the contribution rate of Bio12 and Bio11 was increased, and the contribution rate of Bio19 and Bio7 declined.

4. Discussion

4.1. Habitat Suitability Altered by Climate Change

The Maxent model is based on the theory of maximum entropy and then the potential geographic distribution layer is established. Receiver operating characteristic (ROC) curves were used to evaluate the results of models [62]. Area under the curve (AUC) values below 0.6 indicated that the results of the predictions were close to random, while 1.0 showed excellent predictions [73]. The AUC was above 0.9 for all the testing data and the training data sets (Table S7), which indicates our model was reliable for the past, present, and future predictions. Meanwhile, this model also shows good effectiveness in other research. For example, Salvà-Catarineu et al. (2021) modeled the past, current, and future distribution of Juniperus phoenicea complex using the maximum entropy model (Maxent) in the Mediterranean and Macaronesian regions, in which the model predicted the distribution of each period very well [73]. Species distribution modeling was carried out to predict potential past distribution ranges of T. wallichiana combining molecular phylogeography in the Himalaya-Hengduan Mountains (HHM) and Yunnan Plateau region, which proved to have initial topological constraints and reinforced by subsequent differential ecological (climatic) adaptations, resulted in cryptic speciation, and the formation of two discrete taxonomic entities [74]. Petersen et al. (2024) developed SDMs using Maxent modeling software for two species of Psilochalcis wasps (P. minuta and P. quadratis) in Utah’ s eastern Great Basin, and used the AUC approach to evaluate each model’s predictive accuracy. They demonstrated that the potential distribution of species can be adequately modeled by Maxent [75].
The high potential suitable areas and refugia of T. wallichiana were geographically isolated and fragmented (Figure 2 and Figure 5). Climate change was the main cause of change in the habitat suitability of species, such as expansion, contraction, and center-of-mass shifts (Figure 3 and Figure 4). From the LIG to LGM period, the T. wallichiana population contracted and expanded more significantly than in other periods (suitable levels > 0.5, Figure 3). This is because climate changes during glacial–interglacial cycles had a dramatic effect on species ranges [13], causing the separation, migration, and extinction of populations and an accelerated rate of evolution [45]. Meanwhile, the geological history and climate oscillation events in the process of shaping the continuous expansion and contraction of species will cause species to gather in the refugia areas. Thereby, refugia with complex topography may buffer against the effects of climate change and allow for the local persistence of species through successive periods of climate change [22]. Therefore, Hewitt and Yu believed that existing glacial refugia, together with increasingly proven cryptic refugia during the Quaternary were becoming the habitats where plant species retreated, persisted, and harbored ancient haplotypes and high genetic diversity [16,20]. Tang et al. also pointed out specifically that some mountainous areas of southwestern China and northern Vietnam have allowed the persistence of a large ensemble of relict plants throughout the Quaternary (LGM–2070) [21], which are consistent with the shelter areas we have identified (Figure 5).
Globally, the areas considered as refugia are mainly affected by the Indian and East Asian monsoon system in the summer, and the westerly wind in the northern hemisphere in winter [21]. Therefore, the moderate habitat suitability zone of T. wallichiana has not changed much under climate change in various periods. Especially, the position and distance of the center of mass changes very little (Figure 4).

4.2. Evolutionary Potential in Climate Change

The evolutionary potential of a species is based on its genetic variation [61]. The heritable variation, popularly called genetic diversity, is structured over space and time leading to evolution [2]. Thereby, climatically stable refugia harbor not only high habitat suitability, but also high species genetic diversity. Contemporary genetic diversity of tree species is the result of long-term evolution and determines their ability to adapt to the environment [6]. We map the contemporary genetic diversity landscape of T. wallichiana (Figure 6) and find several genetic barriers (Figure 7). Geographically, areas that maintain high genetic diversity of species are geographically isolated and fragmented (Figure 6), and the genetic barriers separate north–south in the latitude direction in southwestern China (Figure 6). Therefore, we have reason to support the claim that southwest China is home to “relict” plant species [21]. At the same time, there are also genetic barriers in the Hengduan Mountain area. Therefore, the genetic diversity of T. wallichiana is geographically distributed in East Asia and the Himalayas, and most of them are limited to mountains in the humid subtropical and warm-temperate areas (Figure 7). The level of genetic diversity of T. wallichiana is correlated with the level of its ecologically suitable areas under past climate changes, and we predict that under future climate scenarios, the T. wallichiana population will maintain the same trend and have stable genetic diversity, i.e., genetic variation level is spatially correlated with suitable habitats in the past or at present, will be the basis for future evolutionary potentials (Table 5).
Carnaval et al. (2009) proposed higher genetic diversity within and among populations in refugia relative to unstable areas, because of the long-term persistence and population structure, and absence of genetic patterns of isolation-by-distance in unstable areas, given that colonization has been too recent to permit restoration of equilibrium between migration and genetic drift and strong phylogeographic structure between refugia, reflecting assemblage-wide, long-term population persistence in isolated areas [76]. So, we speculate that the populations in southern China were basically not isolated and the gene flow would be strong, which inferred that it maintained high population genetic diversity in southern China. In contrast, Yunnan-Sichuan populations that contained high genetic diversity may be due to the long-term stable refugia.
Genetic data from multiple sources of T. wallichiana complex were used to test whether the level of genetic variation is spatially related to suitable habitats in the past or at present. Furthermore, climate change-driven historical habitat changes and current genetic diversity landscapes predict the evolutionary potential of T. wallichiana in the future. Our test well confirmed that T. wallichiana’s contemporary genetic diversity landscape is driven by historical processes and has strong evolutionary potential in the context of climate change. The combination of SDM and genetic diversity landscapes is helpful for understanding species endangered status and the risks facing climatic change.

4.3. Factors Contribution to Species Distribution and Evolution

The distribution probability of T. wallichiana was affected by both precipitation and temperature variables. As this plant prefers moist and shady habitats, its widespread distribution particularly made it sensitive to climatic change [77]. T. wallichiana is a drought-sensitive species that prefers to grow under abundant rainfall and cold temperate montane and sub-alpinal climate regimes. Plant distributions are strongly controlled by climate factors, and changes in climate can result in the dispersal, migration, evolution/adaptation, and extinction of species. Mean temperature of the coldest quarter (Bio11) is the most important bioclimatic factor for the distribution of T. wallichiana. Research by Rathore (2019) et al. also pointed out that the probability distribution of T. wallichiana is affected by both precipitation and temperature variables [23]. Other variables like annual precipitation (Bio12), temperature annual range (Bio7), precipitation of coldest quarter (Bio19), and maximum temperature of the warmest month (Bio5) also show a high contribution to the distribution probability of T. wallichiana (Figure 8). However, the contribution rate of climate variables to the species genetic diversity landscape is different from the contribution rate to the distribution of its suitable area. This may indicate that the genetic diversity of species is affected by climate as a long-term process rather than directly acting on it, and that it can affect the genetic diversity landscape by affecting the distribution of species.

5. Conclusions

Responses of plant population to past climate change can be attributed to dispersal, local adaptation, and extinction. We tried to reveal how geographical landscapes and climatic change affected its evolutionary processes through visualizing patterns of genetic landscapes and species distribution. We verified that (1) T. wallichiana complex, as a Quaternary relict tree species group, had more ecologically suitable areas under past climatic conditions and had formed several long-term climate refugia under continuous climatic oscillation events. Past refugia of T. wallichiana had geographical features that allowed it to persist through extreme climate events, and long-term refugia were likely to maintain its role under future climate change; (2) genetic variation level was spatially correlated with suitable habitats in the past and at present, and would be the basis for future evolutionary potentials; genetic diversity landscape pattern and species distribution models inferred the location of refugia; (3) T. wallichiana distribution was affected by both precipitation and temperature variables. At a long-time scale, T. wallichiana had the ability to adapt to climate change, but it will shift outward of its long-term refugia.

Supplementary Materials

The following supporting information can be downloaded at: https://www.mdpi.com/article/10.3390/d16090511/s1, Table S1: Species distribution points and their genetic diversity data; Table S2: Species distribution points and their sources. Table S3: Pearson’s correlation (r) matrix of climate variables. Table S4: The importance values of the predictor variables. Table S5: The area (104 km2) at different suitability levels for T. wallichiana in each climate scenario. Table S6: Centroid coordinates and transfer distance in each period. Table S7: The model evaluation results for different periods.

Author Contributions

C.W.: study design, filed investigation, writing—review and editing, funding acquisition. F.L.: filed investigation, writing—original draft, data curation, visualization, formal analysis. M.P.: filed investigation, writing—review and editing. W.M.: filed investigation, data curation. L.P.: filed investigation, data curation. D.C.: data curation. All authors have read and agreed to the published version of the manuscript.

Funding

This study received financial support from the National Natural Science Foundation of China (32360331) and the Special Foundation for National Science and Technology Basic Resources Investigation of China (2019FY202302).

Institutional Review Board Statement

Not applicable.

Data Availability Statement

The data is contained within the manuscript and supplementary files.

Acknowledgments

We sincerely thank Neus Nualart and Jordi López-Pujol from Botanic Institute of Barcelona (IBB, CSIC-Ajuntament de Barcelona), and Cindy Q. Tang from Yunnan University for their useful suggestions on the manuscript.

Conflicts of Interest

The authors declare that they have no known competing financial interest or personal relationships that could have appeared to influence the work reported in this paper.

References

  1. Hughes, A.R.; Inouye, B.D.; Johnson, M.T.J.; Underwood, N.; Vellend, M. Ecological consequences of genetic diversity. Ecol. Lett. 2008, 11, 609–623. [Google Scholar] [CrossRef]
  2. Mohapatra, K.P.; Sehgal, R.N.; Sharma, R.K.; Mohapatra, T. Genetic analysis and conservation of endangered medicinal tree species Taxus wallichiana in the Himalayan region. New For. 2009, 37, 109–121. [Google Scholar] [CrossRef]
  3. Anderson, J.T.; Willis, J.H.; Mitchell-Olds, T. Evolutionary genetics of plant adaptation. Trends Genet. 2011, 27, 258–266. [Google Scholar] [CrossRef] [PubMed]
  4. Zhang, D.Q.; Zhou, N. Genetic diversity and population structure of the endangered conifer Taxus wallichiana var. mairei (Taxaceae) revealed by Simple Sequence Repeat (SSR) markers. Biochem. Syst. Ecol. 2013, 49, 107–114. [Google Scholar] [CrossRef]
  5. Poudel, R.C.; MÖller, M.; Li, D.Z.; Shah, A.; Gao, L.M. Genetic diversity, demographical history and conservation aspects of the endangered yew tree Taxus contorta (syn. Taxus fuana) in Pakistan. Tree Genet. Genomes 2014, 10, 653–665. [Google Scholar] [CrossRef]
  6. Wen, Y.F.; Uchiyama, K.; Ueno, S.; Han, W.J.; Xie, W.D.; Tsumura, Y. Assessment of the genetic diversity and population structure of Maire yew (Taxus chinensis var. mairei) for conservation purposes. Can. J. For. Res. 2018, 48, 589–598. [Google Scholar] [CrossRef]
  7. Hamrick, J.L.; Godt, M.J.W. Effects of life history traits on genetic diversity in plant species. Philos. Trans. R. Soc. Lond. B. 1996, 351, 1291–1298. [Google Scholar]
  8. Miao, Y.C.; Su, J.R.; Zhang, Z.J.; Lang, X.D.; Liu, W.D.; Li, S.F. Microsatellite markers indicate genetic differences between cultivated and natural populations of endangered Taxus yunnanensis. Bot. J. Linn. Soc. 2015, 177, 450–461. [Google Scholar] [CrossRef]
  9. Wang, J.M.; Wang, Y.; Feng, J.M.; Chen, C.; Chen, J.; Long, T.; Li, J.Q.; Zang, R.G.; Li, J.W. Differential Responses to Climate and Land-Use Changes in Threatened Chinese Taxus Species. Forests 2019, 10, 766. [Google Scholar] [CrossRef]
  10. Root, T.L.; Price, J.T.; Hall, K.R.; Schneider, S.H.; Rosenzweig, C.; Pounds, J.A. Fingerprints of global warming on wild animals and plants. Nature 2003, 421, 57–60. [Google Scholar] [CrossRef] [PubMed]
  11. Chen, I.C.; Hill, J.K.; Ohlemüller, R.; Roy, D.B.; Thomas, C.D. Rapid range shifts of species associated with high levels of climate warming. Science 2011, 333, 1024–1026. [Google Scholar] [CrossRef] [PubMed]
  12. Quintero, I.; Wiens, J.J. Rates of projected climate change dramatically exceed past rates of climatic niche evolution among vertebrate species. Ecol. Lett. 2013, 16, 1095–1103. [Google Scholar] [CrossRef]
  13. Pearson, R.G.; Dawson, T.P. Predicting the impacts of climate change on the distribution of species: Are bioclimate envelope models useful? Glob. Ecol. Biogeogr. 2003, 12, 361–371. [Google Scholar] [CrossRef]
  14. Walther, G.R.; Post, E.; Convey, P.; Menzel, A.; Parmesan, C.; Beebee, T.J.C.; Fromentin, J.M.; Hoegh-Guldberg, O.; Bairlein, F. Ecological responses to recent climate change. Nature 2002, 416, 389–395. [Google Scholar] [CrossRef] [PubMed]
  15. Hughes, L. Biological consequences of global warming: Is the signal already apparent? Trends Ecol. Evol. 2000, 15, 56–61. [Google Scholar] [CrossRef] [PubMed]
  16. Hewitt, G. The genetic legacy of the Quaternary ice ages. Nature 2000, 405, 907–913. [Google Scholar] [CrossRef]
  17. Hewitt, G.M. Genetic consequences of climatic oscillations in the Quaternary. Philos. Trans. R. Soc. London. Ser. B Biol. Sci. 2004, 359, 183–195. [Google Scholar] [CrossRef]
  18. Gao, L.M.; Moeller, M.; Zhang, X.M.; Hollingsworth, M.L.; Liu, J.; Mill, R.R.; Gibby, M.; Li, D.Z. High variation and strong phylogeographic pattern among cpDNA haplotypes in Taxus wallichiana (Taxaceae) in China and North Vietnam. Mol. Ecol. 2007, 16, 4684–4698. [Google Scholar] [CrossRef] [PubMed]
  19. Yu, H.B.; Zhang, Y.L.; Gao, J.G.; Qi, W. Visualizing patterns of genetic landscapes and species distribution of Taxus wallichiana (Taxaceae), based on GIS and ecological niche models. J. Resour. Ecol. 2014, 5, 193–202. [Google Scholar]
  20. Yu, H.B.; Zhang, Y.L.; Li, S.C. Predicting the dispersal routes of alpine plant Pedicularis longiflora (Orobanchaceae) based on GIS and species distribution models. Chin. J. Appl. Ecol. 2014, 25, 1669–1673. (In Chinese) [Google Scholar]
  21. Tang, C.Q.; Matsui, T.; Ohashi, H.; Dong, Y.F.; Momohara, A.; HerrandoMoraira, S.; Qian, S.; Yang, Y.; Ohsawa, M.; Luu, H.T.; et al. Identifying long-term stable refugia for relict plant species in East Asia. Nat. Commun. 2018, 9, 4488. [Google Scholar] [CrossRef]
  22. Wang, W.T.; Guo, W.Y.; Jarvie, S.; Svenning, J.C. The fate of Meconopsis species in the Tibeto-Himalayan region under future climate change. Ecol. Evol. 2021, 11, 887–899. [Google Scholar] [CrossRef] [PubMed]
  23. Rathore, P.; Roy, A.; Karnatak, H. Modelling the vulnerability of Taxus wallichiana to climate change scenarios in South East Asia. Tcological Indic. 2019, 102, 199–207. [Google Scholar] [CrossRef]
  24. Jennings, M.D.; Harris, G.M. Climate change and ecosystem composition across large landscapes. Landsc. Ecol. 2017, 32, 195–207. [Google Scholar] [CrossRef]
  25. Médail, F.; Diadema, K. Glacial refugia influence plant diversity patterns in the Mediterranean basin. J. Biogeogr. 2009, 36, 1333–1345. [Google Scholar] [CrossRef]
  26. Möller, M.; Liu, J.; Li, Y.; Li, J.H.; Ye, L.J.; Mill, R.; Thomas, P.; Li, D.Z.; Gao, L.M. Repeated intercontinental migrations and recurring hybridizations characterise the evolutionary history of yew (Taxus L.). Mol. Phylogenetics Evol. 2020, 153, 106952. [Google Scholar] [CrossRef]
  27. Jia, X.; Feng, S.; Zhang, H.; Liu, X. Plastome phylogenomics provide insight into the evolution of Taxus. Forests 2022, 13, 1590. [Google Scholar] [CrossRef]
  28. Thomas, P.; Farjon, A. Taxus wallichiana. In IUCN 2011. IUCN Red List of Threatened Species. 2011. Available online: http://www.iucnredlist.Org (accessed on 13 June 2024).
  29. Gajurel, P.J.; Cornejo, C.; Werth, S.; Shrestha, K.K.; Scheidegger, C. Development and characterization of microsatellite loci in the endangered species Taxus wallichiana (Taxaceae). Appl. Plant Sci. 2013, 1, 1200281. [Google Scholar] [CrossRef] [PubMed]
  30. Wu, Z.Y.; Raven, P.H. Flora of China. Missouri Botanical Garden Press: St. Louis, MO, USA, 1999; Volume 4, pp. 89–91. [Google Scholar]
  31. Li, N.; Fu, L.K. Notes on gymnosperms I. Taxonomic treatments of some Chinese conifers. Novon 1997, 261–264. [Google Scholar]
  32. Möller, M.; Gao, L.M.; Mill, R.R.; Li, D.Z.; Hollingsworth, M.L.; Gibby, M. Morphometric analysis of the Taxus wallichiana complex (Taxaceae) based on herbarium material. Bot. J. Linn. Soc. 2007, 155, 307–335. [Google Scholar] [CrossRef]
  33. Liu, J.; Möller, M.; Gao, L.M.; Zhang, D.Q.; Li, D.Z. DNA barcoding for the discrimination of Eurasian yews (Taxus L., Taxaceae) and the discovery of cryptic species. Mol. Ecol. Resour. 2011, 11, 89–100. [Google Scholar] [CrossRef] [PubMed]
  34. Möller, M.; Gao, L.M.; Mill, R.R.; Liu, J.; Zhang, D.Q.; Poudel, R.C.; Li, D.Z. A multidisciplinary approach reveals hidden taxonomic diversity in the morphologically challenging Taxus wallichiana complex. Taxon 2013, 62, 1161–1177. [Google Scholar] [CrossRef]
  35. Yang, Y. An updated red list assessment of gymnosperms from China (Version 2021). Biodivers. Sci. 2021, 29, 1599–1606. (In Chinese) [Google Scholar] [CrossRef]
  36. Li, P.X.; Zhu, W.Q.; Xie, Z.Y.; Qian, K. Integration of multiple climate models to predict range shifts and identify management priorities of the endangered Taxus wallichiana in the Himalaya-Hengduan Mountain region. J. For. Res. 2020, 31, 2255–2272. [Google Scholar] [CrossRef]
  37. Myers, N.; Mittermeier, R.A.; Mittermeier, C.G.; Da Fonseca, G.A.; Kent, J. Biodiversity hotspots for conservation priorities. Nature 2000, 403, 853–858. [Google Scholar] [CrossRef] [PubMed]
  38. Tang, C.Q.; Ohashi, H.; Matsui, T.; Herrando-Moraira, S.; Dong, Y.F.; Li, S.; Han, P.B.; Huang, D.S.; Shen, L.Q.; Li, Y.F.; et al. Effects of climate change on the potential distribution of the threatened relict Dipentodon sinicus of subtropical forests in East Asia: Recommendations for management and conservation. Glob. Ecol. Conserv. 2020, 23, e01192. [Google Scholar] [CrossRef]
  39. Tang, C.Q.; Matsui, T.; Ohashi, H.; Nualart, N.; Herrando-Moraira, S.; Dong, Y.F.; Grote, P.J.; Ngoc, N.V.; Sam, H.V.; Li, S.F.; et al. Identifying long-term stable refugia for dominant Castanopsis species of evergreen broad-leaved forests in East Asia: A tool for ensuring their conservation. Biol. Conserv. 2022, 273, 109663. [Google Scholar] [CrossRef]
  40. Poudel, R.C.; MÖller, M.; Liu, J.; Gao, L.M.; Baral, S.R.; Li, D.Z. Low genetic diversity and high inbreeding of the endangered yews in Central Himalaya: Implications for conservation of their highly fragmented populations. Divers. Distrib. 2014, 20, 1270–1284. [Google Scholar] [CrossRef]
  41. Kerr, R.A. The IPCC Gains Confidence in Key Forecast. Science 2013, 342, 23–24. [Google Scholar] [CrossRef]
  42. IPCC. Climate Change 2013: The Physical Science Basis. Contribution of Working Group I to the Fifth Assessment Report of the Intergovernmental Panel on Climate Change; Cambridge University Press: Cambridge, UK, 2014. [Google Scholar]
  43. Herrando-Moraira, S.; Nualart, N.; Galbany-Casals, M.; Garcia-Jacas, N.; Ohashi, H.; Matsui, T.; Susanna, A.; Tang, C.Q.; López-Pujol, J. Climate Stability Index maps, a global high resolution cartography of climate stability from Pliocene to 2100. Sci. Data 2022, 9, 48. [Google Scholar] [CrossRef]
  44. Yang, J.B.; Li, H.T.; Li, A.Z.; Liu, J.; Gao, L.M. Isolation and characterization of microsatellite markers in the endangered species Taxus wallichiana using the FIASCO method. HortScience 2009, 44, 2043–2045. [Google Scholar] [CrossRef]
  45. Liu, J.; Gao, L.M.; Li, D.Z.; Zhang, D.Q.; Möller, M. Cross-species amplification and development of new microsatellite loci for Taxus wallichiana (Taxaceae). Am. J. Bot. 2011, 98, e70–e73. [Google Scholar] [CrossRef] [PubMed]
  46. Miao, Y.C.; Su, J.R.; Zhang, Z.J.; Li, H.; Luo, L.; Zhang, Y.P. Isolation and characterization of microsatellite markers for the endangered Taxus yunnanensis. Conserv. Genet. 2008, 9, 1683–1685. [Google Scholar] [CrossRef]
  47. Zhou, Y.; Chen, G.P.; Su, Y.J.; Wang, Z.W. Microsatellite loci from Taxus chinensis var. mairei (Taxaceae), an endangered and economically important tree species in China. Front. Biol. 2009, 4, 214–216. [Google Scholar] [CrossRef]
  48. Perry, W.; Lugo, R.; Hathaway, S.A.; Vandergast, A.G. Genetic Landscapes GIS Toolbox: Tools to create genetic divergence and diversity landscapes in ArcGIS. U.S. Geol. Surv. 2010. Available online: https://www.usgs.gov/products/MGL_toolbox (accessed on 25 June 2021).
  49. Vandergast, A.G.; Bohonak, A.J.; Hathaway, S.A.; Boys, J.; Fisher, R.N. Are hotspots of evolutionary potential adequately protected in southern California? Biol. Conserv. 2008, 141, 1648–1664. [Google Scholar] [CrossRef]
  50. Vandergast, A.G.; Perry, W.M.; Lugo, R.V.; Hathaway, S.A. Genetic landscapes GIS Toolbox: Tools to map patterns of genetic divergence and diversity. Mol. Ecol. Resour. 2010, 11, 158–161. [Google Scholar] [CrossRef]
  51. Laurie, A.; Steven, H.; Beissinger, R. A practical toolbox for design and analysis of landscape genetics studies. Landsc. Ecol. 2014, 29, 1487–1504. [Google Scholar]
  52. Coughlan, P.; Carolan, J.C.; Hook, I.L.I.; Kilmartin, L.; Hodkinson, T.R. Phylogenetics of Taxus using the internal transcribed spacers of nuclear ribosomal DNA and plastid trnL-F regions. Horticulturae 2020, 6, 19. [Google Scholar] [CrossRef]
  53. Miller, M.P. Alleles In Space (AIS): Computer software for the joint analysis of interindividual spatial and genetic information. J. Hered. 2005, 96, 722–724. [Google Scholar] [CrossRef]
  54. Zhang, X.M.; Gao, L.M.; Möller, M.; Li, D.Z. Molecular evidence for fragmentation among populations of Taxus wallichiana var. mairei, a highly endangered conifer in China. Can. J. For. Res. 2009, 39, 755–764. [Google Scholar] [CrossRef]
  55. Zhang, R.; Zhou, Z.C.; Jin, G.Q.; Luo, W.J. Genetic diversity and genetic differentiation of Taxus wallichiana var. mairei provenance. Sci. Silvae Sin. 2009, 45, 50–56. [Google Scholar]
  56. Li, N.W.; He, S.A.; Shu, X.C.; Wang, Q.; Xia, B.; Peng, F. Genetic diversity and structure analyses of wild and ex-situ conservation populations of Taxus chinensis var. mairei based on ISSR marker. J. Plant Resour. Environ. 2011, 20, 25–30. [Google Scholar]
  57. Deng, Q.; Su, Y.J.; Wang, T. Microsatellite loci for an old rare species, Pseudotaxus chienii, and transferability in Taxus wallichiana var. mairei (Taxaceae). Appl. Plant Sci. 2013, 1, 1200456. [Google Scholar] [CrossRef] [PubMed]
  58. Xi, X.J.; Guo, J.; Zhu, Y.G.; Yang, X.L.; Yang, Y.; Cheng, Z.; Li, S. Genetic diversity and taxol content variation in the Chinese yew Taxus mairei. Plant Syst. Evol. 2014, 300, 2191–2198. [Google Scholar] [CrossRef]
  59. Miao, Y.C.; Zhang, Z.J.; Su, J.R. Low genetic diversity in the endangered Taxus yunnanensis following a population bottleneck, a low effective population size and increased inbreeding. Silvae Genet. 2016, 65, 59–66. [Google Scholar] [CrossRef]
  60. Xu, W.; Qu, Y.Q.; Zhang, L.L.; Rong, J.D.; He, T.Y.; Zhang, Y.S. Genetic diversity of Taxus chinensis var. mairei from Fujian based on RAPD markers. Chin. Tradit. Herb. Drugs 2017, 48, 2943–2949. [Google Scholar]
  61. Vu, D.D.; Bui, T.T.X.; Nguyen, M.T.; Vu, D.G.; Nguyen, M.D.; Bui, V.T.; Huang, X.H.; Zhang, Y. Genetic diversity in two threatened species in Vietnam: Taxus chinensis and Taxus wallichiana. J. For. Res. 2017, 28, 265–272. [Google Scholar] [CrossRef]
  62. Liu, L.; Wang, Z.; Huang, L.J.; Wang, T.; Su, Y.J. Chloroplast population genetics reveals low levels of genetic variation and conformation to the central-marginal hypothesis in Taxus wallichiana var. mairei, an endangered conifer endemic to China. Ecol. Evol. 2019, 9, 11944–11956. [Google Scholar] [CrossRef]
  63. Hijmans, R.J.; Cameron, S.E.; Parra, J.L.; Jones, P.G.; Jarvis, A. Very high resolution interpolated climate surfaces for global land areas. Int. J. Climatol. 2005, 25, 1965–1978. [Google Scholar] [CrossRef]
  64. Gent, P.R.; Danabasoglu, G. Response to Increasing Southern Hemisphere Winds in CCSM4. J. Clim. 2011, 24, 4992–4998. [Google Scholar] [CrossRef]
  65. Guo, Y.Q.; Shi, M.Z.; Li, J.Y.; Fu, J.W.; Wu, M.X. Prediction of potential distribution area of Praxelis clematidea based on Maxent model. J. Trop. Subtrop. Bot. 2019, 27, 250–260. [Google Scholar]
  66. Ali, P.J.M.; Faraj, R.H. Data normalization and standardization: A technical report. Mach. Learn. Tech. Rep. 2014, 1, 1–6. [Google Scholar]
  67. Yu, H.B.; Zhang, Y.L.; Liu, L.S.; Qi, W.; Li, S.C. Combining least cost path method with population genetic data and species distribution models to identify landscape connectivity during the late quaternary in Himalayan hemlock. Ecol. Evol. 2015, 5, 5781–5791. [Google Scholar] [CrossRef] [PubMed]
  68. Phillips, S.J.; Anderson, R.P.; Schapire, R.E. Maximum entropy modelling of species’ geographic distributions. Ecol. Model. 2006, 190, 231–259. [Google Scholar] [CrossRef]
  69. Thuiller, W.; Richardson, D.M.; Pyšek, P.; Midgley, G.F.; Hughes, G.O.; Rouget, M. Niche-based modelling as a tool for predicting the risk of alien plant invasions at a global scale. Glob Chang. Biol. 2005, 11, 2234–2250. [Google Scholar] [CrossRef] [PubMed]
  70. Stewart, J.R.; Lister, A.M.; Barnes, I.; Dalén, L. Refugia revisited: Individualistic responses of species in space and time. Proc. R. Soc. B 2010, 277, 661–671. [Google Scholar] [CrossRef]
  71. Manni, F.; Guérard, E.; Heyer, E. Geographic patterns of (genetic, morphologic, linguistic) variation: How barriers can be detected by using Monmonier’s Algorithm. Hum. Biol. 2004, 76, 173–190. [Google Scholar] [CrossRef]
  72. Harrell, F.E., Jr. Hmisc: Harrell Miscellaneous. R Package Version 4.5-0. 2021. Available online: https://CRAN.R-project.org/package=Hmisc (accessed on 16 March 2021).
  73. Salvà-Catarineu, M.; Romo, A.; Mazur, M.; Zielińska, M.; Minissale, P.; Dönmez, A.A.; Boratyńska, K.; Boratyński, A. Past, present, and future geographic range of the relict Mediterranean and Macaronesian Juniperus phoenicea complex. Ecol. Evol. 2021, 11, 5075–5095. [Google Scholar] [CrossRef]
  74. Liu, J.; Möller, M.; Provan, J.; Gao, L.M.; Poudel, R.C.; Li, D.Z. Geological and ecological factors drive cryptic speciation of yews in a biodiversity hotspot. New Phytologist. 2013, 199, 1093–1108. [Google Scholar] [CrossRef]
  75. Petersen, M.J.; Ortiz Cano, H.G.; Gomez, T.; Johnson, R.L.; Anderson, V.J.; Petersen, S.L. Maxent predictive species distribution models and model accuracy assessment for two species of Psilochalcis Kieffer (Hymenoptera: Chalcididae) occurring in the Eastern Great Basin of Utah, USA. Diversity 2024, 16, 348. [Google Scholar] [CrossRef]
  76. Carnaval, A.C.; Hickerson, M.J.; Haddad, C.F.B.; Rodrigues, M.T.; Moritz, C. Stability predicts genetic diversity in the Brazilian Atlantic forest hotspot. Science 2009, 323, 786–787. [Google Scholar] [CrossRef] [PubMed]
  77. Wu, X.T.; Wen, Y.F. Advances in molecular genetics of Taxus chinensis var. mairei. Nonwood For. Res. 2017, 35, 228–232. [Google Scholar]
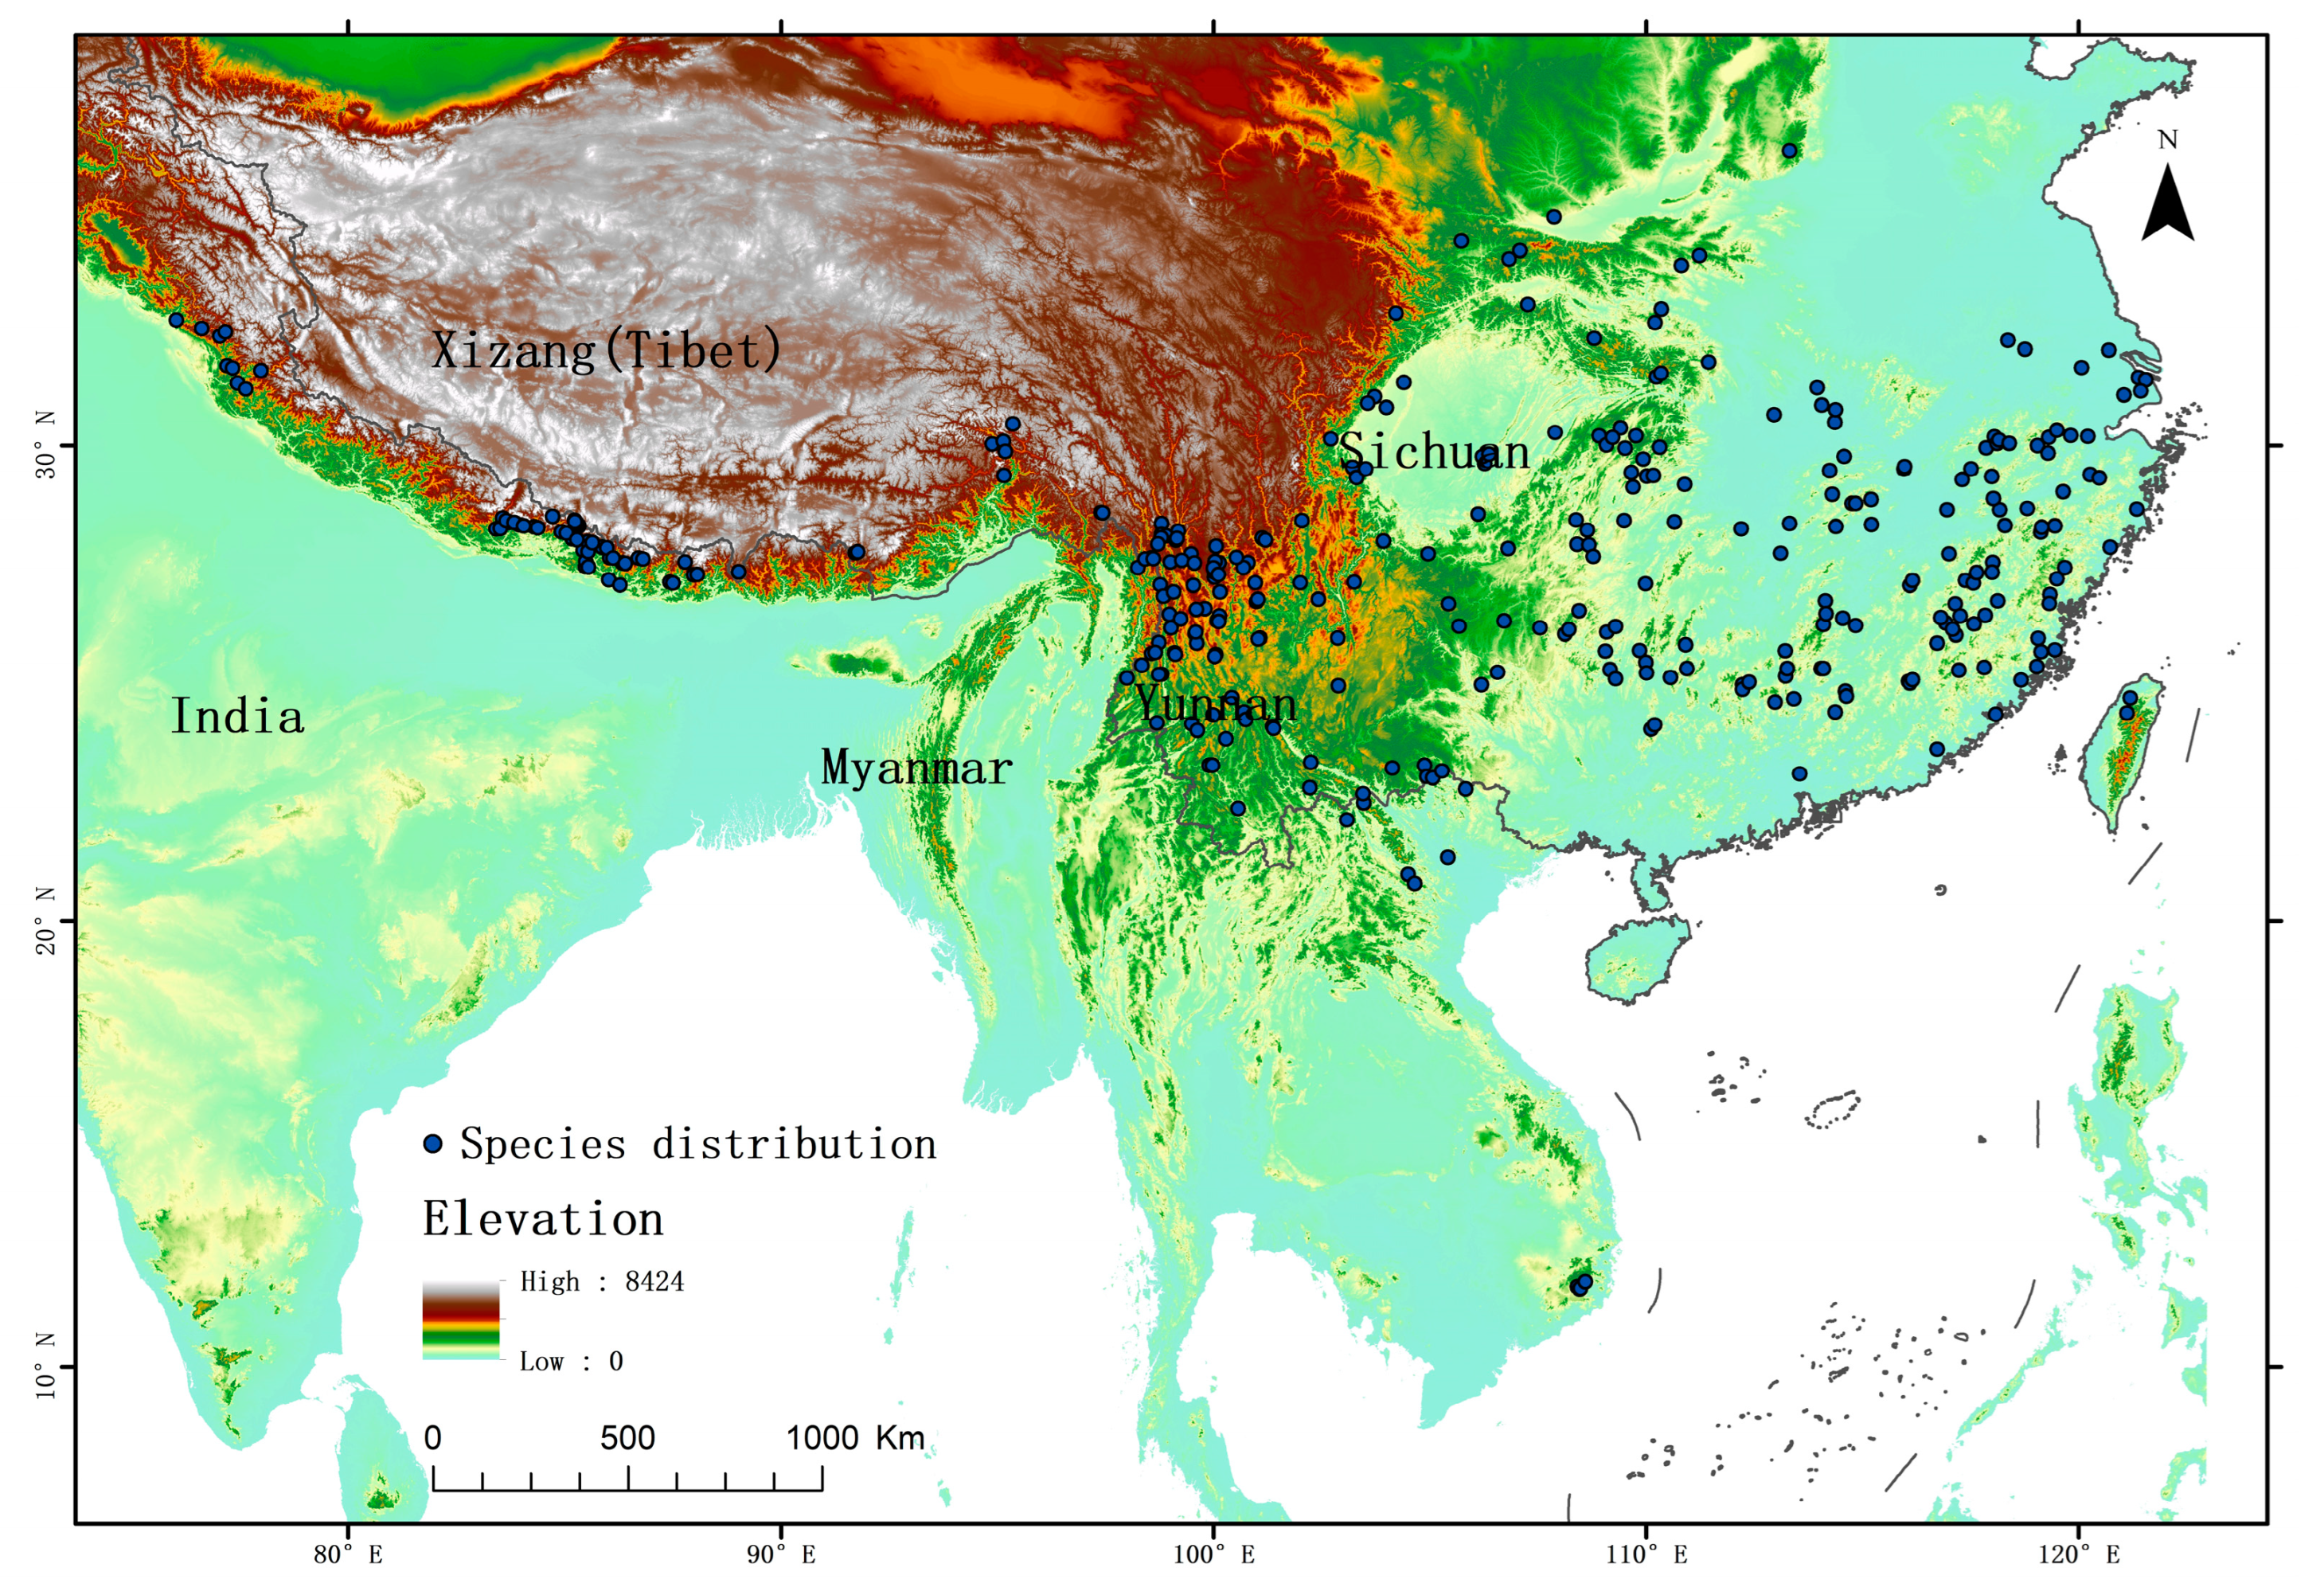
Figure 1. Occurrence records of Taxus wallichiana complex in this study.
Diversity 16 00511 g001
Figure 2. Potential distribution of Taxus wallichiana at different suitable levels in the five climates.
Diversity 16 00511 g002
Figure 3. Expansion and contraction trend of T. wallichiana during five periods.
Diversity 16 00511 g003
Figure 4. Centroid shift trend of T. wallichiana during five periods.
Diversity 16 00511 g004
Figure 5. Refugia of different suitable levels of Taxus wallichiana complex.
Diversity 16 00511 g005
Figure 6. Genetic diversity landscapes of T. wallichiana.
Diversity 16 00511 g006
Figure 7. The spatial pattern of contemporary genetic diversity and genetic barriers.
Diversity 16 00511 g007
Figure 8. Contribution rate of climate variables to ecologically genetic diversity (a) and ecologically suitable areas (b) of T. wallichiana in contemporary period. Same abbreviations as in Table 2.
Diversity 16 00511 g008
Figure 9. Changes in the contribution rate of climate variables to T. wallichiana suitable areas in each period (based on the contemporary contribution rate).
Diversity 16 00511 g009
Table 2. Climate variables used for distribution modeling.
CodeDescriptionCodeDescription
Bio1Mean annual temperatureBio11Mean temperature of coldest quarter
Bio2Mean diurnal range [mean of monthly (max temp–min temp)]Bio12Annual precipitation
Bio3Isothermality (Bio2/Bio7) (×100)Bio13Precipitation of wettest month
Bio4Temperature seasonality (standard deviation × 100)Bio14Precipitation of driest month
Bio5Max temperature of warmest monthBio15Precipitation seasonality (coefficient of variation)
Bio6Min temperature of coldest monthBio16Precipitation of wettest quarter
Bio7Temperature annual range (Bio5-Bio6)Bio17Precipitation of driest quarter
Bio8Mean temperature of wettest quarterBio18Precipitation of warmest quarter
Bio9Mean temperature of driest quarterBio19Precipitation of coldest quarter
Bio10Mean temperature of warmest quarter
Table 3. Range expansion and contraction area (104 km2) and ratio of change of T. wallichiana populations.
LIG–LGMLGM–MHMH–PresentPresent–2070RCP2.6Present–2070RCP4.5Present–2070RCP8.5
AreaRatio (%)AreaRatio (%)AreaRatio (%)AreaRatio (%)AreaRatio (%)AreaRatio (%)
Expansion17.9220.3513.8816.888.7411.8215.8922.1016.3022.5417.0323.31
Contraction19.7224.6317.2821.0117.9224.248.2911.538.5811.878.4411.55
No change
(presence)
50.4462.9951.0962.1247.2763.9447.7266.3747.4365.5947.5865.13
Table 4. Genetic diversity of stable and unstable regions.
Genetic Diversity in Stable HabitatsGenetic Diversity in Unstable Habitats
Min0.00020 0.00002
Max0.86700 1.00000
Mean0.41184 0.42604
SD0.07714 0.08701
CV0.18730 0.20422
Table 5. Correlation and significance results of contemporary genetic diversity and suitability area level of T. wallichiana complex.
LIGLGMMHPresent2070 RCP 2.62070 RCP 4.52070 RCP 8.5
r0.17481 * 0.19816 ** 0.18687 ** 0.16481 * 0.19912 ** 0.19375 ** 0.19116 **
p0.01426 0.00537 0.00873 0.02098 0.00514 0.00651 0.00728
* p < 0.05, ** p < 0.01.
Disclaimer/Publisher’s Note: The statements, opinions and data contained in all publications are solely those of the individual author(s) and contributor(s) and not of MDPI and/or the editor(s). MDPI and/or the editor(s) disclaim responsibility for any injury to people or property resulting from any ideas, methods, instructions or products referred to in the content.