Article

Microhabitat Structure Affects Ground-Dwelling Beetle Communities More than Temperature along an Urbanization Gradient

1
University of Rennes, CNRS, UMR 6553 ECOBIO, F-35000 Rennes, France
2
LTSER ZA Armorique, F-35000 Rennes, France
3
Agrocampus Ouest, UMR INRAE IGEPP, F-35000 Rennes, France
4
University of Rennes 2, CNRS, UMR 6554 LETG, F-35000 Rennes, France
*
Author to whom correspondence should be addressed.
Diversity 2024, 16(8), 504; https://doi.org/10.3390/d16080504
Submission received: 25 July 2024 / Revised: 8 August 2024 / Accepted: 11 August 2024 / Published: 19 August 2024
(This article belongs to the Section Biodiversity Conservation)

Abstract

:
Urbanization profoundly alters environmental conditions for organisms, particularly through the urban heat island (UHI) effect, which elevates temperatures in city centers. This study examines the influence of urban environmental variables on rove and ground beetle communities. We sampled 36 grasslands in Rennes (northwestern France), yielding 3317 and 505 staphylinid and carabid adult individuals, respectively, belonging to 121 and 60 species, respectively. Staphylinid and carabid communities are not primarily affected by temperature-related variables. Staphylinids, often overlooked in urban ecology, showed species composition variation to be influenced by habitat and temperature, whereas their functional diversity was positively correlated with herbaceous vegetation height only. In contrast, carabid communities exhibited no significant relationship with the tested environmental variables. This study underscores the taxon-dependent nature of ectotherm’s responses to thermal environments. Although a further investigation into species-specific traits, and particularly dispersal capacities in staphylinids, is needed to advance our understanding of urbanization’s impact, our results indicate that functional diversity in staphylinid assemblages can be favored by locally reducing the mowing frequency or increasing the cutting height within urban green spaces.

1. Introduction

Urbanization strongly influences the environmental conditions experienced by city-dwelling organisms at landscape and local scales [1,2,3,4]. In particular, climatic conditions are altered through the proliferation of heat-absorbing materials and the canyon-like morphology of streets, leading to an increase in mean temperatures within city centers, as commonly referred to as the urban heat islands (UHI) phenomenon [5,6]. Investigations on urban-dwelling arthropods are essential to draw a representative assessment of the footprint left by urbanization on biodiversity [7] and notably by the UHI. For example, in a recent study, [8] highlighted that spider communities responded differently to environmental factors measured at the landscape (i.e., within buffers of a 100 m radius around study sites) and at the local scale (i.e., at the study site). This was also true regarding the temperature, with warming at the landscape scale (i.e., the atmospheric UHI) acting more as an environmental filter on species, than local temperature (i.e., measured near the ground) [8].
Among beetle dwellers of the soil surface, staphylinids and carabids are the most abundant groups in European ecosystems and are recognized as valuable biological indicators of anthropic pressures [9,10,11]. Along urbanization gradients, both groups are highly diverse and respond rapidly to urban environmental stressors, such as habitat loss or fragmentation [12,13,14,15]. Further, as ectothermic animals, beetles are likely to be constrained by temperature variations induced by UHI [16,17]. Although staphylinids can reach abundance levels similar to those of spiders [18], the deficit of community ecology studies focusing on this taxon may be explained by the complex identification of individuals at the species level. Moreover, the knowledge about species’ ecology and life history remains much more limited than for carabids [13], making functional approaches less straightforward. If carabids have been extensively investigated in the urban context [19], staphylinids were mainly studied in agricultural landscapes due to their potential for crop protection, and only a few studies aimed to test how this taxon is constrained by the urban environment [13,14,15,20].
Studies conducted on urban woodlots have shown that the community composition of both staphylinid and carabid beetles can be affected by landscape fragmentation within the urban matrix [13,14,21]. At the local scale (i.e., the woodlot patch scale), the increase in disturbance frequency (e.g., through management measures) was hypothesized to homogenize urban forest patches, removing microhabitats needed by some specialist carabid species [12]. Regarding staphylinids, the intensification of management practices in urban green spaces was associated with a decrease in species richness, doubtlessly due to a reduction of plant debris, preventing the establishment of phytodetriticol species and leading to biotic homogenization [15]. Responses to microhabitat structure are particularly expected in staphylinids because they harbor hyper-diver feeding habits, and many species are microhabitat specialists depending on particular structures such as dead wood or carcass for decomposers or even the presence of fungi in the case of fungivorous species [18].
To date, climatic variables were little considered to predict patterns of abundance, diversity, or composition within staphylinid and carabid urban communities [7]. In this study, we first compared the community compositions in both taxa across sampled on 36 urban grasslands, which were classified according to their environmental characteristics at the landscape and local scales. Under the landscape scale, we dissociated the role of atmospheric temperature (i.e., UHI-induced warming) from the role of habitat loss (i.e., the proportion of impervious surface). Landscape predictors are generally considered upper-level filters that determine the permeability of the surrounding urban matrix for the immigration of species from rural adjacent areas into cities [22,23]. Under “local factors”, we distinguished microclimatic temperature (i.e., near-ground warming) from micro-habitat structure (i.e., herbaceous vegetation height and cover). These local factors are intended to determine habitat suitability and are related to species survival, reproduction success, and abundance [23,24]. In a second step, we disentangled the effect of the landscape factors from those of the local ones to explain activity density and diversity patterns within staphylinid and carabid communities. In addition to taxonomic diversity indices, we considered functional diversity to evaluate the relative weights of landscape and local-scale predictors in shaping diversity patterns since species’ responses to their environment are strongly linked to their functional traits [25].

2. Materials and Methods

2.1. Sampling Sites

We conducted this study in Rennes and its surroundings. Rennes is a city of 223,000 inhabitants in northwestern France. Located 70 km from the sea, the city experiences a temperate oceanic climate. In 2022, the mean annual temperature was 13.7 °C, with an average winter temperature of 7.7 °C and an average summer temperature of 19.6 °C (data from Saint-Jacques airport station). Despite its mild climate, Rennes frequently experiences UHI events. From 2004 to 2019, intense UHI conditions (with temperatures exceeding 4 °C above the rural surroundings) accounted for over 17% of the total nights, whereby in certain months (i.e., September), this proportion increased to 30% [26].
We used sensors from Rennes Urban Network (https://run.letg.cnrs.fr, access on 1 June 2023) to characterize the atmospheric UHI. Since 2020, 30 DAVIS Vantage-Pro-2 automatic weather stations and 93 connected temperature sensors (Rising-HF- RHF1S001) collect temperature data at 60 and 15 min frequencies, respectively, across the city center and the peri-urban and rural areas of Rennes. We calculated the daily UHI intensity by the difference between the minimum daily temperature data at a reference cold station located outside the urban area (Melesse—about 11 km in the north of Rennes, 48°12′18.1″ N 1°40′52.8″ W) and the minimum daily temperature data recorded by all other sensors. These discrete measures of daily UHI intensity were then interpolated by inverse distance weighting to obtain maps of estimated values covering the entire city extent at 100 m resolution [26]. We averaged the daily UHI intensity values for the whole study period (from 1 March to 30 September 2022) to obtain a single raster map of mean atmospheric UHI intensity (Figure 1).
To select appropriate sampling sites within the study area, we first performed a spatial correlation analysis to identify areas where the proportion of built-up areas and the atmospheric UHI intensity are not correlated [8]. We chose grasslands as a model ecosystem because they represent 445 ha (i.e., 56%) of urban green spaces in Rennes [27], and urban grasslands are known to support abundant ground-dwelling arthropod communities [24], ensuring a suitable sampling size. We selected 36 grasslands belonging to public parks, community gardens, green spaces adjacent to educational buildings, or private gardens. This sampling site selection process enables us to distinguish the separate impacts of habitat from temperature-related predictors [8].

2.2. Arthropod Sampling

We sampled staphylinid and carabid beetles using three pitfall traps per sampling site during a two-week period each month from March to September 2022. The traps were strategically positioned 5 m apart in a triangular formation to optimize capture rates [28] and were oriented towards the north, southeast, and southwest directions. Traps were made of plastic cups measuring 85 mm in diameter and 115 mm in height. Each trap was filled with 150 mL of saline solution (at a concentration of 100 g·L−1) to enhance insect preservation, along with a drop of neutral soap to prevent floating. Following each sampling session, staphylinid and carabid individuals were sorted and placed into separate vials containing 70% ethanol for storage. Staphylinids were identified at the species level [29,30], except for 12 species that have been considered morphospecies (Table S1). Carabid individuals were identified at the species level [31]. To investigate the functional responses of staphylinids and carabids, we retrieved trait information related to feeding group and body size for each species from the literature (Tables S1 and S2). If feeding information was unavailable for a particular species, we inferred based on the ecological characteristics of other species within the same genus, where available. Otherwise, the feeding group was categorized as unknown [32].

2.3. Community Indices

To compute community indices, the raw arthropod data were pooled by site to obtain a total abundance value per species and site. Independently for staphylinids and carabids, we first computed the total number of collected individuals per site (i.e., the activity density). In addition, we computed the taxonomic diversity using the Hill numbers of orders q = 0, 1, and 2. This approach enables us to account for the possible influence of dominance patterns, with indices of order Q0 being the most sensible to rare species (i.e., the actual species richness) and Q2 the less sensible [33]. We used the equivalent indices to compute the functional diversity but calculated them from functional data related to the species’ feeding group and body size. To do so, we computed a species’ functional distance matrix on multiple traits using the Gower method [34] with the ‘daisy’ function of the ‘cluster’ R-package (version 2.1.6 [35]). Based on this, we computed functional diversity indices (of orders q = 0, 1, and 2) to quantify the effective number of equally distinct virtual functional groups, which can thus be considered ‘functional species’ [36]. Taxonomic and functional diversity indices were computed using the R-package ‘iNEXT.3D’(version 1.0.5) [36]. To correct for bias due to potential differences in sampling coverages among sampling sites, we rarefied or extrapolated indices to reach a reference sampling coverage, using the function ‘estimate3D’ with a default value of ‘0.95’.

2.4. Environmental Variables

To describe the environment at the landscape scale, we calculated (1) the mean UHI value and (2) the proportion of impervious surface within buffers of 100 m around each study site. To compare several spatial scales, we also calculated these variables over larger extents ranging from 100 m to 1 km from the sampling sites [2,37,38]. More precisely, we considered concentric rings of areas between a 100 m and 200 m radius, between a 200 m and 500 m radius, and between a 500 m and 1000 m radius around each sampling site.
At the local scale, we measured the near-ground temperature every 15 min during each trapping session. To do so, we used a temperature sensor (Lascar EL-USB-2+; Tinytag Talk 2 TK-4023) placed 5 cm above the ground surface, next to the north-headed pitfall trap at each sampling site. As for the atmospheric UHI, we calculated the differences between the daily minimum temperatures obtained from the station showing the lowest averaged near-ground temperature (Cesson-Sévigné, 48°06′36.6″ N–1°36′29.9″ W) and that of each of the other sites. We then averaged these daily differences throughout the study period to obtain a single near-ground temperature value by site. To quantify the habitat structure, we also measured the percent cover of plant species and the height of the vegetation within the triangle delineated by the three pitfall traps at each site and during each sampling session. We then averaged the values to obtain one final value per site and per predictor.

2.5. Data Analysis

2.5.1. Community Composition Analysis

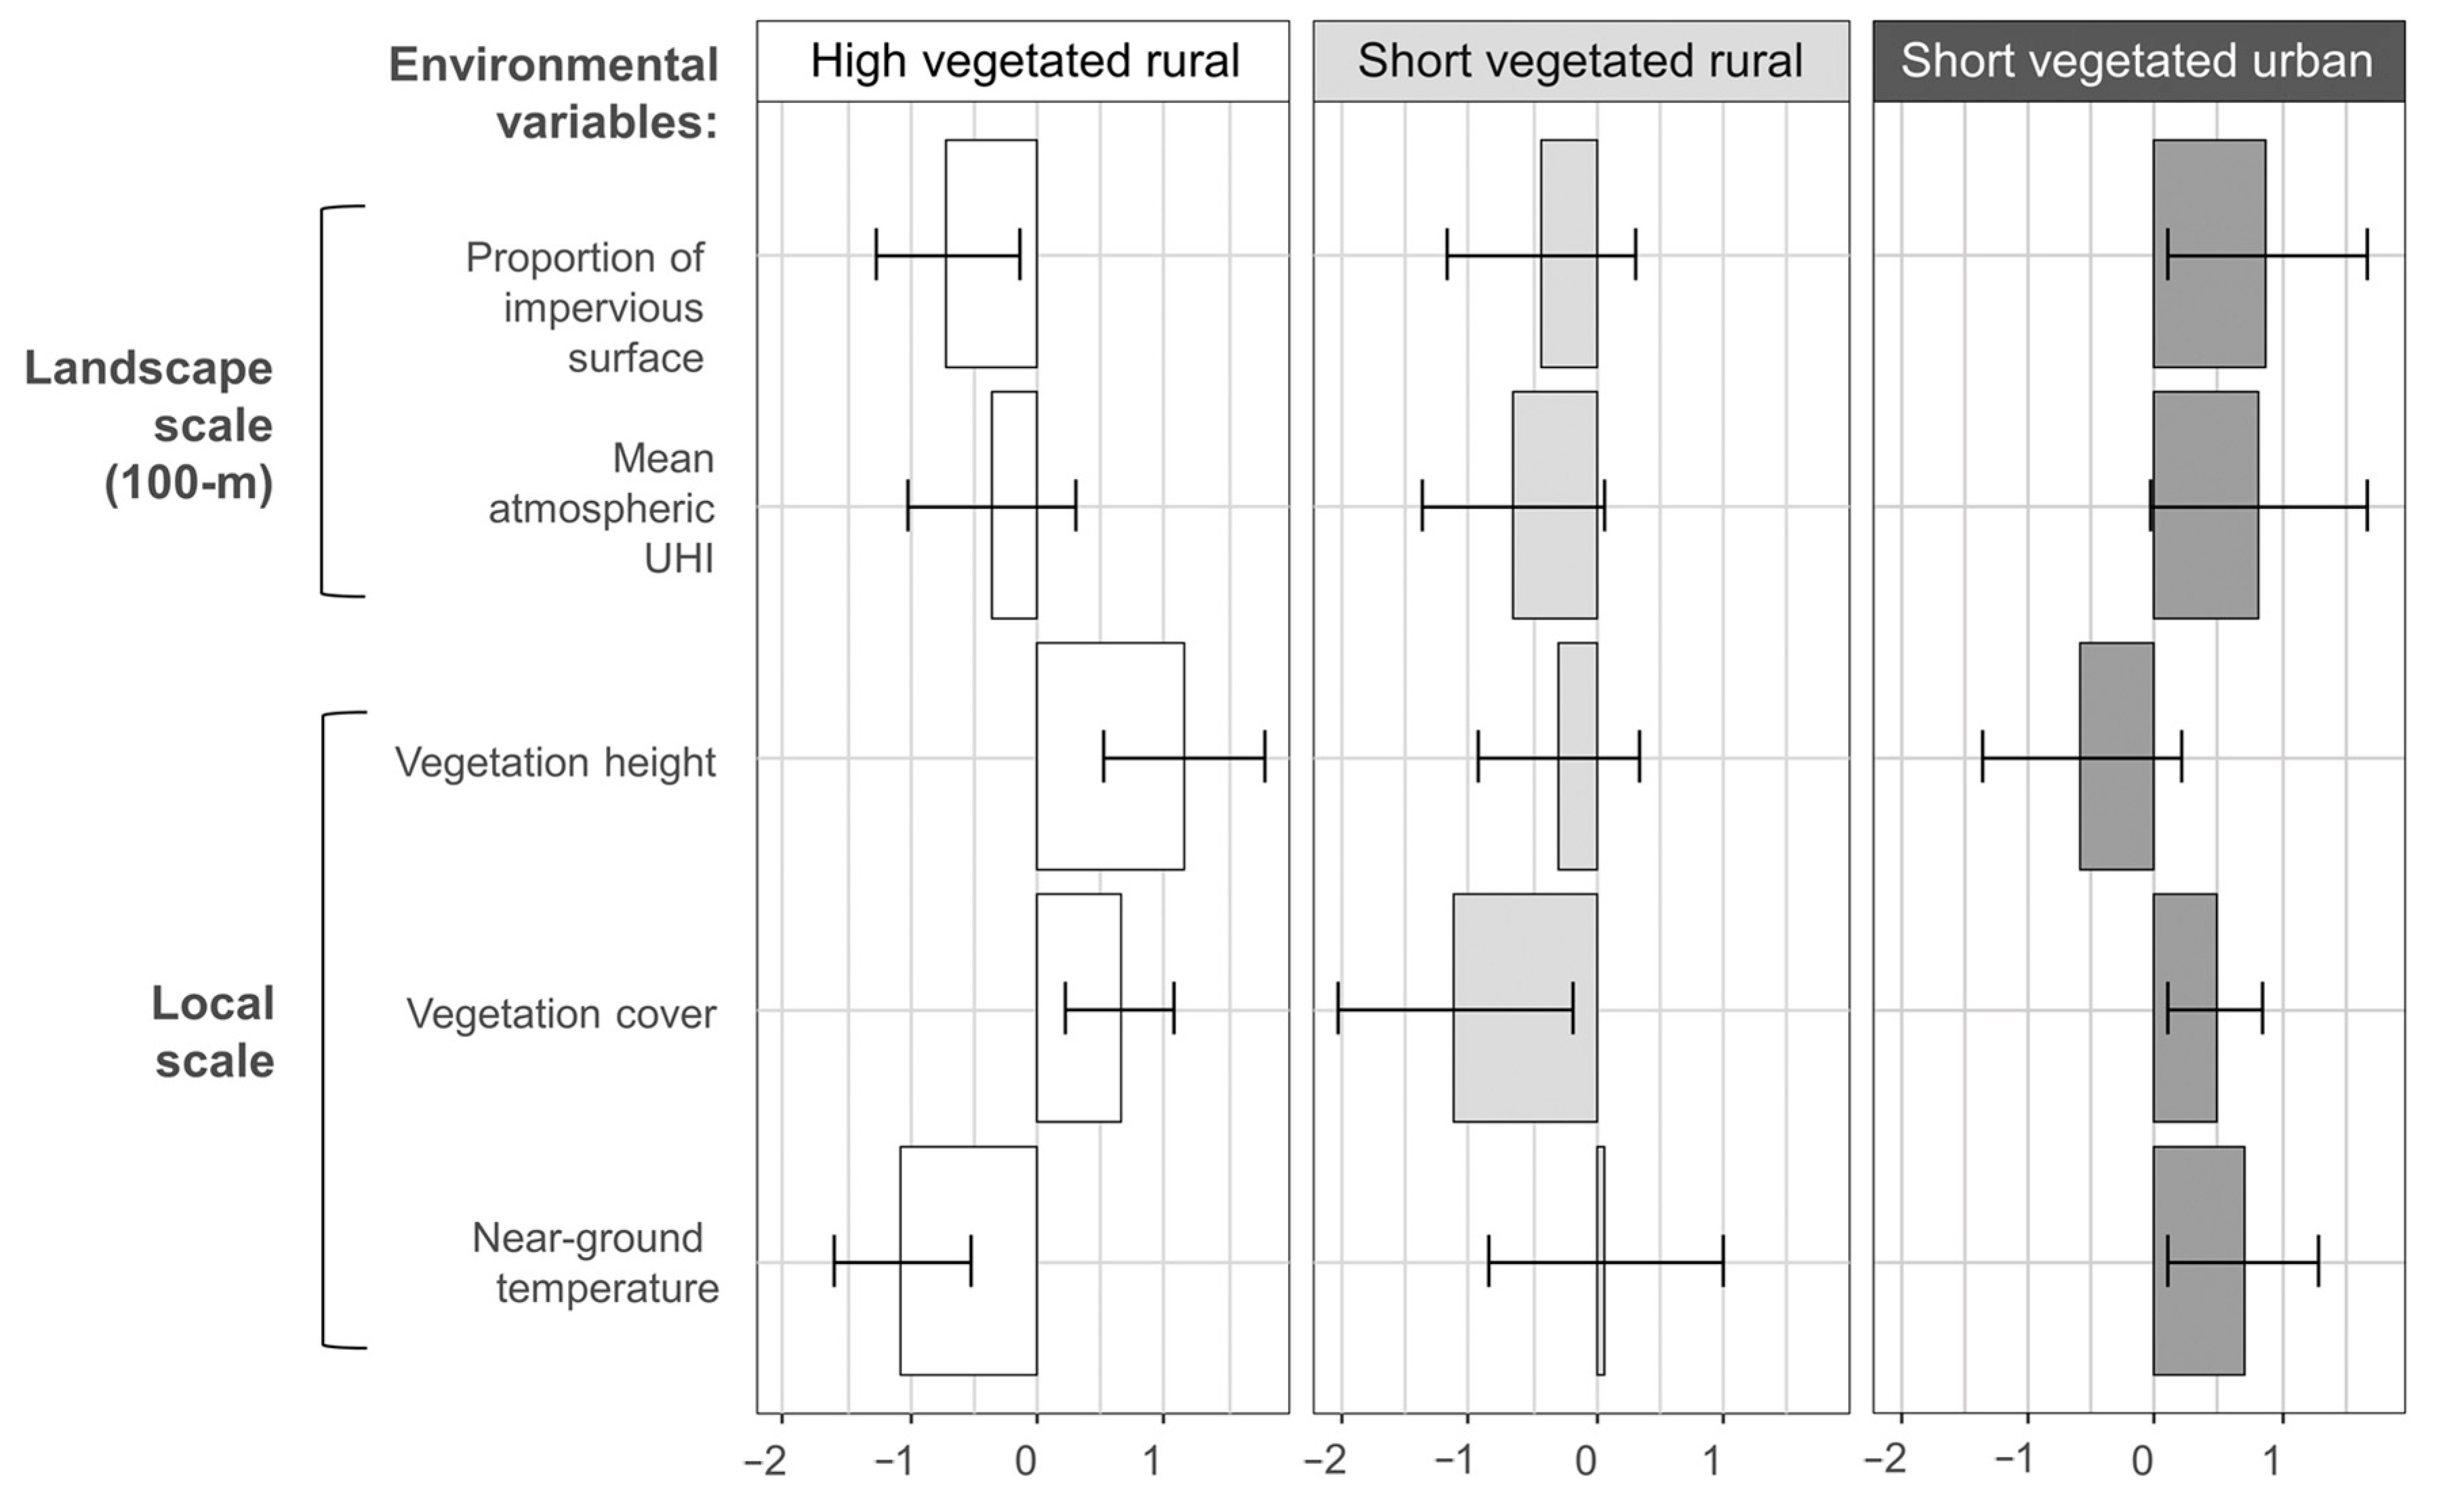
To compare the community composition among groups of sites sharing similar environmental characteristics, we performed a hierarchical clustering analysis based on all scaled environmental variables. We used the ‘HCPC’ function and the ‘Ward’ method to construct the tree in the ‘FactoMineR’ package (version 2.7) [39]. The optimal number of clusters was determined according to the partition with the higher relative loss of inertia [39]. Once the sites were grouped into clusters, we performed a silhouette analysis to check the agreement of individual sites with their own cluster, using the ‘silhouette’ function from the ‘cluster’ package (version 2.1.6) [40]. The site classification resulted in 3 clusters of sites defined as ‘high vegetated rural’, ‘low vegetated rural’, and ‘low vegetated urban’. The mean scaled values and standard deviations of environmental variables into three clusters after the classification of sampling sites are reported in Appendix A.
We tested the difference in community composition among clusters of sites by using non-metric multidimensional scaling (NMDS, Bray–Curtis dissimilarity, ‘vegan’ package) and pairwise permutational multivariate analysis of variance (9999 permutations), using the ‘pairwise.perm.manova’ function from the ‘RVAideMemoire’ package (version 0.9-83-3).

2.5.2. Community Diversity Analysis

To determine the main predictors of staphylinid and carabid community indices, we conducted a variation partitioning analysis to separate the effects of habitat and temperature at different spatial scales (i.e., landscape- or local-scale predictors) with the ‘vegan’ package (version 2.6-6.1 [41]). We separately sorted the response indices of staphylinids and carabids among three independently analyzed response datasets: activity density, taxonomic diversity (composed of three indices; Hill numbers of order q = 0, 1, and 2), and functional diversity (composed of three indices; Hill numbers of order q = 0, 1 and 2). Predictors were sorted among four datasets: local habitat (composed of two variables: vegetation cover and vegetation height), near-ground temperature, proportion of impervious surface, and atmospheric UHI. In order to compare the effects of distinct landscape scales, we separately ran the variation partitioning with the proportion of impervious surface and the atmospheric UHI calculated within (1) a 100 m radius buffer around each sampling site and concentric rings between (2) 100 m and 200 m radius, (3) 200 m and 500 m radius, (4) 500 m and 1000 m radius. Since the local habitat dataset contained more than a single predictor, we reported the adjusted R2 as an estimator of the explained variation to prevent inflated R2 values [42]. We identified significant explanatory datasets by performing permutation tests for redundancy analysis (RDA) using the ‘anova.cca’ function [43]. In case a community dataset was significantly linked to an explanatory dataset, we additionally ran a Generalized Linear Model (GLM) fitted with the involved variables to determine how single community indices were linked to predictors.
All statistical analyses were performed in R version 4.0.3 [44].

3. Results

In total, 3317 staphylinid individuals of 121 species were collected with Tachyporus hypnorum (N = 556), Drusilla canaliculate (N = 462), Mocyta gr. Fungi (N = 285) and Philonthus cognatus (N = 217) being the dominant species. Regarding carabids, 505 individuals of 60 species were collected and included in the analysis, with Amara communis (N = 55), Amara convexior (N = 53), and Bembidion properans (N = 46) being the dominant species. All predictors were weakly correlated when buffers of 100 m radius or ring of extent 100–200 m were considered for computing landscape-scale predictors (r < 0.7) (Table S3). At larger scales, impervious surface and UHI were strongly positively correlated (r > 0.8) (Table S3).

3.1. Community Composition

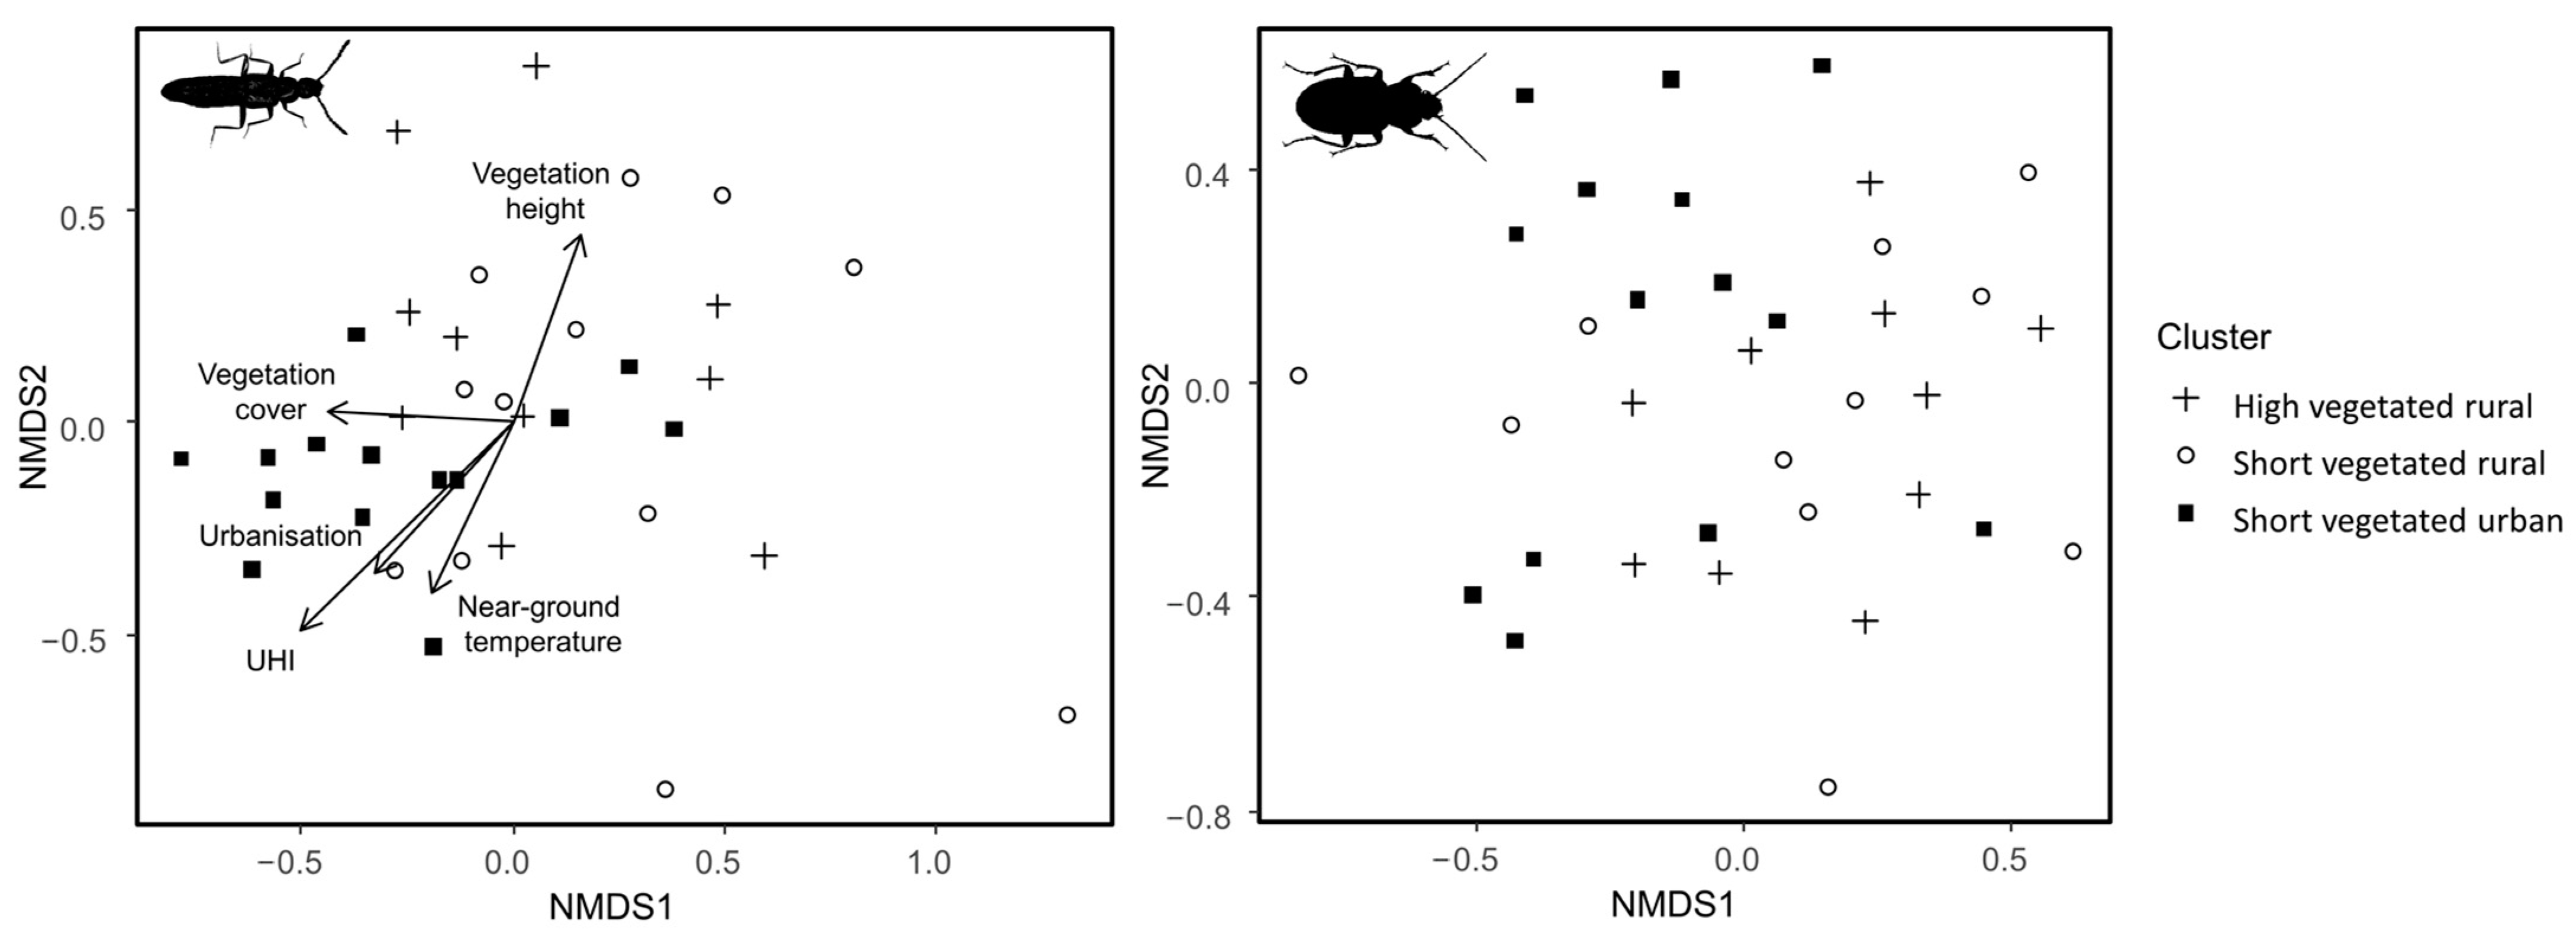
The results of NMDS showed that the community composition of staphylinids and carabids differed among clusters (staphylinids: stress = 0.215, p = 0.005; carabids: stress = 0.210, p = 0.003). The communities from the rural clusters were not significantly different from each other but significantly differed from the ‘short vegetated urban’ cluster. In staphylinids, the community composition was significantly structured by all the tested variables (Figure 2). In carabids instead, none of the environmental variables explained the community structure.

3.2. Density and Diversity Indices

Variation partitioning showed that only functional diversity was constrained by the environment, and habitat structure was the only significant predictor in staphylinids. This result was found with all spatial scales considered to calculate the proportion of impervious surface and UHI datasets included in the analysis (Figure 3). In contrast, none of the predictor datasets significantly explained the variance of carabids, neither in activity density nor in taxonomic or functional diversity, with any of the scales considered to calculate the proportion of impervious surface and the atmospheric UHI (Figure 3).
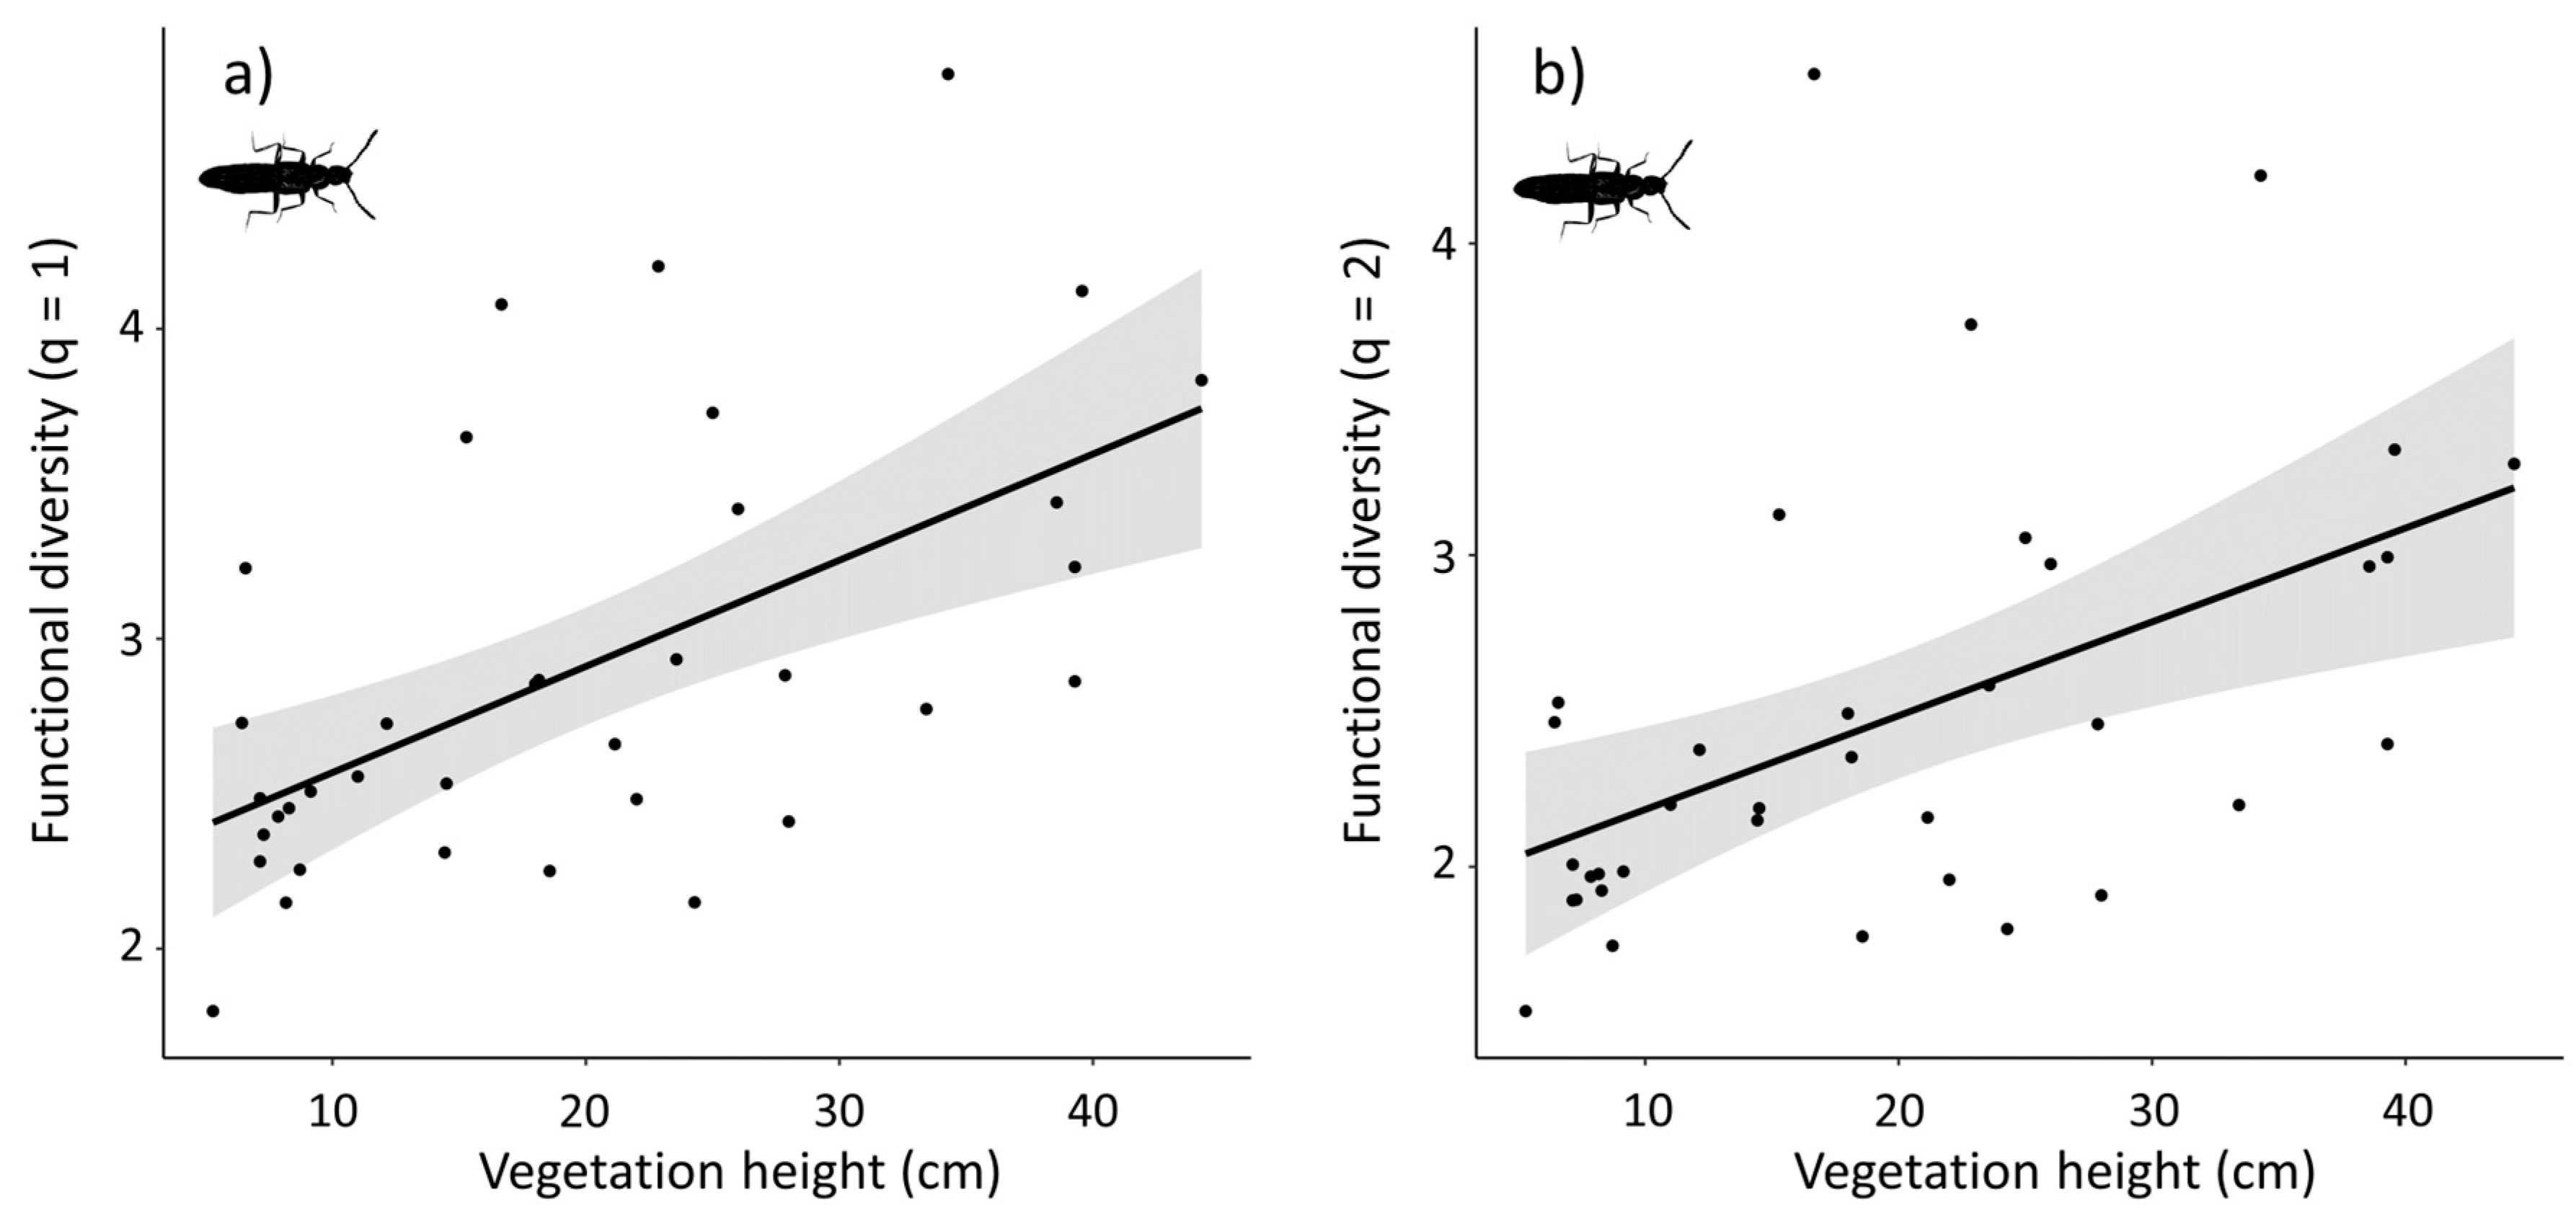
The GLMs related to staphylinid data indicated that the functional diversity indices at orders q = 1 and q = 2 were significantly linked to the local habitat and that vegetation height, not vegetation cover, positively affected the functional diversity index of order q = 1 (Figure 4a, coef. = 0.038, p < 0.001, adjusted R2 = 0.38) and q = 2 (Figure 4b, coef. = 0.035, p < 0.001, adjusted R2 = 0.33).

4. Discussion

This study explores which urban environmental variables affect staphylinid and carabid beetle communities. These outcomes directly complement previous results obtained on spiders in the same study area [8]. We show that unlike spiders, staphylinid and carabid communities are not primarily affected by temperature-related variables. Staphylinids remain to date rarely considered in urban ecology studies, although our sampling results indicate their high potential as diverse and abundant arthropod model taxon for studying urban grasslands’ fauna. If the species composition of staphylinids was already found to be impacted by urbanization [13], our study provides new outcomes by investigating the relative importance of underlying variables related to habitat and temperature at multiple scales.

4.1. Density and Diversity Indices

Landscape variables (i.e., proportion of impervious surface and atmospheric UHI) had no effects on staphylinids’ activity density and diversities (incl. taxonomic and functional). Instead, we found the functional diversity of staphylinids to be positively linked to the height of the herbaceous vegetation layer locally. This pattern was already identified in other arthropods (e.g., spiders [45,46,47]), where local habitat predictors performed better in predicting functional diversity than landscape predictors. It is interesting to note that the pattern we observe only concerns the functional diversity indices giving little weight to rare ‘functional species’. This indicates that common functional characteristics are more diverse within staphylinid communities living in high vegetation and is not due to the presence of a few individuals with particular ecological characteristics. The fact that the functional diversity of staphylinids is favored by a high vegetation layer may be linked to the increased diversity of vertical structures provided by grown vegetation. In particular, complex vertical structures within the herbaceous vegetation may sustain more diverse feeding groups within staphylinid communities than shortly-mown homogenous lawns. For instance, high vegetation may offer more opportunities for phytophagous species to feed directly on plants. Indirectly, higher vegetation may maintain a high moisture amount at the ground level and favor the fungal development that is needed by fungivorous species to feed. Further, high plants may host more prey (e.g., aphids), which might be beneficial for predatory staphylinids.
Although we expected similar results to occur in carabids, the community composition analysis showed that assemblages are different from one site cluster to another, whereby none of the tested environmental variables were significant predictors. This result, combined with the absence of relationships between diversity indices and any of the predictor datasets, suggests that carabid communities are shaped by the environment, but the environmental variables that we investigate here are not the determinant ones. For example, many carabid species sampled in our study are herbivorous and vegetation composition may therefore be an important predictor to consider. A previous study conducted in the same study area evidenced that carabid communities can be primarily impacted by changes in the urban matrix at the landscape scale (i.e., 600 m, [21]). Because of their limited dispersal abilities, carabids might be strongly subject to large-scale urban filtering and become globally less abundant and diverse in urban areas but adapt to urban environmental constraints [21]. However, we should be cautious when comparing these results since in previous studies led in Rennes [48], carabids were sampled in urban woodlands, and patterns may diverge from grassland communities. In addition, it is important to emphasize that the lack of responses observed in carabids in our study may also be influenced by the relatively low number of individuals caught. Future work will be needed to fully understand our non-significant results. For instance, since many sampled carabid species are herbivorous, other habitat characteristics such as vegetation composition (but also soil characteristics, biotic interactions) not included here might be determinant habitat predictors [49].

4.2. Absence of Temperature Effect

Previous studies conducted in the same study area have shown that spiders were primarily constrained by urban temperature variation [8]. Like spiders, staphylinids and carabids are ground-dwelling predators occurring in urban grasslands. However, unlike spiders, they did not respond to temperature. Differences in behaviors, interactions, and life histories can modulate the response of terrestrial ectotherms to temperature increase [50,51,52]. However, contrasting physiological heat tolerance among taxonomical groups is expected to be the main factor explaining inconsistent responses of arthropods to temperature increase [53]. For example, warmer thermal conditions tend to support the fitness of taxa tolerating a wide temperature range, whereas those with narrow thermal tolerance breadth are more negatively affected [7]. A strong physiological variability among taxa can, therefore, be expected to explain differences in terms of response strength. Staphylinid and carabid beetle species from assemblages investigated here may, therefore, tolerate higher temperatures or have a wider thermal tolerance breadth than spiders.
In addition to the effect of physiological thermal tolerances, the responses to temperature increase may be modulated by arthropods’ life-history traits. For example, dispersal capacity has been demonstrated as a determinant factor affecting the direction of the relationship between body size variation and the UHI intensity among arthropod groups [54]. Recent results on spiders captured in Rennes have shown that the strength of the relationship between body size and the environmental temperature varied according to the species’ capacity to disperse over long distances or not [55]. More precisely, this latest study revealed that small species also able to aerially disperse were less affected by warming than larger and less mobile wandering species. When brought in relation to the present results, these outcomes suggest that the pattern variability observed among species belonging to a particular taxon may explain that community-wide signals of response to warming can be blurred by interspecific variations, making effect-prediction related to urban warming challenging [7]. In light of our results, life histories of staphylinid and carabid species belonging to sampled communities may be diverse [56,57], which may explain the lack of signal at the community scale. Therefore, gathering information relative to dispersal (e.g., flying capacity, a poorly documented trait in staphylinids) may help to determine whether patterns occur within high and low dispersers, independently.
In conclusion, our study brings new evidence that the responses of ectotherm communities in terms of composition and diversity to the thermal environment are taxon-dependent. Therefore, general patterns cannot be drawn regarding the effect of UHI or near-ground temperature on the arthropod fauna. Our results suggest that reducing mowing frequency or increasing cutting height should promote the functional diversity within staphylinid assemblages. Yet, the consideration of additional life-history traits (e.g., dispersal capacities) as potential predictors of the community-wide thermal response may enable us to advance our mechanistic understanding. However, the difficulty of a multi-taxonomic approach currently lies in the lack of information available on the functional traits of the species making up arthropod communities. In particular, future research efforts should be made to better document the life history traits of staphylinids, a reliable indicator of environmental changes related to urbanization.

Supplementary Materials

The following supporting information can be downloaded at https://www.mdpi.com/article/10.3390/d16080504/s1, Table S1: List of staphylinid species and corresponding trait information relative to diet and body size (given in millimeters). The number of caught individuals is indicated in column ‘N’; Table S2: List of carabid species and corresponding trait information relative to diet and body size (given in millimeters). The number of caught individuals is indicated in column ‘N’; Table S3: Matrix of correlations among predictors. ‘Imp’ refers to the proportions of impervious surface and UHI to the mean urban heat island intensity. These variables are followed by numbers indicating the size of buffers or rings considered to calculate their value. ‘Veg_cover’ and ‘Veg_height’ refer to the herbaceous vegetation cover and height, respectively. ‘Near-ground_tem’ refers to warming measured near the ground.

Author Contributions

Conceptualization, V.C., H.Q. and B.B.; Data curation, V.C.; Formal analysis, V.C.; Funding acquisition, H.Q. and B.B.; Project administration, B.B.; Supervision, H.Q. and B.B.; Validation, Y.L., R.G. and V.D.; Writing—original draft, V.C.; Writing—review and editing, V.C., Y.L., R.G., H.Q., V.D. and B.B. All authors have read and agreed to the published version of the manuscript.

Funding

This project received financial support from the CNRS through the MITI interdisciplinary programs through its exploratory research program (project “BiodivR”). We are also grateful to the University of Rennes, and to the region of Brittany for financing this research as part of the ARED program.

Institutional Review Board Statement

This research has been carried out in accordance with national and institutional regulations. The study conforms with all relevant legislation concerning animal welfare.

Data Availability Statement

Data are provided in Supplementary Materials.

Acknowledgments

We thank the team of the Department of Plant Ecology from the Technische Universität Berlin for having made temperature loggers available to us during the time of the experiment. We further thank Rennes Métropole, the DJB (Direction des Jardins et de la Biodiversité) of Rennes, the city councils of Cesson-Sévigné, Chantepie, Saint-Jacques-de-la-Lande and all community gardens. Finally, we thank the high school Emile Zola, the Institut Agro Rennes, and the DIR Ouest for having authorized and helped us with the sampling in green spaces.

Conflicts of Interest

The authors declare no conflicts of interest.

Appendix A

Figure A1. Mean scaled values and standard deviations (black segments) of environmental variables after classification of sampling sites into three clusters by hierarchical clustering. Clustering was performed based on the two and three variables measured at the landscape and local scale, respectively.
Diversity 16 00504 g0a1

References

  1. Norton, B.A.; Thomson, L.J.; Williams, N.S.G.; McDonnell, M.J. The Effect of Urban Ground Covers on Arthropods: An Experiment. Urban Ecosyst. 2014, 17, 77–99. [Google Scholar] [CrossRef]
  2. Philpott, S.; Cotton, J.; Bichier, P.; Friedrich, R.; Moorhead, L.; Uno, S.; Valdez, M. Local and Landscape Drivers of Arthropod Abundance, Richness, and Trophic Composition in Urban Habitats. Urban Ecosyst. 2014, 17, 513–532. [Google Scholar] [CrossRef]
  3. Otoshi, M.D.; Bichier, P.; Philpott, S.M. Local and Landscape Correlates of Spider Activity Density and Species Richness in Urban Gardens. Environ. Entomol. 2015, 44, 1043–1051. [Google Scholar] [CrossRef]
  4. Kyrö, K.; Brenneisen, S.; Kotze, D.J.; Szallies, A.; Gerner, M.; Lehvävirta, S. Local Habitat Characteristics Have a Stronger Effect than the Surrounding Urban Landscape on Beetle Communities on Green Roofs. Urban For. Urban Green. 2018, 29, 122–130. [Google Scholar] [CrossRef]
  5. Oke, T.R.; Mills, G.; Christen, A.; Voogt, J.A. Urban Climates; Cambridge University Press: Cambridge, UK, 2017; ISBN 978-0-521-84950-0. [Google Scholar]
  6. Foissard, X.; Dubreuil, V.; Quenol, H. Defining Scales of the Land Use Effect to Map the Urban Heat Island in a Mid-Size European City: Rennes (France). Urban Clim. 2019, 29, 100490. [Google Scholar] [CrossRef]
  7. Piano, E.; Bona, F.; Isaia, M. Urbanization Drivers Differentially Affect Ground Arthropod Assemblages in the City of Turin (NW-Italy). Urban Ecosyst. 2020, 23, 617–629. [Google Scholar] [CrossRef]
  8. Cabon, V.; Quénol, H.; Dubreuil, V.; Ridel, A.; Bergerot, B. Urban Heat Island and Reduced Habitat Complexity Explain Spider Community Composition by Excluding Large and Heat-Sensitive Species. Land 2024, 13, 83. [Google Scholar] [CrossRef]
  9. Bohac, J. Staphylinid Beetles as Bioindicators. Agric. Ecosyst. Environ. 1999, 74, 357–372. [Google Scholar] [CrossRef]
  10. Rainio, J.; Niemelä, J. Ground Beetles (Coleoptera: Carabidae) as Bioindicators. Biodivers. Conserv. 2003, 12, 487–506. [Google Scholar] [CrossRef]
  11. Michaels, K.F. Using Staphylinid and Tenebrionid Beetles as Indicators of Sustainable Landscape Management in Australia: A Review. Aust. J. Exp. Agric. 2007, 47, 435–449. [Google Scholar] [CrossRef]
  12. Niemelä, J.; Kotze, D.J.; Venn, S.; Penev, L.; Stoyanov, I.; Spence, J.; Hartley, D.; de Oca, E.M. Carabid Beetle Assemblages (Coleoptera, Carabidae) across Urban-Rural Gradients: An International Comparison. Landsc. Ecol. 2002, 17, 387–401. [Google Scholar] [CrossRef]
  13. Deichsel, R. Species Change in an Urban Setting—Ground and Rove Beetles (Coleoptera: Carabidae and Staphylinidae) in Berlin. Urban Ecosyst. 2006, 9, 161–178. [Google Scholar] [CrossRef]
  14. Vergnes, A.; Le Viol, I.; Clergeau, P. Green Corridors in Urban Landscapes Affect the Arthropod Communities of Domestic Gardens. Biol. Conserv. 2012, 145, 171–178. [Google Scholar] [CrossRef]
  15. Magura, T.; Nagy, D.; Tóthmérész, B. Rove Beetles Respond Heterogeneously to Urbanization. J. Insect Conserv. 2013, 17, 715–724. [Google Scholar] [CrossRef]
  16. Piano, E.; De Wolf, K.; Bona, F.; Bonte, D.; Bowler, D.E.; Isaia, M.; Lens, L.; Merckx, T.; Mertens, D.; Van Kerckvoorde, M.; et al. Urbanization Drives Community Shifts towards Thermophilic and Dispersive Species at Local and Landscape Scales. Glob. Chang. Biol. 2017, 23, 2554–2564. [Google Scholar] [CrossRef] [PubMed]
  17. Lövei, G.L.; Magura, T. Body Size and the Urban Heat Island Effect Modulate the Temperature–Size Relationship in Ground Beetles. J. Biogeogr. 2022, 49, 1618–1628. [Google Scholar] [CrossRef]
  18. Irmler, U.; Lipkow, E. Effect of Environmental Conditions on Distribution Patterns of Rove Beetles. In Biology of Rove Beetles (Staphylinidae): Life History, Evolution, Ecology and Distribution; Betz, O., Irmler, U., Klimaszewski, J., Eds.; Springer International Publishing: Cham, Switzerland, 2018; pp. 117–144. ISBN 978-3-319-70257-5. [Google Scholar]
  19. Magura, T.; Lövei, G.L. Consequences of Urban Living: Urbanization and Ground Beetles. Curr. Landsc. Ecol. Rep. 2021, 6, 9–21. [Google Scholar] [CrossRef]
  20. Vergnes, A.; Pellissier, V.; Lemperiere, G.; Rollard, C.; Clergeau, P. Urban Densification Causes the Decline of Ground-Dwelling Arthropods. Biodivers. Conserv. 2014, 23, 1859–1877. [Google Scholar] [CrossRef]
  21. Croci, S.; Butet, A.; Georges, A.; Aguejdad, R.; Clergeau, P. Small Urban Woodlands as Biodiversity Conservation Hot-Spot: A Multi-Taxon Approach. Landsc. Ecol. 2008, 23, 1171–1186. [Google Scholar] [CrossRef]
  22. Faeth, S.H.; Bang, C.; Saari, S. Urban Biodiversity: Patterns and Mechanisms. Ann. N. Y. Acad. Sci. 2011, 1223, 69–81. [Google Scholar] [CrossRef]
  23. Beninde, J.; Veith, M.; Hochkirch, A. Biodiversity in Cities Needs Space: A Meta-Analysis of Factors Determining Intra-Urban Biodiversity Variation. Ecol. Lett. 2015, 18, 581–592. [Google Scholar] [CrossRef] [PubMed]
  24. Proske, A.; Lokatis, S.; Rolff, J. Impact of Mowing Frequency on Arthropod Abundance and Diversity in Urban Habitats: A Meta-Analysis. Urban For. Urban Green. 2022, 76, 127714. [Google Scholar] [CrossRef]
  25. Díaz, S.; Lavorel, S.; Chapin, F.S.; Tecco, P.A.; Gurvich, D.E.; Grigulis, K. Functional Diversity—At the Crossroads between Ecosystem Functioning and Environmental Filters. In Terrestrial Ecosystems in a Changing World; Canadell, J.G., Pataki, D.E., Pitelka, L.F., Eds.; Global Change—The IGBP Series; Springer: Berlin/Heidelberg, Germany, 2007; pp. 81–91. ISBN 978-3-540-32730-1. [Google Scholar]
  26. Dubreuil, V.; Foissard, X.; Nabucet, J.; Thomas, A.; Quénol, H. Fréquence et intensité des îlots de chaleur à rennes: Bilan de 16 années d’observations (2004–2019). Climatologie 2020, 17, 6. [Google Scholar] [CrossRef]
  27. Chollet, S.; Brabant, C.; Tessier, S.; Jung, V. From Urban Lawns to Urban Meadows: Reduction of Mowing Frequency Increases Plant Taxonomic, Functional and Phylogenetic Diversity. Landsc. Urban Plan. 2018, 180, 121–124. [Google Scholar] [CrossRef]
  28. Ward, D.F.; New, T.R.; Yen, A.L. Effects of Pitfall Trap Spacing on the Abundance, Richness and Composition of Invertebrate Catches. J. Insect Conserv. 2001, 5, 47–53. [Google Scholar] [CrossRef]
  29. Lott, D.A. The Staphylinidae (Rove Beetles) of Britain and Ireland. Part 5: Scaphidiinae, Piestinae, Oxytelinae; Royal Entomological Society: London, UK, 2009; Volume 12, ISBN 978-0-901546-90-6. [Google Scholar]
  30. Lott, D.A.; Anderson, R. The Staphylinidae (Rove Beetles) of Britain and Ireland. Parts 7 & 8: Oxyporinae, Steninae, Euaesthetinae, Pseudopsinae, Paederinae, Staphylininae; Royal Entomological Society: London, UK, 2011; Volume 12, ISBN 978-0-901546-92-0. [Google Scholar]
  31. Jeannel, R. Faune de France—Colèoptères Carabiques; Office Central de Faunistique; Office Central de Faunistique; Paul LECHEVALIER—PARIS 1949: Paris, France, 1949. [Google Scholar]
  32. Clough, Y.; Kruess, A.; Tscharntke, T. Organic versus Conventional Arable Farming Systems: Functional Grouping Helps Understand Staphylinid Response. Agric. Ecosyst. Environ. 2007, 118, 285–290. [Google Scholar] [CrossRef]
  33. Hill, M.O. Diversity and Evenness: A Unifying Notation and Its Consequences. Ecology 1973, 54, 427–432. [Google Scholar] [CrossRef]
  34. Gower, J.C. A General Coefficient of Similarity and Some of Its Properties. Biometrics 1971, 27, 857–871. [Google Scholar] [CrossRef]
  35. Maechler, M.; Rousseeuw, P.; Struyf, A.; Hubert, M.; Hornik, K.; Roudier, P.; Gonzalez, J.; Kozlowski, K.; Schubert, E.; Murphy, K. Cluster: “Finding Groups in Data”: Cluster Analysis Extended Rousseeuw et al., R Package Version 2.1.6; 2023. Available online: https://cran.r-project.org/web/packages/cluster/cluster.pdf (accessed on 12 January 2024).
  36. Chao, A.; Henderson, P.A.; Chiu, C.-H.; Moyes, F.; Hu, K.-H.; Dornelas, M.; Magurran, A.E. Measuring Temporal Change in Alpha Diversity: A Framework Integrating Taxonomic, Phylogenetic and Functional Diversity and the iNEXT.3D Standardization. Methods Ecol. Evol. 2021, 12, 1926–1940. [Google Scholar] [CrossRef]
  37. Delgado de la Flor, Y.A.; Burkman, C.E.; Eldredge, T.K.; Gardiner, M.M. Patch and Landscape-Scale Variables Influence the Taxonomic and Functional Composition of Beetles in Urban Greenspaces. Ecosphere 2017, 8, e02007. [Google Scholar] [CrossRef]
  38. Chatelain, M.; Rüdisser, J.; Traugott, M. Urban-Driven Decrease in Arthropod Richness and Diversity Associated with Group-Specific Changes in Arthropod Abundance. Front. Ecol. Evol. 2023, 11, 980387. [Google Scholar] [CrossRef]
  39. Lê, S.; Josse, J.; Husson, F. FactoMineR: An R Package for Multivariate Analysis. J. Stat. Softw. 2008, 25, 1–18. [Google Scholar] [CrossRef]
  40. Maechler, M.; Rousseeuw, P.; Struyf, A.; Hubert, M.; Hornik, K.; Studer, M.; Roudier, P.; Gonzalez, J. Package ‘Cluster’, R Package Version 2.1.6; 2023. Available online: https://cran.r-project.org/web/packages/cluster/index.html (accessed on 12 January 2024).
  41. Oksanen, J.; Simpson, G.L.; Blanchet, F.G.; Kindt, R.; Legendre, P.; Minchin, P.R.; O’Hara, R.B.; Solymos, P.; Stevens, M.H.H.; Szoecs, E.; et al. Vegan: Community Ecology Package. R Package Version 2.6-6.1. 2022. Available online: https://cran.r-project.org/web/packages/vegan/index.html (accessed on 12 January 2020).
  42. Peres-Neto, P.R.; Legendre, P.; Dray, S.; Borcard, D. Variation Partitioning of Species Data Matrices: Estimation and Comparison of Fractions. Ecology 2006, 87, 2614–2625. [Google Scholar] [CrossRef] [PubMed]
  43. Legendre, P.; Oksanen, J.; ter Braak, C.J.F. Testing the Significance of Canonical Axes in Redundancy Analysis. Methods Ecol. Evol. 2011, 2, 269–277. [Google Scholar] [CrossRef]
  44. R Core Team. R: A Language and Environment for Statistical Computing; R Core Team: Vienna, Austria, 2022. [Google Scholar]
  45. Alaruikka, D.; Kotze, D.J.; Matveinen, K.; Niemelä, J. Carabid Beetle and Spider Assemblages along a Forested Urban–Rural Gradient in Southern Finland. J. Insect Conserv. 2002, 6, 195–206. [Google Scholar] [CrossRef]
  46. Magura, T.; Horváth, R.; Tóthmérész, B. Effects of Urbanization on Ground-Dwelling Spiders in Forest Patches, in Hungary. Landsc. Ecol. 2010, 25, 621–629. [Google Scholar] [CrossRef]
  47. Buchholz, S.; Hannig, K.; Moller, M.; Schirmel, J. Reducing Management Intensity and Isolation as Promising Tools to Enhance Ground-Dwelling Arthropod Diversity in Urban Grasslands. Urban Ecosyst. 2018, 21, 1139–1149. [Google Scholar] [CrossRef]
  48. Varet, M.; Burel, F.; Lafage, D.; Pétillon, J. Age-Dependent Colonization of Urban Habitats: A Diachronic Approach Using Carabid Beetles and Spiders. Anim. Biol. 2013, 63, 257–269. [Google Scholar] [CrossRef]
  49. Harvey, J.A.; van der Putten, W.H.; Turin, H.; Wagenaar, R.; Bezemer, T.M. Effects of Changes in Plant Species Richness and Community Traits on Carabid Assemblages and Feeding Guilds. Agric. Ecosyst. Environ. 2008, 127, 100–106. [Google Scholar] [CrossRef]
  50. Tylianakis, J.M.; Didham, R.K.; Bascompte, J.; Wardle, D.A. Global Change and Species Interactions in Terrestrial Ecosystems. Ecol. Lett. 2008, 11, 1351–1363. [Google Scholar] [CrossRef]
  51. Diamond, S.E.; Frame, A.M.; Martin, R.A.; Buckley, L.B. Species’ Traits Predict Phenological Responses to Climate Change in Butterflies. Ecology 2011, 92, 1005–1012. [Google Scholar] [CrossRef] [PubMed]
  52. Sunday, J.M.; Bates, A.E.; Kearney, M.R.; Colwell, R.K.; Dulvy, N.K.; Longino, J.T.; Huey, R.B. Thermal-Safety Margins and the Necessity of Thermoregulatory Behavior across Latitude and Elevation. Proc. Natl. Acad. Sci. USA 2014, 111, 5610–5615. [Google Scholar] [CrossRef] [PubMed]
  53. Youngsteadt, E.; Ernst, A.F.; Dunn, R.R.; Frank, S.D. Responses of Arthropod Populations to Warming Depend on Latitude: Evidence from Urban Heat Islands. Glob. Chang. Biol. 2017, 23, 1436–1447. [Google Scholar] [CrossRef] [PubMed]
  54. Merckx, T.; Souffreau, C.; Kaiser, A.; Baardsen, L.F.; Backeljau, T.; Bonte, D.; Brans, K.I.; Cours, M.; Dahirel, M.; Debortoli, N.; et al. Body-Size Shifts in Aquatic and Terrestrial Urban Communities. Nature 2018, 558, 113–116. [Google Scholar] [CrossRef] [PubMed]
  55. Cabon, V.; Quénol, H.; Deletre, B.; Copin, L.; Dubreuil, V.; Bergerot, B. Body Size Responses to Urban Temperature Variations Are Driven by Life History Traits in Spiders. Funct. Ecol. 2024, 38, 1578–1589. [Google Scholar] [CrossRef]
  56. Larochelle, A. The Food of Carabid Beetles: (Coleoptera: Carabidae, Including Cicindelinae); Association des Entomologistes Amateurs du Québec: Varennes, QC, Canada, 1990. [Google Scholar]
  57. Schirmel, J.; Blindow, I.; Buchholz, S. Life-history trait and functional diversity patterns of ground beetles and spiders along a coastal heathland successional gradient. Basic Appl. Ecol. 2012, 13, 606–614. [Google Scholar] [CrossRef]
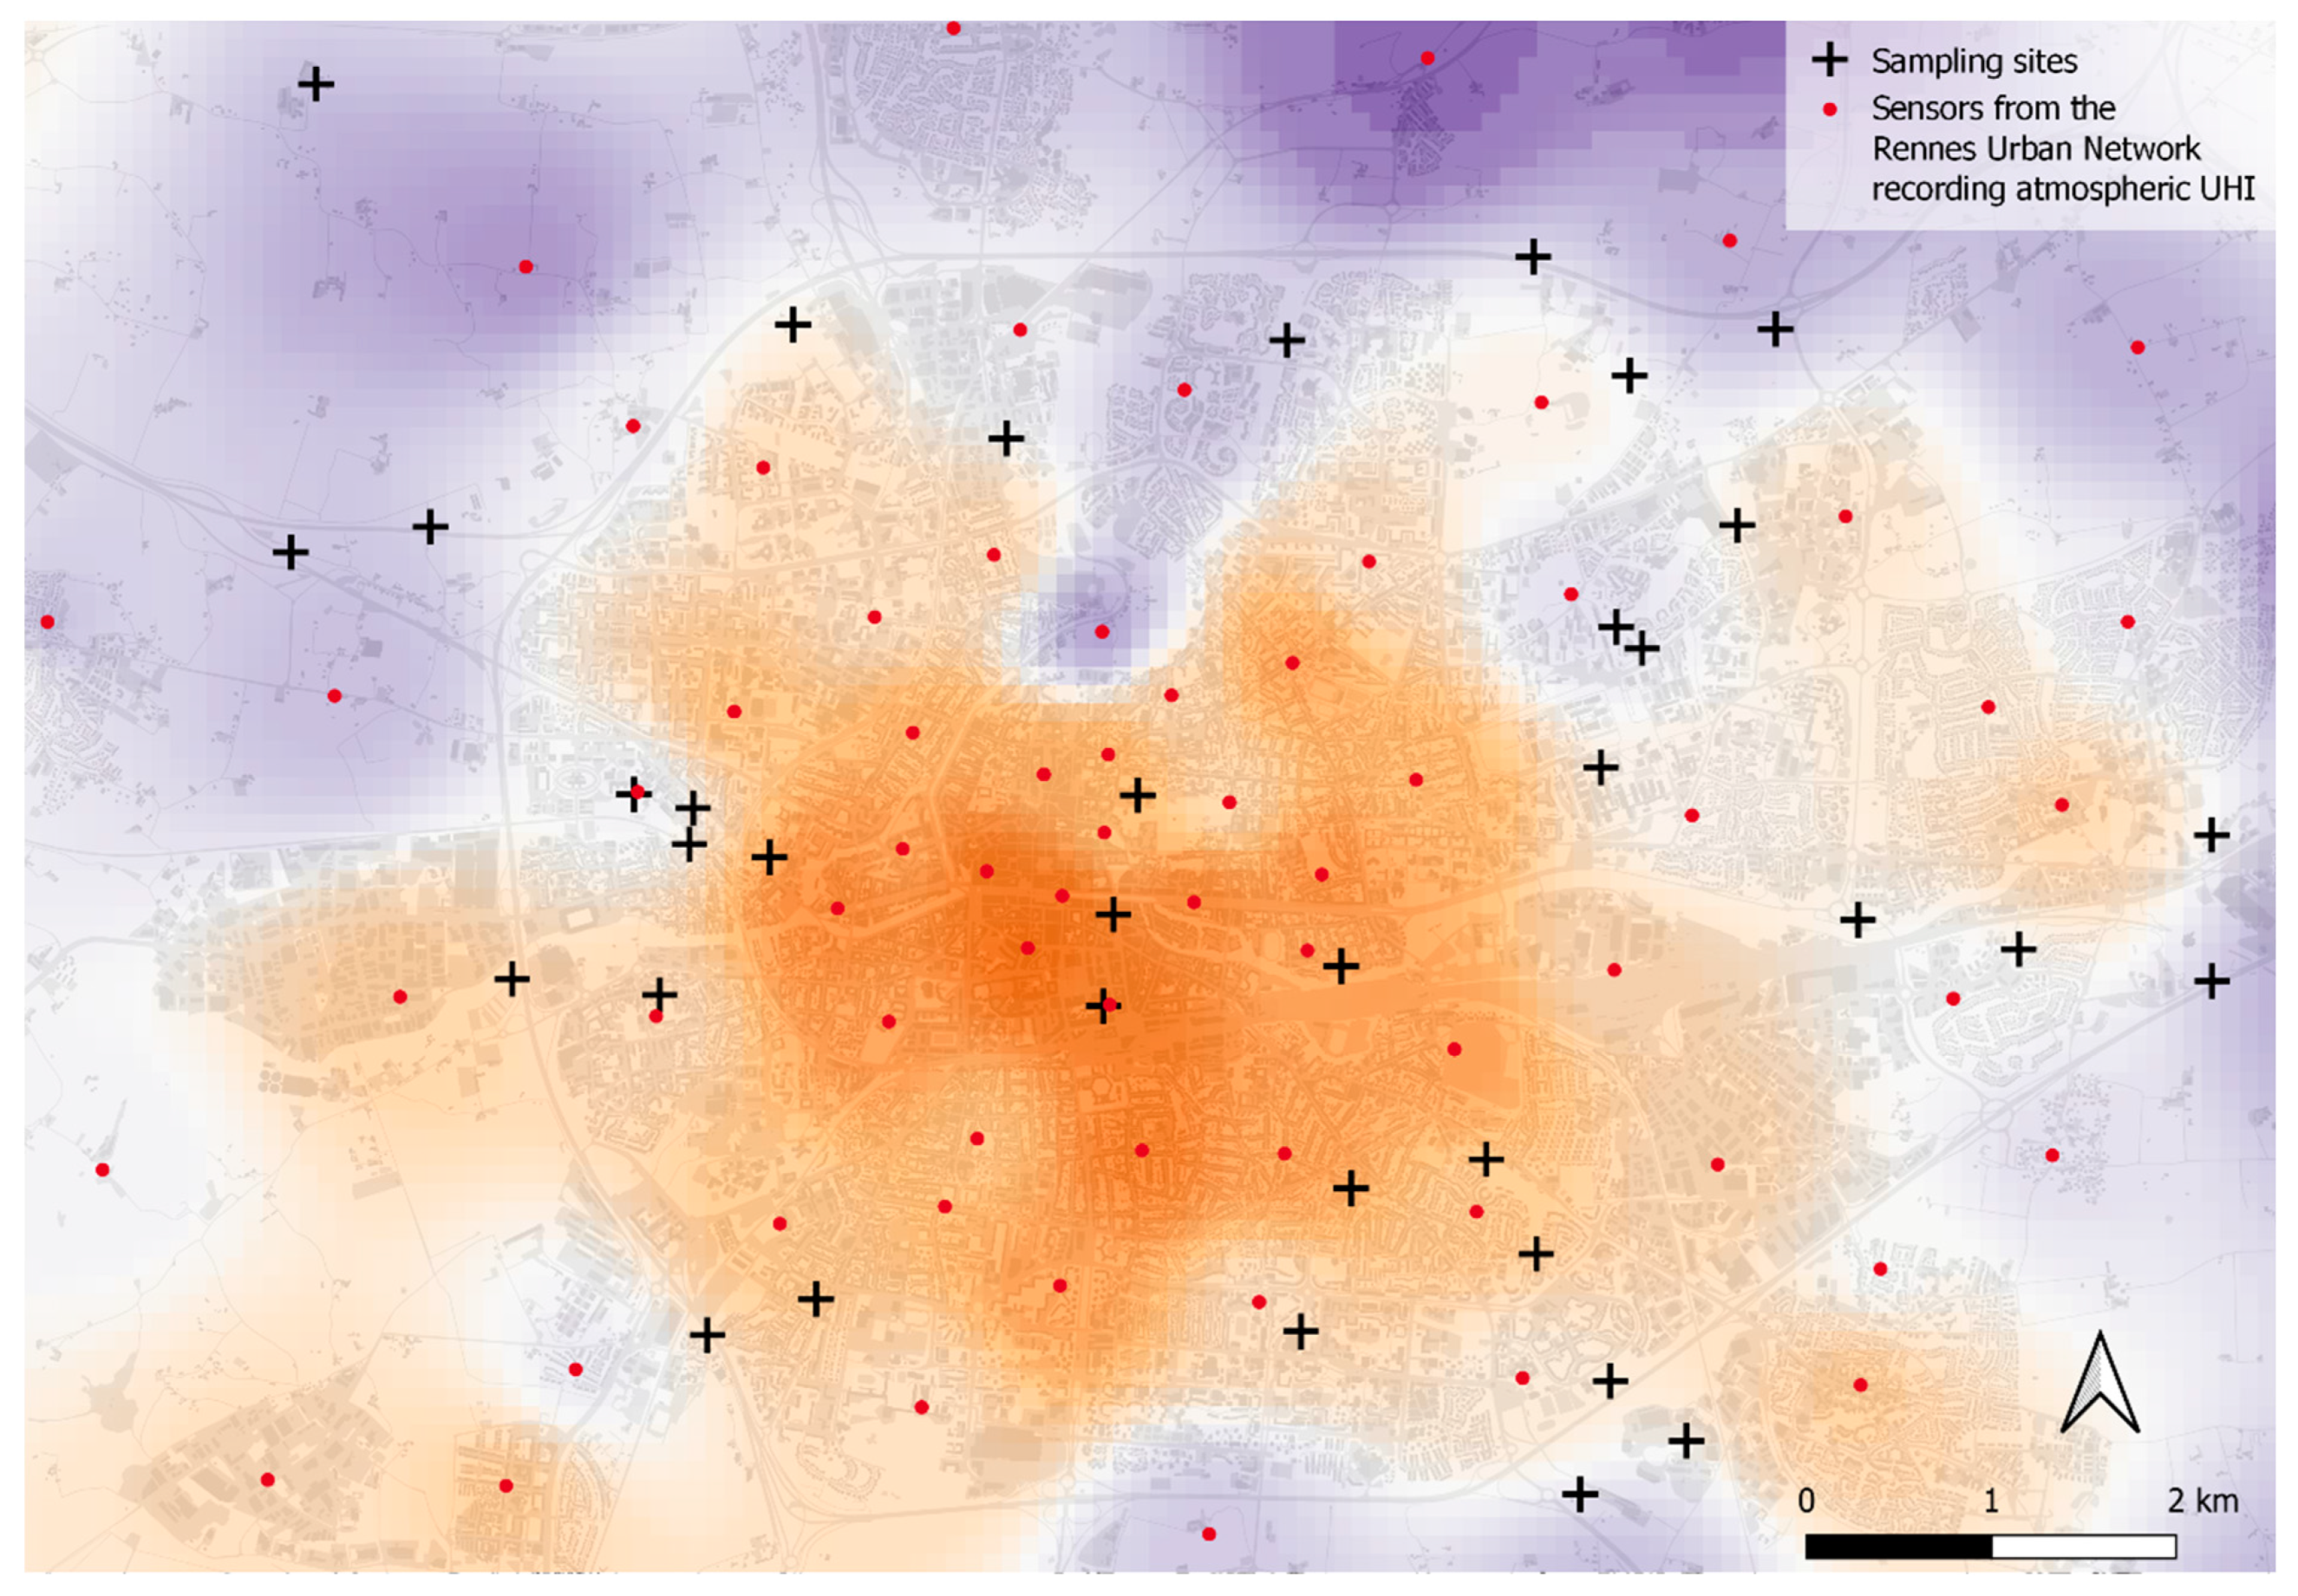
Figure 1. Study area and location of sampling sites. The mean atmospheric UHI (from 1 March to 30 September 2022) is illustrated by a colored gradient ranging from purple (low intensity; minimum = 0 °C) to orange (high intensity; maximum = 3 °C). Grey areas in the background display impervious surfaces.
Diversity 16 00504 g001
Figure 2. Results of NMDS ordination (Bray–Curtis distance) based on staphylinid (left) and carabid (right) datasets. The ‘High vegetated rural’ cluster contained sites with high herbaceous vegetation, low near-ground temperature, low proportion of impervious surface, and weak UHI intensity. The ‘Short vegetated rural’ cluster contained sites with high herbaceous vegetation, intermediate near-ground temperature, low proportion of impervious surface, and weak UHI intensity. The ‘Short vegetated rural’ cluster contained sites with short herbaceous vegetation, low near-ground temperature, a high proportion of impervious surface, and strong UHI intensity. Only significant environmental variables are displayed (p < 0.05).
Diversity 16 00504 g002
Figure 3. Venn diagrams displaying the results of variation partitioning analysis related to (a) the activity density, (b) the taxonomic diversity, and (c) the functional diversity of staphylinids (left column) and carabids (right column). The predictor datasets are represented by colored ellipses where the proportion of impervious surface is dark green (upper left), the local habitat is light green (upper right), the atmospheric UHI is dark blue (lower left), and near-ground temperature is light blue (lower right). Results are given separately with impervious surface and UHI predictors calculated within 100 m radius buffers, as well as concentric rings of 100–200 m breadth, 200–500 m breadth, and 500–1000 m breadth. Variation proportions lower than 1% are not displayed. Significant results are underlined.
Diversity 16 00504 g003
Figure 4. Significant relationship between the functional diversity of order q = 1 (a) and order q = 2 (b) of staphylinids and the vegetation height. Confidence intervals at 95% are shown.
Diversity 16 00504 g004
Disclaimer/Publisher’s Note: The statements, opinions and data contained in all publications are solely those of the individual author(s) and contributor(s) and not of MDPI and/or the editor(s). MDPI and/or the editor(s) disclaim responsibility for any injury to people or property resulting from any ideas, methods, instructions or products referred to in the content.