Article

Impact of Different Sources of Anthropogenic Pollution on the Structure and Distribution of Antarctic Marine Meiofauna Communities

by
Débora A.A. França
1,*,
Jeroen Ingels
2,
Jonathan S. Stark
3,
Renan B. da Silva
1,
Flávia J.L. de França
1 and
Giovanni A.P. dos Santos
1,*
1
Marine and Estuarine Meiofauna Invertebrate Cultivation Lab, Universidade Federal de Pernambuco, Recife 7851, Pernambuco, Brazil
2
Coastal and Marine Lab, Florida State University, St Teresa, FL 32306, USA
3
East Antarctic Monitoring Program, Australian Antarctic Division, Kingston 7050, Tasmania, Australia
*
Authors to whom correspondence should be addressed.
Diversity 2024, 16(8), 464; https://doi.org/10.3390/d16080464
Submission received: 27 June 2024 / Revised: 20 July 2024 / Accepted: 23 July 2024 / Published: 2 August 2024

Abstract

:
Human influence on Antarctic marine ecosystems is a growing concern, despite limited information being available. This study investigated the coastal meiofauna and environmental parameters of 10 locations, 4 of which served as reference points (OB1, OB2, OB3, and McGrady) and 6 which were impacted by different levels of human activity in the past and present (Wharf, Wilkes, BBIN, BBMID, BBOUT, and Shannon) in East Antarctica. Environmental variables such as metals, total petroleum hydrocarbons (TPHs), polybrominated diphenyl ethers (PBDEs), polychlorinated biphenyls (PCBs), grain size, organic matter content, and nutrients were measured for analysis. Locations close to human activities showed higher concentrations of pollutants (metals, TPHs, PBDEs, PCBs) and greater variations in meiofauna diversity compared to the reference sites (OB1, OB2, OB3, and McGrady). In the area impacted by the Casey Station waste dump (Brown Bay), the meiofauna community at the location furthest from the pollution (BBOUT) source exhibited greater diversity compared to the closest location (BBIN). In addition to metals and TPHs, particle size was also correlated with community patterns, with finer sediments associated with more impacted sites, facilitating the accumulation of toxic compounds. These results contribute to the understanding of the role and impact of pollutants on meiofauna biodiversity in Antarctic coastal ecosystems.

1. Introduction

The influence of anthropogenic actions on the marine environment on a global scale is increasingly evident [1]. Among the most common anthropogenic impacts, sewage dumping, industrial discharges, and inadequate waste disposal are some of the main sources of pollution in coastal areas, causing an increase in the deposition of organic matter in the water, as well as other potentially toxic substances, i.e., hydrocarbons, heavy metals, and persistent organic pollutants (POPs) [1,2]. These pollutants contain compounds capable of causing physiological and metabolic changes in organisms, potentially affecting their development and survival [3]. To understand the consequences of human actions on the marine environment and find ways to mitigate their impacts, the scientific community continues to explore new areas of research and consider model organisms that have the capacity to act as sentinels of their environments. Such groups are many and include the meiofauna, which contain many different groups of organisms that can inform us on the spatial and temporal patterns and dynamics of environmental change and ecological processes [4,5].
Meiofauna comprise a group with more than 25 phyla of interstitial microscopic metazoans that are of great ecological importance [5,6]. Meiofauna mediate diverse ecosystem processes, such as food web dynamics, the reformulation of sediments through bioturbation, the burial and storage of organic matter, the recycling of nutrients, and the degradation and distribution of pollutants [5,7]. They modify the physical, chemical, and biological properties of sediments, enabling us to better understand the environment’s abiotic characteristics and provide indications of their changes. Meiofauna have low motility, high diversity, relatively short generation times, direct benthic development, and ubiquitous distributions, offering several advantages for monitoring marine benthic ecosystems [5,8,9,10]. Throughout the literature, meiofauna are considered to be good indicators of different types of impacts and environmental change.
The Antarctic ecosystem as a whole is considered vital on a global scale, serving as a thermal regulator as it controls atmospheric and oceanic circulations, influencing the climate and, consequently, living conditions on Earth [11,12]. Due to its extreme conditions and isolation, its changes are often amplified and found to respond faster than any other area on Earth. Thus, a small pollution event in Antarctica may be more impactful in the region than occurrences of a similar magnitude in other parts of the world [11,13]. Given its importance and “fragility”, research carried out in this environment has received increasing international attention owing to concerns about the increase in human activities, pollution, and their impacts. One of the main sources of anthropogenic impact is the existing research stations in many Antarctic coastal areas, which have been continuously occupied for more than 50 years and have led to the contamination of the marine environment and its benthic ecosystems [14,15].
Casey Station, managed by the AustralianGovernment, on the Windmill Islands in East Antarctica, is in a permanently ice-free area that represents an important area of the shallow coastal ecosystem. This area has a variety of benthic habitats, from exposed shorelines, partially ice-covered and dominated by macroalgae, to areas dominated by invertebrate communities, including sponges, tubeworms, echinoderms, and meiofauna [16,17]. As it is an active research station, monitoring is necessary to understand the ecological consequences of human activity and their impact. Casey is typical of many research stations established prior to the 1980s, and past activities that have caused impacts include the disposal of waste in landfill sites adjacent to the coast and fuel and oil spills. There are also ongoing activities common to all coastal stations, such as sewage and wastewater disposal and transportation, wharf activities, and construction.
In view of this, it is crucial to understand how these sensitive environments respond to pollution. While previous studies have investigated various aspects of these ecosystems, research focusing on meiofauna, a key component of benthic food webs, remains limited [18]. This study investigates the relationship between meiofauna community structure and environmental variables, including contaminant levels, in marine sediments from ten locations around Casey Station, encompassing a gradient of pollution impacts. We tested the hypotheses that both natural environmental factors and anthropogenic contaminant concentrations significantly influence the spatial variation observed in meiofauna community structure (composition, richness, and diversity) and ecological quality status (EcoQ) [19]. This research builds upon previous work in the region and aims to provide a more comprehensive understanding of the ecological responses of Antarctic benthic ecosystems to varying levels and types of pollution [20].

2. Materials and Methods

2.1. Sampling

Sampling was conducted using a nested hierarchical design encompassing three spatial scales: (1) locations, separated by kilometers; (2) within each location, two sites were typically established, approximately 100 m apart; and (3) within each site, there were at least two plots spaced roughly 10 m apart. Replicate samples were collected from each sampling plot for meiofauna and environmental analysis.
Sediment samples were obtained by divers utilizing modified 60 mL syringes, with the inlet end cut to create a small tube (internal diameter of 28 mm). These syringes were inserted into the sediment to a depth of 10 cm, then extracted and capped at the lower end to retain the samples.
The sampling activities were conducted under permits issued by the Australian Antarctic Division (projects AAS 4127, 4180, 4633) under the auspices of the Antarctic Treaty Environmental Protection (ATEP) and Antarctic Marine Living Resources (AMLR) programs. Sampling took place between January and February 2015 at ten locations around Casey Station. Among these locations, four were selected as controls (directly undisturbed locations): O’Brien Bay (Sites 1, 2, and 3) and McGrady Cove. The remaining six locations were selected as impacted (directly disturbed locations): Wharf Bay, Wilkes Bay, Brown Bay (inner, middle, and outer), and Shannon Bay (Figure 1).

2.2. Study Area

Casey Station is situated at 66°17′ S, 110°32′ E on the Bailey Peninsula in the Windmill Islands, East Antarctica (Figure 1). The shallow benthic marine environment (<50 m) near the coast at Casey is heterogeneous in terms of sediments, which encompass various sizes of grains, gravels, stones, boulders, and bedrock [15]. All locations exhibit relatively similar sea ice regimes, although considerable local variation exists in the timing of ice breakup and the duration of open water periods. The bathymetry within the two large bays under study (Newcomb and O’Brien, see Figure 1) is comparable, featuring deep basins reaching depths of 90 m and small bays along the edges typically reaching maximum depths of 25 to 30 m, where the samples were collected. Despite limited knowledge about the oceanographic patterns at the site, all bays in this study experience similar tidal and oceanographic regimes.
O’Brien Bay (OB) is a sizable bay located several kilometers south of Casey Station and appears visually unaffected by human activities or contamination; nevertheless, it has been the subject of several scientific investigations (Figure 1) [15,18]. Within this bay, we identify the locations O’Brien Bay 1 (OB1), O’Brien Bay 2 (OB2), and O’Brien Bay 3 (OB3), which serve as reference locations. OB1 slopes gently from the south coast (5 m depth) to the outer edge of the bay (20–25 m), featuring a relatively flat seabed composed of sediment interspersed with patches of rock, cobblestones, and large boulders. In contrast, OB2 and OB3 exhibit steeper profiles with a series of submarine terraces hosting a variable mosaic of habitats ranging from rock and gravel to cobblestones and boulders interspersed with sediment patches [15].
McGrady Cove (MCG) represents another location unaffected by direct human activities or contamination, located in the southeast of greater Newcomb Bay. It is a small bay encircled by steep rocky slopes and ice cliffs, and due to the absence of operational activities, McGrady also serves as a reference location. In addition to McGrady Bay, other locales within Newcomb Bay include Brown Bay, Wilkes Bay, Wharf Bay, and Shannon Bay.
Brown Bay (BB) constitutes a small inlet contaminated with metals and hydrocarbons originating from the former Casey dump (Thala Valley), active in 1965–1986, situated onshore in the southwest corner of Newcomb Bay [21,22]. BB features a shallow, gently sloping bathymetry and was sampled at three points delineated by distance from the coast: Brown Bay Interior (BBIN), the closest point to the former Casey dump, located approximately 30 m from the shore at depths of 5–8 m; Middle Brown Bay (BBMID), positioned around 150 m from shore at depths of 12–15 m; and Outer Brown Bay (BBOUT), the furthest location from the impact source, situated approximately 300 m from shore at depths of 15–20 m. BB generally remains free of sea ice for 1 to 2 months each year, typically between January and March. During summer, a meltwater stream flows through the Thala Valley. Prior to the remediation of the site in 2004, this stream carried debris, particles, and dissolved contaminants into the bay. Consequently, a variety of debris items can be found on the seabed within the bay.
Similar to BB, Wilkes (WI) is located in close proximity to an area associated with waste disposal, originating from the first research station constructed in the Windmill Islands area by the United States in 1957, and subsequently abandoned by Australia in 1969 [20,21]. The WI Station, positioned on the north side of Newcomb Bay on the Clark Peninsula, featured a land-based waste dump situated approximately 100 m from the shore. During summer, meltwater flows through the waste disposal site into the nearshore marine environment, although no defined melt flow or permanent channels exist [15]. Sampling at WI was conducted approximately 30 m from the coastline at depths of 12–15 m.
Wharf Bay (WH) is the location of the station wharf for cargo loading, small boat launching, and fuel refueling, featuring a fuel storage facility from which several accidental spills, have occurred [18].
Shannon Bay (SH) represents a small bay surrounded by ice cliffs in close proximity to the active sewage outfall of Casey Station. At the waterline, a steep slope with large boulders extends to a depth of about 15 m, below which a relatively homogeneous muddy sand substrate extends to a depth of 25 m [16]. While sewage effluent generally undergoes secondary treatment, during peak flow periods, it may bypass the treatment plant [18]. This effluent is discharged through a pipe located 30 m from the edge of the cliff, where a large melt hole exists, extending down to the bedrock and providing a conduit for the effluent to enter the bay.

2.3. Preparation and Identification of Meiofauna

A total of 83 samples were collected and were transported to the Casey Station laboratories, where they were preserved with 4% formaldehyde. Subsequently, the preserved samples underwent washing and were passed through a sieve with a 500 μm mesh opening to remove the coarser sediment fraction and macrofauna. This was followed by another sieving process with a 32 μm mesh opening to retain the muddy fraction of the sample. Meiofauna were extracted from the muddy sediment using a modified centrifugation and decantation technique, as described by Heip et al. (1985) [23] and Pfannkuche and Thiel (1988) [24] employing a solution of Ludox in distilled water with a specific gravity of 1.18 [25]. After extraction, the samples were treated with 4% formalin and 1% Rose Bengal to preserve and stain the meiofauna, respectively. For identification purposes, all meiofauna individuals retained in the 32 μm mesh sieve were counted and classified into major taxonomic groups, ranging from order to phylum, using a stereomicroscope, following the methodology outlined by Higgins and Thiel (1988) [26].

2.4. Environmental Variables and Contaminants

To analyze the abiotic characteristics of the sediment, samples were collected using a 5 cm-diameter core sampler, reaching a depth of up to 10 cm in the sediment. Samplers were frozen at −20 °C until analysis. Frozen sediment samples from each sampler were subsampled from the top 5 cm and homogenized for separate analyses of grain size, organic matter content, nutrients, and concentrations of pollutants associated with site impacts (i.e., metals, total petroleum hydrocarbons, and persistent organic pollutants), following the analytical methods detailed in Stark et al. (2023) [15].
For particle size analysis, 52 sediment samples were dried at 40 °C and then mechanically sieved to measure the general size distribution: gravel (>2 mm), sand (2 mm–63 μm), and mud (<63 μm). Accurate particle size determination by laser diffraction was conducted on a subsample of material <2 mm using a Mastersizer 3000 analyzer equipped with an automated Hydro LV wet dispersion unit. Volume disbtribution data were used to calculate standard Wentworth size classes, ranging from clay (<2 μm) to very coarse sand (1.00–2.00 mm).
The total organic matter (TOM, % dry weight) in 74 sediment samples was determined gravimetrically by loss on ignition (LOI) following the method described by Heiri et al. (2001) [27]. The homogenized wet sediment (1–10 g) was dried at 105 °C overnight in a porcelain crucible to determine the dry matter fraction (DMF), then ignited at 550 °C for four hours in an oven to oxidize the organic material and weighed again to measure the mass loss.
Water-extractable nutrients were measured in 74 sediment samples. A 5 g wet subsample from the central 0–1 cm section was extracted with deionized water (1:5 w/v) for 1 h, centrifuged, and the supernatant filtered through a 0.45 μm membrane. The flow injection analysis (FIA) of extracts was carried out at Analytical Service Tasmania (AST) using procedures based on the standard APHA colorimetric methods specified in Stark et al. (2023) [15].
For metal analysis, elements were extracted from of 52 sediments samples using dilute hydrochloric acid (1 M) for four hours, a partial (selective) extraction method commonly employed to identify contaminated sediments [28]. This method broadly targets metals in labile phases of sediments (e.g., carbonates, Fe and Mn oxides, sulfides, organics), where anthropogenic metals are most likely to reside. All extractions employed a 1 M acid digestion of 1:10 w/v (wet sediment) or 1:20 w/v (dry sediment) of a 2 to 5 g subsample of sediment homogenized at room temperature. After centrifugation and/or filtration at 0.45 μm, the extract was analyzed by ICP-MS or ICP-AES. In all datasets, quality control was facilitated by extracting and analyzing two certified reference materials (CRMs) from marine sediments: pair for duplicates MESS-2/3 (3 ± 4%) and PACS-2 (0.8 ± 0.8%) (National Research Council Canada, NRCC, Ottawa, ON, Canada); detailed in Stark et al. (2023) [15]. From these analyses, 28 metals were identified, which are as follows: Al, As, Ba, Be, Ca, Cd, Co, Cr, Cu, Fe, K, Li, Mg, Mn, Mo, Na, Ni, P, Pb, S, Sb, Se, Sn, Sr, Ti, Tl, V, and Zn.
Analyses of total petroleum hydrocarbons (TPH) and the persistent organic pollutants polybrominated diphenyl ethers (PBDEs) and polychlorinated biphenyls (PCBs) in sediment samples were conducted by the Analytical Services Unit (ASU), Queen’s University, Kingston, Ontario, Canada. Hydrocarbons were extracted from 5 to 10 g of each of 51 wet sediment samples with solvent and then, after concentration and cleaning, determined by gas chromatography with flame ionization detection (GC-FID). PBDEs and PCBs were extracted from 1 to 5 g of each of 45 of air-dried sediment samples with dichloromethane and concentrated by evaporation. The extracts were cleaned by gel permeation chromatography followed by activated magnesium silicate. Analysis of the most common PBDE congeners was performed by gas chromatography with tandem mass spectroscopy (GC/MS/MS), while total PCBs were determined by gas chromatography with electron capture detection (GC-ECD).

2.5. Data Analysis

Meiofauna density data were transformed using the fourth root, and a similarity matrix was calculated using the Bray–Curtis index. To visualize similarity patterns, they were ordered using a non-metric multidimensional scaling (nMDS) technique. Meiofauna diversity was calculated and defined using the following indices: richness (S), Hill diversity (S, H1, H2 and H), Pielou (J) and Shannon–Wiener (H′) [29]. H’ was calculated using the formula below:
H = −∑ ((Pi) × Log (Pi))
where ∑ = summation and Pi = the proportion of individual biomarkers found in functional group i.
To test hypotheses, a permutational ANOVA (PERMANOVA) was applied, and to assess homogeneity between the data and the studied locations (OB1, 2, and 3, Mcgrady, Wharf, Wilkes, BBIN, MID, and OUT, and Shannon), a PERMDISP analysis was performed.
The biotic and abiotic samples were obtained independently, leading to non-corresponding labels for statistical comparisons. Therefore, unpaired analyses were conducted because biotic and abiotic samples did not originate from the same cores. In cases where abiotic data was unavailable for certain sampling levels, corresponding meiofauna replicates were excluded, and vice versa, to ensure the integrity of the statistical analyses. This approach allowed for accurate comparisons by considering only the complete sets of data available for each specific sampling level. Additionally, distance-based multivariate linear modeling (DistLM) regression was applied. dbRDA was performed to obtain the ordering and visualization of the fitted models (such as DistLM), and the vectors plotted in the graphs were generated using Spearman’s rank correlation.
All abiotic data were normalized before being used in correlation analyses and differences in environmental conditions were explored using Principal Component analysis (PCA). Multivariate analyses were conducted using PRIMER v7 with the PERMANOVA+ package.
The environmental quality status (EcoQ) was determined for each location, considering the total number (richness) of meiofaunal taxa proposed by Donovaro et al. (2004) [30], which defines environmental quality in the following classes: ≤4 taxa, bad; >4 and ≤8 taxa, poor; >8 and ≤12 taxa, moderate; >12 and ≤16 taxa, good; >16 taxa, high.

3. Results

3.1. Meiofauna Community

3.1.1. Density and Diversity Parameters

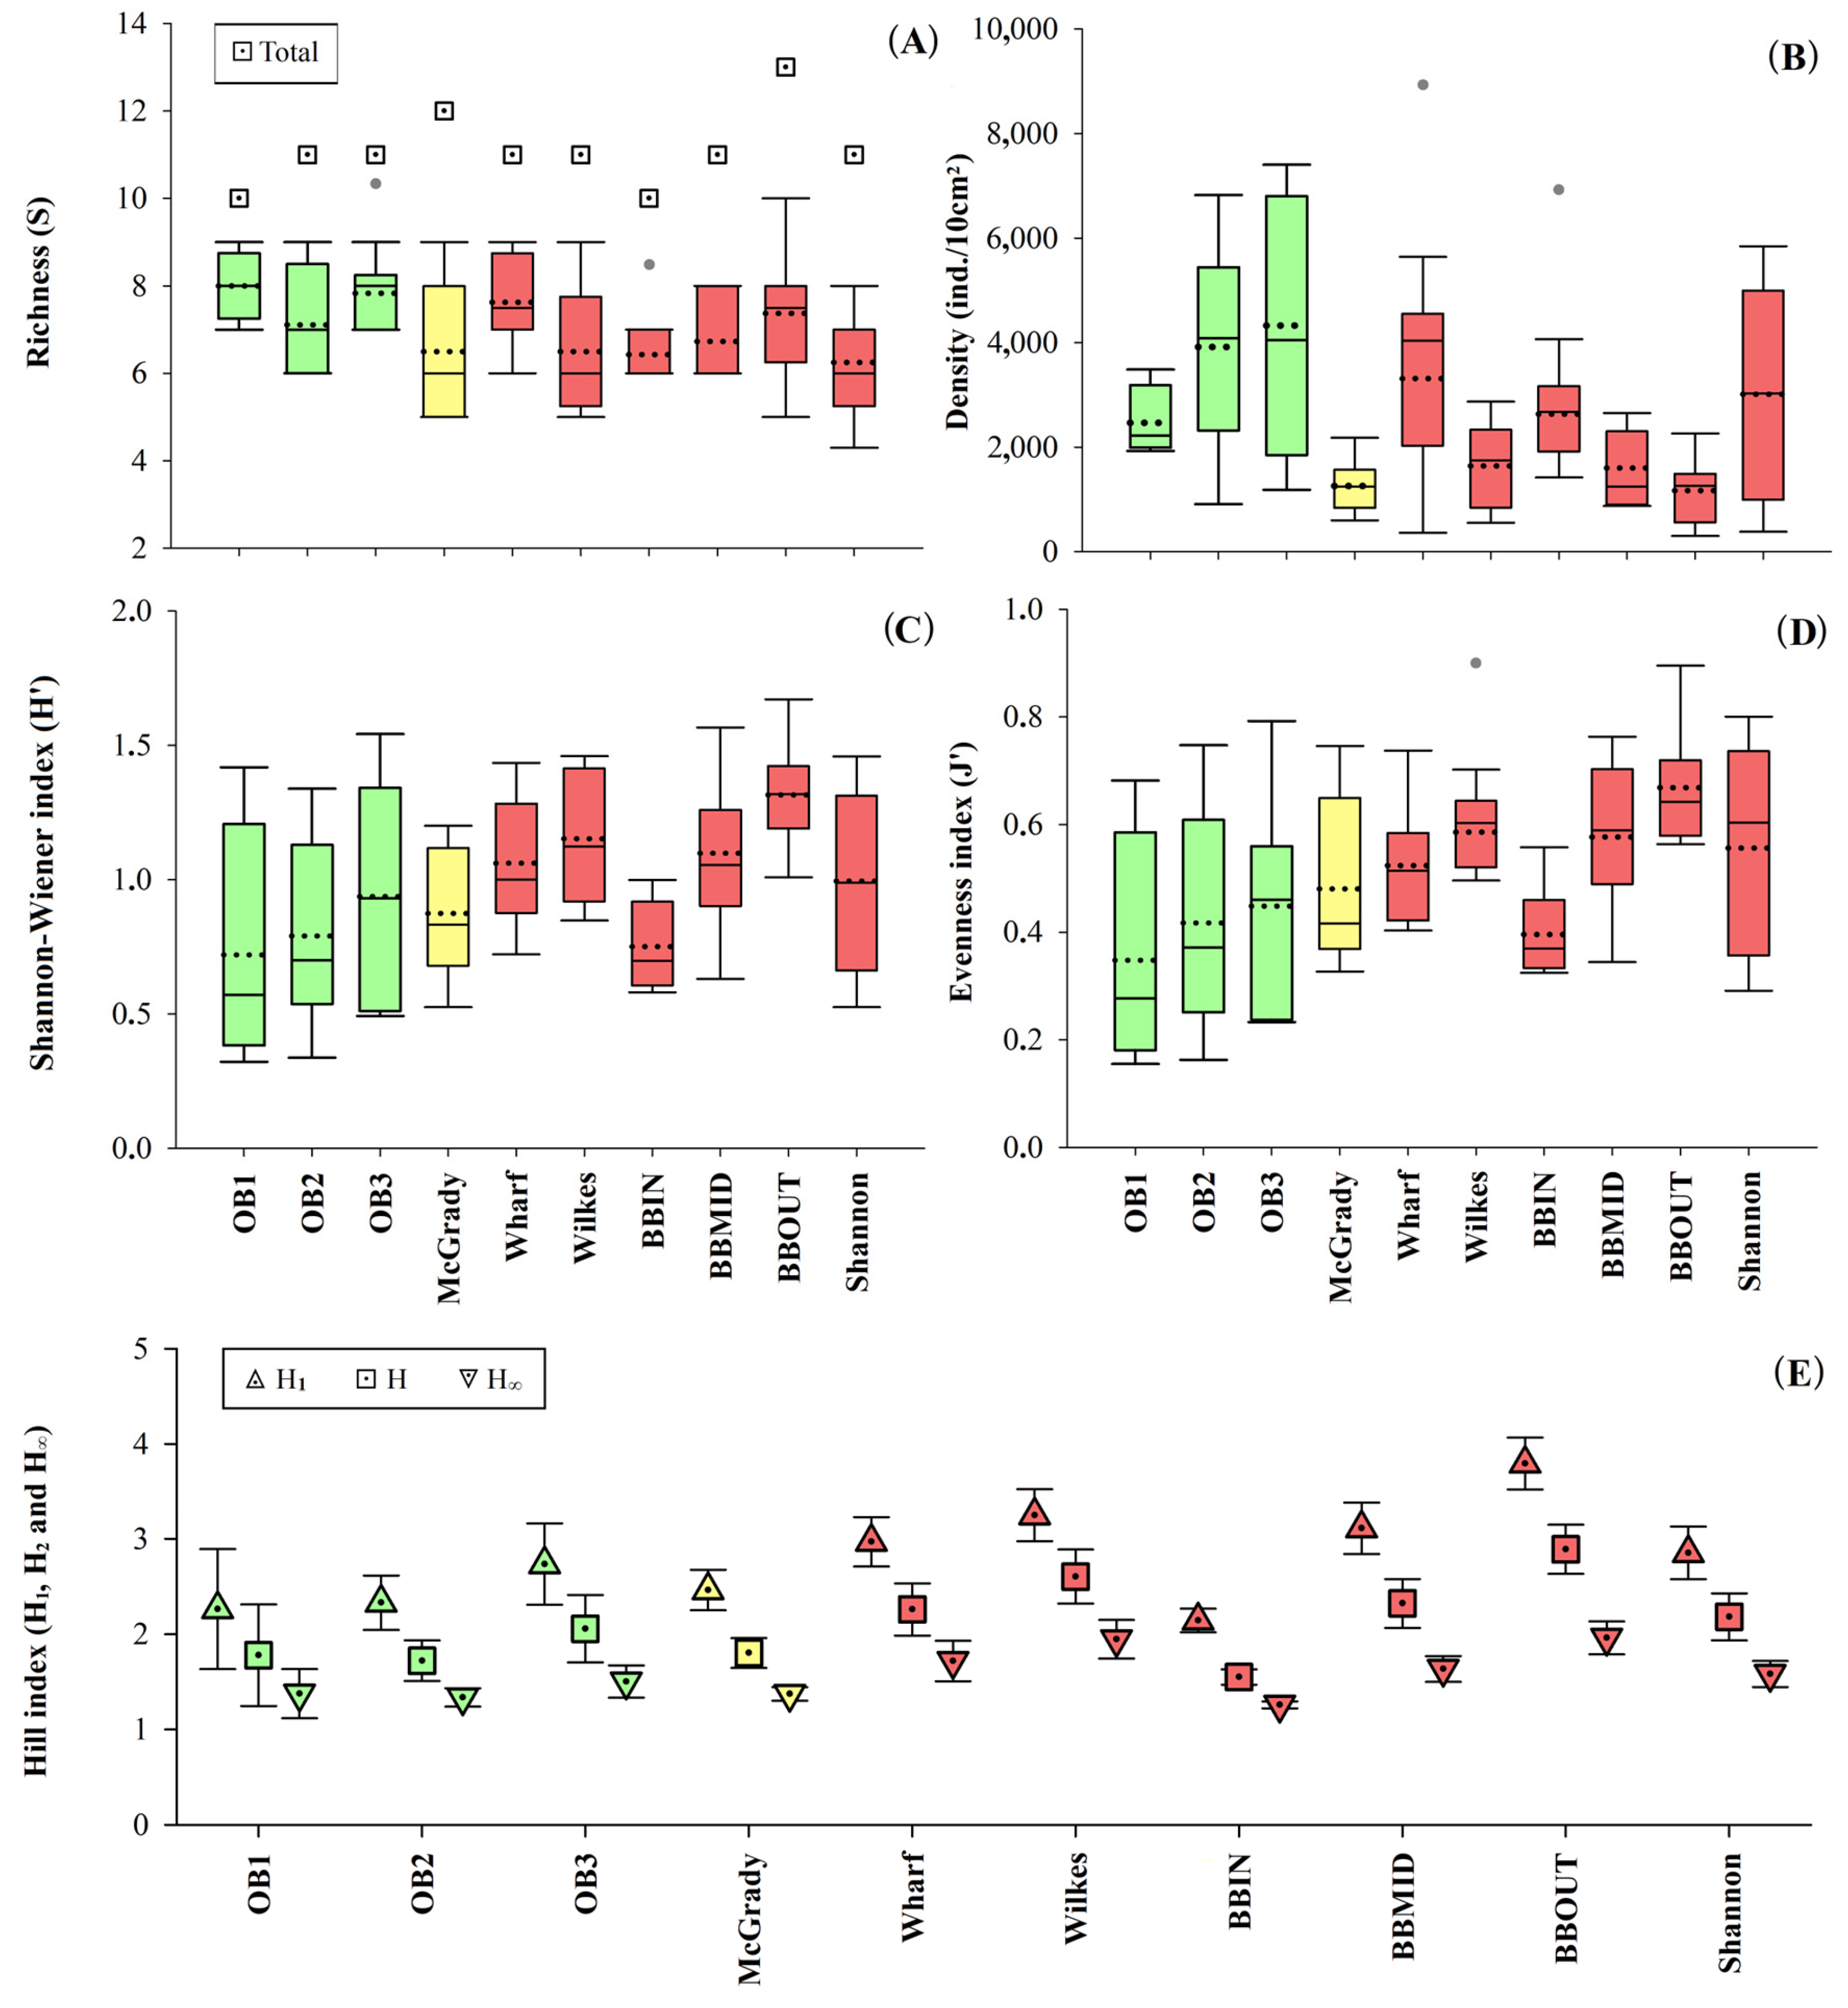
A total of 134,956 meiofauna individuals were identified, distributed across 15 major meiofauna taxa and 2 other groups: meiobenthic protozoa (Ciliophora) and crustacean larvae (Nauplii) (Table S1). Six of these taxa were present in all locations (Ciliophora, Copepoda, Nauplii, Nematoda, Ostracoda, and Turbellaria), while only two were exclusive to a single location—Kinorhyncha in OB2 and Syncarida in OB3, both lying within OB. Meiofauna richness showed greater variation within the impacted locations compared to the reference locations (Figure 2A). BBIN and OB1 had the overall lowest total richness with only 10 taxa. McGrady, Wilkes, and Shannon exhibited the lowest median and average meiofauna higher-taxa richness.
The meiofauna density (ind./10 cm2) also varied significantly between locations (pseudo-F = 5.16; p < 0.01) and bays (pseudo-F = 4.41; p = 0.04) (Table S2). The average meiofauna density showed greater variation at the impacted locations, where the lowest average density was found; 1168.80 ind./10 cm2 in BBOUT. The highest meiofauna density (4328.60 ind./10 cm2) was found in OB3, a non-impacted location (Figure 2B). Still, in Figure 2B, it is possible to observe that across the BB gradient (IN, MID, OUT), meiofauna densities noticeably declined and richness increased proportionately.
The Shannon–Wiener diversity (H’) differed significantly between localities and bays (Table S2), with values below 1.5 in all localities (Figure 2C). The Pielou evenness (J’) differed only between the two large bays (Table S2), showing only small variations between locations (Figure 2D). However, for both indices, it was possible to observe an increasing oceanward gradient in BB, with the lowest values in BBIN and the highest values in BBOUT (Figure 2). Note that the opposite trend was observed for densities. The patterns of the Hill indices (S, H1, H2, and H∞) corresponded to the observations of the Pielou evenness index and the Shannon–Wiener diversity (H’), indicating the same gradient in Brown Bay (Figure 2E). The indices demonstrate that the meiofauna communities have a different make-up at the different locations. The average ecological quality (EcoQ) status of the locations, based on meiofauna richness, ranged from moderate (S = 8–12), at the reference locations located in O’Brien Bay, OB1, and OB3, to poor (S = 5–8) in OB3, MCG, and all other impacted locations within Newcomb Bay (Table 1).
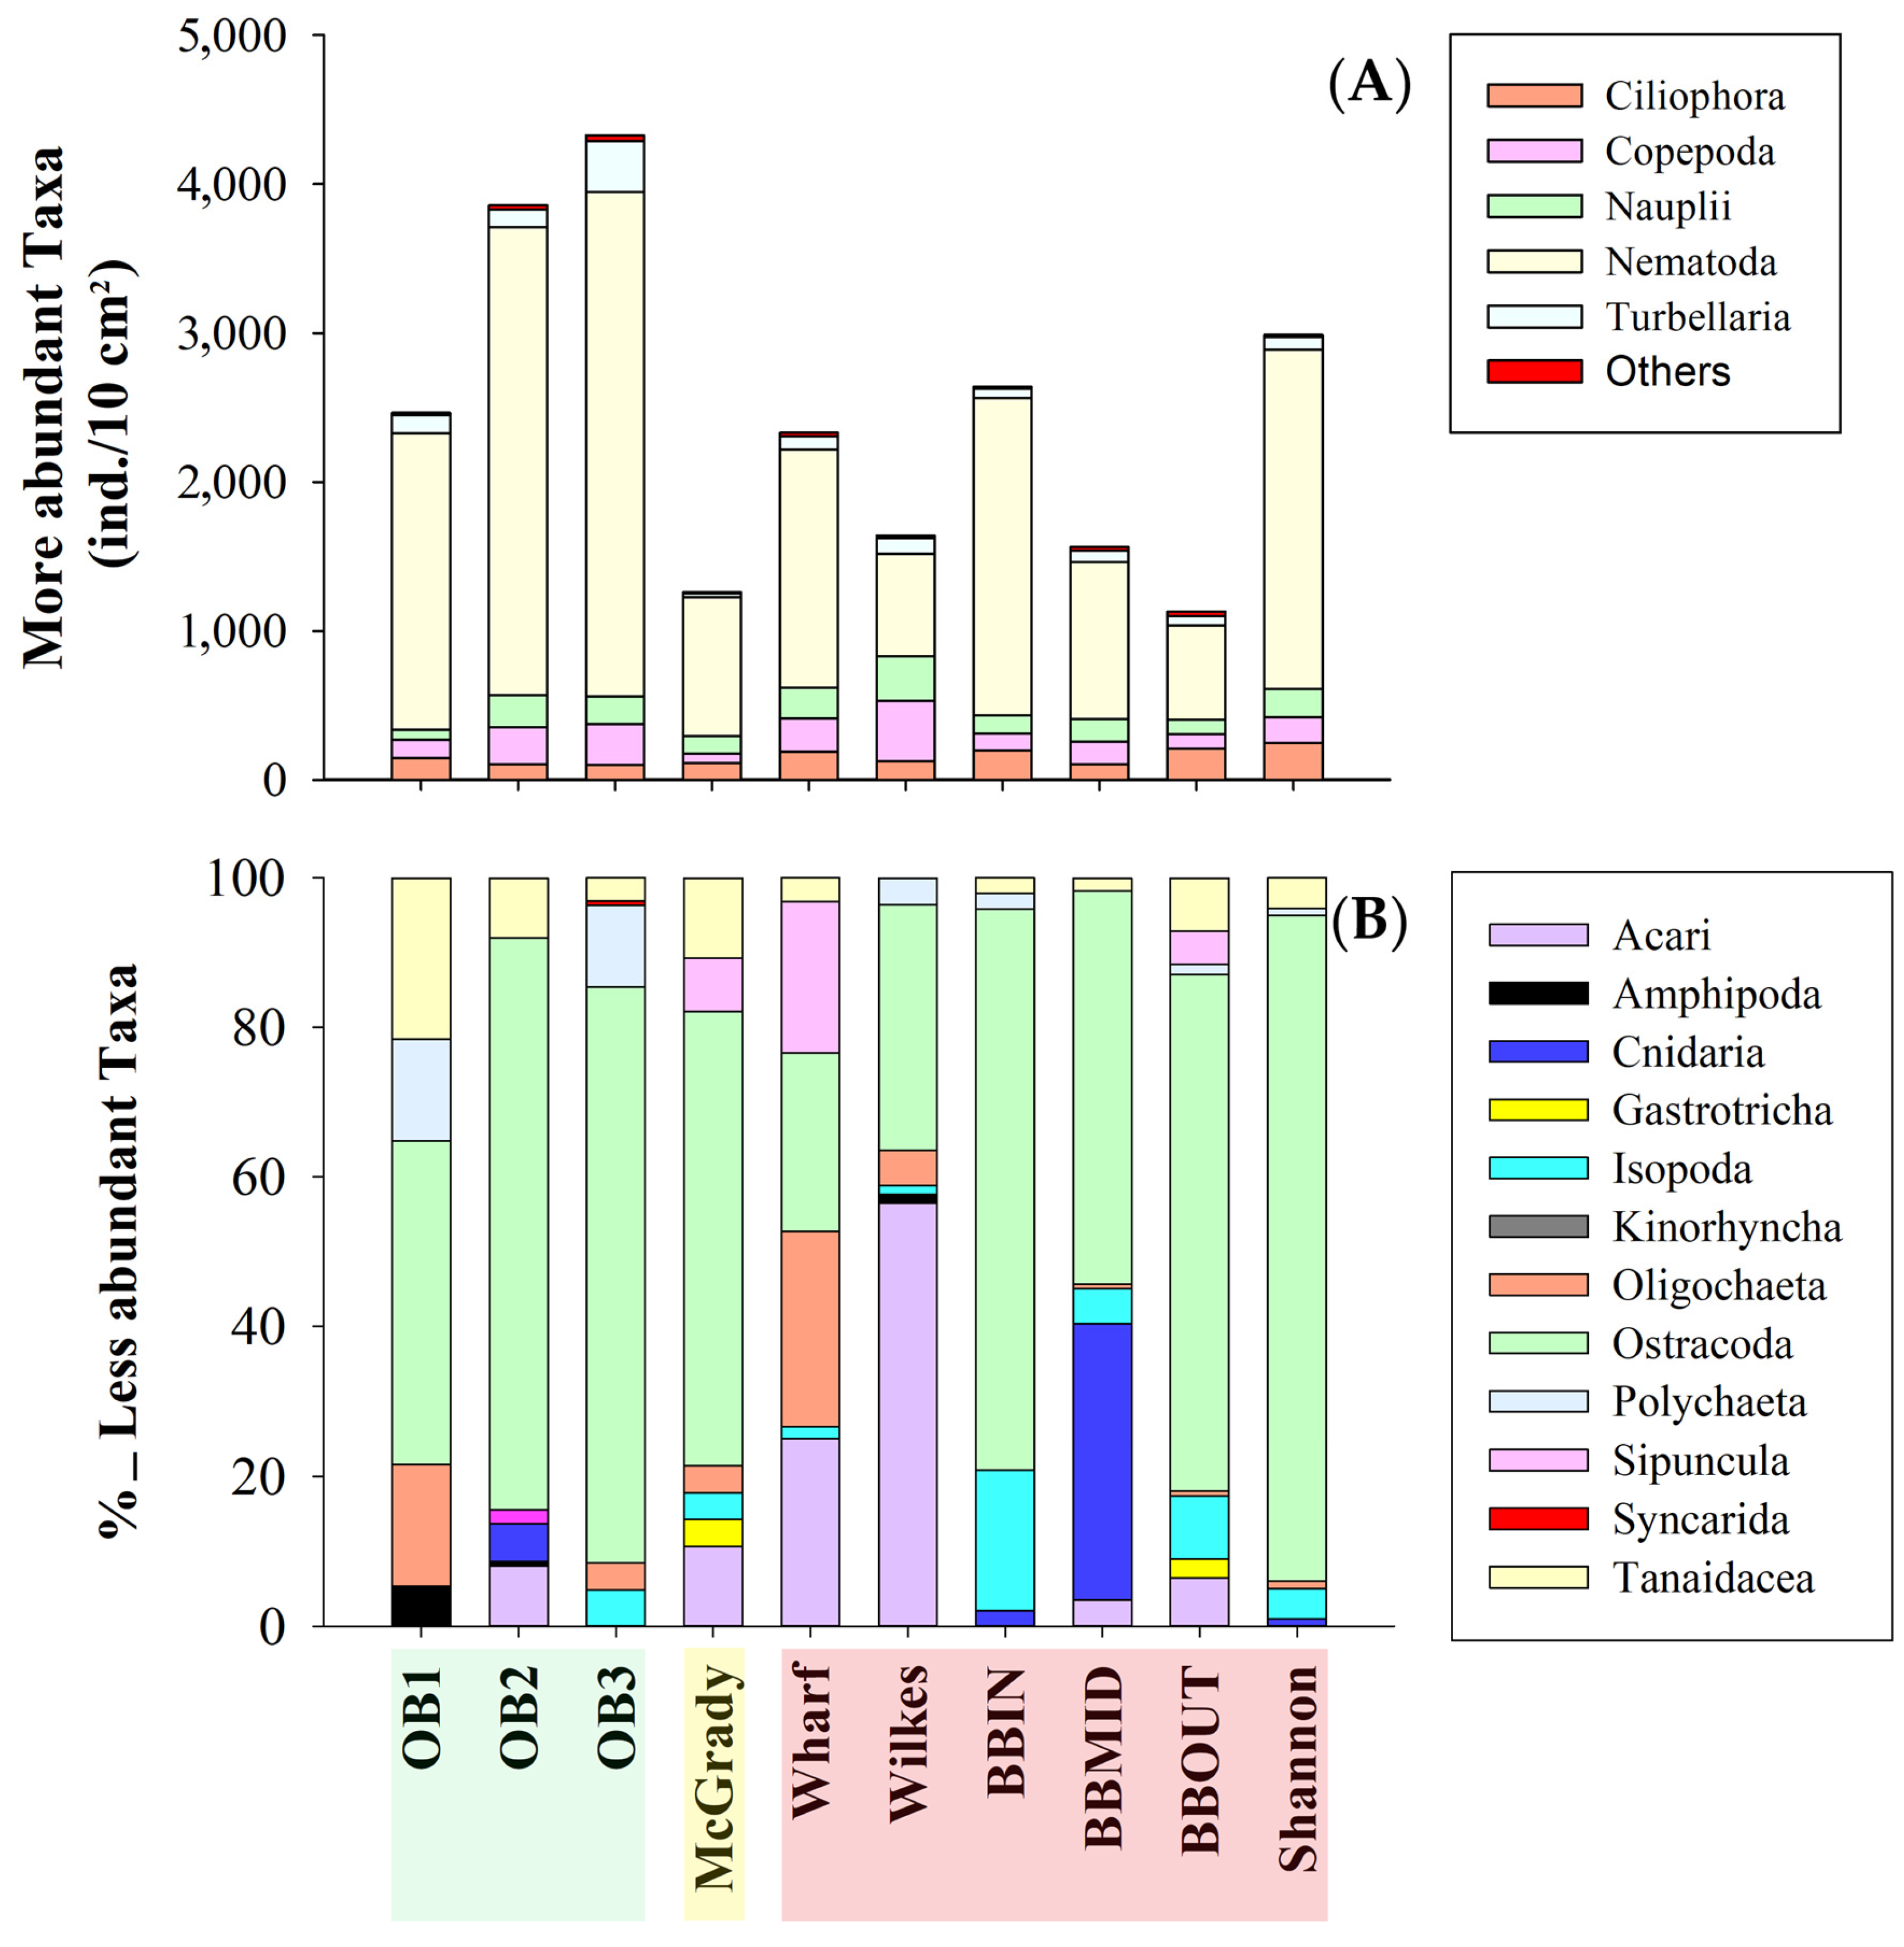
Among the taxa, Nematoda was the most abundant group in all locations (41–80%) and together with Copepoda, Ciliophora, Nauplii, and Turbellaria represented approximately 99% of the organisms identified (Figure 3).

3.1.2. Spatial Structure

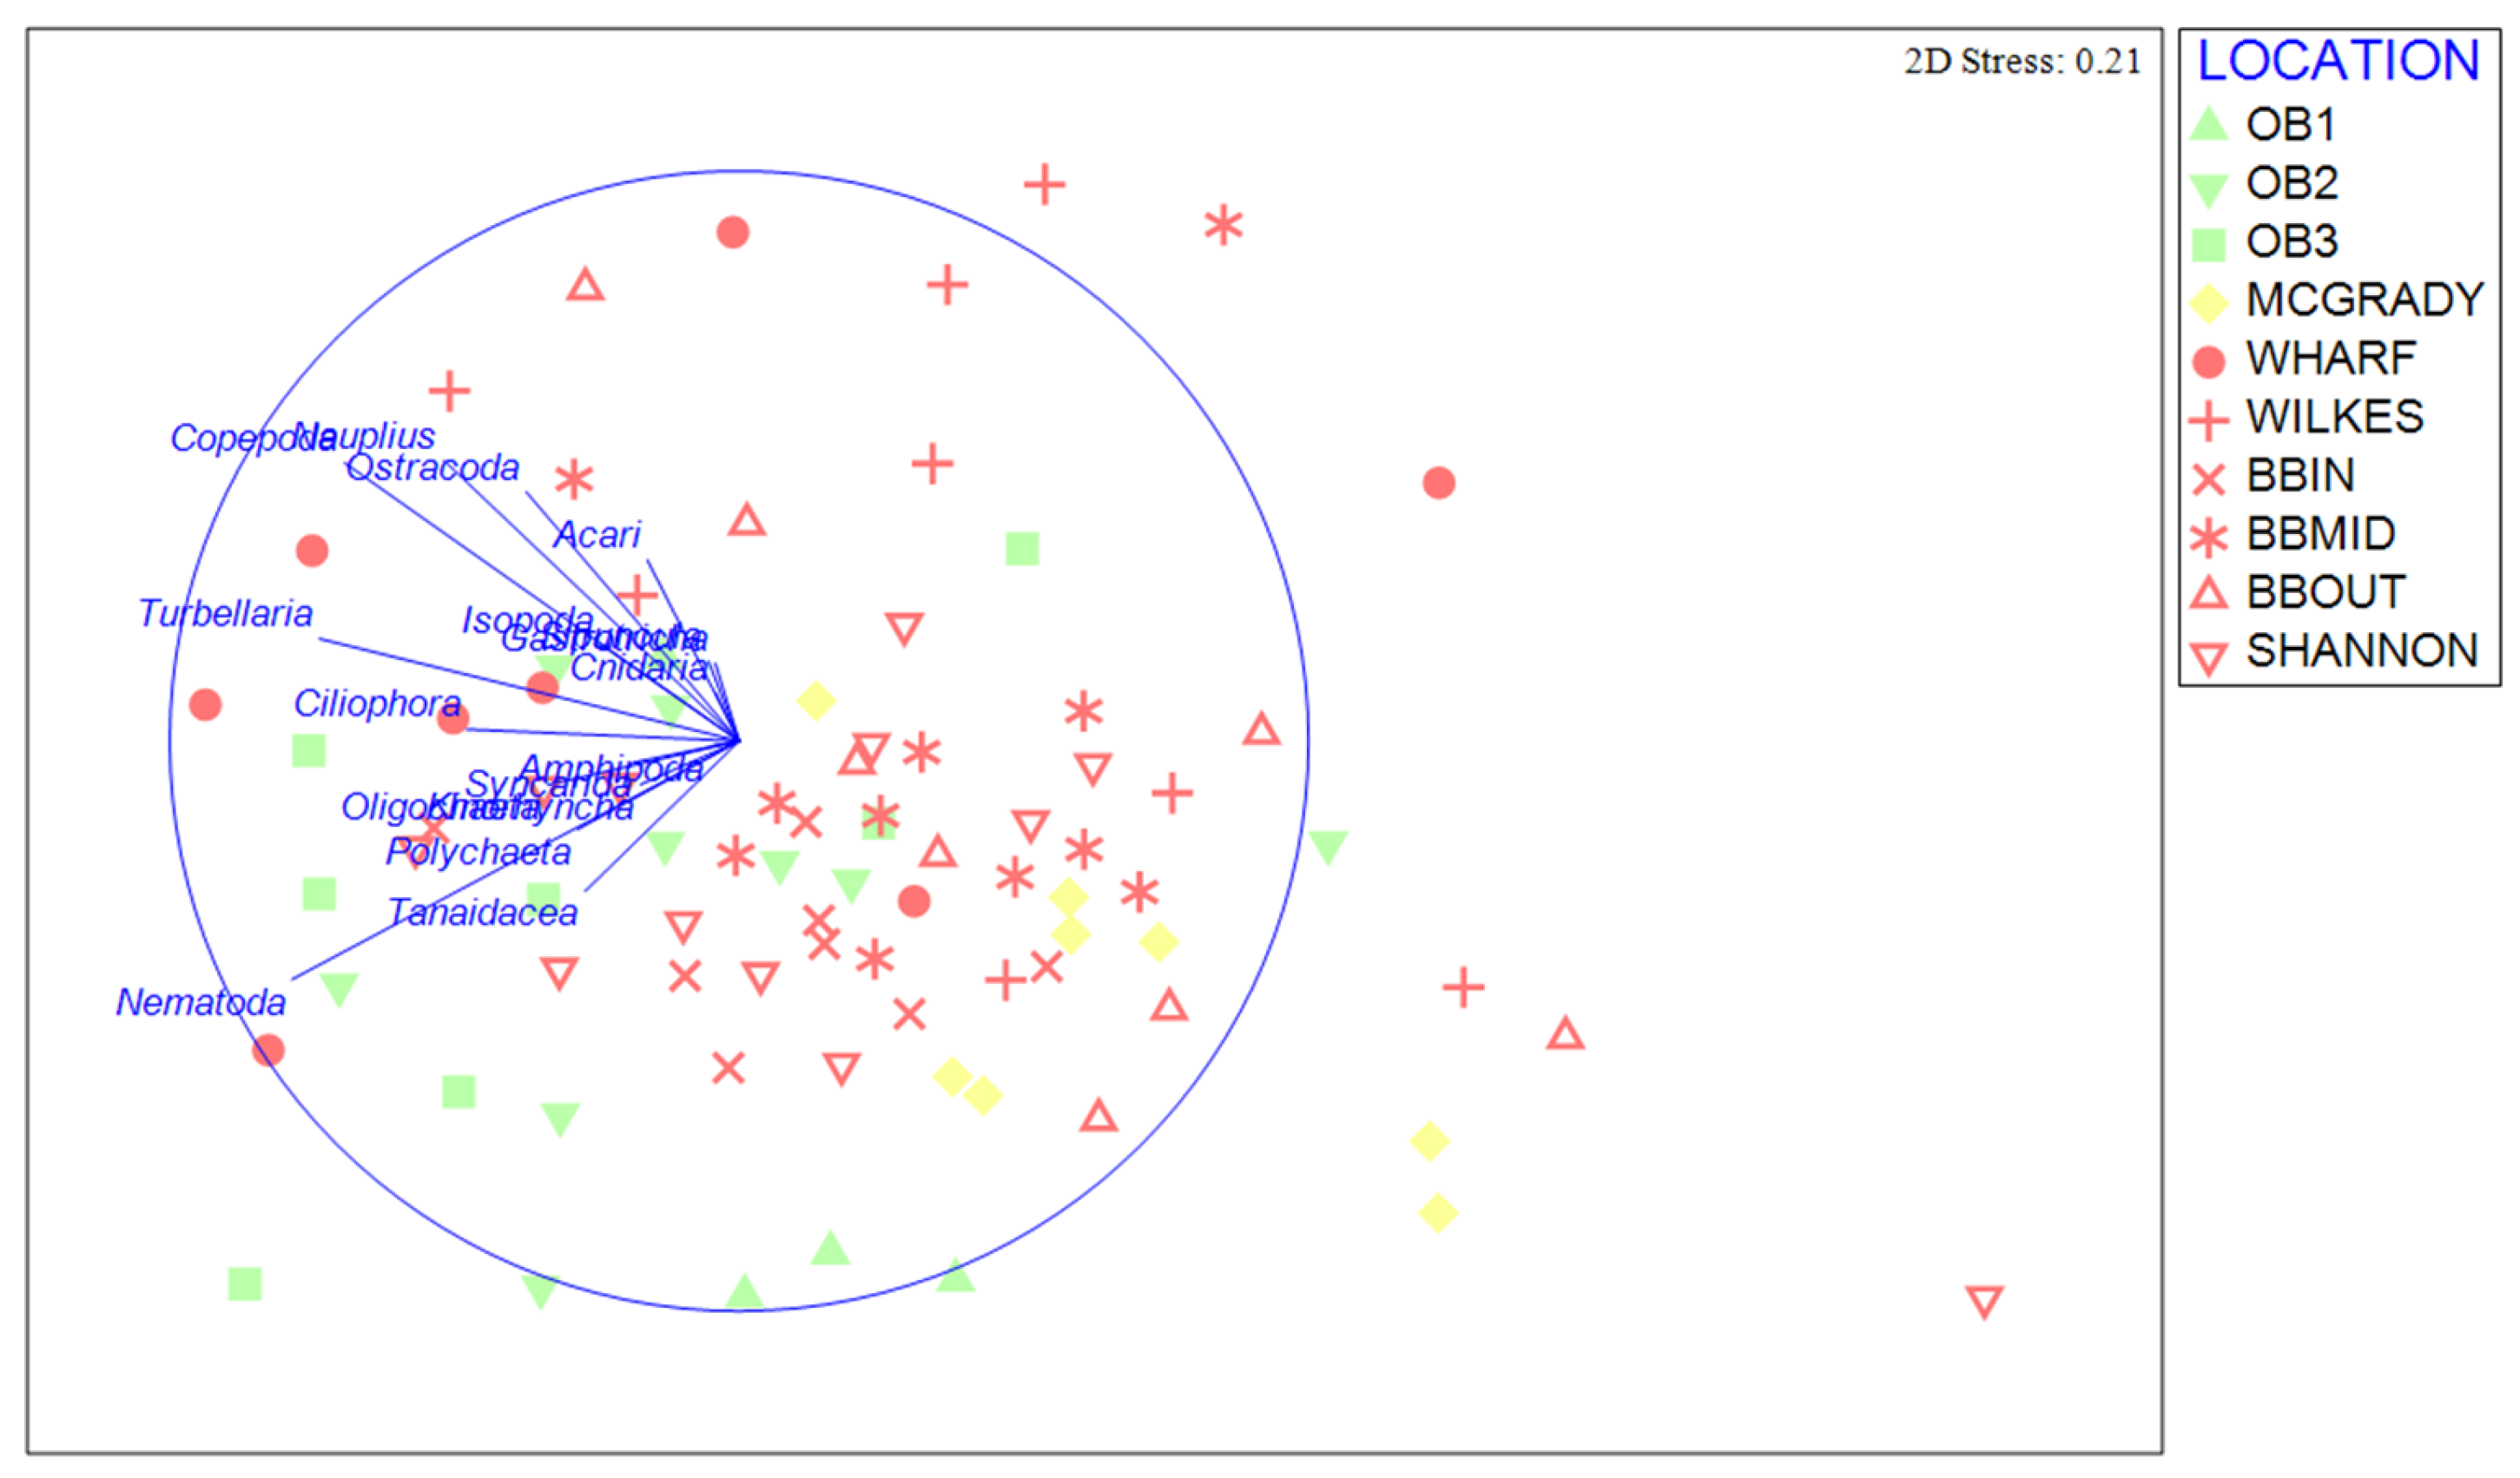
A multivariate analysis of meiofauna community composition revealed significant differences at the location scale, with significant variation only observed among locations (Table 2). The nMDS ordinations showed a greater association and less dispersion between the impacted locations (BBIN, BBMID, BBOUT, and SH) compared to the others (Figure 4). The Spearman correlation vectors applied to the nMDS indicated that most taxa exhibited a positive correlation with the reference locations belonging to OB (particularly OB1 and OB2) as well as WH. This is consistent with the observation of the highest meiofauna densities at these locations. Further analysis of community structure was conducted using PERMDISP, which tests for differences in multivariate dispersion. No significant differences in the multivariate dispersion for meiofauna communities among locations were found (p = 0.19).
The meiofauna community comparisons resulting from PERMANOVA analyses revealed that most of the impacted locations were significantly different from the OB reference locations, except for WI and SH (Table 2). The more abundant taxa, as well as tanaidaceans and ostracods, exhibited sufficient variation to distinguish the impacted and reference locations from each other (SIMPER) (Table S3).
Most meiofauna groups, particularly those that were more abundant (except for ciliophores) exhibited lower densities in impacted locations in Brown Bay, compared to reference locations (Figure 5). This pattern was most evident in crustaceans (nauplii, copepods, ostracods, and tanaidaceans). Along the BB gradient (IN, MID, OUT), the mean densities of most of the most abundant meiofaunal groups (except ciliophores) were lower at BBOUT compared to BBIN, while the total mean density of the other taxa was higher at this site (Figure 5F). Most of these less abundant taxa, except cnidarians, followed this pattern of mean total density. Although the other less abundant taxa contribute less than 1%, changes in their densities between locations are observable. The taxa Gastrotricha and Sipuncula were present only in locations belonging to Newcomb Bay. In the impacted locations BB and SH, minimal or no pattern was evident in relation to the abundance of annelids (Polychaeta and Oligochaeta), and a greater absence of other taxa was observed in the location of BBIN (Figure 3B).

3.2. Environmental Variables and Contaminants Influences on Meiofauna Community

Regarding inorganic pollutants, out of the 28 metals identified, the 7 most significant metals in these areas and/or related to anthropogenic activities were analyzed [15] (Table S4). The total metal concentrations differed significantly between locations (pseudo-F = 3.97; p = 0.03), ranging from 500.03 mg/kg in WI to 10,859.87 mg/kg in BBIN. The highest individual metal concentration across all locations was reported for iron (Fe), contributing 70–90% of the total metal concentration. Most metals were common to all locations, except for tin (Sn), which was only detected in sediments from impacted locations. Additionally, consistent concentrations of cadmium (Cd) were present in most locations, while higher concentrations of lead (Pb), vanadium (V), and zinc (Zn) were found in the BB locations, primarily at BBIN. Moreover, higher copper (Cu) concentrations were observed at the SH and BB locations.
Among the persistent organic pollutants, total petroleum hydrocarbons (TPH), polybrominated diphenyl ethers (PBDEs), and polychlorinated biphenyls (PCBs) were identified, with TPHs and PCBs showing significant differences between study locations (p ≤ 0.01). The highest average concentration of TPH was found in BBIN, at 241.43 mg/kg, while OB1, OB2, WH, and WI showed concentrations below the detection level (35 mg/kg) (Table S4). The average PBDE concentration ranged from 1.35 ng/kg in OB3 to 23.09 ng/kg in Shannon (Table S4). PCBs were only found in impacted locations, with a higher average concentration of 252.25 ng/kg in BBIN (Table S4).
Regarding the other environmental variables analyzed, the TOM and nutrients varied significantly between locations (p ≤ 0.03), with the highest average concentrations at OB3 and MCG, and the lowest average concentrations at OB1, OB2, and BBIN (Table S4). The granulometry varied from clay to sand between the locations (pseudo-F = 3.34; p < 0.01), with sand fractions being more abundant at the OB reference locations, and the silt-clay fraction dominating the impacted locations and those located in Newcomb Bay (Figure 6).
Multivariate analysis of sediment environmental variables, including grain size, TOM and contaminants concentrations (metals, TPHs, PBDEs, and PCBs), showed some differences between locations (Figure 7). In the PCA of all environmental variables, several patterns are noticeable. The BB locations distinguish themselves from all other locations along the PC2 axis. In particular, BBIN is separated from all other locations and groups. Within the larger group spread out mostly along the PC1 axis, the OB reference locations are spread out from left to right over OB1, OB2, and OB3, in concordance with the increasing meiofauna along those stations. WH, WI, and MCG are more centralized in the PCA plot (Figure 7A).
When separating the grain size and metal variables, these patterns changed slightly, with fewer differences between localities, particularly in grain size. A prevalence of smaller grains is observed in the locations, with a difference between <63 and V.F. sand in PC2, where the locations OB1, OB2, WH, WI, and BBIN are correlated with V.F. sand, while OB3, MCG, SH, BBMID, and OUT are correlated with <63 m (Figure 7B). For metal concentrations, the impacted locations of BB form a highly variable group on their own, and the rest of the locations form a grouping together (Figure 7B). Both sampling locations in BB (BBIN, BBMID, and BBOUT) were clearly separate from the other locations in the PCA ordination, with particularly high concentrations of tin, copper, and lead (Figure 7C).

Correlation between Meiofauna and Environmental Parameters

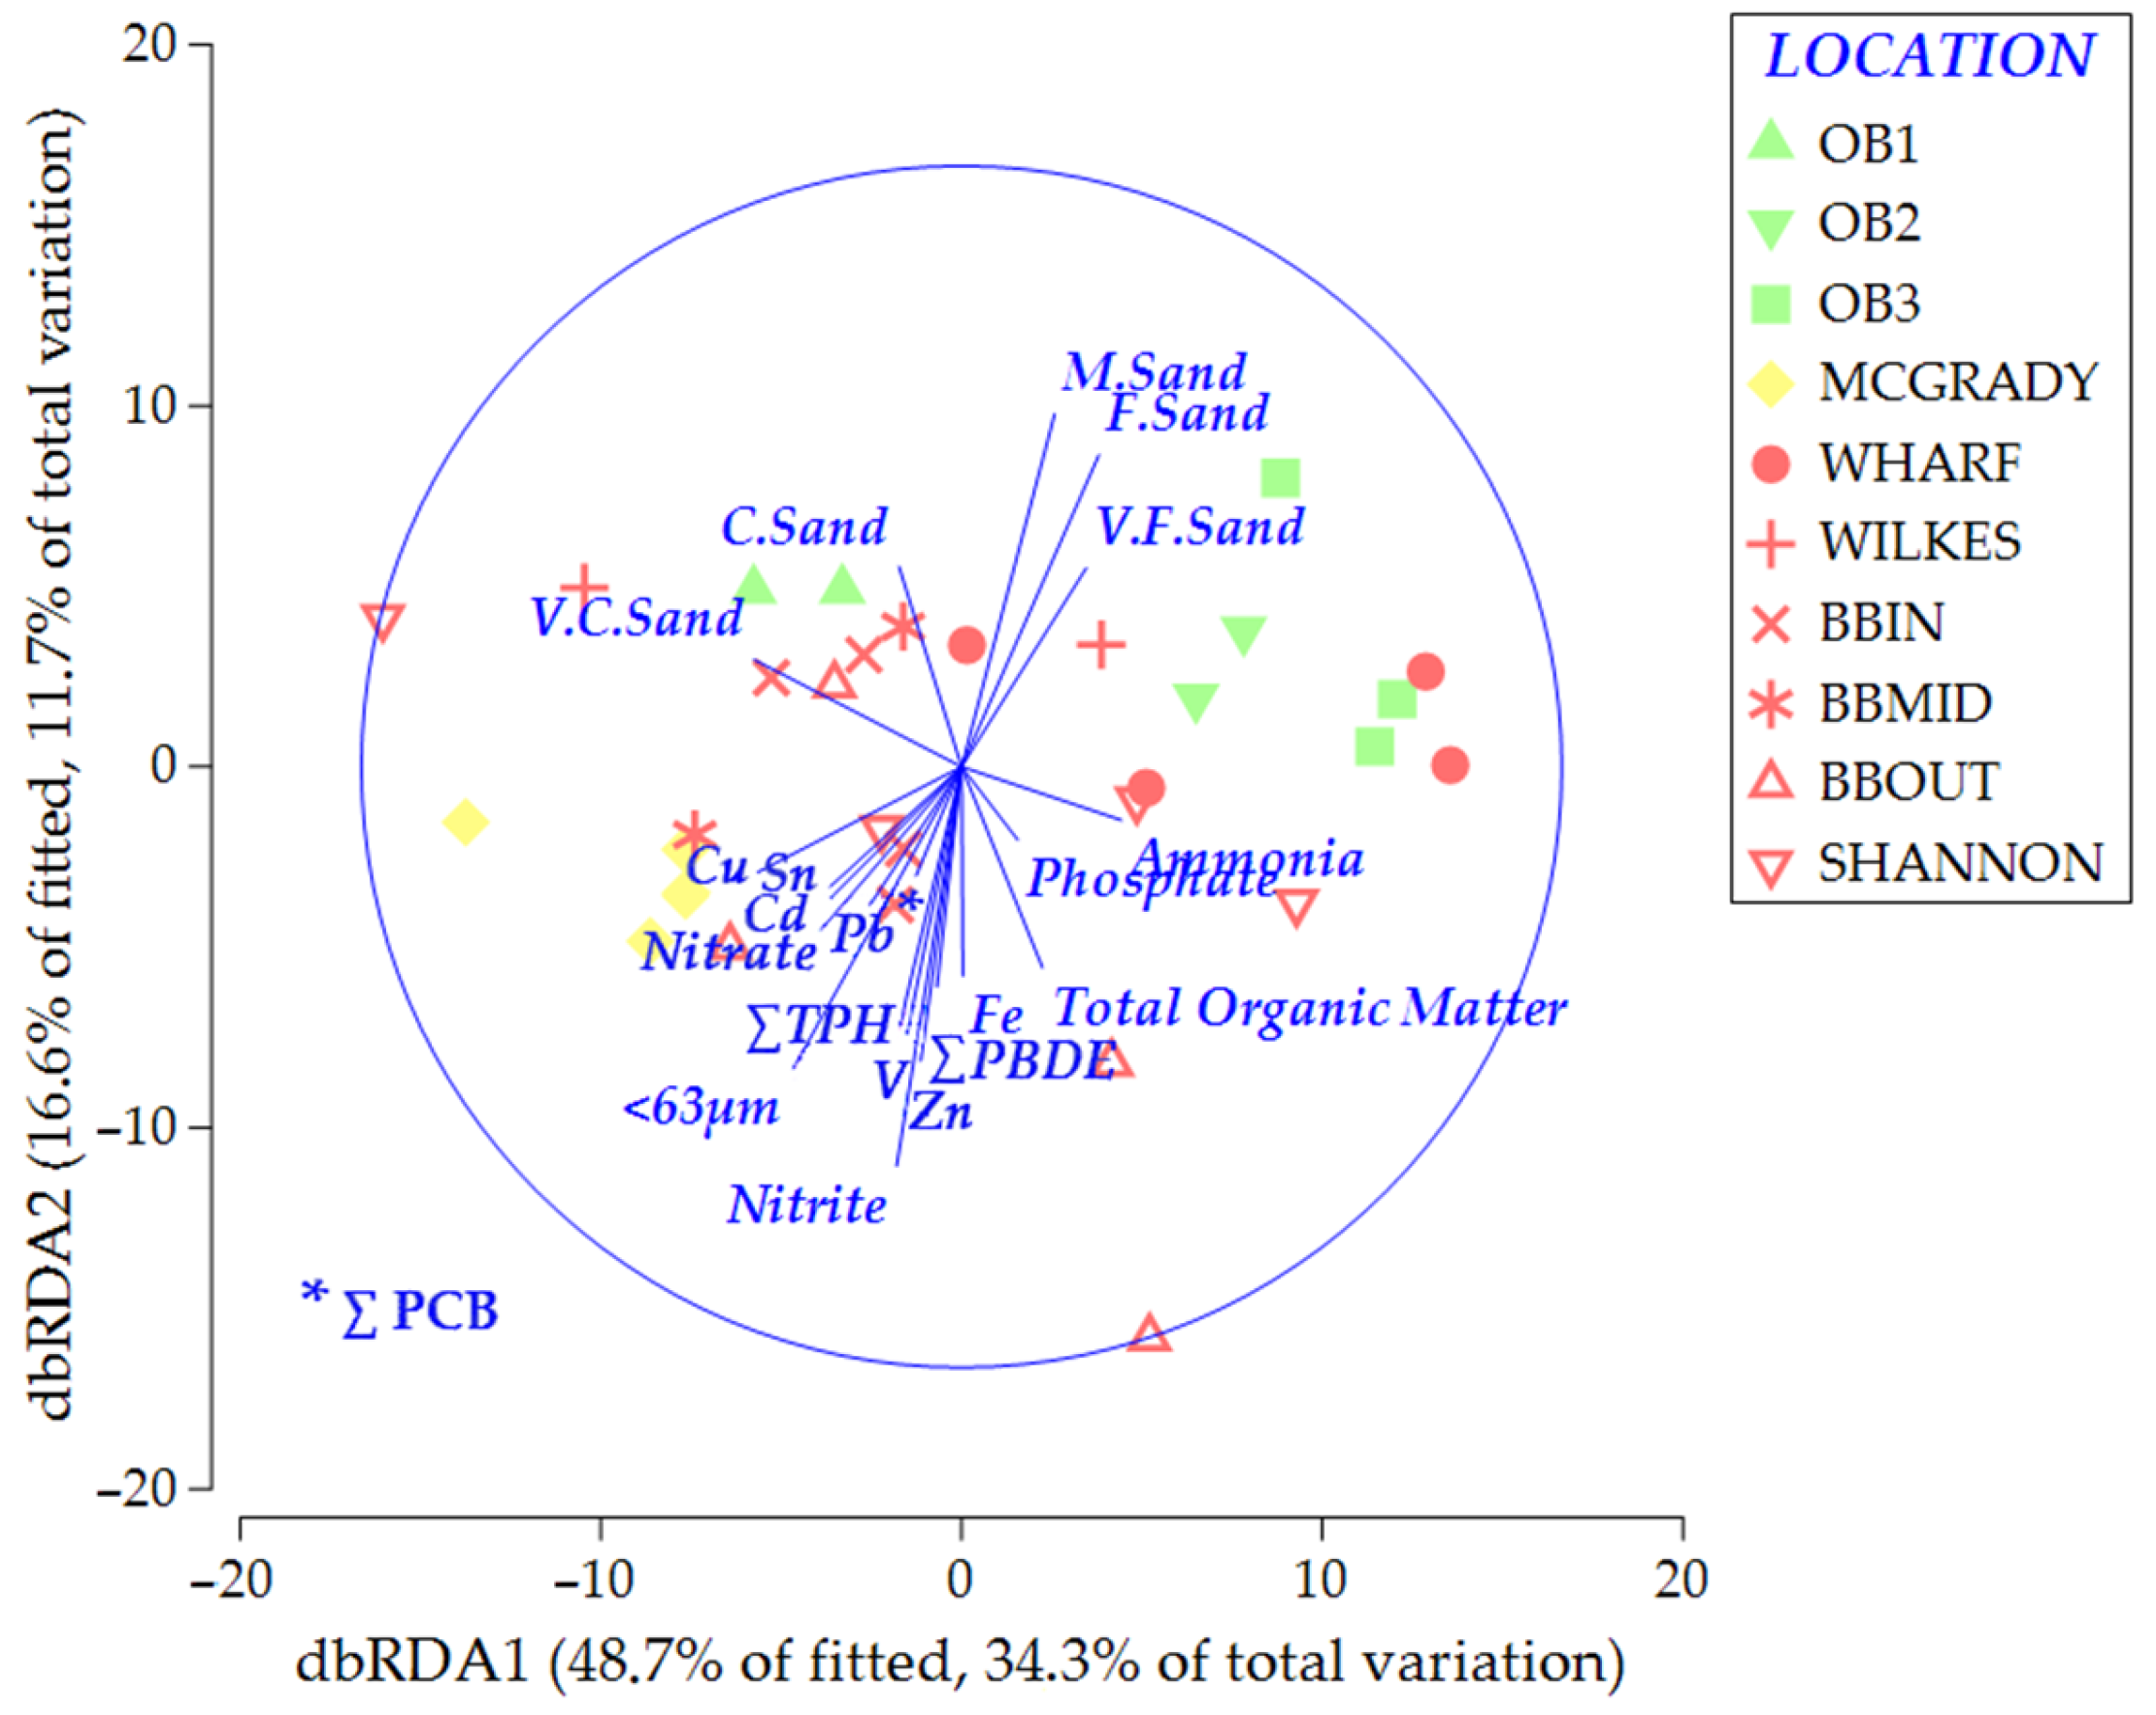
The results of the DistLM-Best multivariate analysis on the relationship between all environmental variables and the structure of the meiofauna revealed that M. sand, V. C. sand, TOM, ammonia, Cd, and Pb were the six variables that best explained (together, 35.7%) the variation in meiofauna community structure (Table S5). The dbRDA plot model based on the DistLM model explains 65% of the fitted and 46% of the total variation. The dbRDA vectors demonstrated that the second axis is related to most of the environmental variables, contributing to the variation and distinction between different groups. The OB locations tended to separate from the BB location in the dbRDA plot along gradients of pollutants, sediment grain size, and some nutrients. MCG, despite not being grouped with the other reference locations, does not have high concentrations of pollutants and forms an isolated group (Figure 8).

4. Discussion

This study presents the first comprehensive description of the spatial distribution, diversity, and relationship to environmental influences for benthic meiofaunal communities in coastal East Antarctica. Over the past two decades, meiofauna have emerged as reliable bioindicators of environmental quality due to their sensitivity to various anthropogenic stressors [4,31]. Consistent with prior research, our study also revealed significant differences in the structure of meiofauna communities across locations characterized by varying concentrations and types of chemical contaminants. Specifically, our findings align with documented classes of chemical contaminants in Antarctica since 1967, including heavy metals, hydrocarbons, and persistent organic pollutants (POPs) [32].
These pollutants have been previously detected in the marine benthic ecosystem of the Windmill Islands in East Antarctica [15,33,34]. The primary anthropogenic sources of these contaminants on the Antarctic continent stem from fishing activities, scientific and military presence, national research stations, and tourism, given its lack of permanent inhabitants [2,32]. However, the most significant contributor to local and long-term pollution is concentrated around the 75 Antarctic monitoring and research stations [35]. Many of these stations, such as Casey, are situated on ice-free coastal terrain and have been continuously occupied for over 50 years, resulting in contamination of the marine environment and a consequent impact on its benthic ecosystems [15].

4.1. Benthic Contamination in East Antarctic Bays

The coastal environments of East Antarctica have been extensively studied at Casey and Davis stations, with pollution from these stations identified as a significant environmental concern [15,36,37,38]. Casey Station, in particular, is subject to various anthropogenic disturbances stemming from historical practices and ongoing activities. Sediment analysis reveals elevated pollutant concentrations at directly impacted sites compared to reference locations, with certain contaminants surpassing international sediment quality guidelines, notably metals and PCBs [15].
Distinct contamination patterns emerge, notably near the former waste disposal site, Brown Bay, where pollutant levels exceed those elsewhere around Casey. However, these concentrations are consistent with those observed in other Antarctic coastal bays adjacent to stations, such as Winter Quarters Bay at McMurdo Station [39]. Notably, the active wastewater outfall site (SH) exhibits similar pollution levels to Brown Bay, while the WH and WI locations show lower contaminant concentrations more akin to the reference locations (OB1, OB2, and OB3), or minimal pollution levels, as seen in MCG.
Although MCG lacks a direct pollution source, the presence of finer sediment grains and its proximity to Brown Bay within Newcomb Bay suggest a potential route for the influx of organic and inorganic compounds, resulting in relatively low disturbance levels. Notably, the pollutant concentrations are highest in Newcomb Bay, attributed to continuous human occupation since 1957, leading to widespread pollution [15].

4.2. Density, Biodiversity, and Spatial Variation in Meiofaunal Communities

The mean meiofauna densities reported in this study (2642 ind./10 cm2) are lower compared to most regions documented for Antarctic shallow waters [20,40]. However, it is important to note that many of these studies focus on the Antarctic Peninsula region, particularly bays on King George Island [40,41,42,43,44,45], where much higher meiofauna densities have been recorded, reaching up to 11,366 ind./10 cm2 [40]. These elevated densities are likely due to favorable environmental conditions along King George Island’s coast, such as greater primary productivity, reduced sea ice coverage, and higher summer seawater temperatures [20,46]. Given that Casey is located further south, it experiences longer periods of sea ice cover, resulting in lower productivity and reduced food availability for meiobenthos [20].
In terms of biodiversity, the study identified a total of 15 meiofauna taxa at Casey, along with two other ecologically distinct groups, ciliophores and nauplii larvae, with nematodes comprising up to 80% of the total abundance. Copepods were the second most abundant taxon. Similar findings have been reported in other studies focusing on Antarctic shallow waters, where rich meiofauna assemblages with up to 25 taxa have been observed, with nematodes often dominating communities at up to 95% of the total abundance [20,40,47]. For example, in Martel Inlet, King George Island, a total of 17 meiofauna taxa were recorded at depths of 20–30 m, with nematodes constituting over 80% of the community, followed by copepods [40].
Significant spatial variation in meiofauna communities was observed primarily between locations separated by thousands of meters. Although some community variation occurred, it was not significant at the site (hundreds of meters) and plot (tens of meters) scales, different to the previous outcomes documented in nematode and copepod communities that showed significant variation at the plot scale (10 m) and at the site scale (100 m), respectively [20]. Non-metric multidimensional scaling (nMDS) ordination analysis indicated a tendency for distinctive community compositions between locations within the OB and Newcomb Bay, reaffirming the influence of environmental conditions on meiofauna communities [20]. Furthermore, the arrangement of variation in meiofauna community structure at the MCG reference location relative to the impacted locations in Newcomb Bay and reference locations in OB suggests some level of anthropogenic impact.

4.3. Environmental Variables and Contaminant Influences on Meiofaunal Communities

The structure and distribution of meiofauna communities were strongly influenced by the granulometric properties of the sediment and certain nutrients, such as ammonia, included in the best explanatory models. Meiofauna diversity was negatively correlated with very fine sediment and silt-clay fractions, which were predominantly present in the most polluted areas. Conversely, reference locations belonging to OB showed more of the medium and larger grains, resulting in larger interstitial spaces and favoring meiofauna diversity. One of the biggest proportions of fine grains and silt-clays were recorded in areas with higher concentrations of pollutants, a relationship also reported by other authors [48,49,50,51,52]. A sediment with a higher proportion of fine grains presents, proportionally, a greater amount of organic matter, contributing to the accumulation of pollutants. These chemical pollutants have a high adsorption capacity for organic particles and finer sediment grains, directly affecting the meiofauna through ingestion or direct contact with contaminants [51,53,54]. Grain size plays a crucial role in the heterogeneity of meiofauna groups, influencing their abundance, distribution, and diversity [55], as observed on King George Island [56] and Signy Island [41] in Antarctica.
In addition to sediment grain-size properties, the organic matter content and certain nutrients also correlated strongly with meiofauna community patterns. The highest concentration of organic content in this study was found in OB3, suggesting greater primary production compared to other locations and consequently greater densities and diversity of meiofauna due to high food availability. Most directly impacted locations, except for BBIN and/or those in Newcomb Bay (MCG), also had high mean nutrient values, which could have influenced meiofauna structure. However, the effects of these nutrients on meiofauna can vary depending on concentration and composition, as high concentrations of certain nutrients in the marine environment may indicate anthropogenic impacts [57]. In this study, nitrite and nitrate were the most abundant nutrients in impacted locations (BBMID and BBOUT), while ammonia and phosphate predominated in reference locations (OB3 and MCG). These nutrients can be released by plants and animals and produced through the decomposition of organic matter (such as hydrocarbons) [57,58], and in excess supply they can cause great stress in the marine environment due to hypoxia related to eutrophication [59]. Furthermore, some nutrient compounds have interactive toxic effects with other pollutants (e.g., hydrocarbons), such as enhancing the toxicity of phenanthrene exposed to nitrite [60].
Human impacts have also been correlated with differences in sedimentary meiofauna communities. Variations in meiofauna community structure (i.e., density and diversity) were observed between sediments with higher pollutant concentrations and those with lower concentrations. These differences were mainly attributed to higher concentrations of metals (e.g., lead) and TPHs at locations adjacent to the former Casey Station dump (BB) compared to other locations. Lead concentrations above the threshold effect limit (TEL) level were found at BB [15].
In BB, differences in the meiofauna community composition between the closest (BBIN) and furthest (BBOUT) impact locations, even just a few hundred meters apart, were as significant as between other locations many kilometers apart. The meiofauna community in BBOUT was more diverse, rich, and equitable compared to BBIN, demonstrating a clear impact gradient (see Figure 5). However, the meiofauna total densities at BBIN were higher than at BBMID and BBOUT, predominantly driven by nematode densities. Even in polluted conditions, nematode densities may be high owing to reduced competition from other organisms more sensitive to pollution and the ability of certain nematode taxa to flourish in polluted conditions. The meiofauna communities at BBMID are more similar to those from BBOUT compared to those from BBIN, which stand apart in terms of community structure. There is a clear pollution gradient of metals and TPHs with increasing distance from Casey’s old garbage dump, with BBIN being the most polluted and impacted location. The pressures of the pollution gradient are visible in the meiofauna community on a smaller scale (between directly impacted locations) and on a larger scale (when comparing impacted and reference areas). Around McMurdo Station, differences between macrofauna benthic communities along a steep spatial gradient of anthropogenic contamination, including metals and hydrocarbons, were also observed, with a reduction in faunal abundance and diversity at the most contaminated locations [61,62].
In addition to abandoned garbage dumps, sewage outfalls and effluent discharges are some of the main local anthropogenic sources of metals and TPHs in this environment [2,63]. The abundances of meiofaunal community groups at the location near the active effluent discharge from Casey Station (SH) were reduced, and gastrotrichs and sipunculids were absent at these locations while they were present at MCG, resulting in decreased richness compared to the reference locations. The reductions in these biological parameters highlight the impact of sewage discharge, despite containing lower levels of metals and TPHs than the BB locations, suggesting that sewage discharge and associated contaminants affect benthic ecosystems. Among these metals associated with sewage discharge, copper (Cu) stands out, with levels above the TEL at the BB locations and SH [15].
Despite having concentrations of metals lower than those found in BB and SH and concentrations of TPHs below detection limits, the meiofauna communities in other disturbed locations (WH and WI) were significantly different from the controls. They demonstrated a lower richness, diversity, evenness, and, in the case of WI, also a lower density compared to the reference locations. These results may indicate that even low concentrations of metals are sufficient to impact meiofauna [4,7]. Still in WI, it is possible to highlight the greater abundance of Halacaroidea compared to other locations and the increase in the metal Cd from 2004 to 2014 observed by Stark et al. (2023) [15].
There has been considerable concern about the heavy metal and hydrocarbon contamination of marine ecosystems in Antarctica, due to their toxicity, biomagnification, and persistence in marine sediments [64]. The occurrence of metals and TPHs in the marine environment is common and can come from runoff from roads and station areas, from abandoned waste disposal locations, from sewage discharge, as well as from natural infiltrations and the degradation of organic matter [65].
Once within the marine ecosystem, these contaminants (heavy metals and hydrocarbons), they deposit and accumulate in sediments and become available for marine benthic communities. Studies have shown that heavy metals, such as lead and copper, affect marine benthic communities [66,67,68] and can cause toxic effects on Antarctic marine biota [69,70]. Lead is toxic and not essential to biological function and has shown to be harmful to several organisms [68]. Copper is also a potential toxicant when present at high levels [71,72]. Hydrocarbons have a high toxicity potential, which can cause various physiological, metabolic, and sensory problems in various animals, e.g., mollusks [73], crustaceans [74], and fish [75]. The effects of hydrocarbons on meiofauna are mainly related to the reduction in abundance, richness, and diversity [4,5]. These effects were shown to persist for periods of more than five years in a mesocosm experiment carried out in the OB region at Casey Station, suggesting that recovery of the structure and diversity of meiofauna communities may take decades [76].
Other stressors documented around Casey Station that could affect the region’s meiofauna were identified in this study, such as persistent organic pollutants: polybrominated diphenyl ethers (PBDEs) and polychlorinated biphenyls (PCBs) [16,20,77,78]. In this study, the persistent organic pollutant PCBs had higher concentrations in Brown Bay, like the metals and TPHs, where they were above the threshold effect limit (TEL) level. This suggests that indeed a mixed set of pollutants as analyzed in this study may be causing synergistic reductions in meiofauna diversity and abundance [79]. However, the persistent organic pollutant PBDEs correlated well with meiofauna communities from SH, adjacent to the discharge of Casey wastewater, and in BB with values that were significantly higher than any other location.
Although notably only the PBDEs were very high at SH, other pollutants (except perhaps arsenic) were not substantially elevated, yet the meiofauna community structure at SH exhibited a low diversity, similar to BBIN, the most-polluted and affected location. The toxicological effects of polybrominated diphenyl ethers associated with tumors, teratogenesis, and endocrine disruption may be a plausible explanation for the resulting impacted community patterns at SH [80]. However, still relatively little is known about its ecotoxicity and toxicity to Antarctic or polar species [63,81,82]. Wastewater is a known source of PBDEs to Antarctic marine environments [15,37,78]. High levels of persistent organic pollutants, including PBDEs, have been found in sewage sludge, and in sediment, fish, and invertebrate effluents near Antarctic sewage outfalls at Casey, Davis, and also at Ross Island [37,63,83].
While clear patterns related to disturbance were observed at the community level, the patterns for individual taxa in relation to disturbance were less clear. However, the absence or reduction in the abundances of sensitive taxa, especially some crustaceans (i.e., nauplii, amphipods, copepods, ostracods, and tanaidaceans), in places with high levels of metals and TPHs provides evidence of the potential effects of chemical disturbance in these environments. Copepods, nauplius larvae, ostracods, and tanaidaceans had lower abundances at the location with the highest level of pollution (BBIN) compared to the reference locations, while amphipods were absent. However, in macrofaunal samples at the BBIN, the abundance of gammarid amphipods was higher in BB and Shannon than at the reference sites [16]. These results indicate that the observed meiofauna and macrofauna communities respond with different specific sensitivities in relation to anthropogenic impacts.
In general, crustaceans form a particularly sensitive group, not only to the significant increase in organic matter but also to the increase in other types of pollution, including metals and hydrocarbons [84,85]. The sensitivity of copepods, ostracods, and tanaidaceans to these contaminants has also been documented in several biomonitoring studies [17,86,87], including in Antarctica, in places with different disturbances in Admiralty Bay, where there was a reduction in the abundance of these crustaceans and other sensitive taxa [40,88].
In addition to crustaceans, annelids (i.e., polychaetes and oligochaetes) were also more abundant in reference sediments compared to impacted locations. Crustaceans and macrofaunal annelids, mainly polychaetes, are often used as indicators of contamination and the presence of toxic substances in sediments. However, they seem less sensitive when compared to certain meiofaunal groups [89]. Although many species of polychaetes and oligochaetes are generally considered tolerant to pollution, sensitivity to different disturbances and chemical compounds, such as effluents and wastewater, heavy metals, and hydrocarbons, has been documented [89,90,91].
In general, these crustaceans and annelids from shallow-water coastal marine meiofauna are considered animals that may be sensitive to anthropogenic impacts due to their ecological role and susceptibility to environmental changes [92]. In Antarctica, these groups may show similar patterns of sensitivity to anthropogenic disturbances, given the pristine nature of the environment and the potential for rapid responses to changes in habitat quality. However, other studies also carried out in the coastal waters of East Antarctica have demonstrated high abundances of macrofauna crustaceans in BB [16,18]. Therefore, more research specifically using both faunal types in the assessment of the effects of Antarctic conditions is needed to fully understand the tolerance of these taxa in this unique ecosystem [93].
Unlike the patterns observed by previous taxa, ciliophores were more abundant in impacted locations, due to their high adaptability to aquatic environments contaminated with organic or inorganic particles in the sediment [94,95]. The phylum Ciliophora is one of the most ubiquitous groups of protozoa, with free-living and symbiotic species. Free-living forms can be found throughout the world, common in sediments or plankton of marine and freshwater habitats and in soils [96]. They are phagotrophs, organisms that eat available organic particles, and can adapt to contaminated environments, e.g., by forming cysts on the walls of their body in anticipation of anaerobic conditions (lack of oxygen) in the aquatic environment [95].

4.4. Meiofauna as Environmental Indicators in Antarctica

The ecological quality classification, based on the total number (richness) of meiofaunal taxa proposed by Danovaro et al. (2004) [30], and modified according to the European Water Framework Directive (WFD), revealed a range from poor to moderate across the studied locations. A moderate prevalence of ecological quality was noted in reference locations with lower pollutant concentrations. With the exception of OB1 and OB3, classified as environments of moderate ecological quality, corroborating their designation as reference locations, all other sites, including the most polluted location (BBIN), were considered of poor quality.
The superior ecological quality in the O’Brien locations, particularly OB1, can be attributed to the low anthropogenic pollution level. Factors such as sedimentary structure, predominantly composed of larger grains, along with nutrient levels and lower concentrations of organic matter, contribute to a reduced accumulation of potentially toxic compounds, fostering better environmental conditions for meiofaunal survival and biodiversity [97]).
In BB, a gradient of environmental impact and quality was observed in relation to the distance from the contamination source. The farthest location (BBOUT) exhibited a better environmental quality compared to closer sites (BBMID and BBIN). BBIN, the most polluted site, demonstrated the lowest abundance or absence of certain taxa (e.g., amphipods, oligochaetes, ostracods, and polychaetes), as well as lower values of environmental indices (e.g., richness, Hill index, Shannon–Wiener index, Pielou index) and EcoQ classification, despite having the highest overall meiofauna density.
Anthropogenic disturbance can alter meiofaunal abundance and diversity, although the direction of changes is not always consistent. Increases in meiofaunal abundance may represent a transient response of opportunistic individuals [98]. Previous studies have indicated that anthropogenic pollution can promote an increased abundance of meiofauna, particularly among opportunistic nematodes and other taxa tolerant of altered conditions [98,99]. Decreases in diversity indices and environmental classifications suggest environmental stress, with benthic fauna serving as a proxy for assessing environmental quality status [51,100,101].
Diversity indices, such as Hill’s, are valuable for characterizing natural communities. Hill indices are dependent on taxonomic dominance, ranging from S, reflecting solely the number of taxa, to H∞ or “dominance index”, inversely proportional to the most dominant genus [102]. Both higher-order (H2, H∞) and lower-order (H0, H1) Hill numbers indicate BBIN as the least diverse site compared to others. Comparing only within BB locations, the farthest location from the pollution point (BBOUT) exhibits greater diversity, important for communities with high and low dominance.
Indices like EcoQ are useful for comparing impacted and non-impacted areas [30,31]. EcoQ assessments through meiofauna have been applied in anthropically impacted coastal and estuarine environments in temperate and tropical climates [51,103,104].
The environmental index values in this study underscore the ecological impact in areas with higher concentrations of organic and inorganic pollutants. Lower environmental quality index values, compared to less disturbed areas, indicate meiofauna’s utility in detecting changes in impacted areas, responding to various pollutions, including extreme environments like Antarctica [5,10,47,104].

5. Conclusions

Our study revealed significant heterogeneity in meiofauna community composition across the sampled locations, attributable to effects characterized by a diverse array of contaminants and sediment properties. The observed reduction in diversity indices, along with EcoQ (richness), particularly in the most disturbed sites, underscores the utility of meiofauna as effective biomonitoring indicators for marine conservation, particularly concerning metals and hydrocarbons. These pollutants emerged as primary factors influencing meiofauna communities and likely contribute to biodiversity declines in polluted Antarctic marine ecosystems.
The analysis of sediment contamination delineated a pollution gradient across locations, with proximity to the pollution source correlating with higher contamination levels, while more distant sites exhibited a comparatively better environmental quality. Additionally, sediment grain size emerged as a significant determinant of meiofauna distribution, contributing to variations observed between locations. These findings underscore the imperative of minimizing chemical contaminant influx into marine ecosystems, particularly in ecologically sensitive regions like Antarctica, and offer insights into the ecological responses and potential recovery trajectories of historically contaminated environments.
The current meiofauna community composition in East Antarctica provides a baseline assessment of ecological quality against which future changes can be compared through monitoring. Further research into the interplay between sediment characteristics and contaminant effects on meiofauna communities is crucial to disentangle their complex individual and combined impacts on benthic ecosystems.

Supplementary Materials

The following supporting information can be downloaded at: https://www.mdpi.com/article/10.3390/d16080464/s1. Table S1: Mean values (±SE) of the meiofauna groups found at the locations (OB1, OB2, OB3, McGrady, Wharf, Wilkes, BBIN, BBMID, BBOUT, and Shannon); Table S2: Comparison between the ecological indices calculated at all locations: richness (S), density (N), Shannon–Wiener index (H’), Hill’s index (H1, H2, H∞), and evenness (J’), using the results of the PERMANOVA analysis. The analysis factor was the area (location). p (perm) values < 0.05 are in bold. The “df” indicates degree of freedom, “MS” represents the means of squares values; Table S3: Results of the similarity analysis (SIMPER) using abundance data, indicating the taxa that contributed to the dissimilarity in the nematode community of the reference (OB1, OB3, OB3, and McGrady) and impacted (Wharf, Wilkes, BBIN, BBMID, BBOUT) sites and Shannon). Abund med., average abundance; Diss Med., average dissimilarity; Diss/SD, standard deviation of dissimilarity; Contrib%, contribution percentage; Cum.%, cumulative percentage; Table S4: Mean values (±SE) of the environmental variables found at the locations (OB1, OB2, OB3, McGrady, Wharf, Wilkes, BBIN, BBMID, BBOUT, and Shannon); Table S5: The groups of environmental variables, selected by the DistLM-BEST analysis, which most correlate with meiofauna. The BEST procedure was used on similarity matrices based on meiofauna density. “RSS”, residual sum of squares; “No. Vars”, number of variables.

Author Contributions

Conceptualization, D.A.F., G.A.d.S., J.I. and J.S.S.; methodology, D.A.F., G.A.d.S., J.I. and J.S.S.; software, J.I.; validation, G.A.d.S., J.I. and J.S.S.; formal analysis, D.A.F., G.A.d.S., J.I., J.S.S. and R.B.d.S.; investigation, D.A.F., F.J.d.F., G.A.d.S., J.S.S., J.I. and R.B.d.S.; resources, G.A.d.S., J.I. and J.S.S.; data curation, D.A.F., G.A.d.S., J.I. and J.S.S.; writing—original draft preparation, D.A.F.; writing—review and editing, D.A.F., F.J.d.F., G.A.d.S., J.I., J.S.S. and R.B.d.S.; visualization, D.A.F.; supervision, G.A.d.S., J.I. and J.S.S.; project administration, D.A.F., G.A.d.S., J.I. and J.S.S.; funding acquisition, D.A.F. and J.S.S. All authors have read and agreed to the published version of the manuscript.

Funding

This study was financed in part by the Coordenação de Aperfeiçoamento de Pessoal de Nível Superior—Brasil (CAPES)—Funding Code 001 and the Australian Antarctic Division (AAS projects 4127, 4180, and 4633).

Institutional Review Board Statement

Not applicable.

Data Availability Statement

Contaminant data are available at doi:10.26179/tswe-jg85 and further data presented in this study or inquiries can be directed to the corresponding author/s.

Acknowledgments

The authors acknowledge the contributions of the dive teams and the entire Casey Station staff in 2014/2015 to this study, as well as to the Postgraduate Program in Animal Biology at the Federal University of Pernambuco.

Conflicts of Interest

The authors declare no conflicts of interest. The funders had no role in the design of the study; in the collection, analyses, or interpretation of data; in the writing of the manuscript; or in the decision to publish the results.

References

  1. McKinley, E.; Acott, T.; Yates, K.L. Marine Social Sciences: Looking towards a Sustainable Future. Environ. Sci. Policy 2020, 108, 85–92. [Google Scholar] [CrossRef]
  2. Aronson, R.B.; Thatje, S.; Mcclintock, J.B.; Hughes, K.A. Anthropogenic Impacts on Marine Ecosystems in Antarctica. Ann. N Y Acad. Sci. 2011, 1223, 82–107. [Google Scholar] [CrossRef]
  3. Louati, H.; Said, O.B.; Soltani, A.; Got, P.; Cravo-Laureau, C.; Duran, R.; Aissa, P.; Pringault, O.; Mahmoudi, E. Biostimulation as an Attractive Technique to Reduce Phenanthrene Toxicity for Meiofauna and Bacteria in Lagoon Sediment. Environ. Sci. Pollut. Res. 2014, 21, 3670–3679. [Google Scholar] [CrossRef] [PubMed]
  4. Zeppilli, D.; Sarrazin, J.; Leduc, D.; Arbizu, P.M.; Fontaneto, D.; Fontanier, C.; Gooday, A.J.; Kristensen, R.M.; Ivanenko, V.N.; Sørensen, M.V.; et al. Is the Meiofauna a Good Indicator for Climate Change and Anthropogenic Impacts? Mar. Biodivers. 2015, 45, 505–535. [Google Scholar] [CrossRef]
  5. Schratzberger, M.; Ingels, J. Meiofauna Matters: The Roles of Meiofauna in Benthic Ecosystems. J. Exp. Mar. Biol. Ecol. 2018, 502, 12–25. [Google Scholar] [CrossRef]
  6. Giere, O. Meiobenthology: The Microscopic Motile Fauna of Aquatic Sediments; Springer Science & Business Media: Berlin, Germany, 2009. [Google Scholar]
  7. Balsamo, M.; Semprucci, F.; Frontalini, F.; Coccioni, R. Meiofauna as a Tool for Marine Ecosystem Biomonitoring. Mar. Ecosyst. 2012, 4, 77–104. [Google Scholar]
  8. Jacob, S.; Kennedy, J.P. Synthesis, Characterization and Properties of Octa-Arm Polyisobutylene-Based Star Polymers. Polym. Synth. Complexation 1999, 146, 1–38. [Google Scholar]
  9. Vanaverbeke, J.; Steyaert, M.; Vanreusel, A.; Vincx, M. Nematode Biomass Spectra as Descriptors of Functional Changes Due to Human and Natural Impact. Mar. Ecol. Prog. Ser. 2003, 249, 157–170. [Google Scholar] [CrossRef]
  10. Ingels, J.; Zeppilli, D.; Giere, O. Meiofauna—Adapted to Life at the Limits. In New Horizons in Meiobenthos Research: Profiles, Patterns and Potentials; Springer: Berlin/Heidelberg, Germany, 2023; pp. 363–400. [Google Scholar]
  11. Walton, D.W.H. Antarctica: Global Science from a Frozen Continent; Cambridge University Press: Cambridge, UK, 2013. [Google Scholar]
  12. Mcminn, A.; Hodgson, D. Summer Phytoplankton Succession in Ellis Fjord, Eastern Antarctica. J. Plankton Res. 1993, 15, 925–938. [Google Scholar] [CrossRef]
  13. Beer, E.; Eisenman, I.; Wagner, T.J.W. Polar Amplification Due to Enhanced Heat Flux Across the Halocline. Geophys. Res. Lett. 2020, 47, 86706. [Google Scholar] [CrossRef]
  14. Stark, J.S.; Kim, S.L.; Oliver, J.S. Anthropogenic Disturbance and Biodiversity of Marine Benthic Communities in Antarctica: A Regional Comparison. PLoS ONE 2014, 9, e98802. [Google Scholar] [CrossRef]
  15. Stark, J.S.; Johnstone, G.J.; King, C.; Raymond, T.; Rutter, A.; Stark, S.C.; Townsend, A.T. Contamination of the Marine Environment by Antarctic Research Stations: Monitoring Marine Pollution at Casey Station from 1997 to 2015. PLoS ONE 2023, 18, e0288485. [Google Scholar] [CrossRef]
  16. Stark, J.S. The Distribution and Abundance of Soft-Sediment Macrobenthos around Casey Station, East Antarctica. Polar Biol. 2000, 23, 840–850. [Google Scholar] [CrossRef]
  17. Thompson, B.A.W.; Goldsworthy, P.M.; Riddle, M.J.; Snape, I.; Stark, J.S. Contamination Effects by a ‘Conventional’and a ‘Biodegradable’Lubricant Oil on Infaunal Recruitment to Antarctic Sediments: A Field Experiment. J. Exp. Mar. Bio. Ecol. 2007, 340, 213–226. [Google Scholar] [CrossRef]
  18. Stark, J.S.; Riddle, M.J.; Snape, I.; Scouller, R.C. Human Impacts in Antartic Marine Soft-Sediment Assemblages: Correlations between Multivariate Biological Patterns and Environmental Variables at Casey Station. Estuar. Coast. Shelf Sci. 2003, 56, 717–734. [Google Scholar] [CrossRef]
  19. Danovaro, R.; Gambi, C.; Luna, G.M.; Mirto, S. Sustainable Impact of Mussel Farming in the Adriatic Sea (Mediterranean Sea): Evidence from Biochemical, Microbial and Meiofaunal Indicators. Mar. Pollut. Bull. 2004, 49, 325–333. [Google Scholar] [CrossRef]
  20. Stark, J.S.; Mohammad, M.; McMinn, A.; Ingels, J. Diversity, Abundance, Spatial Variation, and Human Impacts in Marine Meiobenthic Nematode and Copepod Communities at Casey Station, East Antarctica. Front. Mar. Sci. 2020, 7, 480. [Google Scholar] [CrossRef]
  21. Stark, J.S.; Riddle, M.J.; Simpson, R.D. Human Impacts in Soft-sediment Assemblages at Casey Station, East Antarctica: Spatial Variation, Taxonomic Resolution and Data Transformation. Austral. Ecol. 2003, 28, 287–304. [Google Scholar] [CrossRef]
  22. Stark, J.S.; Snape, I.; Riddle, M.J. Abandoned Antarctic Waste Disposal Sites: Monitoring Remediation Outcomes and Limitations at Casey Station. In Ecological Management & Restoration; Wiley Online Library: Hoboken, NJ, USA, 2006; pp. 21–31. [Google Scholar]
  23. Heip, C.H.R.; Vincx, M.; Vranken, G. The Ecology of Marine Nematodes; Aberdeen University Press: Aberdeen, UK, 1985. [Google Scholar]
  24. Pfannkuche, O.; Thiel, H. Sample Processing. Introd. Study Meiofauna 1988, 9, 134–145. [Google Scholar]
  25. Witthöft-Mühlmann, A.; Traunspurger, W.; Rothhaupt, K.O. Meiobenthic Response to River-borne Benthic Particulate Matter–a Microcosm Experiment. Freshw. Biol. 2005, 50, 1548–1559. [Google Scholar] [CrossRef]
  26. Higgins, R.P.; Thiel, H. Introduction to the Study of Meiofauna; Smithsonian Institution Press: Washington, DC, USA, 1988. [Google Scholar]
  27. Heiri, O.; Lotter, A.F.; Lemcke, G. Loss on Ignition as a Method for Estimating Organic and Carbonate Content in Sediments: Reproducibility and Comparability of Results. J. Paleolimnol. 2001, 25, 101–110. [Google Scholar] [CrossRef]
  28. Snape, I.; Scouller, R.C.; Stark, S.C.; Stark, J.; Riddle, M.J.; Gore, D.B. Characterisation of the Dilute HCl Extraction Method for the Identification of Metal Contamination in Antarctic Marine Sediments. Chemosphere 2004, 57, 491–504. [Google Scholar] [CrossRef] [PubMed]
  29. Anderson, M.; Gorley, R.; Clarke, K.P. For PRIMER: Guide to Software and Statistical Methods. Primer-E Ltd. 2008, 32, 57–79. [Google Scholar]
  30. Danovaro, R.; Gambi, C.; Mirto, S.; Sandulli, R.; Ceccherelli, V. Meiofauna. In Mediterranean Marine Benthos: A Manual of Methods for Its Sampling and Study. Biol. Mar. Mediterr. 2004, 11, 55–97. [Google Scholar]
  31. Moreno, M.; Vezzulli, L.; Marin, V.; Laconi, P.; Albertelli, G.; Fabiano, M. The Use of Meiofauna Diversity as an Indicator of Pollution in Harbours. ICES J. Mar. Sci. 2008, 65, 1428–1435. [Google Scholar] [CrossRef]
  32. da Silva, J.R.M.C.; Bergami, E.; Gomes, V.; Corsi, I. Occurrence and Distribution of Legacy and Emerging Pollutants Including Plastic Debris in Antarctica: Sources, Distribution and Impact on Marine Biodiversity. Mar. Pollut. Bull. 2023, 186, 114353. [Google Scholar] [CrossRef]
  33. Snape, I.; Riddle, M.J.; Stark, J.S.; Cole, C.M.; King, C.K.; Duquesne, S.; Gore, D.B. Management and Remediation of Contaminated Sites at Casey Station, Antarctica. Polar Rec. 2001, 37, 199–214. [Google Scholar] [CrossRef]
  34. Scouller, R.C.; Snape, I.; Stark, J.S.; Gore, D.B. Evaluation of Geochemical Methods for Discrimination of Metal Contamination in Antarctic Marine Sediments: A Case Study from Casey Station. Chemosphere 2006, 65, 294–309. [Google Scholar] [CrossRef]
  35. Antarctic Station Catalogue. Council of Managers of National Antarctic Programs; COMNAP: Christchurch, New Zealand, 2017. [Google Scholar]
  36. Green, G.; Skerratt, J.H.; Leeming, R.; Nichols, P.D. Hydrocarbon and Coprostanol Levels in Seawater, Sea-Ice Algae and Sediments near Davis Station in Eastern Antarctica: A Regional Survey and Preliminary Results for a Field Fuel Spill Experiment. Mar. Pollut. Bull 1992, 25, 293–302. [Google Scholar] [CrossRef]
  37. Stark, J.S.; Corbett, P.A.; Dunshea, G.; Johnstone, G.; King, C.; Mondon, J.A.; Power, M.L.; Samuel, A.; Snape, I.; Riddle, M. The Environmental Impact of Sewage and Wastewater Outfalls in Antarctica: An Example from Davis Station, East Antarctica. Water Res. 2016, 105, 602–614. [Google Scholar] [CrossRef]
  38. Kelly, A.; Lannuzel, D.; Rodemann, T.; Meiners, K.M.; Auman, H.J. Microplastic Contamination in East Antarctic Sea Ice. Mar. Pollut. Bull. 2020, 154, 111130. [Google Scholar] [CrossRef] [PubMed]
  39. Kennicutt, M.C.; Klein, A.; Montagna, P.; Sweet, S.; Wade, T.; Palmer, T.; Sericano, J.; Denoux, G. Temporal and Spatial Patterns of Anthropogenic Disturbance at McMurdo Station, Antarctica. Environ. Res. Lett. 2010, 5, 34010. [Google Scholar] [CrossRef]
  40. Gheller, P.F.; Corbisier, T.N. Monitoring the Anthropogenic Impacts in Admiralty Bay Using Meiofauna Community as Indicators (King George Island, Antarctica). An. Acad. Bras. Cienc. 2022, 94, e20210616. [Google Scholar] [CrossRef] [PubMed]
  41. Vanhove, S.; Lee, H.J.; Beghyn, M.; Van Gansbeke, D.; Brockington, S.; Vincx, M. The Metazoan Meiofauna in Its Biogeochemical Environment: The Case of an Antarctic Coastal Sediment. J. Mar. Biol. Assoc. 1998, 78, 411–434. [Google Scholar] [CrossRef]
  42. Hong, J.-H.; Kim, K.-C.; Lee, S.-H.; Back, J.-W.; Lee, D.-J.; Lee, W.-C. The Community Structure of Meiofauna in Marian Cove, King George Island, Antarctica. Ocean Polar Res. 2011, 33, 265–280. [Google Scholar] [CrossRef]
  43. Xiaoshou, L.I.U.; Xiaoxiao, W.; Lu, W.; Zhinan, Z. A Preliminary Study of Intertidal Meiofauna in Fildes Peninsula, Antarctica. Chin. J. Polar Res. 2020, 32, 281. [Google Scholar]
  44. Säring, F.; Veit-Köhler, G.; Seifert, D.; Liskow, I.; Link, H. Sea-Ice-Related Environmental Drivers Affect Meiofauna and Macrofauna Communities Differently at Large Scales (Southern Ocean, Antarctic). Mar. Ecol. Prog. Ser. 2022, 700, 13–37. [Google Scholar] [CrossRef]
  45. Kang, T.; Yoo, K.-C.; Kim, D. Meiofauna and Nematode Community Composition in Maxwell Bay, King George Island, Antarctica. Ocean Sci. J. 2022, 57, 672–679. [Google Scholar] [CrossRef]
  46. Stark, J.S.; Raymond, T.; Deppeler, S.L.; Morrison, A.K. Antarctic Seas. In World Seas: An Environmental Evaluation; Elsevier: Amsterdam, The Netherlands, 2019; pp. 1–44. [Google Scholar]
  47. Ingels, J.; Hasemann, C.; Soltwedel, T.; Vanreusel, A. Polar Meiofauna—Antipoles or Parallels? In New Horizons in Meiobenthos Research: Profiles, Patterns and Potentials; Springer International Publishing: Berlin/Heidelberg, Germany, 2023; pp. 285–327. [Google Scholar] [CrossRef]
  48. Tolosa, I.; Mesa-Albernas, M.; Alonso-Hernandez, C.M. Inputs and Sources of Hydrocarbons in Sediments from Cienfuegos Bay, Cuba. Mar. Pollut. Bull. 2009, 58, 1624–1634. [Google Scholar] [CrossRef]
  49. Maciel, D.C.; de Souza, J.R.B.; Taniguchi, S.; Bícego, M.C.; Zanardi-Lamardo, E. Sources and Distribution of Polycyclic Aromatic Hydrocarbons in a an Urbanized Tropical Estuary and Adjacent Shelf, Northeast of Brazil. Mar. Pollut. Bull. 2015, 101, 429–433. [Google Scholar] [CrossRef]
  50. Egres, A.G.; Hatje, V.; Miranda, D.A.; Gallucci, F.; Barros, F. Functional Response of Tropical Estuarine Benthic Assemblages to Perturbation by Polycyclic Aromatic Hydrocarbons. Ecol. Indic. 2019, 96, 229–240. [Google Scholar] [CrossRef]
  51. da Silva, R.B.; Dos Santos, G.A.P.; de Farias, A.L.L.; França, D.A.A.; Cavalcante, R.A.; Zanardi-Lamardo, E.; de Souza, J.R.B.; Esteves, A.M. Effects of PAHs on Meiofauna from Three Estuaries with Different Levels of Urbanization in the South Atlantic. PeerJ 2022, 10, e14407. [Google Scholar] [CrossRef] [PubMed]
  52. Losi, V.; Grassi, E.; Balsamo, M.; Rocchi, M.; Gaozza, L.; Semprucci, F. Changes in Taxonomic Structure and Functional Traits of Nematodes as Tools in the Assessment of Port Impact. Estuar. Coast. Shelf Sci. 2021, 260, 107524. [Google Scholar] [CrossRef]
  53. de Arruda-Santos, R.H.; Schettini, C.A.F.; Yogui, G.T.; Maciel, D.C.; Zanardi-Lamardo, E. Sources and Distribution of Aromatic Hydrocarbons in a Tropical Marine Protected Area Estuary under Influence of Sugarcane Cultivation. Sci. Total Environ. 2018, 624, 935–944. [Google Scholar] [CrossRef] [PubMed]
  54. Stogiannidis, E.; Laane, R. Source Characterization of Polycyclic Aromatic Hydrocarbons by Using Their Molecular Indices: An Overview of Possibilities. Rev. Environ. Contam. Toxicol. 2015, 234, 49–133. [Google Scholar] [PubMed]
  55. Coull, B.C. Role of Meiofauna in Estuarine Soft-bottom Habitats. Aust. J. Ecol. 1999, 24, 327–343. [Google Scholar] [CrossRef]
  56. de Skowronski, R.S.; Corbisier, T.N. Meiofauna Distribution in Martel Inlet, King George Island (Antarctica): Sediment Features versus Food Availability. Polar Biol. 2002, 25, 126–134. [Google Scholar] [CrossRef]
  57. Randall, D.J.; Tsui, T.K.N. Ammonia Toxicity in Fish. Mar. Pollut. Bull. 2002, 45, 17–23. [Google Scholar] [CrossRef] [PubMed]
  58. Shailaja, M.S.; Narvekar, P.V.; Alagarsamy, R.; Naqvi, S.W.A. Nitrogen Transformations as Inferred from the Activities of Key Enzymes in the Arabian Sea Oxygen Minimum Zone. Deep Sea Res. Part I Oceanogr. Res. Pap. 2006, 53, 960–970. [Google Scholar] [CrossRef]
  59. Nixon, S. Marine Eutrophication: A Growing International Problem. Ambio 1990, 19, 101. [Google Scholar]
  60. Shailaja, M.S.; Rodrigues, A. Nitrite-Induced Enhancement of Toxicity of Phenanthrene in Fish and Its Implications for Coastal Waters. Estuar. Coast. Shelf Sci. 2003, 56, 1107–1110. [Google Scholar] [CrossRef]
  61. Lenihan, H.S. Benthic Marine Pollution around McMurdo Station, Antarctica: A Summary of Findings. Mar. Pollut. Bull. 1992, 25, 318–323. [Google Scholar] [CrossRef]
  62. Lenihan, H.S.; Oliver, J.S. Anthropogenic and Natural Disturbances to Marine Benthic Communities in Antarctica. Ecol. Appl. 1995, 5, 311–326. [Google Scholar]
  63. Stark, J.S.; Smith, J.; King, C.K.; Lindsay, M.; Stark, S.; Palmer, A.S.; Snape, I.; Bridgen, P.; Riddle, M. Physical, Chemical, Biological and Ecotoxicological Properties of Wastewater Discharged from Davis Station, Antarctica. Cold Reg. Sci. Technol. 2015, 113, 52–62. [Google Scholar] [CrossRef]
  64. Majer, A.P.; Petti, M.A.V.; Corbisier, T.N.; Ribeiro, A.P.; Theophilo, C.Y.S.; de Lima Ferreira, P.A.; Figueira, R.C.L. Bioaccumulation of Potentially Toxic Trace Elements in Benthic Organisms of Admiralty Bay (King George Island, Antarctica). Mar. Pollut. Bull. 2014, 79, 321–325. [Google Scholar] [CrossRef] [PubMed]
  65. Kucuksezgin, F.; Kontas, A.; Altay, O.; Uluturhan, E.; Darılmaz, E. Assessment of Marine Pollution in Izmir Bay: Nutrient, Heavy Metal and Total Hydrocarbon Concentrations. Environ. Int. 2006, 32, 41–51. [Google Scholar] [CrossRef] [PubMed]
  66. Bryan, G.W.; Langston, W.J. Bioavailability, Accumulation and Effects of Heavy Metals in Sediments with Special Reference to United Kingdom Estuaries: A Review. Environ. Pollut. 1992, 76, 89–131. [Google Scholar] [CrossRef]
  67. Lenihan, H.S.; Peterson, C.H.; Kim, S.L.; Conlan, K.E.; Fairey, R.; McDonald, C.; Grabowski, J.H.; Oliver, J.S. Variation in Marine Benthic Community Composition Allows Discrimination of Multiple Stressors. Mar. Ecol. Prog. Ser. 2003, 261, 63–73. [Google Scholar] [CrossRef]
  68. Okereafor, U.; Makhatha, M.; Mekuto, L.; Uche-Okereafor, N.; Sebola, T.; Mavumengwana, V. Toxic Metal Implications on Agricultural Soils, Plants, Animals, Aquatic Life and Human Health. Int. J. Environ. Res. Public Health 2020, 17, 2204. [Google Scholar] [CrossRef]
  69. Sfiligoj, B. Sensitivity of Antarctic Marine Invertebrates and Microalgae to Metal Exposure. Doctoral Dissertation, Deakin University, Geelong, VIC, Australia, 2013. [Google Scholar]
  70. Kefford, B.J.; King, C.K.; Wasley, J.; Riddle, M.J.; Nugegoda, D. Sensitivity of a Large and Representative Sample of Antarctic Marine Invertebrates to Metals. Environ. Toxicol. Chem. 2019, 38, 1560–1568. [Google Scholar] [CrossRef]
  71. Royer, A.; Sharman, T. Copper Toxicity. In StatPearls; StatPearls Publishing: Treasure Island, FL, USA, 2020. [Google Scholar]
  72. Malhotra, N.; Ger, T.-R.; Uapipatanakul, B.; Huang, J.-C.; Chen, K.H.-C.; Hsiao, C.-D. Review of Copper and Copper Nanoparticle Toxicity in Fish. Nanomaterials 2020, 10, 1126. [Google Scholar] [CrossRef] [PubMed]
  73. Nahrgang, J.; Brooks, S.J.; Evenset, A.; Camus, L.; Jonsson, M.; Smith, T.J.; Lukina, J.; Frantzen, M.; Giarratano, E.; Renaud, P.E. Seasonal Variation in Biomarkers in Blue Mussel (Mytilus Edulis), Icelandic Scallop (Chlamys Islandica) and Atlantic Cod (Gadus Morhua)—Implications for Environmental Monitoring in the Barents Sea. Aquat. Toxicol. 2013, 127, 21–35. [Google Scholar] [CrossRef]
  74. Ren, X.; Pan, L.; Wang, L. The Detoxification Process, Bioaccumulation and Damage Effect in Juvenile White Shrimp Litopenaeus Vannamei Exposed to Chrysene. Ecotoxicol. Environ. Saf. 2015, 114, 44–51. [Google Scholar] [CrossRef]
  75. Alves, R.N.; Mariz Junior, C.F.; de Paulo, D.V.; Carvalho, P.S.M. Toxicity of Effluents from Gasoline Stations Oil-Water Separators to Early Life Stages of Zebrafish Danio Rerio. Chemosphere 2017, 178, 224–230. [Google Scholar] [CrossRef]
  76. Stark, J.S.; Mohammad, M.; McMinn, A.; Ingels, J. The Effects of Hydrocarbons on Meiofauna in Marine Sediments in Antarctica. J. Exp. Mar. Bio. Ecol. 2017, 496, 56–73. [Google Scholar] [CrossRef]
  77. Stark, J.S. Patterns of Higher Taxon Colonisation and Development in Sessile Marine Benthic Assemblages at Casey Station, Antarctica, and Their Use in Environmental Monitoring. Mar. Ecol. Prog. Ser. 2008, 365, 77–89. [Google Scholar] [CrossRef]
  78. Wild, S.; McLagan, D.; Schlabach, M.; Bossi, R.; Hawker, D.; Cropp, R.; King, C.K.; Stark, J.S.; Mondon, J.; Nash, S.B. An Antarctic Research Station as a Source of Brominated and Perfluorinated Persistent Organic Pollutants to the Local Environment. Environ. Sci. Technol. 2015, 49, 103–112. [Google Scholar] [CrossRef] [PubMed]
  79. Coull, B.C.; Chandler, G.T. Pollution and Meiofauna: Field, Laboratory, and Mesocosm Studies. Oceanogr. Mar. Biol. 1992, 30, 191–271. [Google Scholar]
  80. Fair, P.A.; Houde, M. Environmental Endocrine-Disrupting Chemicals and Their Effects in Marine Mammals. In Environmental Contaminants and Endocrine Health; Elsevier: Amsterdam, The Netherlands, 2023; pp. 283–306. [Google Scholar]
  81. Vonderheide, A.P.; Mueller, K.E.; Meija, J.; Welsh, G.L. Polybrominated Diphenyl Ethers: Causes for Concern and Knowledge Gaps Regarding Environmental Distribution, Fate and Toxicity. Sci. Total Environ. 2008, 400, 425–436. [Google Scholar] [CrossRef]
  82. Covaci, A.; Harrad, S.; Abdallah, M.A.-E.; Ali, N.; Law, R.J.; Herzke, D.; de Wit, C.A. Novel Brominated Flame Retardants: A Review of Their Analysis, Environmental Fate and Behaviour. Environ. Int. 2011, 37, 532–556. [Google Scholar] [CrossRef]
  83. Hale, R.C.; Kim, S.L.; Harvey, E.; La Guardia, M.J.; Mainor, T.M.; Bush, E.O.; Jacobs, E.M. Antarctic Research Bases: Local Sources of Polybrominated Diphenyl Ether (PBDE) Flame Retardants. Environ. Sci. Technol. 2008, 42, 1452–1457. [Google Scholar] [CrossRef]
  84. Dauvin, J.-C. Evolution à Long Terme (1978–1986) Des Populations d’Amphipodes Des Sables Fins de La Pierre Noire (Baie de Morlaix, Manche Occidentale) Aprss La Catastrophe de l’Amoco Cadiz. Mar. Environ. Res 1987, 21, 247–273. [Google Scholar] [CrossRef]
  85. Dauvin, J.-C. The Fine Sand Abra Alba Community of the Bay of Morlaix Twenty Years after the Amoco Cadiz Oil Spill. Mar. Pollut. Bull. Great Br. 1998, 36, 669–676. [Google Scholar] [CrossRef]
  86. Ruiz, F.; Abad, M.; Bodergat, A.-M.; Carbonel, P.; Rodríguez-Lázaro, J.; Yasuhara, M. Marine and Brackish-Water Ostracods as Sentinels of Anthropogenic Impacts. Earth Sci. Rev. 2005, 72, 89–111. [Google Scholar] [CrossRef]
  87. Amorri, J.; Veit-Köhler, G.; Boufahja, F.; Abd-Elkader, O.H.; Plavan, G.; Mahmoudi, E.; Aïssa, P. Assessing Metallic Pollution Using Taxonomic Diversity of Offshore Meiobenthic Copepods. Sustainability 2022, 14, 15670. [Google Scholar] [CrossRef]
  88. Corbisier, T.N.; Bícego, M.C.; Bromberg, S.; Dalto, A.G.; Figueira, R.C.L.; Gheller, P.F.; de Castro Martins, C.; Montone, R.C.; Nakayama, C.R.; Pellizari, V.H.; et al. Influence of Sediment Quality on the Benthic Communities of Admiralty Bay, King George Island, Antarctica. Annu. Act. Rep. 2014, 8, 109–113. [Google Scholar] [CrossRef]
  89. Nipper, M.; Scott Carr, R. Recent Advances in the Use of Meiofaunal Polychaetes for Ecotoxicological Assessments. Hydrobiologia 2003, 496, 347–353. [Google Scholar] [CrossRef]
  90. Brinke, M.; Ristau, K.; Bergtold, M.; Höss, S.; Claus, E.; Heininger, P.; Traunspurger, W. Using Meiofauna to Assess Pollutants in Freshwater Sediments: A Microcosm Study with Cadmium. Environ. Toxicol. Chem. 2011, 30, 427–438. [Google Scholar] [CrossRef]
  91. Louati, H.; Said, O.B.; Soltani, A.; Got, P.; Mahmoudi, E.; Cravo-Laureau, C.; Duran, R.; Aissa, P.; Pringault, O. The Roles of Biological Interactions and Pollutant Contamination in Shaping Microbial Benthic Community Structure. Chemosphere 2013, 93, 2535–2546. [Google Scholar] [CrossRef]
  92. Dauvin, J.-C.; Andrade, H.; de-la-Ossa-Carretero, J.A.; Del-Pilar-Ruso, Y.; Riera, R. Polychaete/Amphipod Ratios: An Approach to Validating Simple Benthic Indicators. Ecol. Indic. 2016, 63, 89–99. [Google Scholar] [CrossRef]
  93. Whomersley, P.; Huxham, M.; Schratzberger, M.; Bolam, S. Differential Response of Meio- and Macrofauna to in Situ Burial. J. Mar. Biol. Assoc. 2009, 89, 1091–1098. [Google Scholar] [CrossRef]
  94. Sen Gupta, B.K.; Yanko, V.; Arnold, A.J.; Parker, W.C. Effects of Marine Pollution on Benthic Foraminifera. Mod. Foraminifera 2003, 13, 217–235. [Google Scholar]
  95. Pertama, S.; Kedua, P.; Akhir, P. Water Quality Study Based on Meiofauna Abundance and Pollution Index in The Coastal Zone of Losari Beach, Makassar. J. Ilmu Lingkung 2019, 17, 172–180. [Google Scholar]
  96. Lynn, D.H. Ciliophora. eLS 2001. [Google Scholar] [CrossRef]
  97. Evans, K.M.; Gill, R.A.; Robotham, P.W.J. The PAH and Organic Content of Sediment Particle Size Fractions. Water Air Soil Pollut. 1990, 51, 13–31. [Google Scholar] [CrossRef]
  98. Fraschetti, S.; Gambi, C.; Giangrande, A.; Musco, L.; Terlizzi, A.; Danovaro, R. Structural and Functional Response of Meiofauna Rocky Assemblages to Sewage Pollution. Mar. Pollut. Bull. 2006, 52, 540–548. [Google Scholar] [CrossRef] [PubMed]
  99. Corinaldesi, C.; Canensi, S.; Carugati, L.; Martire, M.L.; Marcellini, F.; Nepote, E.; Sabbatini, S.; Danovaro, R. Organic Enrichment Can Increase the Impact of Microplastics on Meiofaunal Assemblages in Tropical Beach Systems. Environ. Pollut. 2022, 292, 118415. [Google Scholar] [CrossRef] [PubMed]
  100. Damasio, B.V.; Timoszczuk, C.T.; Kim, B.S.M.; de Mello e Sousa, S.H.; Bícego, M.C.; Siegle, E.; Figueira, R.C.L. Impacts of Hydrodynamics and Pollutants on Foraminiferal Fauna Distribution in the Santos Estuary (SE Brazil). J. Sediment. Environ. 2020, 5, 61–86. [Google Scholar] [CrossRef]
  101. Janakiraman, A.; Naveed, M.S.; Sheriff, M.A.; Altaff, K. Ecological Restoration Assessment of Adyar Creek and Estuary Using Meiofaunal Communities as Ecological Indicators for Aquatic Pollution. Reg. Stud. Mar. Sci. 2017, 9, 135–144. [Google Scholar] [CrossRef]
  102. Ingels, J.; Kiriakoulakis, K.; Wolff, G.A.; Vanreusel, A. Nematode Diversity and Its Relation to the Quantity and Quality of Sedimentary Organic Matter in the Deep Nazaré Canyon, Western Iberian Margin. Deep Sea Res. Part I Oceanogr. Res. Pap. 2009, 56, 1521–1539. [Google Scholar] [CrossRef]
  103. Pusceddu, A.; Fraschetti, S.; Mirto, S.; Holmer, M.; Danovaro, R. Effects of Intensive Mariculture on Sediment Biochemistry. Ecol. Appl. 2007, 17, 1366–1378. [Google Scholar] [CrossRef] [PubMed]
  104. Semprucci, F.; Balsamo, M.; Sandulli, R. Assessment of the Ecological Quality (EcoQ) of the Venice Lagoon Using the Structure and Biodiversity of the Meiofaunal Assemblages. Ecol. Indic. 2016, 67, 451–457. [Google Scholar] [CrossRef]
Figure 1. Map of sampling sites around Casey Station, East Antarctica. Red circles (Diversity 16 00464 i001) represent sampling points in impacted locations belonging to Newcomb Bay, green circles (Diversity 16 00464 i002) in non-impacted locations belonging to O’Brien Bay, and yellow circles (Diversity 16 00464 i003) in non-impacted locations belonging to Newcomb Bay. The approximate location of Casey Station is indicated by the “star” symbol.
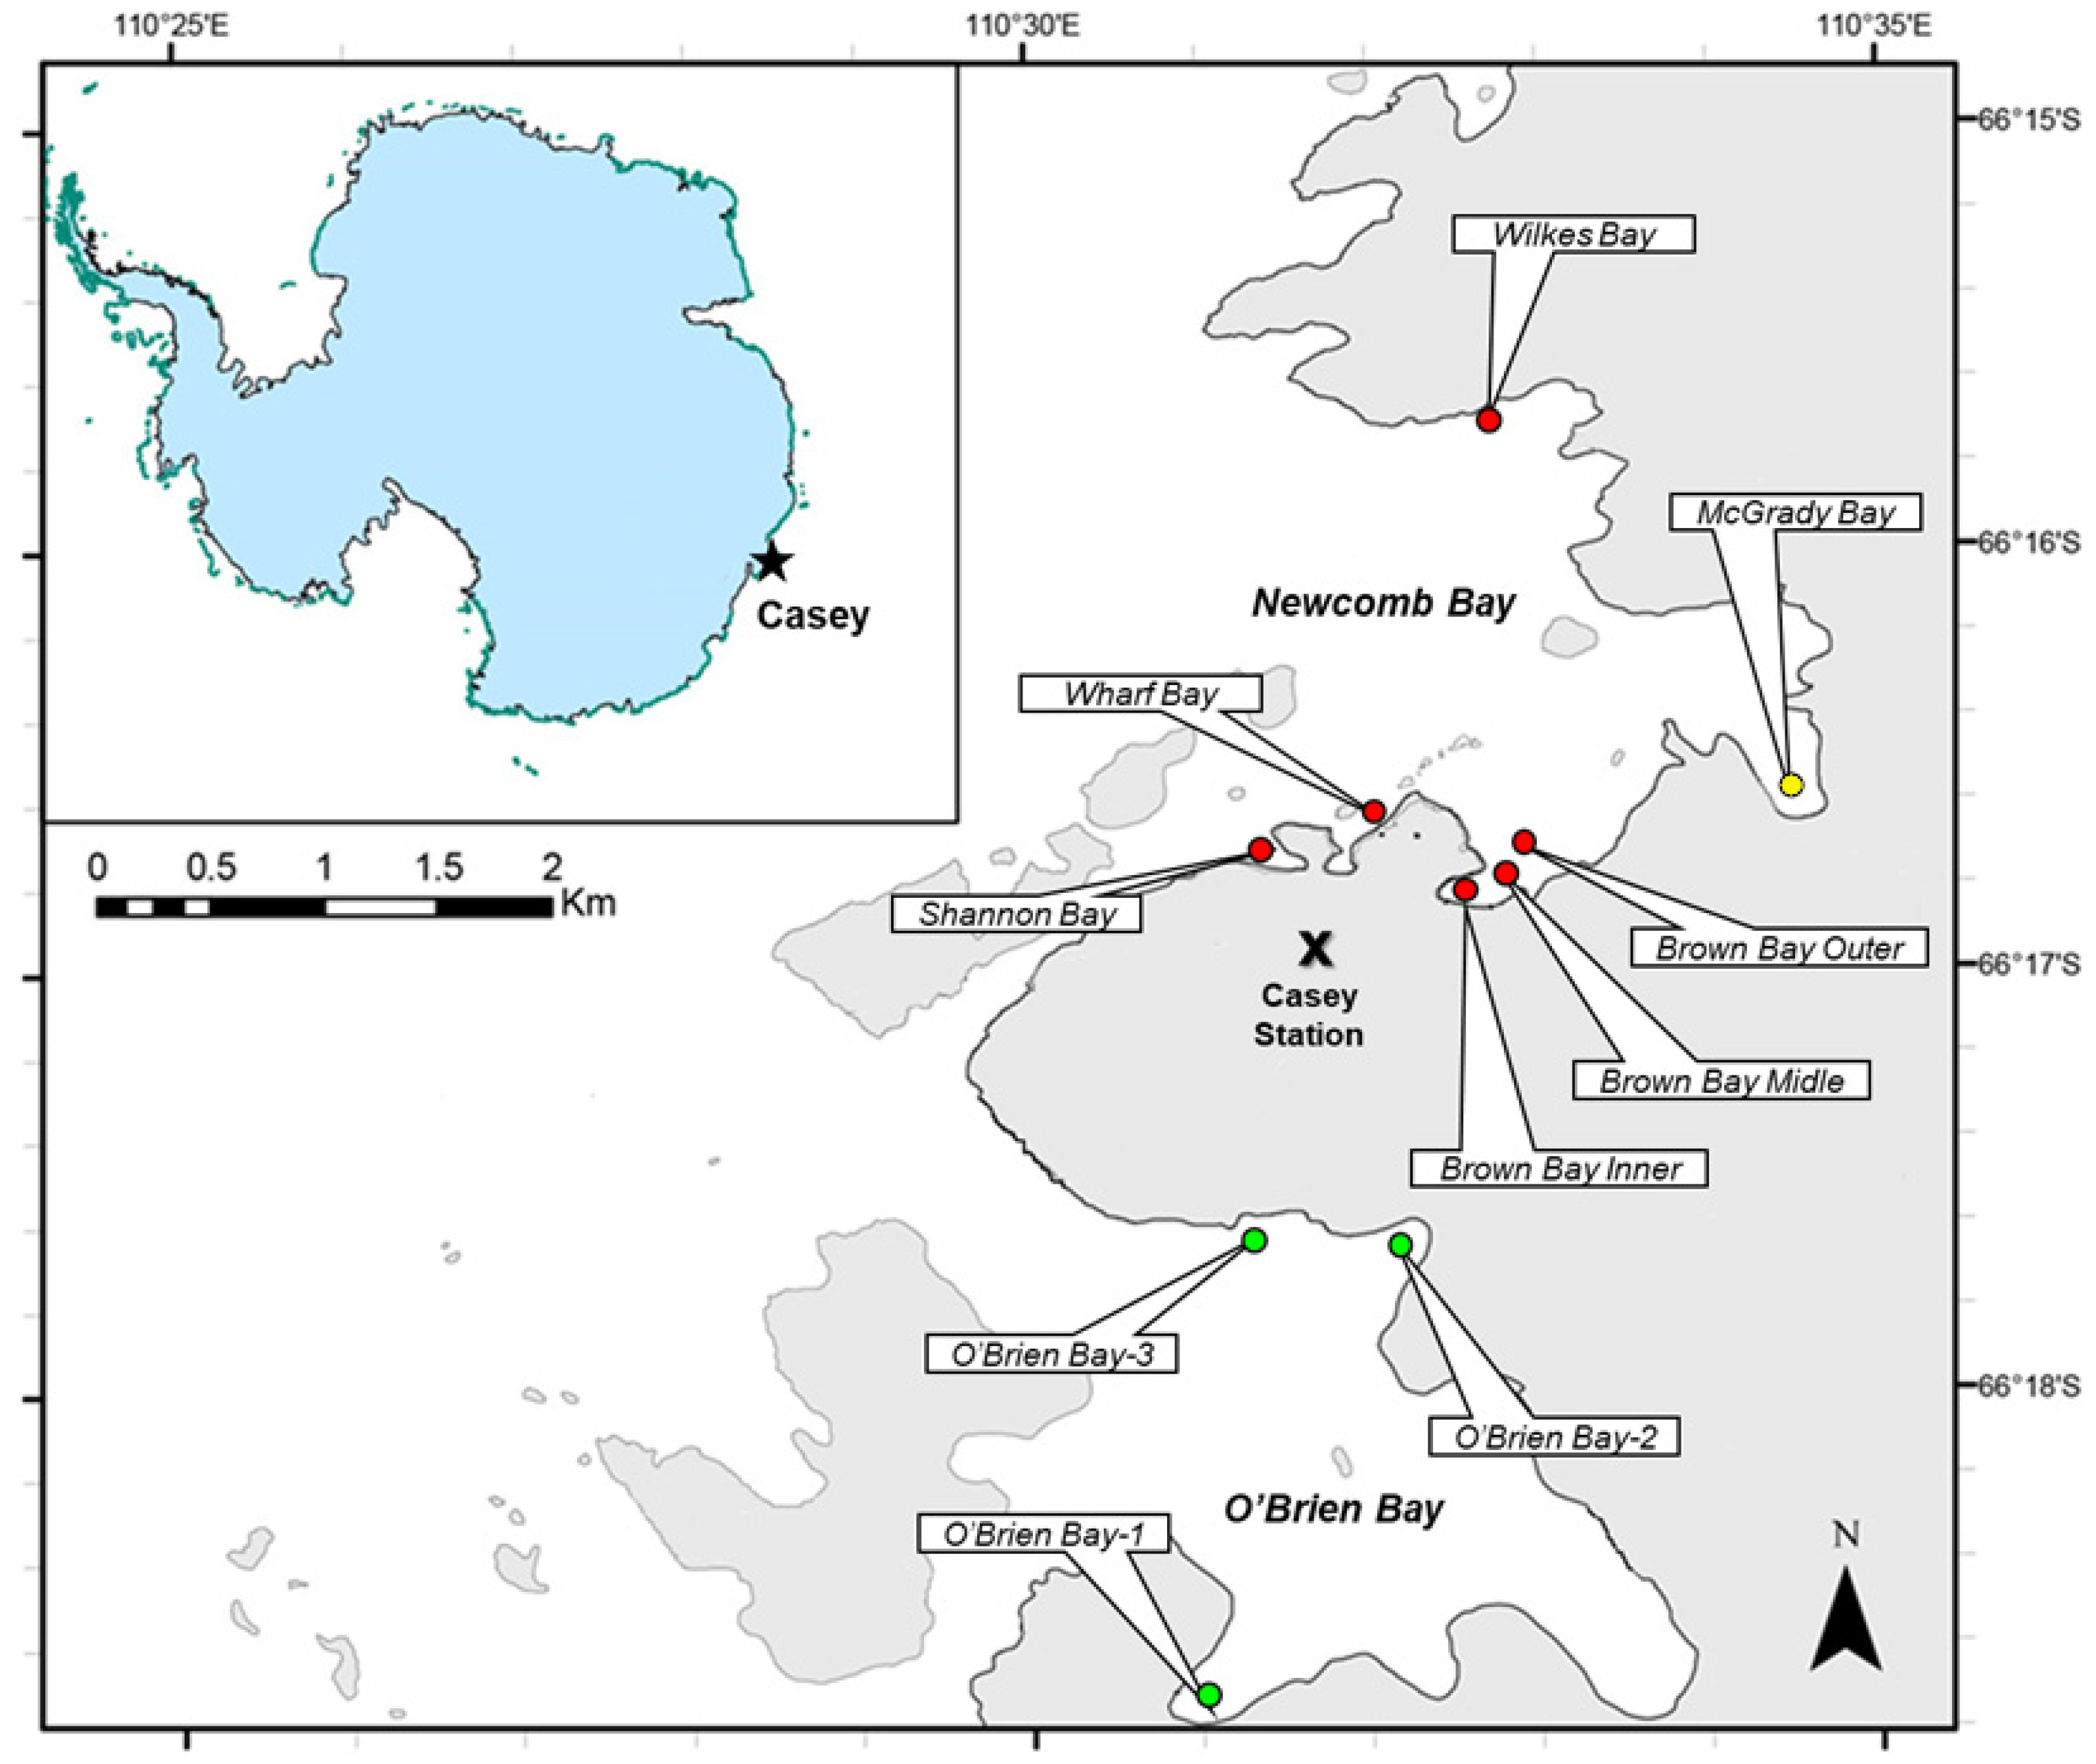
Diversity 16 00464 g001
Figure 2. Richness (A), density (B), Shannon–Wiener index (C), evenness index (D) and Hill’s index (E) of meiofauna recorded at each location (OB1, OB2, OB3, McGrady, Wharf, Wilkes, BBIN, BBMID, BBOUT, and Shannon). The solid horizontal line indicates the median and the dotted horizontal line indicates the mean. Boxes represent upper/lower quartiles. The vertical lines extending from each box represent the minimum and maximum value. The colors indicate the impacts in relation to locations, where red (Diversity 16 00464 i004) are impacted locations, belonging to Newcomb Bay, yellow (Diversity 16 00464 i006) is the reference location belonging to Newcomb Bay, and green (Diversity 16 00464 i005) are reference locations belonging to O’Brien Bay. Circle-shaped symbols () indicate outliers.
Diversity 16 00464 g002
Figure 3. Proportion of the average composition of ciliophores and most abundant meiofauna taxa (A) and relative abundance (%) of the least abundant (<1%) meiofauna taxa (B) found at each location (OB1, OB2, OB3, McGrady, Wharf, Wilkes, BBIN, BBMID, BBOUT, and Shannon). The colors in locations indicate the impacts in relation to locations, where “light red” are impacted locations, belonging to Newcomb Bay, “light yellow” is the reference location belonging to Newcomb Bay, and “light green” are reference locations belonging to O’Brien Bay.
Diversity 16 00464 g003
Figure 4. Non-metric multidimensional scaling (nMDS) based on the density of meiofauna groups (transformed to the 4th root, using Bray–Curtis), with their vector (strength and direction of the variable’s effect on the ordination graph) at the locations (OB1, OB2, OB3, McGrady, Wharf, Wilkes, BBIN, BBMID, BBOUT, and Shannon). The colors indicate the disturbance, where red () are impacted locations, belonging to Newcomb Bay, yellow () is the reference location belonging to Newcomb Bay, and green () are reference locations belonging to O Bay ‘Brien.
Diversity 16 00464 g004
Figure 5. Density of ciliophores and most abundant meiofauna groups recorded at each location (OB1, OB2, OB3, McGrady, Wharf, Wilkes, BBIN, BBMID, BBOUT, and Shannon). The solid horizontal line indicates the median and the dotted horizontal line indicates the mean. Boxes represent upper/lower quartiles. The vertical lines extending from each box represent the minimum and maximum value. The colors indicate the disturbance, where red (Diversity 16 00464 i004) are impacted locations, belonging to Newcomb Bay, yellow (Diversity 16 00464 i006) is the reference location belonging to Newcomb Bay, and green (Diversity 16 00464 i005) are reference locations belonging to O’Brien Bay. The vertical lines extending from each box represent the minimum and maximum value. Star-shaped symbols () indicate outliers. (A) Ciliophora, (B) Copepoda, (C) Nauplii, (D) Nematoda, (E) Turbellaria, and (F) others taxa.
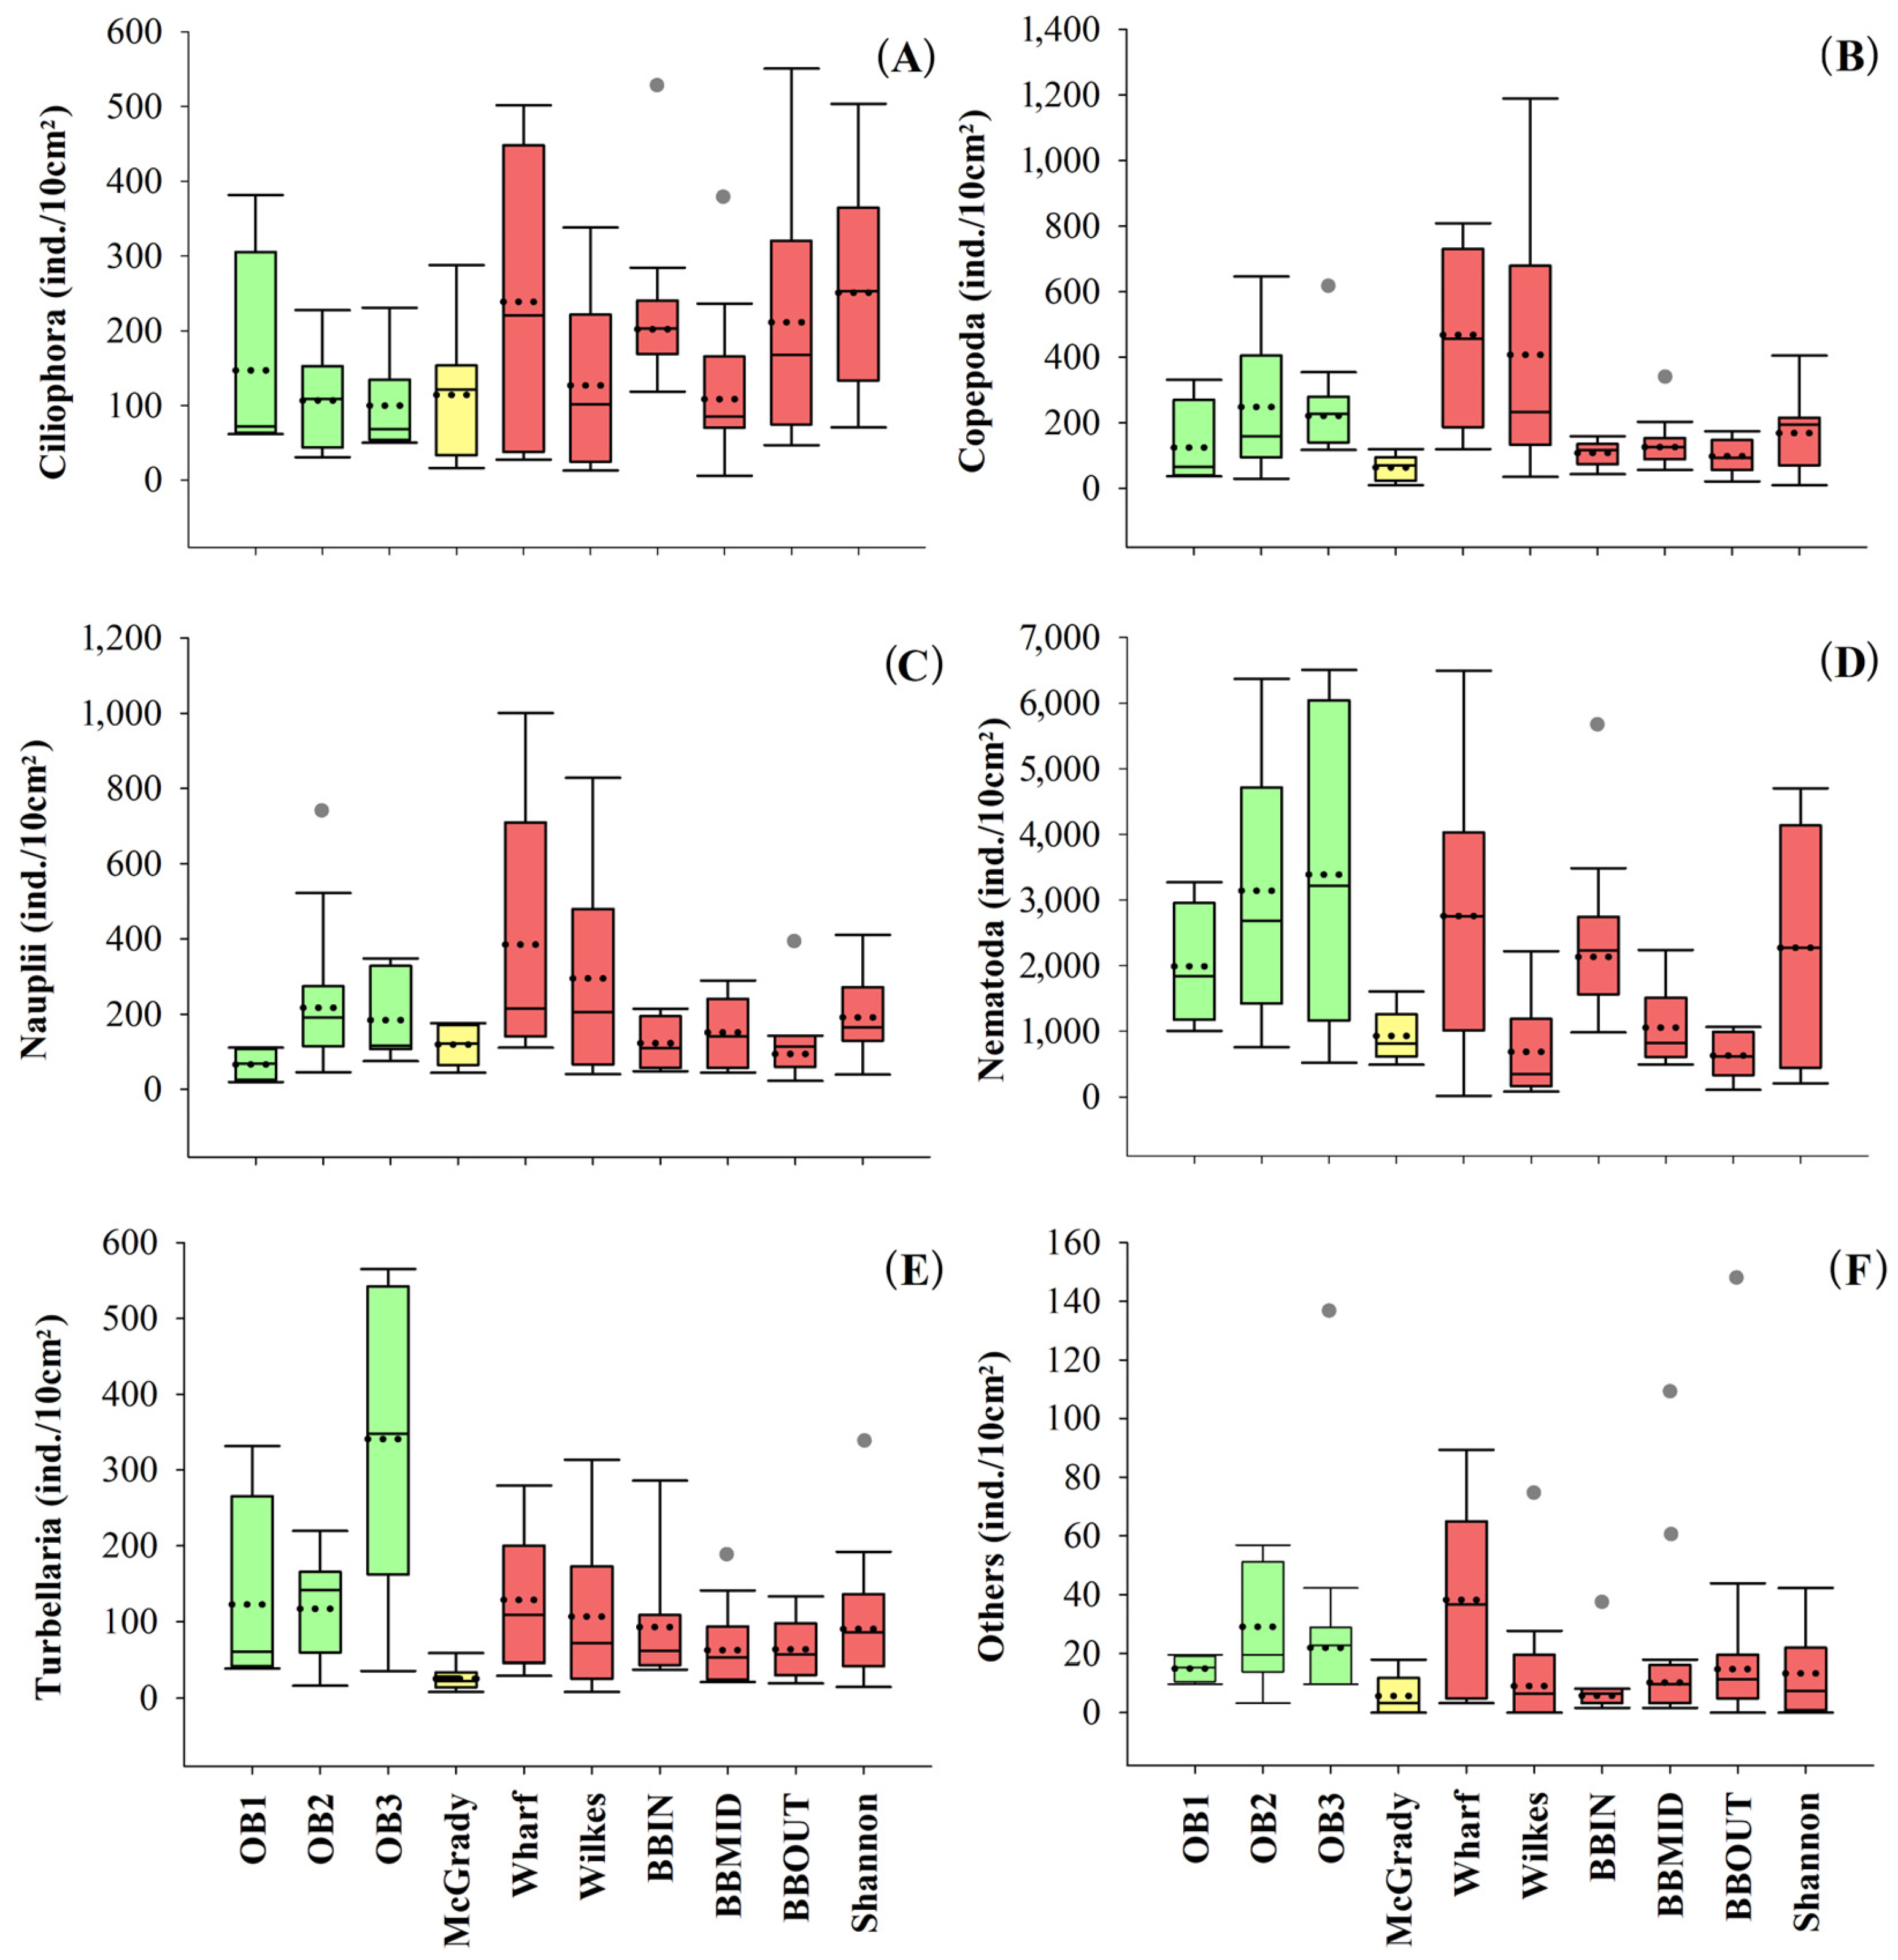
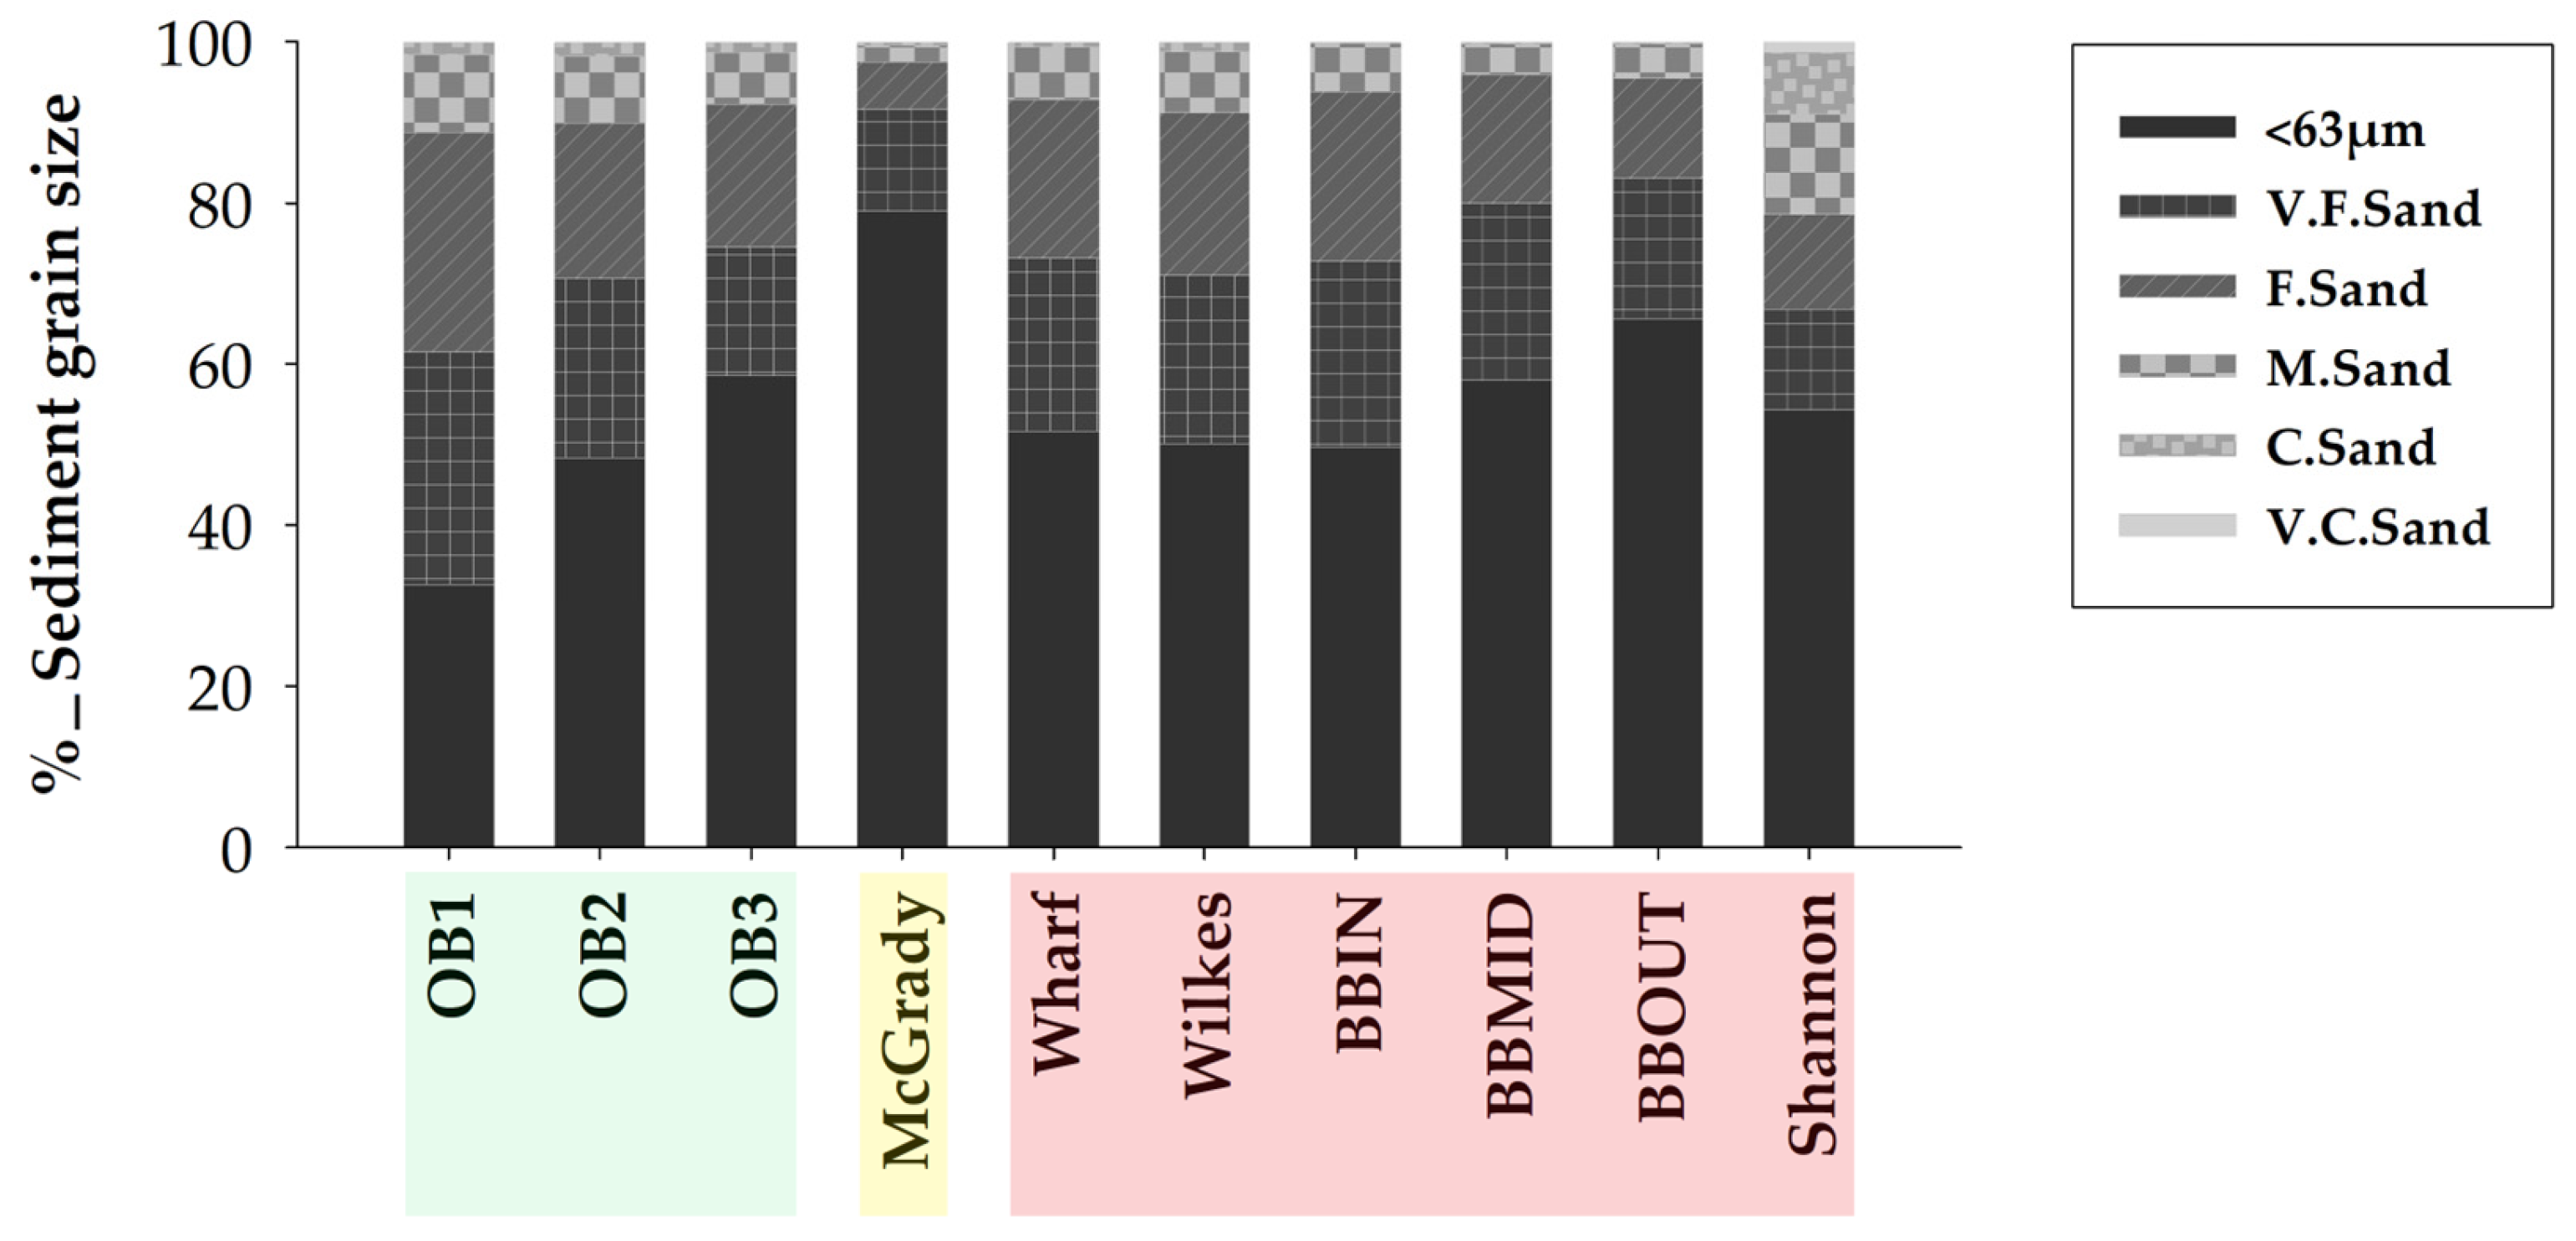
Diversity 16 00464 g005
Figure 6. Proportion of average composition of sediment grain sizes found at each location (OB1, OB2, OB3, McGrady, Wharf, Wilkes, BBIN, BBMID, BBOUT, and Shannon). The colors in locations indicate the impacts in relation to locations, where “light red” are impacted locations, belonging to Newcomb Bay, “light yellow” is the reference location belonging to Newcomb Bay, and “light green” are reference locations belonging to O’Brien Bay.
Diversity 16 00464 g006
Figure 7. (A) PCA ordination of combined environmental variables; (B) PCA ordination of sediment grain size variables; (C) PCA ordination of metal concentrations in sediment. Vector plots indicate the direction and size of the correlation between PC axes and variables) at the 10 locations (OB1, OB2, OB3, McGrady, Wharf, Wilkes, BBIN, BBMID, BBOUT and Shannon). The colors indicate the disturbance, where red () are impacted locations, belonging to Newcomb Bay, yellow () is the reference location belonging to Newcomb Bay, and green () are reference locations belonging to O’Brien Bay.
Diversity 16 00464 g007
Figure 8. Correlation between the meiofauna community and the total environmental variable group (DistLM) with their vectors (strength and direction of the effect of the variable on the ordination chart) at the 10 locations (OB1, OB2, OB3, McGrady, Wharf, Wilkes, BBIN, BBMID, BBOUT, and Shannon). The colors indicate the disturbance, where red () are impacted locations, belonging to Newcomb Bay, yellow () is the reference location belonging to Newcomb Bay, and green () are reference locations belonging to O’Brien Bay.
Diversity 16 00464 g008
Table 1. Mean values (±SE) of richness of the locations (OB1, OB2, OB3, McGrady, Wharf, Wilkes, BBIN, BBMID, BBOUT, and Shannon) and the state of environmental quality (EcoQ) corresponding to the richness of each location.
LocationMed. (±SE)EcoQ
OB18.00 ± 0.40Moderate
OB27.11 ± 0.42Poor
OB38.28 ± 0.52Moderate
McGrady6.50 ± 0.56Poor
Wharf7.62 ± 0.37Poor
Wilkes6.50 ± 0.50Poor
BBIN6.75 ± 0.36Poor
BBMID6.72 ± 0.27Poor
BBOUT7.37 ± 0.53Poor
Shannon6.25 ± 0.35Poor
Table 2. Comparison between the meiofauna community in the locations, using the results of the PERMANOVA analysis. The analysis factor was the area (location). p (perm) values < 0.05 are in bold. The “df” indicates the degrees of freedom, “MS” the means square, and “res” the residual. The (*) indicates contrast analysis.
Meiofauna Structure
SourcePERMANOVA Results
dfMSPseudo-Fp (perm)
Bay11183.102.370.50
Location [Bay]8511.772.27<0.01
Site [Location [Bay]]12217.470.990.51
Plot [Site [Location [Bay]]]21218.781.300.07
Residual40167.99
Total82
SourcePERMANOVA Results
dfMSPseudo-Fp (perm)
Location9586.363.07<0.01
 O’Brien vs. McGrady *11358.907.33<0.01
 O’Brien vs. Wharf *1517.462.350.03
 O’Brien vs. Wilkes *1984.404.40<0.01
 O’Brien vs. BBIN *1494.362.960.01
 O’Brien vs. BBMID *1658.113.75<0.01
 O’Brien vs. BBOUT *11011.104.93<0.01
O’Brien vs. Shannon *1573.252.760.02
 Reference locations vs. Wharf *1698.492.910.01
 Reference locations vs. Wilkes *1745.503.070.01
 Reference locations vs. BBIN *1362.821.820.10
 Reference locations vs. BBMID *1344.141.690.14
 Reference locations vs. BBOUT *1631.752.760.02
 Reference locations vs. Shannon *1332.511.450.19
Residual73190.73
Total82
Disclaimer/Publisher’s Note: The statements, opinions and data contained in all publications are solely those of the individual author(s) and contributor(s) and not of MDPI and/or the editor(s). MDPI and/or the editor(s) disclaim responsibility for any injury to people or property resulting from any ideas, methods, instructions or products referred to in the content.