Abstract
Urban sprawl leads to the degradation of aquatic environments and, consequently, to the destruction of biodiversity. With the aim of highlighting the distribution profile of benthic macroinvertebrates in the city of Yaoundé and its surroundings according to the level of degradation, this study was carried out in seven rivers. A total of 144 taxa of benthic macroinvertebrates, belonging to 74 families, 15 orders, five classes, and three phyla, were collected from seven rivers in urban, peri-urban, and forest environments on Yaoundé and its surroundings. The self-organizing map (SOM) analysis tool was used to group the collected taxa from all stations into three clusters or affinity cores. The indicator value analysis (IndVal) method was employed to determine, based on their ecological preferences, which organisms were most likely to belong to each group. Out of the 144 collected taxa, only 44 were indicated to represent the three different groups. Thus, three communities were defined: the Hydropsyche community, with Hydropsyche sp. as the predominant taxon in Group III, characterizing well-oxygenated and low-mineralized stations; the Hydrocyrius community, where the species Hydrocyrius sp. predominates in Group I, describing stations with low oxygenation and moderate mineralization; and the Lumbriculidae community, where Lumbriculidae is the taxon associated with environments with high mineralization and critical oxygenation. These two methods contribute to the biomonitoring of tropical aquatic environments, firstly by grouping organisms by affinity and then identifying those that reflect the environment conditions. This facilitates the detection of changes in the quality of hydrosystems and guides management and conservation efforts.
1. Introduction
Benthic macroinvertebrates, crucial components of the food chain, are key organisms in monitoring aquatic ecosystems due to their rapid response to environmental disturbances and their relatively sedentary nature [1]. They encompass a significant diversity of taxonomic groups, several of which are characterized by their known tolerance levels, simplifying data analysis. Their broad taxonomic diversity also allows them to offer a wide range of responses, making them effective in detecting various forms of pollution and degradation in rivers [1,2]. In aquatic systems, they inhabit a variety of microhabitats, and their diversity increases in areas that provide necessary resources for their development [3]. Given their presence in all types of environments, no biodiversity monitoring program can be considered credible if invertebrates are not taken into account [4]. Changes within the benthic macroinvertebrate community can occur due to habitat alteration, environmental conditions, and seasonality [5,6]. Understanding them allows for a concrete assessment of pollution impacts as well as alterations to aquatic and riparian habitats. Additionally, knowledge of the ecological preferences of each group and species of aquatic macroinvertebrates encountered is necessary for the implementation of biomonitoring tools [7]. For ecological monitoring, it is important to know the spatial scales at which stress factors act [8]. In recent years, water pollution in cities has increased due to rapid urbanization [9]. Furthermore, anthropogenic activities coupled with urbanization have negative effects on the diversity and structure of benthic macroinvertebrate populations. All these changes affect the physical and chemical characteristics of rivers, leading to ecological disruptions, resulting in a decrease in biodiversity and degradation of the ecosystem services provided by rivers [10,11].
Yaoundé, the political capital of Cameroon, with an estimated population size of nearly 4 million inhabitants [12], is experiencing rapid urban sprawl, rendering surrounding rivers vulnerable. It becomes imperative to measure the impact of this demographic growth on the biodiversity of Yaoundé’s hydrological systems and its surroundings. This study was conducted to assess, the distribution profile of benthic macroinvertebrates along the gradientof anthropogenic using SOM and IndVal analysis tools. The selection of these methodologies was based on their robustness and the quality of the results obtained. They were chosen because they enable the benthic macroinvertebrates collected to be organized into groups with similar sensitivities to environmental conditions and the identification of indicator species in each group that respond to these specific environmental conditions. In this study, three hypotheses are formulated. First, samples from similar habitats will form the same group. Second, the identified indicator species will have high indicator values for specific environmental conditions.
Finally, the combination of self-organizing maps (SOMs) and indicator species value (IndVal) analyses will enable the identification of distinct ecological communities and the characterization of the obtained groups based on the indicator species.
2. Materials and Methods
2.1. Study Area
This study was conducted in the Central Region of Cameroon, at geographic coordinates 4°45′0″ North latitude and 12°0′0″ East longitude. Specifically, it was carried out in three departments: the Mfoundi subdivision, with its capital, Yaoundé, representing the urban area; the Mefou and Akono department, with Ngoumou as its capital, representing the forest zone; and the Mefou and Afamba department, with Mfou as its capital, representing the peri-urban area. In the urban area represented by the city of Yaoundé, the political capital and headquarters of the country’s institutions, sampling sites were selected based on accessibility, water column depth, and proximity to pollution sources. In the peri-urban area, sites were chosen based on proximity to agricultural activities, and in the forest zone, based on accessibility. The study area is characterized by an equatorial climate of the Guinean type with four seasons, an average temperature of around 23 °C [13], ferrallitic soils, and intertropical vegetation with a predominance of southern humid forest.
Sixteen sampling sites were selected across seven rivers (Figure 1): three on the Mekongo river in the forest area with minimal anthropogenic impacts(MB1, MB2, MB3), where the substrates on the different stations were sandy, muddy, and rocky, respectively, and three on the Meki river in the peri-urban area downstream of pineapple crops and a washing area for local populations (MK1, MK2, MK3). In these areas, the substrate was essentially muddy. Ten sites were selected in urban areas. These included two sites on the Mfoundi river (MF1 and MF2); two on the Ako’o river (AK1 and AK2), receiving industrial and domestic effluents; two on the Biyémé river (BI1 and BI2); two on the Abiergue river (AB1 and AB2); and two on the Ebogo river (EB1 and EB2) which primarily receive domestic waste (both solid and liquid). In the urban areas, the substrate was mainly muddy.
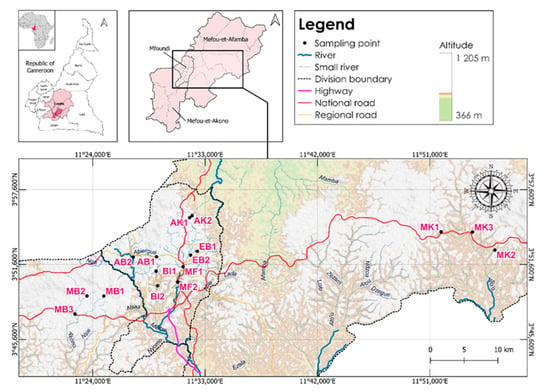
Figure 1.
Map of the study site and locations of different streams.
2.2. Methods
2.2.1. Measurement of Environmental Parameters
Physico-chemical analyses were carried out both in the field and in the laboratory following the recommendations of [14,15]. For the laboratory analyses, water samples were taken at each survey and at each sampling site using 250 mL and 1000 mL double-capped polyethylene bottles. In the field, electrical conductivity, dissolved solids (TDS), pH (hydrogen potential), and temperature were measured using HANNA HI 98130 multiparameter sensors(Hanna instrument LTD, Eden way, Leighton Buzzard, Bedforshire LU74AD, England), and oxygen was measured using a HANNA HI 9147 oximeter. In the laboratory, parameters such as alkalinity, suspended solids (SS), turbidity, orthophosphate, and the various forms of nitrogen (NO2 and NO3) were measured colorimetrically using the Hydro Test HT 1000 spectrophotometer.
2.2.2. Sampling Benthic Macroinvertebrates
Benthic macroinvertebrates were collected on a monthly basis at intervals from April 2022 to December 2022, with a kick-net measuring 30 cm on each side, which was fitted with a conical net with a mesh opening of 400 μm and a depth of 50 cm. Sampling was carried out using the multihabitat approach [16]. At each site, about twenty dip-net hauls were made over an area of about 3 m2 in the various microhabitats. The load retained by the net was transferred to a white cloth, where the organisms were collected using a pair of fine tweezers and then placed in pillboxes containing 10% formalin.
In the laboratory, the benthic macroinvertebrate samples were rinsed with tap water to remove the formalin. The organisms collected at each site were preserved in pillboxes containing 70° alcohol, then identified and counted under a WILD M3B binocular magnifier using the identification keys and guides of [17,18,19,20,21].
2.2.3. Data Analysis
The collected data were analyzed using the self-organizing map (SOM) and indicator value (IndVal) methods. The self-organizing map method, introduced by [22], was employed for the biotypology of various stations, grouping them based on their taxonomic affinity. The SOM (self-organizing map) is a hybrid technique that combines ordination (representation on maps) and classification (grouping of individuals). It groups similar sets according to the data provided. The input matrix contains the fauna variables (xij) for each sampling station (sj). Once the SOM has determined the connection weights (pij) as a minimum learning error, the map and the output layer, called “nodes”, are obtained. This SOM analysis was conducted using Matlab software 6.1. The composition of each group obtained from the SOM analysis was analyzed using benthic macroinvertebrate indices and metrics. Species richness (S) was calculated as the number of taxa belonging to each group. Abundance (N) was the total number of benthic macroinvertebrates in each group. EPT was the total number of taxa in Ephemeroptera, Plecoptera, and Trichoptera. After a log transformation onPAST 4.03, the different groups were compared using an ANOVA test. In addition, the measured water quality parameters were compared using a Kruskal–Wallis test.
The diversity of organisms obtained from the SOM groups was assessed using Shannon’s and Weiner’s diversity indices, Simpson’s index, and Piélou’s evenness index.
Shannon and Weaver’s indices allowed for the evaluation of the taxonomic diversity of benthic macroinvertebrate communities according to the following formula:
where P = proportional abundance or percentage of importance of species i:
p = ni/Ni
S = total number of species; ni = number of individuals of species i in the sample; N = total number of individuals of all species in the sample.
The value of the index may be considered to vary from 0, which represents a single species or a dominant species in the context of others, to log2S, which is indicative of the presence of several species in the environment. Simpson’s index quantifies the dominance of a species (approaching 0) or the co-dominance of multiple species (approaching 1), and is calculated by the formula:
Piélou’s evenness index was developed to reflect the relative abundance of each taxon and obtained using the formula:
- H’ = Shannon and Weiner’s index;
- S = species richness;
- J = Piélou’s index.
When J is approximately equal to 1, the stand is approximately equidistributed. Conversely, when J is approximately equal to 0, a single species dominates the stand.
All these indices were computed using the statistical analysis software PAST 4.03.
The indicator value method proposed by [23] assigns an indicative value to each taxon. Its formula is:
where Aij = average number of individuals of specie i present in group j, and
IndVal ij = A ij × B ij × 100
Bij = number of records of species i in group j.
The IndVal measure is calculated by combining two indices: fidelity (A), which represents the proportion of sites in a given group where the species is present, and specificity (B), which is the proportion of individuals of a species occurring in a group of sites compared to the total in all sites. The resulting value ranges from 0 to 100, with 0 representing the absence of the species and 100 representing the highest level of association. The IndVal measure is calculated as a proportion, with the following values representing the degree of association between a species and a site group: 0, indicating that the species is not present in the group; 1–25, indicating a weak association; 26–50, indicating a moderate association; 51–75, indicating a strong association; and 76–100, indicating a very strong association.
This index was computed using R software version 4.3.2.
In brief, the SOM (self-organizing map) or Kohonen’s self-organizing [22] map was used to organize species or taxa into affinity groups. This helped us to understand how groups of organisms were structured according to environmental parameters [24]. The indicator value (IndVal) method, developed in [23], was used for its ability to define indicator species for different groups based on a classification of aquatic sites.
3. Results
3.1. Benthic Macroinvertebrates
A total of 144 benthic macroinvertebrate taxa were recorded across all 16 sampling sites. Among these, 117 were identified to the genus/species level and 25 tothe family level. The benthic macroinvertebrates were classified into three phyla: arthropods, annelids, and molluscs. Furthermore, they were grouped into five classes: insects, crustaceans, oligochaetes, achaetes, and gastropods, as well as 15 orders and 74 families. Arthropods were the most diverse group, with two classes, nine orders, and 58 families. Annelids were the next most diverse group, comprising two classes, two orders, and nine families. Molluscs were the least diverse group, consisting of one class, two orders, and seven families (Table S1).
3.1.1. Self-Organizing Maps (SOM)
The SOM based on the benthic macroinvertebrate abundance matrix was used to classify the 144 samples (16 sites × 9 surveys). Based on the minimum values of the quantification and topography errors, a self-organizing Kohonen map of 42 cells (6 rows × 7 columns) was used to project the samples.
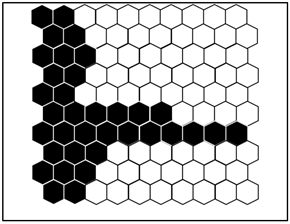
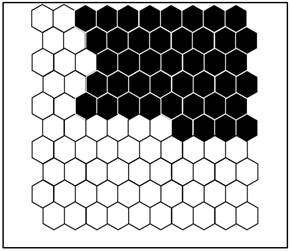
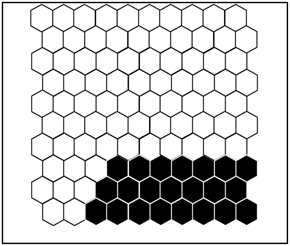
Figure 2 shows the distribution probability profile of each benthic macroinvertebrate taxon identified in the groups defined by the SOM. A summary of the different groups is given in Table 1.
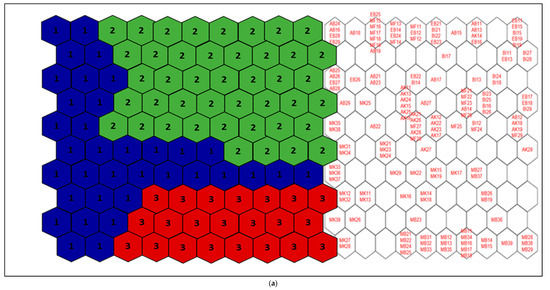
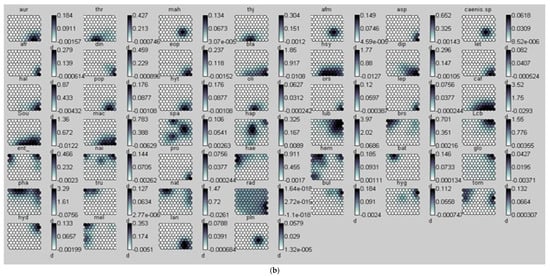
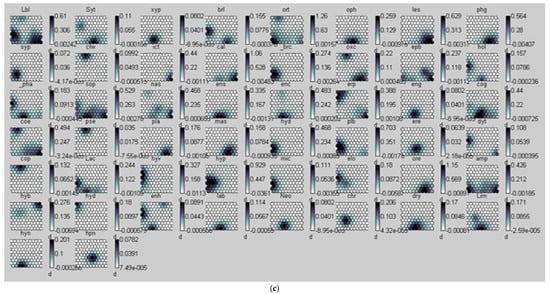
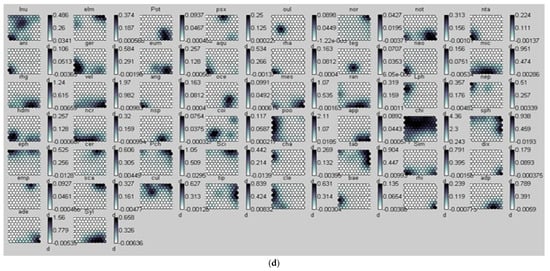
Figure 2.
(a) Distribution of samples on the SOM map and the different groups formed from the benthic macroinvertebrate abundance matrix. 1 = Group I, 2 = Group II, and 3 = Group III. The acronyms in the hexagonal units represent samples (station code and month). (b) aur = Auriculata sp., thr = Thraulus sp., mah = Maheathraulus sp., thj = Thalersphyrus josettae, afm = Afronurus matitensis, asp = Afronurus sp., caenis.sp = Caenis sp., afr = Afrocaenis sp., din = Dinocras sp., eop = Eoperla sp., bla, Blaberidae, hsy = Hydropsyche sp., dip = Diplectrona sp., let = Leptocerus sp., hal = Halesus sp., pop = Polycentropus sp., hyt = Hypothyacophila sp., oli = Oligotrichia striata, ors = Orthotrichia sp., lep = Lepidostoma sp., caf = Caridina africana, Sou = Soudanautes sp., mac = Macrobrachium niloticus, spa = Sparganoplilidae, hap = Haplotaxidae, lub = Lumbriculidae, brs = Branchiura sowerbyi, Lcb = Lumbricidae, ent = Enchytraeidae, nai = Naididae, pro = Proppapidae, hae = Haementeria costata, hem = Hemiclepsis marginata, bat = Batracobdella sp., glo = Glossiphonia sp., pha = Physa acuta, tru = Lymnaea truncatula, nat = Lymnaea natalensis, bul = Bulinidae, Hyg = Hygrobiidae, tom = Tomichia sp., hyd = Hydrobia sp., mel = Melonoides sp., lan = Lanites sp., pln = Planorbidae. (c) Lbl = Libellula sp., Syt = Sympetrum sp., Xyp = Xyzomma petiolatum, brl = Brachythemis lacustris, ort = Orthetrum sp., Oph = Ophiogomphus sp., les = Lestinogomphus angus, phg = Phyllogomphus brunneus, chv = Chalcolestes viridis, ict = Ictinogomphus sp., cal = Calopteryx sp., brc = Brachythemis leucostica, oxc = Oxygastra curtisil, epb = Epitheca bimaculata, hol = Hemicordulia olympica, pha = Phyllomacromia picta, sop = Somatochlora pro parte, nas = Nehalennia speciosa, ens = Enallagma spermatum, enc = Enallagma cyathigerum, erp = Erythromma pro parte, eng = Enallagma glaucum, cog = Cordulegaster sp., coe = Coenagrion sp., pse = Pseudagrion pla = Platycnemididae, mas = Macromiia splendens, hyd = Hydatiscus sp., plb = Platambus sp., ere = Eretes sp., Dyt = Dytiscus sp., Lac = Laccophilus sp., hyv = Hydrovatus sp., hyp = Hydrocyphon sp., mic = Microcara sp., elo = Elodes sp., ore = Orectochilus sp., amp = Amphiops sp., hyb = Hydrobius sp., hyd = Hydrochara sp., enh = Enochrus sp., lab = Laccobius sp., Neo = Neohydrophilus sp., chr = Chrysomelidae, dry = Drops sp., Lim = Limnebius sp., hyn = Hydraena sp., hpn = Hydraenopsis sp., (d) Distribution of samples in the SOM based on benthic macroinvertebrate presence–absence data at the different sampling stations and distribution profile of benthic macroinvertebrate taxa in the different groups. The scale bars indicate the weight vector of each taxon (i.e., the abundance of the taxon) in the corresponding SOM units. Dark bars represent a high abundance of taxa, while light bars indicate a low abundance of taxa. lnu = Limnius sp., elm = Elmis sp., Pot = Potamophilus sp., psx = Pseudancyronyx sp., oul = Oulimnius sp., not = Noterus sp., nta = Notonecta sp., ani = Anisops sp., ger = Gerris sp., eum = Eurymetra sp., aqu = Aquarius sp., rha = Rhagotarsis sp., teg = Tenagogonus sp., neo = Neogerris sp., mic = Microvelia sp., rhg = Rhagovelia sp., vel = Velia sp., ang = Angelia sp., oce = Ocelovelia sp., mes = Mesovelia sp., ran = Ranatra sp., Lph = Laccotrephes sp., nep = Nepa sp., hdm = Hydrometra sp., ncr = Naucoris sp., nsp = Neomacrocoris sp., coi = Corixa sp., poo = Hydrocyrius sp., app = Appasus sp., chi = Chironomus sp., syh = Syrphidae, eph = Ephydridae, cer = Ceratopogonidae, Pch = Psychodidae, Sci = Sciomyzidae, cha = Chaoboridae, tab = Tabanidae, Sim = Simuliidae, dix = Dixidae, sca = Scatophagidae, cul = Culex sp., tip = Tipulidae, cle = Cloeon sp., bae = Baetis sp., rhi = Rhitrocloeon sp., adp = Adenophlebia sp., ade = adenophlebiodes sp., Syl = Sylvatica sp.

Table 1.
Distribution of organisms in the different groups defined by the SOM.
According to this assembly, stations MK1, MK2, MK3, and AB2 belonged to group I; stations EB1, EB2, AK1, AK2, MF1, MF2, BI1, BI2, and AB1 belonged to group II; and stations MB1, MB2, and MB3 belonged to group III.
3.1.2. Abundance, Species Richness, and Diversity Indices in the Different Groups
The diversity metrics were higher in groups I and III and lower in group II (Table 2). However, the ANOVA test did not reveal significant differences between the groups (p > 0.05).

Table 2.
Biocenotic indices for the different SOM groups.
3.2. Physico-Chemistry
The average values and standard deviations for the various physico-chemical parameters are shown in Table 3. According to the classifications established by the SOM, high values of TDS, conductivity, suspended solids, orthophosphate, and ammonium were found in group II, while high dissolved oxygen levels were found in group III. This breakdown shows significant differences in water quality between the different groups (p < 0.05).

Table 3.
Averages and standard deviations of the various physico-chemical parameters measured at the different sampling sites.
3.3. Indicator Taxa Using the IndVal Method and Habitat Characteristics
The IndVal analysis allowed us to distinguish, out of the 144 collected taxa, 44 indicators for the different groups and 11 indicators for the combination of groups (I and II, then I and III) defined by the SOM. The combination of groups (I and II) showed that the taxa Chironomus sp. represented the best, and even the sole, indicator, with an IndVal value of 0.962 (Table 4). The combination of groups (II and III) revealed 10 indicator taxa, with IndVal values ranging from 0.316 to 0.491.

Table 4.
Combination of species belonging simultaneously to different groups, where A = fidelity and B = specificity.
For group I (Table 5), eight (08) taxa were indicators, with the best taxon being Hydrocyrius sp., with an IndVal value of 0.796. Group II presented 03 indicator taxa, with IndVal values of 0.83 and 0.81, respectively, for Lumbriculidae and Physa acuta. In group III, 33 indicator taxa were identified, including Hydropsyche sp. (0.998); Caridina africana, with an IndVal value of 0.965; Velia sp. (0.900); Soudanautes sp. (0.866); Blaberidae (0.829); Rhagovelia sp. (0.764); Microvelia sp. (0.705); Orectochilus sp. (0.697); Macrobrachium niloticus (0.695); Ranatra sp. (0.617); Calopteryx sp (0.613); Mesovelia sp. (0.548); Phyllogomphus brunneus (0.548); Adenophlebia sp. (0.548); Sylvatica sp. (0.548); and Naucoris sp. (0.504).

Table 5.
Species and group characteristics.
This approach highlighted three (03) communities—the Hydrocyrius community, the Lumbriculidae community, and the Hydropsyche community—based on taxa with the highest IndVal values.
4. Discussion
Neural networks have been implemented in various aspects of ecological modeling, such as group classification, habitat suitability modeling, and water quality assessment [25]. The SOM is relevant to the organization of biological communities according to environmental variables. In this study, the analysis of population structure through SOM reveals the distribution of sampled organisms in three groups acrosssampling sites on several metrics, including species richness and organism abundance. This approach was also used in [26,27], where it enabled the researchers to obtain four groups of mollusc assemblages in the Sô river in Benin and three clusters in the Umbrian stream system in Italy. Groups I and III consisted of sites with average abundance and high species diversity, while Group II comprised sites with high abundance but low diversity. The low taxonomic diversity of Group II could be attributed to activities along the watersheds, leading to pollution and subsequently reducing taxonomic richness and organism distribution [28,29]. These results are similar to those obtained in [30] in the cotton basin in Benin, where the distribution of macroinvertebrates formed two communities: a community of groups with low specific richness and a community of groups with high specific richness. Anthropogenic stresses homogenize urban sites and promote the development of the most resistant taxa [31]. Thus, Group I consisted of pollutant-tolerant and resistant taxa, while Group II included pollutant-resistant and saprophilic taxa such as Chironomus sp., Syrphidae, Psychodidae, Physa acuta, Glossiphonia sp., and Lumbriculidae. Group III comprised pollutant-sensitive taxa, predominantly EPT, which are indicators of good ecological quality in aquatic systems. According to [32], sensitive species decrease as water quality deteriorates. These observations align with those obtain by [33], which demonstrated that species distribution within different groups correlates with disturbance gradients. Additionally, ref. [34] asserts that low EPT index values indicate susceptibility to disturbances. The presence of saprophilic taxa in Group II may be explained by high concentrations of orthophosphates, ammonium, and electrical conductivity, which indicate of organic pollution. Diversity indices are higher in Group III, indicating habitat stability and even distribution of taxa within the group. Benthic macroinvertebrate communities can be linked to human activities that affect water quality. SOM analysis can therefore be used to relate these communities, located at different sites in groups, to the environmental parameters that shape their distribution. These observations are similar to those of [26,35], who showed the distribution of benthic macroinvertebrates according to spatio-temporal changes in environmental conditions.
The IndVal method highlights indicator species for the different groups defined by SOM. Out of 144 recorded taxa, 44 were indicators of the three groups, with 19 having IndVal values exceeding 0.5. This underscores the importance of these species as indicators of the ecosystem due to their fidelity and sensitivity. Ref. [36] demonstrated that studying the relationship between a taxa and a site or group of sites is only complete if, after calculating indicator values, the species is significant, i.e., it prefers the environmental conditions of that habitat. Each site with specific ecological conditions allows organisms that adapt to them thrive. For instance, Hydrocyrius sp. (Belostomatidae), with an IndVal value of 0.796, is the taxon in Group I that is associated with the habitat of moderate mineralization, moderate organic pollution, and low oxygenation. The entire community comprises pollutant-resistant organisms. Lumbriculidae (0.83) and Physa acuta (Physidae) (0.717) are indicator taxa of Group II due to their affinity for habitats with high organic pollution, high mineralization, and deficient oxygenation. These characteristics define them as pollutant-tolerant indicators. These taxa are found in urban stations receiving various types of discharge from anthropogenic activities. Ref. [37] stated that anthropogenic activities disrupt benthic communities and species distribution. similar observations on the presence of Physa acuta in urban streams were made by [35] in the urban streams of the city of Douala, where the dominance of this species isattributed to its ability to assimilate atmospheris air via vascularized mantle cavity. Taxa such as Hydropsyche sp., Caridina africana, Velia sp., Soudanaute sp. (0.866), Blaberidae, Rhagovelia sp., Microvelia sp., Orectochilus sp., Macrobrachium niloticus, Ranatra sp., Calopteryx sp., Mesovelia sp., Phylogomphus brunneus, Adenophlebia sp., and Sylvatica sp. belong to Group III, in which sites have well-oxygenated conditions, low mineralization, and low organic pollution, qualifying them as pollutant-sensitive indicators. Following this analysis, three communities with different profiles and habitat conditions can be defined based on the level of anthropogenic impact received by the area and the statistically characteristic taxon of the group. These results are similar to the work of [38,39], which used the same approach to determine the type of beetle associated with every kind of pond in Rhône-Alpes according to the formed groups and the most common indicator species in forest streams in the Mabounié watershed in Gabon. IndVal provides insights into habitat conditions by highlighting taxa that are not generalists, but specialized or associated with specific habitat conditions. The illustration of the different taxa based on the indicator values reveals the taxa belonging to each type of habitat that may be pollutant-tolerant or pollutant-sensitive depending on the environmental characteristics that prevail in the sites to which they belong. These observations are also similar to those of [40], which were made in the Ouémé delta, where the illustration of taxa based on indicator values revealed the nature of the taxa at each station. Ultimately, anthropogenic activities and habitat attributes act as modelers of the types of taxa colonizing aquatic ecosystems. According to [41], habitat attributes are the primary factors influencing macroinvertebrate communities and their descriptors. This approach to pollution indicators is similar to the study cited in [42], which showed that stream topography and environmental parameters are the main factors responsible for community structure. This study serves as a basis for monitoring the health of aquatic environments. It will facilitate the identification of high-risk areas andrapid decision-making. By monitoring indicator species, ecosystem managers can assess environmental health and swiftly identify signs of degradation. Management of aquatic ecosystems should therefore adopt a conservation and restoration approach and apply measures that take account of the various bioindicators.
5. Conclusions
The SOM made it possible to reorganize the taxa and sites into three (03) groups or affinity nuclei, as well as, using the IndVal method, to establish a profile of the indicator taxa in each group according to the level of pollution present in the area. These results show that, depending on the level of pollution, a type of taxon can be determined that best suits the prevailing conditions in the environment. These two tools provide important biomonitoring elements for aquatic ecosystems and a better understanding of the distribution of taxa based on the level of degradation.
Supplementary Materials
The following supporting information can be downloaded at: https://www.mdpi.com/article/10.3390/d16070385/s1, Table S1: Phylum, class, orders, family, genera, species and abundance of benthic macroinvertebrate collected at the various stations during the study period.
Author Contributions
Conceptualization, S.F.M., M.A.T.Z. and B.T.A.; methodology, S.F.M., M.A.T.Z. and J.D.; software, M.A.T.Z., J.D and D.A.; validation, S.F.M. and B.T.A.; formal analysis, M.A.T.Z. and J.D.; investigation, M.A.T.Z., N.C.W.B., M.N., N.L.L., B.F.N., L.Y.T., H., D.l.N.M. and G.U.T. resources, M.A.T.Z., S.F.M. and B.T.A.; data curation, M.A.T.Z., N.L.L., S.G.N. and J.D.; writing—original draft preparation, M.A.T.Z., J.D., N.C.W.B., B.E.B.à.N., B.R.M. and D.A.; writing—review and editing, M.A.T.Z., visualization, M.A.T.Z. and J.D.; supervision, S.F.M. and B.T.A.; project administration, B.T.A.; funding acquisition, M.A.T.Z. All authors have read and agreed to the published version of the manuscript.
Funding
This Research was founded by World bank, IDA: 6512-TG and 5360-TG.
Institutional Review Board Statement
Not applicable.
Data Availability Statement
The original contributions presented in the study are included in the article and Supplementary Material, further inquiries can be directed to the corresponding author.
Acknowledgments
We would like to thank the Regional Centre of Excellence on Sustainable Cities of Africa (CERViDA-DOUNEDON), the Association of African Universities (AAU), and the World Bank for providing the necessary funding that facilitated our research work, leading to these results.
Conflicts of Interest
The authors declare no conflicts of interest.
References
- Camargo, J.A.; Alonso, A.; De La Puente, M. Multimetric Assessment of Nutrient Enrichment in Impounded Rivers Based on Benthic Macroinvertebrates. Environ. Monit. Assess. 2004, 96, 233–249. [Google Scholar] [CrossRef] [PubMed]
- Chessman, B.C. Rapid assessment of rivers using macroinvertebrates: A procedure based on habitat-specific sampling, family level identification and a biotic index. Aust. J. Ecol. 1995, 20, 122–129. [Google Scholar] [CrossRef]
- Andersen, A.N.; Fisher, A.; Hoffmann, B.D.; Read, J.L.; Richards, R. Use of terrestrial invertebrates for biodiversity monitoring in Australian rangelands, with particular reference to ants. Austral Ecol. 2004, 29, 87–92. [Google Scholar] [CrossRef]
- Taylor, R.J.; Doran, N. Use of Terrestrial Invertebrates as Indicators of the Ecological Sustainability of Forest Management under the Montreal Process. J. Insect Conserv. 2001, 5, 221–231. [Google Scholar] [CrossRef]
- Di Veroli, A.; Selvaggi, R.; Pellegrino, R.M.; Goretti, E. Sediment toxicity and deformities of chironomid larvae in Lake Piediluco (Central Italy). Chemosphere 2010, 79, 33–39. [Google Scholar] [CrossRef] [PubMed]
- Al-Shami, S.A.; Salmah, M.R.C.; Abu Hassan, A.; Azizah, M.N.S. Evaluation of mentum deformities of Chironomus spp. (Chironomidae: Diptera) larvae using modified toxic score index (MTSI) to assess the environmental stress in Juru River Basin, Penang, Malaysia. Environ. Monit. Assess. 2011, 177, 233–244. [Google Scholar] [CrossRef] [PubMed]
- Moisan, J.; Pelletier, L.; Gagnon, E.; Piedboeuf, N.; La Violette, N.; Guide de Surveillance Biologique Basée sur les Macroinver-tébrés Benthiques d’eau Douce du Québec. Cours D’eau Peu Profonds À Substr. Grossier Dir. Suivi L’état L’environnement Ministère Dév. Durable L’Environnement Parcs. 2013. Available online: https://www.environnement.gouv.qc.ca/eau/eco_aqua/macroinvertebre/surveillance/benthiques.pdf (accessed on 1 May 2024).
- Feld, C.K. Response of three lotic assemblages to riparian and catchment-scale land use: Implications for designing catchment monitoring programmes. Freshw. Biol. 2013, 58, 715–729. [Google Scholar] [CrossRef]
- Sinche, F.; Cabrera, M.; Vaca, L.; Segura, E.; Carrera, P. Determination of the ecological water quality in the Orienco stream using benthic macroinvertebrates in the Northern Ecuadorian Amazon. Integr. Environ. Assess. Manag. 2022, 19, 615–625. [Google Scholar] [CrossRef] [PubMed]
- Stepenuck, K.F.; Crunkilton, R.L.; Wang, L. Impacts Of Urban Landuse On Macroinvertebrate Communities In Southeastern Wisconsin Streams. JAWRA J. Am. Water Resour. Assoc. 2002, 38, 1041–1051. [Google Scholar] [CrossRef]
- Zemo, M.A.T.; Menbohan, S.F.; Atchrimi, B.T.; Betsi, W.C.N.; Nwaha, M.; Dzavi, J.; Mavunda, C.A.; Lactio, N. Effect of Anthropogenic Pressure on the Biodiversity of Benthic Macroinvertebrates in Some Urban Rivers (Yaoundé). Water 2023, 15, 2383. [Google Scholar] [CrossRef]
- Ndam, S.; Touikoue, A.F.; Chenal, J.; Munyaka, J.-C.B.; Kemajou, A.; Kouomoun, A. Urban Governance of Household Waste and Sustainable Development in Sub-Saharan Africa: A Study from Yaoundé (Cameroon). Waste 2023, 1, 612–630. [Google Scholar] [CrossRef]
- Abossolo, S.A.; Amougou, J.A.; Tchindjang, M.; Mena, M.S.; Batha, R.A.S. Analyse des précipitations annuelles à la station de Yaoundé de 1895 à 2006. Afr. Sci. Rev. Int. Sci. Technol. 2015, 11, 183–194. [Google Scholar]
- American Public Health Association. Standard Methods for the Examination of Water and Wastewater; American Public Health As-sociation: Washington, DC, USA, 2012. [Google Scholar]
- Rodier, J.; Legube, B.; Merlet, N. L’analyse de l’eau, 10th ed.; Dunod: Paris, France, 2016. [Google Scholar]
- Stark, J.D.; Boothroyd, I.K.G.; Harding, J.S.; Maxted, J.R.; Scarsbrook, M.R. Protocols for Sampling Macroinvertebrates in Wadeable Streams. 2001. Available online: https://riversgroup.org.nz/wp-content/uploads/2018/06/4.1.3-macroinvertebrate-sampling.pdf (accessed on 1 May 2024).
- Et Day, J.A.; De Moor, I.J. Guides to the Freshwater Invertebrates of SOUTHERN AFRICA. Volume 6: Arachnida and Mollusca (Araneae, Water Mites and Mollusca); WRC Report No. TT 182; Water Research Commission: Pretoria, South Africa, 2002. [Google Scholar]
- Durand, J.R.; Lévêque, C. Flore et faune aquatiques de l’Afrique Sahelo-Soudanienne (Tome 1); Paris Fr. ORSTOM: Paris, France, 1980; pp. 1–390. [Google Scholar]
- de Moor, I. (Ed.) Guides to Freshwater Invertebrates of Southern Africa. 7: Insecta I: Ephemeroptera, Odonata & Plecoptera; In WRC Report, no. No. TT 207; Water Research Commission: Pretoria, South Africa, 2003. [Google Scholar]
- de Moor, I.; Stals, R. (Eds.) Guides to freshwater invertebrates of Southern Africa. 10: Coleoptera; In WRC Report, no. No. TT 320; Water Research Commission: Pretoria, South Africa, 2007. [Google Scholar]
- Tachet, H.; Richoux, P.; Bournaud, M.; Usseglio-Polatera, P. Invertébrés d’eau douce: Systématique, biologie, écologie; CNRS Éditions: Paris, France, 2010. [Google Scholar]
- Kohonen, T. Self-organized formation of topologically correct feature maps. Biol. Cybern. 1982, 43, 59–69. [Google Scholar] [CrossRef]
- Dufrêne, M.; Legendre, P. Species assemblages and indicator species: The need for a flexible asymmetrical approach. Ecol. Monogr. 1997, 67, 345–366. [Google Scholar] [CrossRef]
- Poff, N.L. Landscape Filters and Species Traits: Towards Mechanistic Understanding and Prediction in Stream Ecology. J. North Am. Benthol. Soc. 1997, 16, 391–409. [Google Scholar] [CrossRef]
- Kalteh, A.M.; Hjorth, P.; Berndtsson, R. Review of the self-organizing map (SOM) approach in water resources: Analysis, modelling and application. Environ. Model. Softw. 2008, 23, 835–845. [Google Scholar] [CrossRef]
- Pallottini, M.; Goretti, E.; Gaino, E.; Selvaggi, R.; Cappelletti, D.; Céréghino, R. Invertebrate diversity in relation to chemical pollution in an Umbrian stream system (Italy). Comptes Rendus Biol. 2015, 338, 511–520. [Google Scholar] [CrossRef]
- Koudenoukpo, Z.C.; Odountan, O.H.; Agboho, P.A.; Dalu, T.; Van Bocxlaer, B.; de Bistoven, L.J.; Chikou, A.; Backeljau, T. Using self–organizing maps and machine learning models to assess mollusc community structure in relation to physicochemical variables in a West Africa river–estuary system. Ecol. Indic. 2021, 126, 107706. [Google Scholar] [CrossRef]
- Pan, B.; Wang, Z.; Li, Z.; Yu, G.-A.; Xu, M.; Zhao, N.; Brierley, G. An exploratory analysis of benthic macroinvertebrates as indicators of the ecological status of the Upper Yellow and Yangtze Rivers. J. Geogr. Sci. 2013, 23, 871–882. [Google Scholar] [CrossRef]
- Samon, O.S.; Gouissi, F.M.; Adje, D.D.; Abahi, K.S.; Tchaou, C.M.; Okoya, J.G.A.; Piami, Z.O.; Gnohossou, M.P.; Omoniyi, G.; Piscart, C. Abundance and Distribution of Macroinvertebrates of the Affon River in Bénin. Open J. Mar. Sci. 2019, 09, 173–187. [Google Scholar] [CrossRef]
- Houelome, T.M.A.; Adandedjan, D.; Chikou, A.; Toko, I.I.; Bonou, C.; Youssao, I.; Laleye, P. Evaluation de la qualité des eaux des ruisseaux du cours moyen de la rivière Alibori par l’étude des macroinvertébrés benthiques dans le bassin cotonnier du Bénin (Afrique de l’Ouest). Int. J. Biol. Chem. Sci. 2017, 10, 2461. [Google Scholar] [CrossRef][Green Version]
- Robert, M. Les Macroinvertébrés Benthiques Littoraux: Bioindicateurs de la Qualité Écologique des Milieux Humides en Zone Urbaine. Master’s Thesis, Université De Montréal, Montréal, QC, USA, 2015. [Google Scholar]
- Elliott, J.M.; Hellawell, J.M. Biological Indicators of Freshwater Pollution and Environmental Management; Springer Science & Business Media: Berlin/Heidelberg, Germany, 2012. [Google Scholar] [CrossRef]
- Adandedjan, D.; Montcho, S.A.; Chikou, A.; Laleye, P.; Gourene, G. Caractérisation des peuplements de macroinvertébrés benthiques à l’aide de la carte auto-organisatrice (SOM). Comptes Rendus Biol. 2013, 336, 244–248. [Google Scholar] [CrossRef]
- Gutiérrez-Rial, D.; González, B.S.; Vázquez, D.G.; Méndez-Martínez, G.; Diego, M.P.; González, J.G. Freshwater biodiversity loss in urbanised rivers. Ecol. Indic. 2023, 156, 111150. [Google Scholar] [CrossRef]
- Tchakonté, S.; Ajeagah, G.A.; Diomandé, D.; Camara, A.I.; Ngassam, P. Diversity, dynamic and ecology of freshwater snails related to environmental factors in urban and suburban streams in Douala–Cameroon (Central Africa). Aquat. Ecol. 2014, 48, 379–395. [Google Scholar] [CrossRef]
- Cáceres, M.D.; Legendre, P. Associations between species and groups of sites: Indices and statistical inference. Ecology 2009, 90, 3566–3574. [Google Scholar] [CrossRef]
- Carvalho, S.; Barata, M.; Pereira, F.; Gaspar, M.B.; da Fonseca, L.C.; Pousão-Ferreira, P. Distribution patterns of macrobenthic species in relation to organic enrichment within aquaculture earthen ponds. Mar. Pollut. Bull. 2006, 52, 1573–1584. [Google Scholar] [CrossRef]
- Mboye, B.R.; Koumba, A.A.; Dzavi, J.; Tchinga, G.; Menbohan, S.F.; Mbega, J.D. Abondance, diversité et valeur indicatrice des macroinvertébrés benthiques des cours d’eau forestier du bassin versant de la Mabounié au Gabon. Afr. Sci. 2020, 17, 89–103. [Google Scholar]
- Saurat, R.; Gerbaud, A.; Bogey, R. Aquatic beetles communities in Rhône-Alpes according to ponds diversity—IndVal approach (text Fr Version). Bull. Mens. Soc. Linn. Lyon 2022, 91, 51–60. [Google Scholar]
- Zinsou, L.H.; Agadjihouedé, H.; Gnohossou, P.; Lalèyè, P. Analyse et illustration de La valeur indicatrice des espèces ma-crobenthiques du Delta De l’Ouémé au Bénin. Eur. Sci. J. 2017, 13, 333–351. [Google Scholar]
- Alcaraz-Hernández, J.D.; Sánchez-Hernández, J.; Muñoz-Mas, R.; Martínez-Capel, F. Drivers of Macroinvertebrate Communities in Mediterranean Rivers: A Mesohabitat Approach. Sustainability 2024, 16, 3075. [Google Scholar] [CrossRef]
- Molina, J.; Silberberger, M.J.; Kokarev, V.; Reiss, H. Environmental drivers of benthic community structure in a deep sub-arctic fjord system. Estuar. Coast. Shelf Sci. 2019, 225, 106239. [Google Scholar] [CrossRef]
Disclaimer/Publisher’s Note: The statements, opinions and data contained in all publications are solely those of the individual author(s) and contributor(s) and not of MDPI and/or the editor(s). MDPI and/or the editor(s) disclaim responsibility for any injury to people or property resulting from any ideas, methods, instructions or products referred to in the content. |
© 2024 by the authors. Licensee MDPI, Basel, Switzerland. This article is an open access article distributed under the terms and conditions of the Creative Commons Attribution (CC BY) license (https://creativecommons.org/licenses/by/4.0/).
