Article

Spatial, Temporal, and Interspecific Differences in Composition of Stable Isotopes in Fishes in Maryland Coastal Bays

NOAA Living Marine Resources Cooperative Science Center, and NSF CREST Center for the Integrated Study of Coastal Ecosystem Processes and Dynamics in the Mid-Atlantic Region, Department of Natural Science, University of Maryland Eastern Shore, Princess Anne, MD 21853, USA
*
Author to whom correspondence should be addressed.
Diversity 2024, 16(6), 331; https://doi.org/10.3390/d16060331
Submission received: 18 March 2024 / Revised: 23 May 2024 / Accepted: 27 May 2024 / Published: 4 June 2024
(This article belongs to the Special Issue Marine Ecosystem Functioning and Food Webs under Climate Change)

Abstract

:
Carbon (δ13C) and nitrogen (δ15N) isotopes were used to evaluate spatial, temporal, and interspecific differences in trophic relationships of four fish species (Paralichthys dentatus, Anchoa mitchilli, Leiostomus xanthurus, and Bairdiella chrysoura) in Maryland’s coastal bays. The δ13C values for all species were more enriched in 2017 than in 2018, a year of higher-than-average rainfall that likely caused higher amounts of terrestrial carbon to enter the estuary. There were significant differences among species in the δ13C values, with L. xanthurus being the least depleted (−17.2‰ in 2017; −18.8‰ in 2018). Spatially, the δ13C values of the species, particularly P. dentatus and B. chrysoura, were more depleted in the northern bays, which have a higher nutrient content and receive more freshwater inflow directly from tributaries, than the southern bays. The observed δ13C values (−19.5 ± 0.2‰ to –17.2 ± 0.3‰), however, indicate that marine phytoplankton was the primary carbon source of the fishes. Overall, A. mitchilli was the most enriched in δ15N (13.0‰), and L. xanthurus was the most depleted (10.2‰). δ15N was more enriched in fish from the more human-impacted northern bays than in fish from the southern bays, though this might also have stemmed from the differences in the diet composition of the species in the northern and southern bays. A. mitchilli had the highest trophic level, while L. xanthurus and P. dentatus had the lowest trophic levels. Niche breadth was widest in L. xanthurus compared to the other fish species, suggesting a higher variability in diets among L. xanthurus individuals, leading to specialized diets. There was a high niche overlap between B. chrysoura, A. mitchilli, and L. xanthurus, which indicates they fed on similar prey resources.

1. Introduction

Stable isotopes are useful for analyzing food web structure because they provide time and space integration into trophic relationships among organisms [1]. Stable isotope analysis can be used to determine both source and trophic level information. In particular, carbon and sulfur isotopes are used to determine source information, and nitrogen isotopes are used to determine an organism’s trophic position [2,3]. In a predator, the heavier isotope, 15N, is enriched by 3–5‰ compared to its diet [2,3,4]. The 15N enrichment in animals compared to their diet mainly occurs from fractionation during deamination and transamination that transfers nitrogen from amino acids to urea for excretion of the isotopically lighter nitrogen in the urine [2,4,5,6]. Due to nitrogen successively increasing with trophic level, δ15N is useful for determining an organism’s trophic position. Stable isotopes of C and N have been widely used to examine trophic relationships in fishes and show that the diet composition of a species may vary spatially between and within estuaries, ontogenetically, and between years [7,8]. However, little information exists on the trophic relationships of fishes in Maryland coastal bays (MCBs), and the few studies [9,10] were based on traditional gut content analysis.
MCBs provide food resources and spawning areas for many fish species, as well as nursery habitats for young-of-year fish [11,12,13]. The four fish species (Paralichthys dentatus, Anchoa mitchilli, Leiostomus xanthurus, and Bairdiella chrysoura) used in this study are among the most abundant species in MCBs. In 2018, A. mitchilli, B. chrysoura, L. xanthurus, and P. dentatus ranked 3rd, 4th, 5th, and 18th out of 74 species in overall finfish abundances [14]. These fish species are economically and ecologically important.
A. mitchilli are pelagic and zooplanktivorous. The larvae generally prey on copepod nauplii and rotifers; the juveniles prey on copepods, crab zoea, and other zooplankton; whereas the adult diet includes crustaceans such as mysids and ostracods in addition to small fish and small benthic mollusks [15].
Juvenile B. chrysoura tend to be pelagic, feeding mainly on zooplankton [16]. B. chrysoura show ontogenetic diet shifts; as they increase in size, they consume larger prey that are more energetically valuable. Their primary diet consists of calanoid copepods and mysid shrimp, with mysids being the predominant prey of choice as B. chrysoura increase in size [17].
L. xanthurus larvae act as selective plankton feeders that consume ciliates, invertebrate eggs, and copepod nauplii. L. xanthurus juveniles and adults are benthic feeders that consume ostracods, amphipods, mysids, gastropods, nematodes, and polychaetes [18].
Due to P. dentatus searching, stalking, active eye motion, and visual fixation on prey, they are primarily considered visual feeders on prey found on the bottom and in the water column [19]. Studies have also shown that P. dentatus are opportunistic feeders [20]. At the juvenile stage, P. dentatus tend to feed on mysid shrimp and small fish, and when they reach adulthood, they shift their diet to decapod crustaceans and larger fish [20,21].
In this study, we used δ13C and δ15N stable isotope values to compare the feeding ecology of A. mitchilli, B. chrysoura, L. xanthurus, and P. dentatus between the northern and southern MCBs and between 2018, a year of higher-than-normal precipitation, and 2017, a year of relatively lower precipitation [22]. We hypothesized that the δ13C of the fish species would be more depleted in the more eutrophic northern part of the MCBs, which receives freshwater from St. Martin River, than in the southern bays and more depleted in 2018 than in 2017.

2. Materials and Methods

2.1. Study Area

MCBs occupy an area of 453.2 km² that includes Berlin, Ocean City, Snow Hill, and Pocomoke (Figure 1). They consist of more than 117,000 acres of land, 71,000 acres of water, and 450.6 km of shoreline [12]. The system has a uniform depth < 10 ft [23] and is divided into the northern coastal bays that include Isle of Wight Bay, Assawoman Bay, and St. Martin River and the southern bays including Sinepuxent Bay, Newport Bay, and Chincoteague Bay. The bays connect to the Atlantic Ocean through the Ocean City inlet in the north and the Chincoteague inlet in the south [23].
Groundwater is the main pathway through which freshwater and nutrients enter the system, while winds and tidal exchange at the Ocean City and Chincoteague inlets regulate the system [23]. Flushing times of the bays are slow, causing the system to accumulate contaminants and nutrients [24].
Land use for the coastal bays includes agricultural land or cropland, forestry, pasture, and urban area [25]. The primary economic operations include intensive poultry production, crop production (corn, soybeans, and barley), fishing, and tourism [25]. Land use in the northern bays is predominantly residential and urban development, leading to more anthropogenic eutrophication from wastewater [13]. The southern bays have more agricultural nitrogen inputs [13]. Freshwater inflow directly into the MCBs is higher in the northern bays because of the location of the St. Martin River. Phytoplankton biomass, macroalgae abundance and the associated amphipods, as well as fish abundance, are higher in the northern than southern bays [13,26,27].

2.2. Sample Collection

Samples of P. dentatus, A. mitchilli, L. xanthurus, and B. chrysoura were collected by a beam trawl at 13 sites in MCBs (Figure 1) from April to October in 2017 and 2018. The fish specimens were kept on ice until arrival in the laboratory, where they were stored in a −20 °C freezer until analyzed. The length (cm) and weight (g) measurements for each individual fish were obtained before muscle tissues were removed from the side of the fish between the dorsal and ventral fin. All the fish sampled were young-of-year (YoY) fish except A. mitchilli, which consisted of YoY and age-2 fish. The fish were classified as YoY by the following: P. dentatus, 1.3–16 cm TL [28]; L. xanthurus, <17.0 cm TL [29]; and B. chrysoura <9.6 cm TL [30]. A. mitchilli YoY were <6.5 cm, and age-2 were 6.5–7.9 cm TL [31].

2.3. Stable Isotope Analyses

Freeze-dried and homogenized muscle tissues (1.2–1.3 mg) were placed in tin capsules and sent to the Stable Isotope Facility, University of California Davis, for analysis of carbon and nitrogen isotopes. Samples were analyzed with a PDZ Europa ANCA-GSL elemental analyzer interfaced to a PDZ Europa 20–20 isotope ratio mass spectrometer (Sercon Ltd., Cheshire, UK). The isotopic composition (13C and 15N) was expressed in parts per thousand deviations from an internationally accepted standard:
δ = R s a m p l e R s t a n d a r d 1 × 1000
where R is the ratio of heavy-to-light isotope, R s a m p l e is the ratio in the sample, and R s t a n d a r d is the ratio in the standard. A positive delta (δ) signifies that the sample has more of the heavy isotope than the standard, while a negative δ signifies the sample has less of the heavy isotope compared to the standard [32].

2.4. Data Analyses

The δ13C and δ15N values were reported as averages for each year, season, and sampling location. The δ15N values for each fish species were used to calculate trophic levels (TL) according to the following formula [3]:
T L = λ + δ 15 N c o n s u m e r δ 15 N b a s e / Δ n
where λ is the trophic position of the organism used to estimate δ15 N b a s e (1 was used as the trophic position of suspended particulate organic matter (SPOM), the base organism in this study), δ15 N c o n s u m e r is the mean of δ15N values for each fish species, and δ15 N b a s e is the mean of δ15N values (~6.0‰) for SPOM collected in summer and fall 2016 from the bays; no significant differences were observed in the mean values from the northern and southern bays [33]. Finally, Δ n is the trophic fractionation per trophic level, and 3.4‰ is the typical average fractionation per trophic level [3,34,35]. No lipid correction was applied to the samples, as the mean values of the C:N ratios from the results of the mass spectrometry generally did not exceed 3.5 [36].
The trophic niche sizes of the four fish species based on their δ13C and δ15N values were determined using SIBER within the stable isotope package analysis in R (SIAR; v. 4.2). The standard ellipse area (SEA) and corrected standard ellipse area (SEAc) for small sample sizes were used for comparison of niche size. The percentage of ellipse overlap was also calculated by the ratio between the area of overlap between paired ellipses of species and each individual ellipse area for a species [37]. When the overlap percentage between two species was >60%, it was considered significant [38,39].
Multivariate statistical analyses were conducted using Sigma Plot. Kruskal–Wallis analysis was used to determine if there were intraspecific and interspecific differences in stable isotope values, and Dunn’s pairwise test was used to determine which groups were different. The Mann–Whitney U test was used to determine if there were differences between years and between the northern and southern MCBs in stable isotope values, as well as to compare fish lengths between years and between northern and southern MCBs.

3. Results

A summary of data on the fish used in the diet study is presented in Table 1 for each species, including the mean total length, minimum and maximum length, and number of fish analyzed each season and year. A. mitchilli and L. xanthurus lengths (cm) were significantly different between 2017 and 2018 (Mann–Whitney, p < 0.05). A. mitchilli were larger in 2017 (7.3 ± 0.3SE) than in 2018 (6.2 ± 0.2SE), while L. xanthurus were larger in 2018 (13.7 ± 0.5SE) than in 2017 (11.4 ± 0.4SE). No significant differences were observed between 2017 and 2018 in the mean lengths of P. dentatus and B. chrysoura (p > 0.05). There was also a significant difference between the northern and southern bays in the mean length of L. xanthurus collected in 2017 (Mann–Whitney, p < 0.001), with fish collected in the northern MCBs being larger, but no differences were observed in 2018. For the other species, no significant differences were observed between the northern and southern bays in the mean length of the fish (p > 0.05).

3.1. Interspecific Differences in Isotopic Compositions of the Four Fish Species in MCBs

Mean values of δ13C and δ15N in the years 2017 and 2018 for P. dentatus, A. mitchilli, L. xanthurus, and B. chrysoura are shown in Table 2. There were significant differences among fish species in δ13C values in 2017 (Kruskal–Wallis, p < 0.001). Pairwise comparisons revealed that L. xanthurus had higher δ13C values than A. mitchilli, B. chrysoura, and P. dentatus (Dunn’s, p < 0.050). In 2018, there were also significant differences (Kruskal–Wallis, p = 0.013) between fish δ13C values; pairwise comparison (Dunn’s, p = 0.026) showed that P. dentatus and B. chrysoura were different. The δ15N values were also significantly different among species (Kruskal–Wallis, p < 0.001) in both years. In 2017, δ15N values for A. mitchilli were significantly higher than for L. xanthurus, P. dentatus, and B. chrysoura; B. chrysoura were significantly higher than for P. dentatus and L. xanthurus; and P. dentatus and L. xanthurus were significantly different. In 2018, the pairwise test (Dunn’s, p < 0.001) revealed that δ15N values in L. xanthurus, A. mitchilli, and B. chrysoura were not significantly different but were higher than in P. dentatus.

3.2. Interannual Differences in Isotopic Composition of Each Fish Species in MCBs

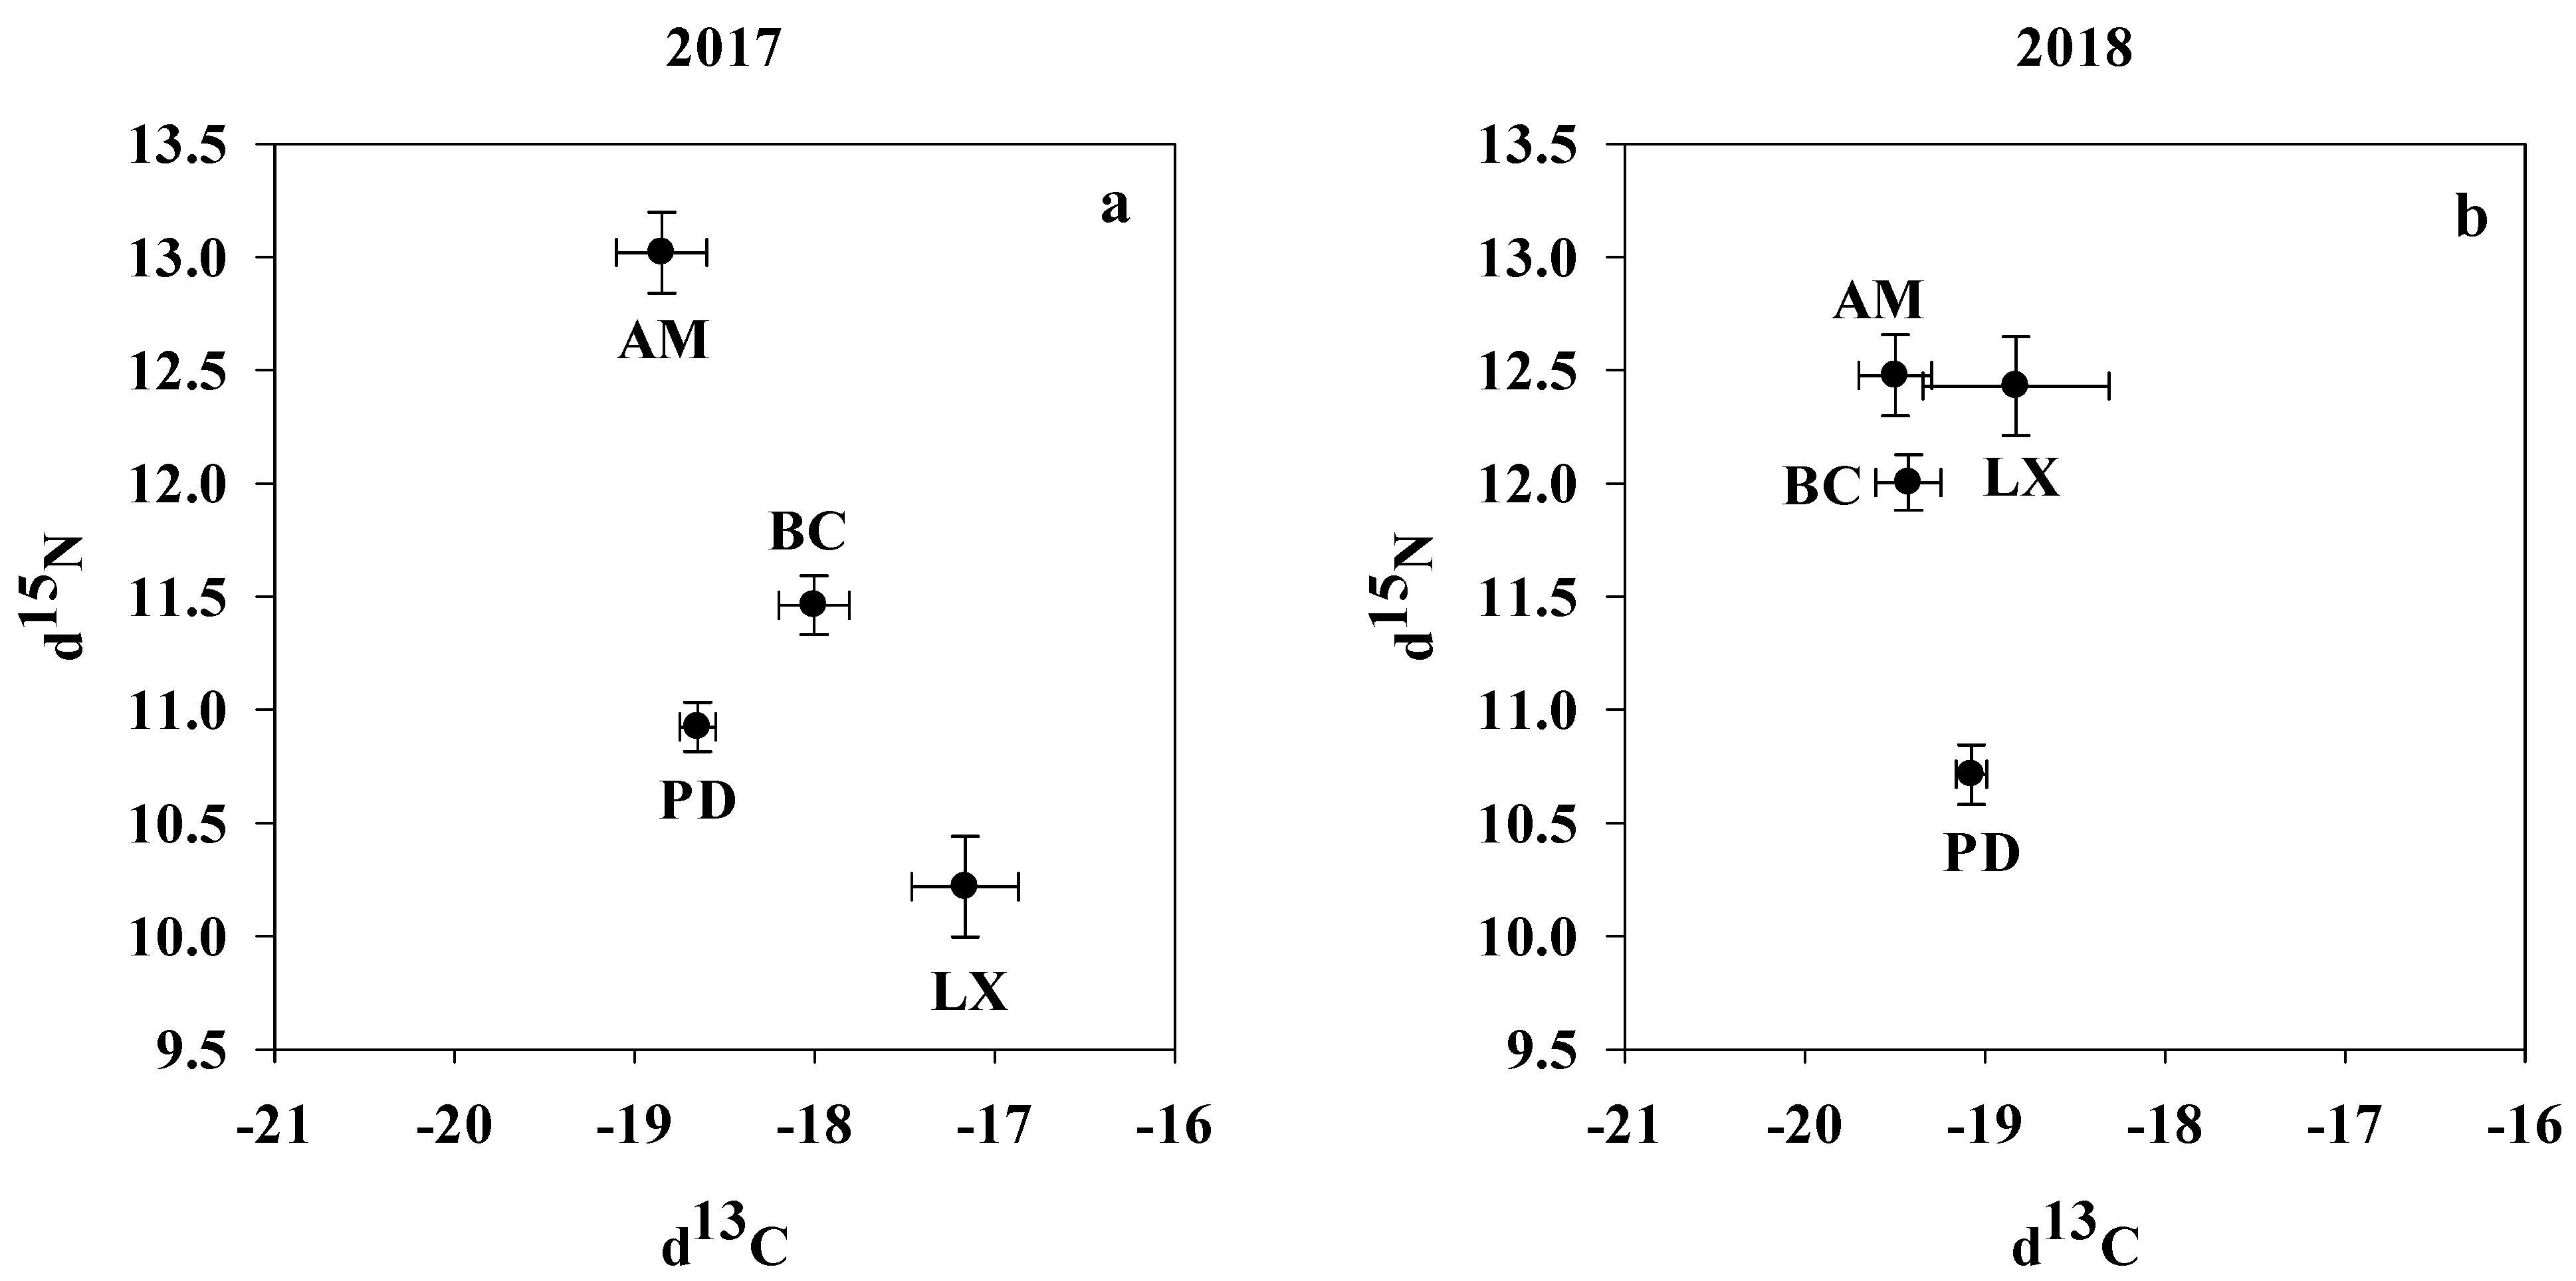
The δ13C values were significantly higher in 2017 than in 2018 for all four fish species (Mann–Whitney, p < 0.05) (Table 3). A. mitchilli, L. xanthurus, and B. chrysoura also showed annual intraspecific differences in δ15N values between 2017 and 2018 (Mann–Whitney, p < 0.05), but no difference was observed for P. dentatus (p > 0.05).
Isotope biplots (Figure 2a,b) indicated that in 2017, A. mitchilli was the most enriched in δ15N (13.0‰) and most depleted in δ13C (−18.9‰) compared to the other fish species. In contrast, L. xanthurus was the most depleted in δ15N (10.2‰) but most enriched in δ13C (−17.2‰) compared to the other fish species. P. dentatus and B. chrysoura had intermediate levels of δ15N and δ13C relative to the other species. The biplots in 2018 revealed that A. mitchilli (12.5‰), B. chrysoura (12.0‰), and L. xanthurus (12.4‰) had enriched δ15N values and relatively depleted δ13C values (−19.5 to −18.8‰), whereas P. dentatus had depleted δ15N (10.7‰) but an intermediate δ13C value (−19.1‰).

3.3. Seasonal Differences in Isotopic Composition of Each Fish Species in MCBs

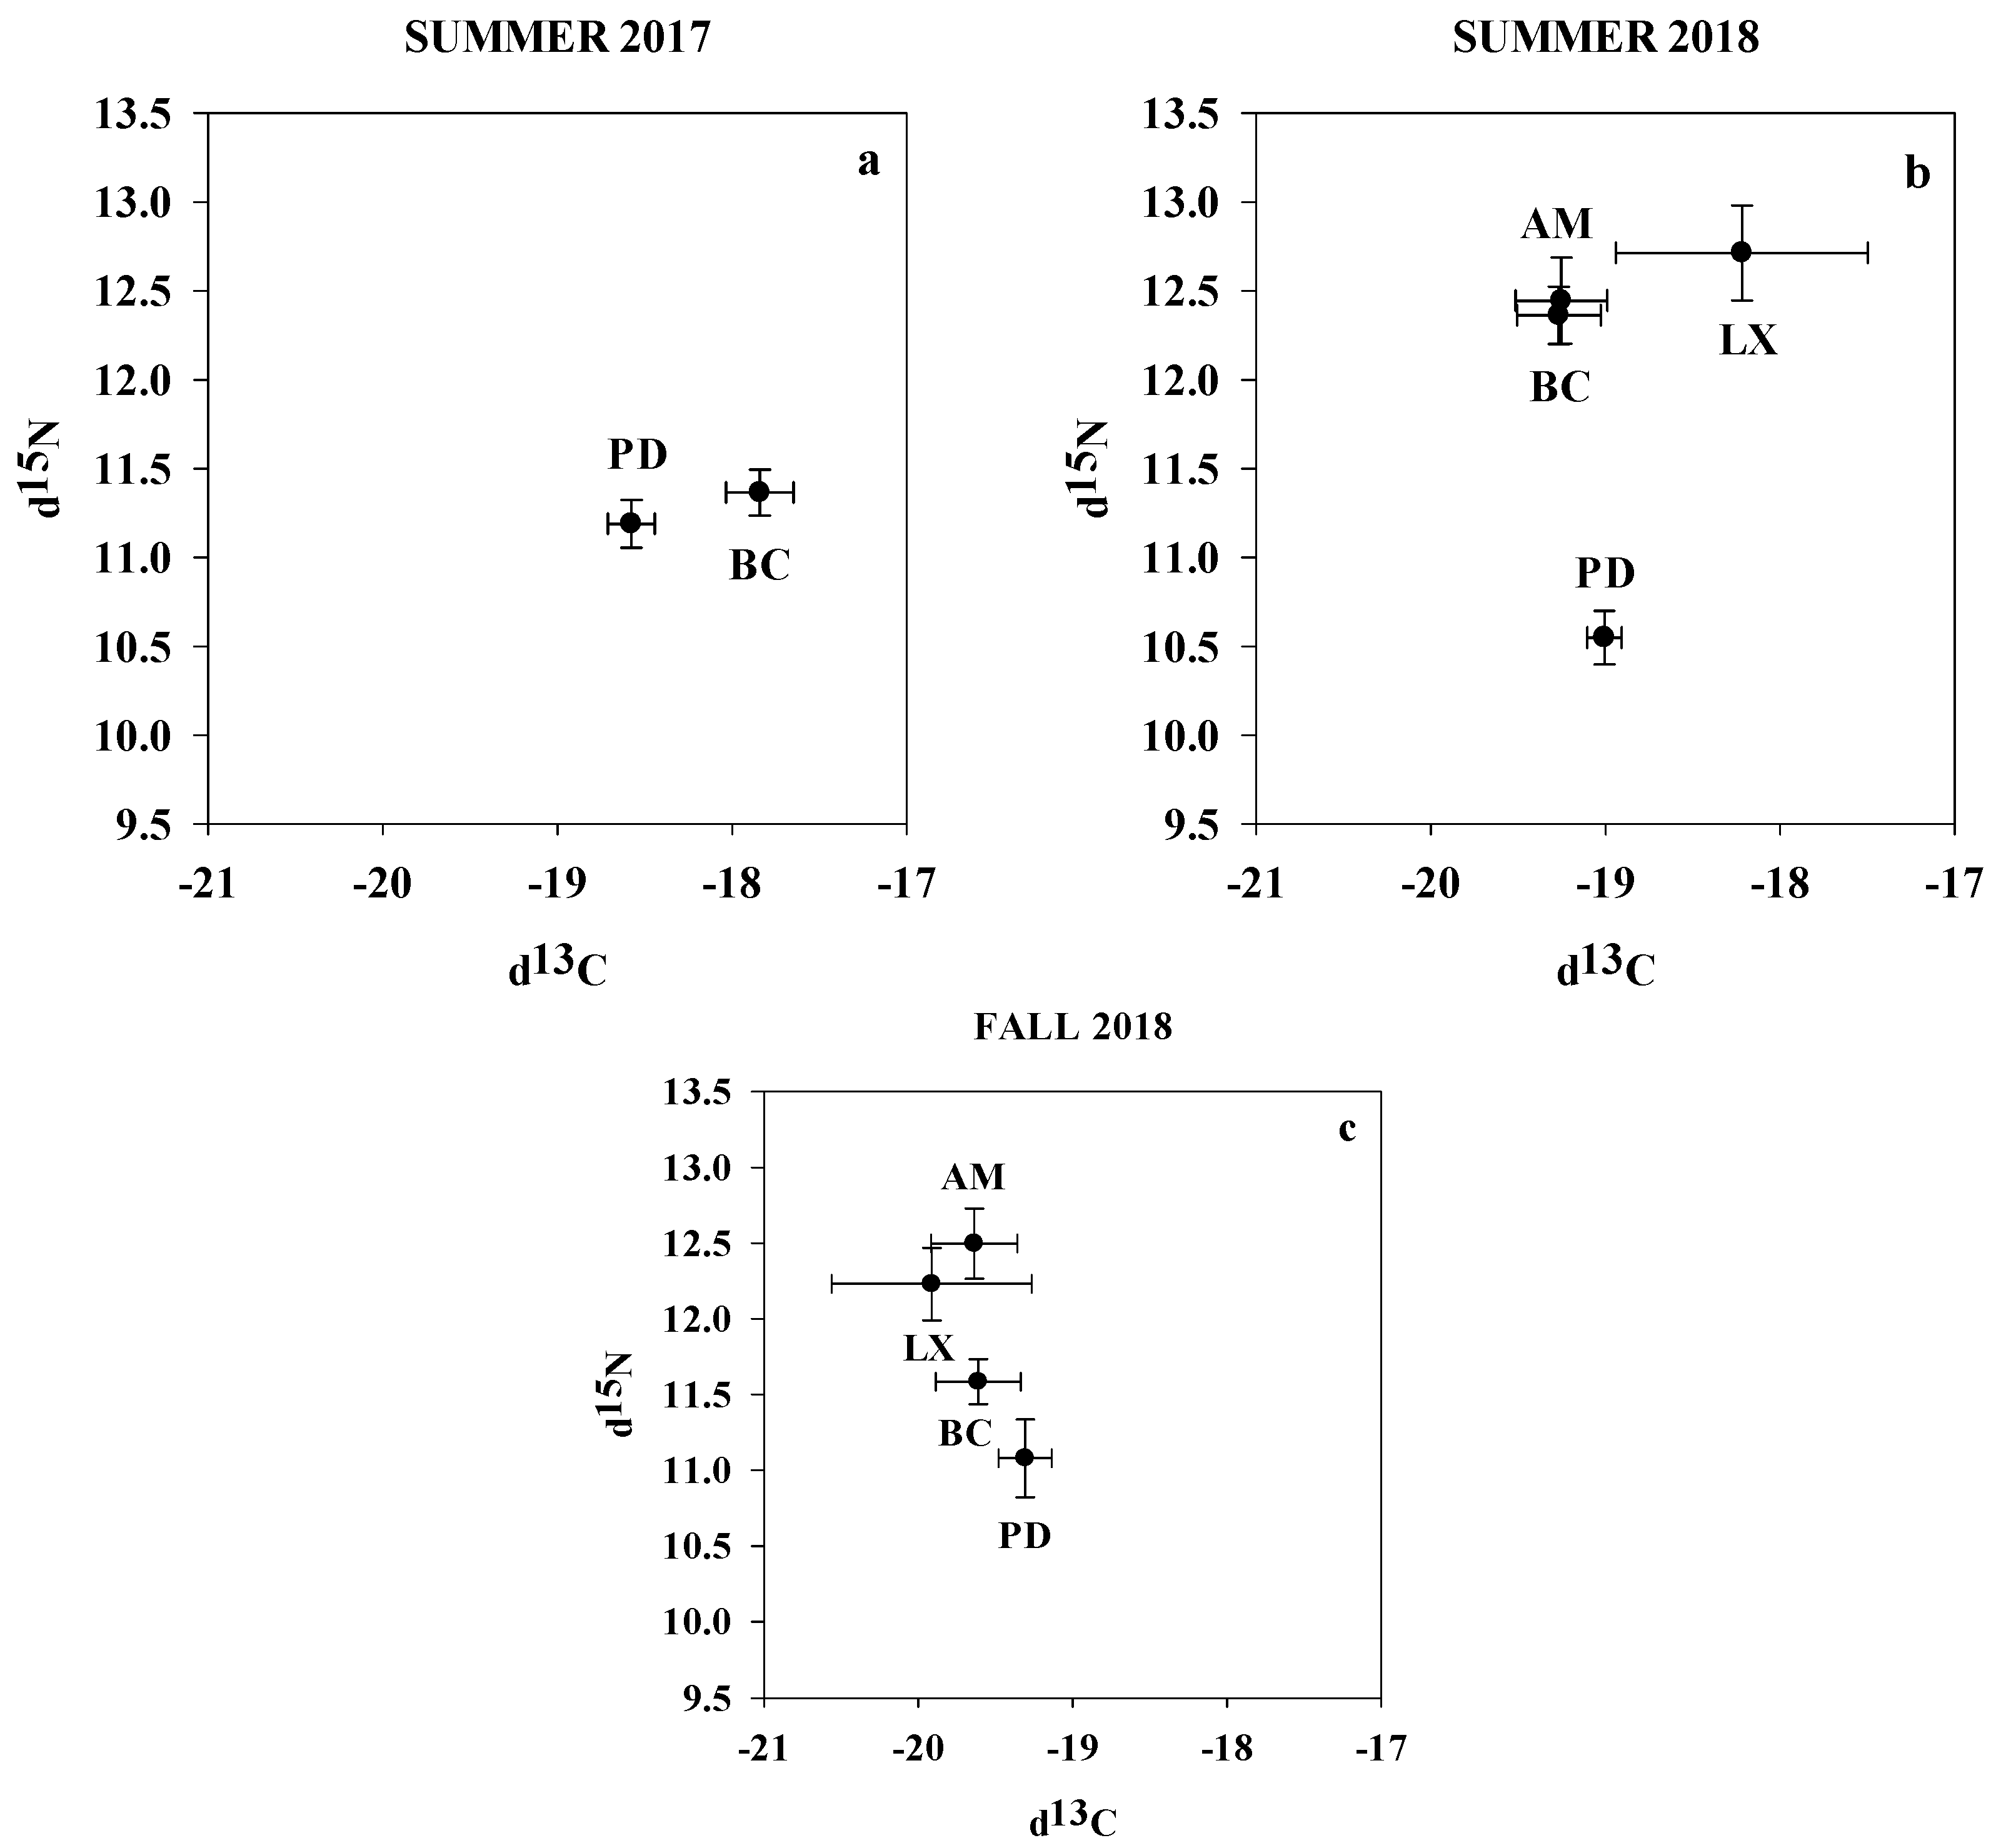
Seasonal comparisons were made only for P. dentatus and B. chrysoura in 2017 and for all species in 2018 because of insufficient sample sizes in spring and summer months in 2017. In 2017, P. dentatus showed no significant difference between spring (−18.4 ± 0.2), summer (−18.6 ± 0.1), and fall (−19.0 ± 0.2) for δ13C, while significant differences (Kruskal–Wallis, p = 0.001) were noted for δ15N in spring (10.8 ± 0.4), summer (11.2 ± 0.1), and fall (10.4 ± 0.2). Pairwise testing revealed that δ15N values of P. dentatus caught in summer and fall were significantly different (Dunn’s method, p = 0.003). In 2017, B. chrysoura showed significant differences (Kruskal–Wallis, p = 0.001) between summer (−17.8 ± 0.2) and fall (−20.0 ± 0.1) for δ13C, as well as for δ15N in summer (11.4 ± 0.1) and fall (12.7 ± 0.3).
In 2018, no significant differences were observed between summer and fall in δ13C content of the fish species examined, except for B. chrysoura, which showed significant differences for δ15N (Kruskal–Wallis, p = 0.001).
Seasonal biplots (Figure 3a–c) indicated that in summer 2017, B. chrysoura was enriched in δ15N and had intermediate levels in δ13C compared to the other fish species. P. dentatus was enriched in both isotopes, and L. xanthurus was depleted in both isotopes compared to the other fish. In summer 2018, L. xanthurus was enriched in both δ15N and δ13C compared to the other fish species, while A. mitchilli and B. chrysoura were enriched in δ15N and depleted in δ13C. P. dentatus was fairly depleted in both isotopes compared to the other species. Comparing the fish species in fall 2018, A. mitchilli was enriched in δ15N and had intermediate levels of δ13C, L. xanthurus was enriched in δ15N and depleted in δ13C, B. chrysoura had intermediate levels of both isotopes, and P. dentatus had depleted levels of both isotopes.

3.4. Spatial Variation in Stable Isotopes of the Four MCB Fish Species

Mean values of δ13C and/or δ15N in 2017 and 2018 for P. dentatus, A. mitchilli, L. xanthurus, and B. chrysoura differed between the northern and southern bays (Table 4). In 2017, the δ13C contents of P. dentatus and B. chrysoura were higher in the southern than northern parts of MCBs, but no spatial differences were observed for L. xanthurus. For P. dentatus, B. chrysoura, and L. xanthurus, the δ15N contents were higher in the northern bays than southern bays (Mann–Whitney, p < 0.05). In 2018, P. dentatus and B. chrysoura δ13C contents were higher in fish collected from the southern than northern MCBs, while δ15N contents for P. dentatus were significantly higher in the northern than southern bays (Mann–Whitney, p < 0.001), but no differences were observed between areas for the other species (Table 4).
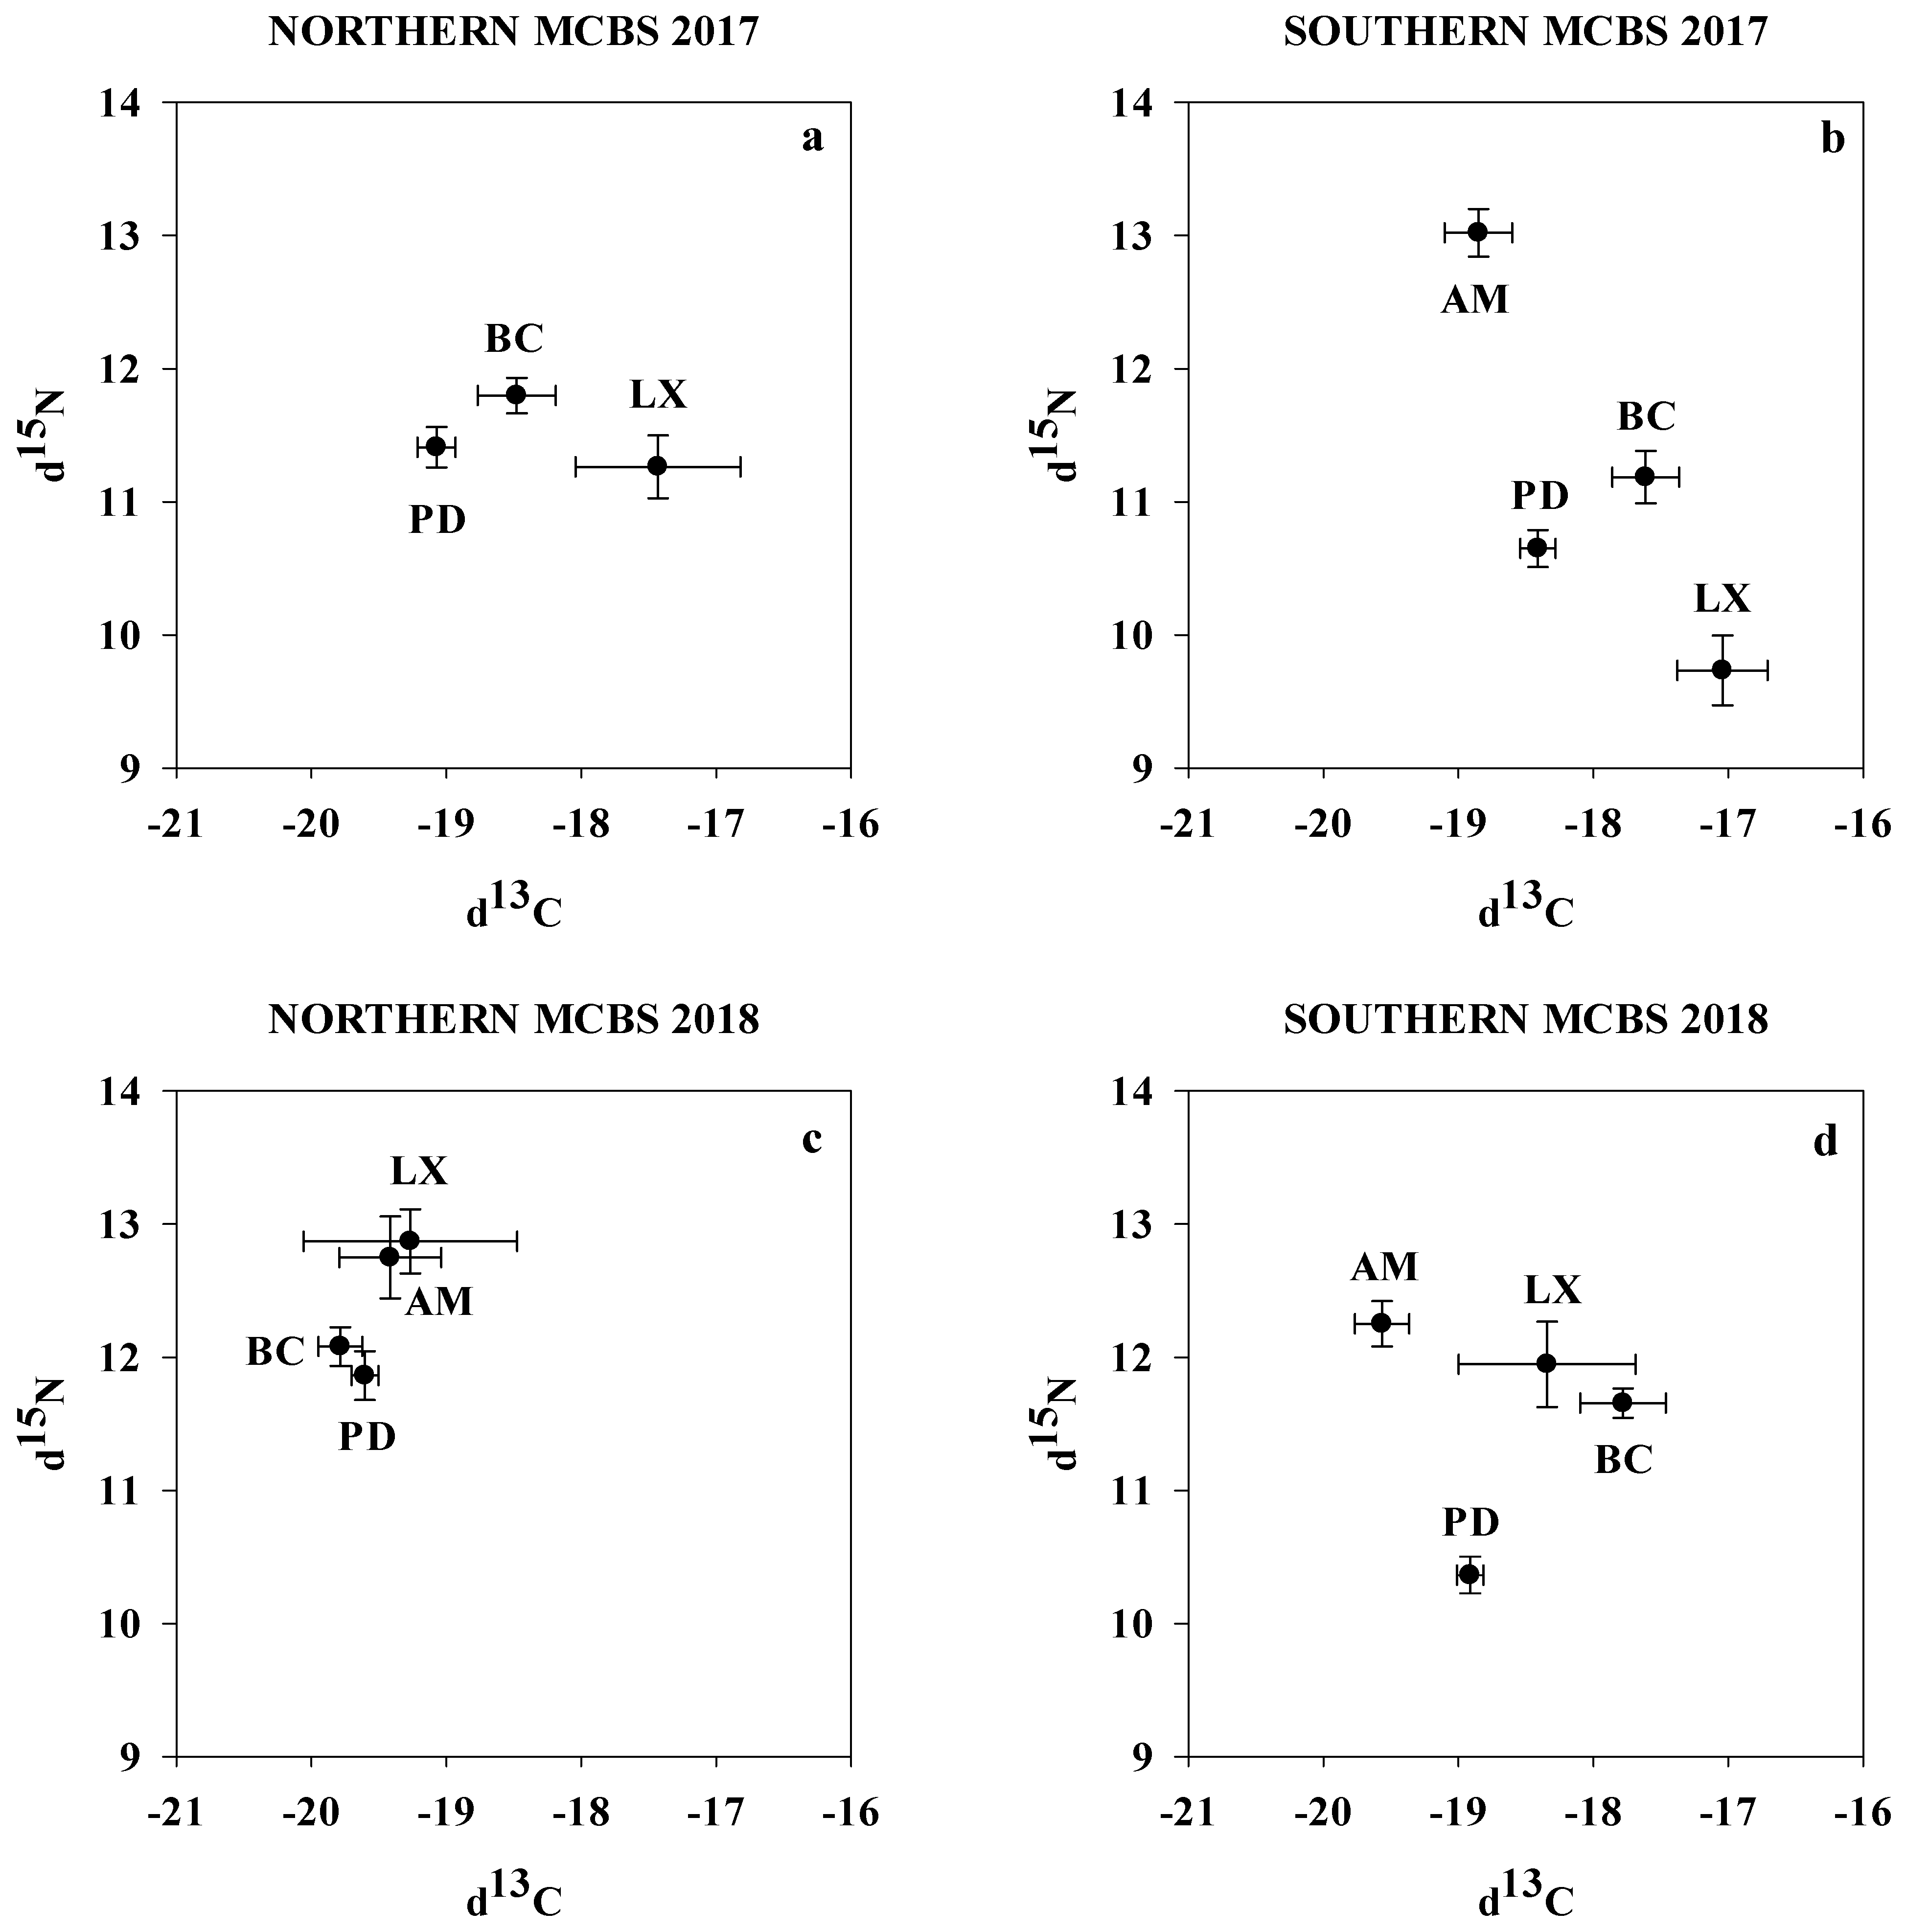
Isotopic biplots (Figure 4a–d) indicated that in 2017, the fish had similar enrichment/depletion trends for both the northern and southern MCBs. A. mitchilli was enriched in δ15N and most depleted in δ13C. B. chrysoura had intermediate δ13C but the most enriched δ15N levels. P. dentatus had an intermediate δ15N level and the most depleted δ13C, and L. xanthurus was the least depleted in δ15N but most enriched in δ13C. In 2018, L. xanthurus and A. mitchilli from the northern MCBs were enriched in both δ15N and δ13C compared to the other species, while B. chrysoura and P. dentatus were relatively depleted in both δ15N and δ13C. In the southern MCBs, L. xanthurus and B. chrysoura were enriched in both isotopes, P. dentatus was depleted in both isotopes, and A. mitchilli was enriched in δ15N but depleted in δ13C.
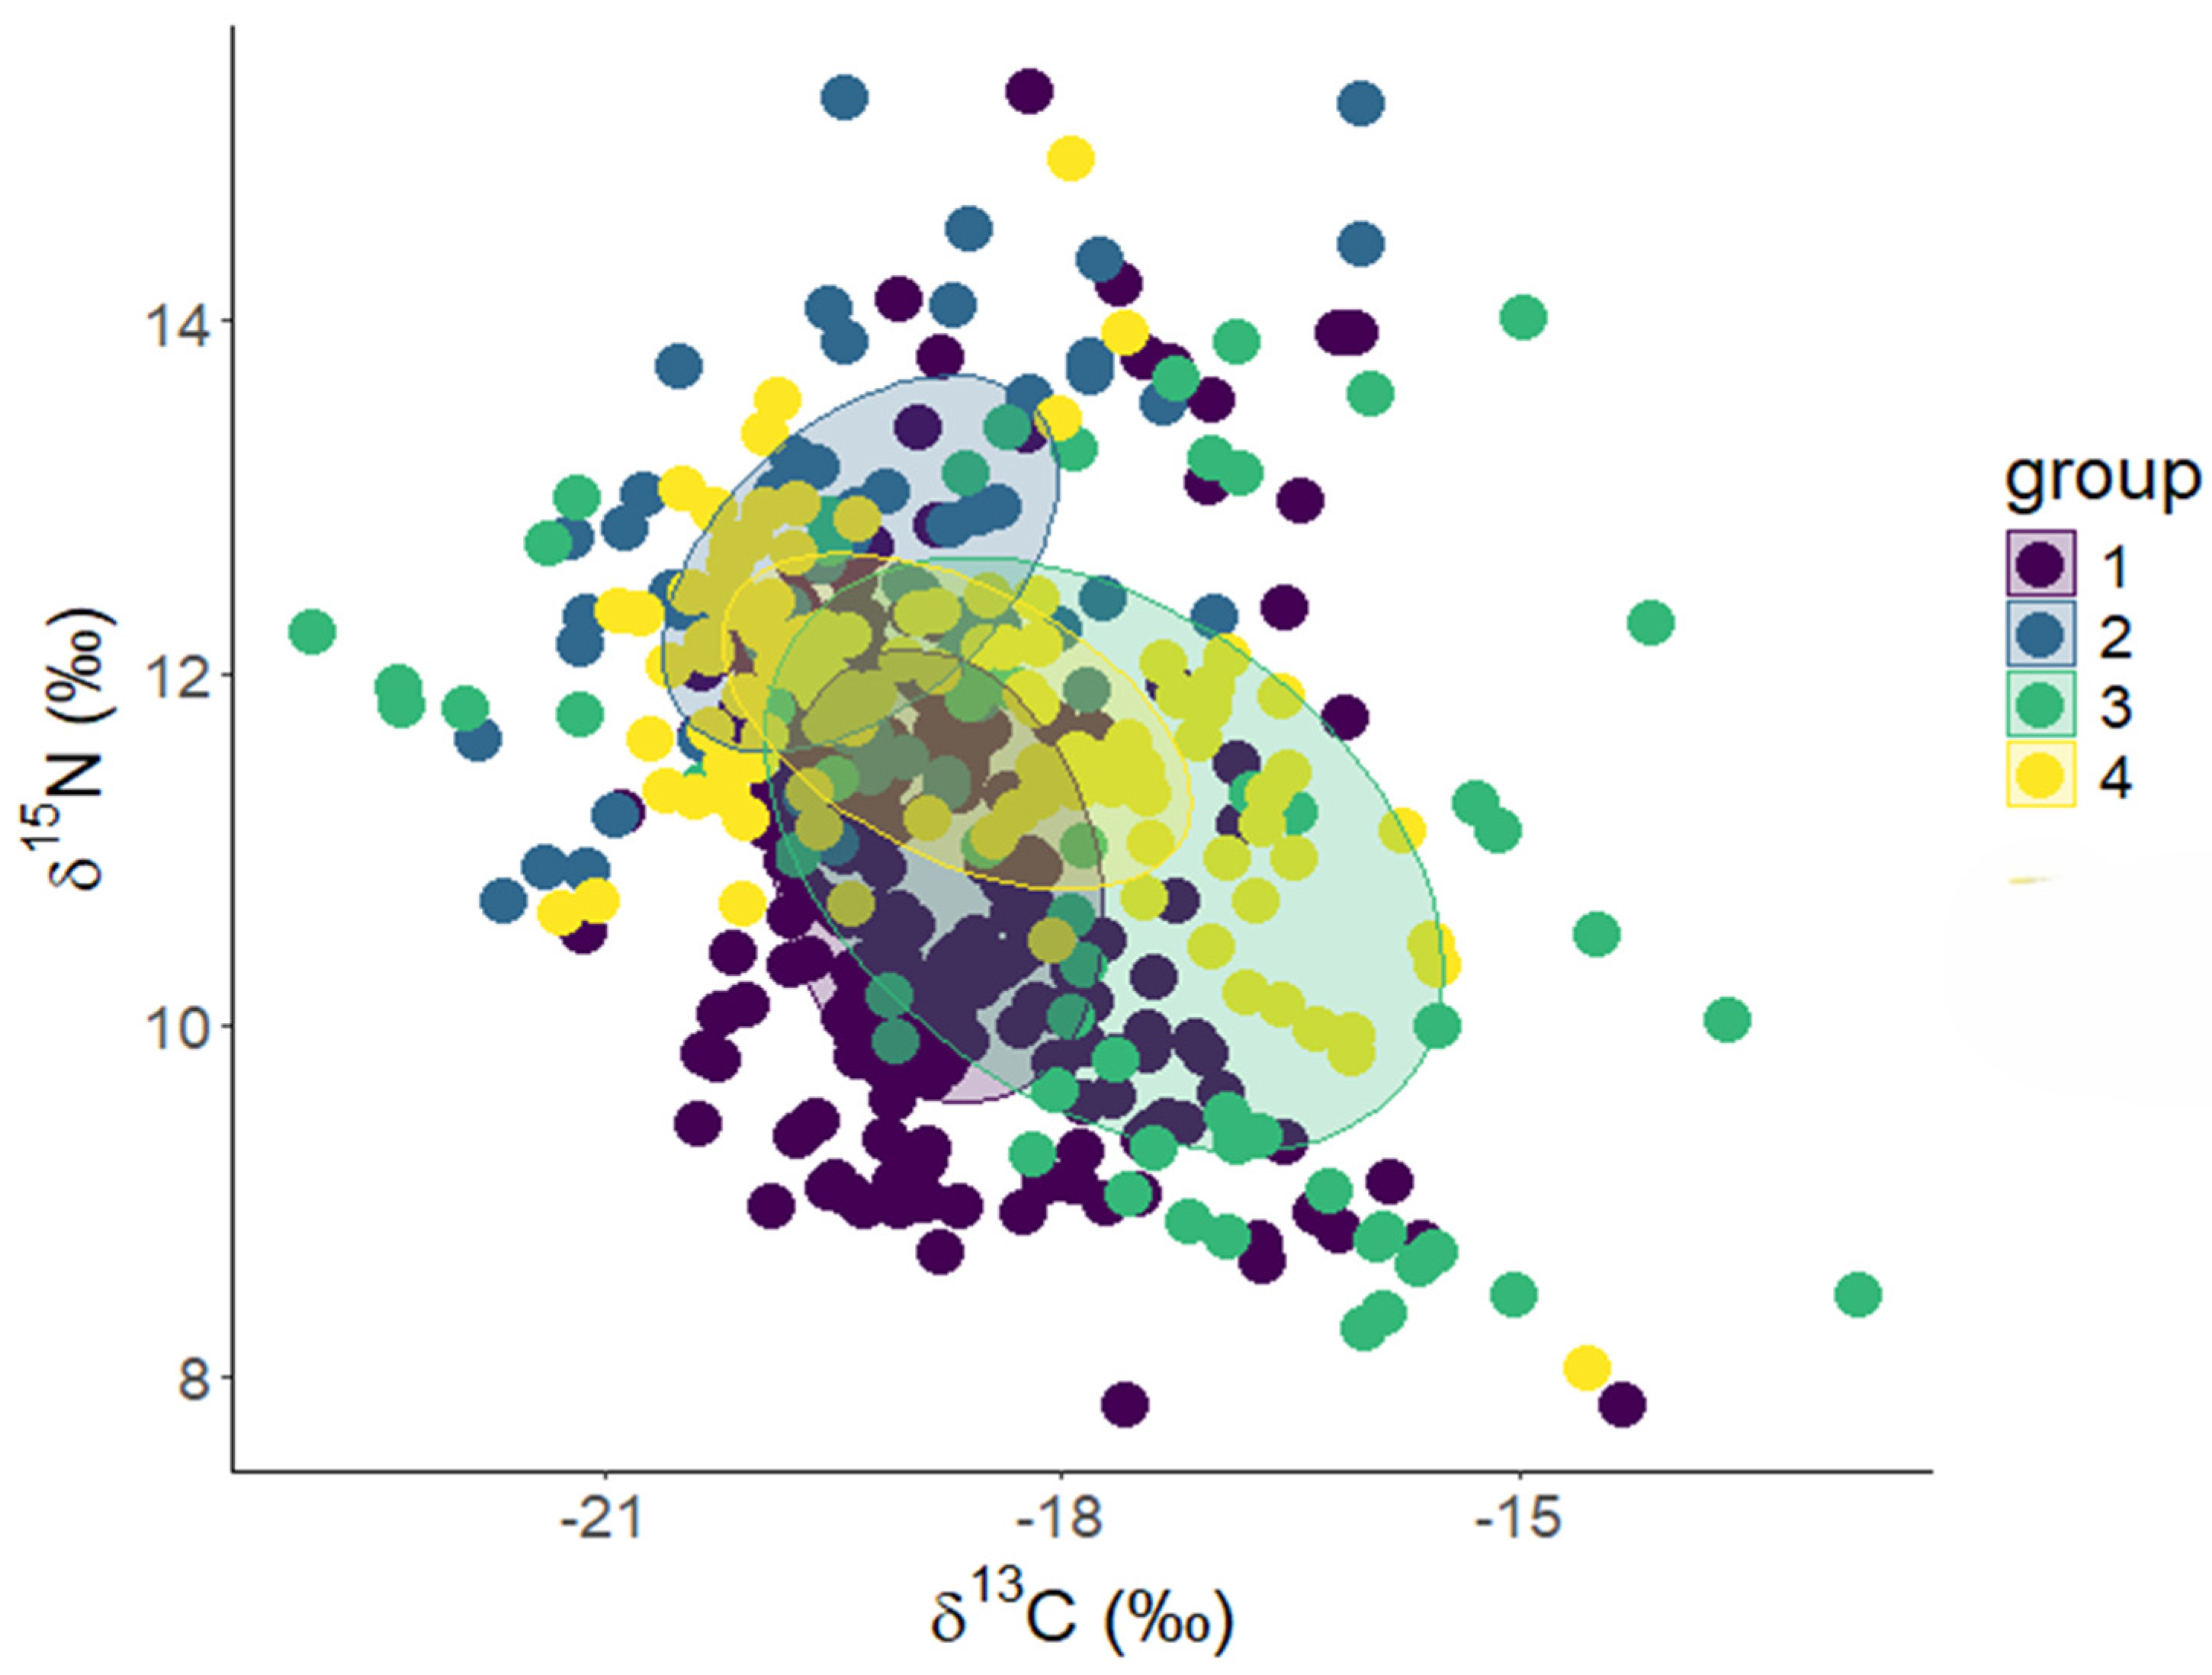
The trophic levels of A. mitchilli, B. chrysoura, L. xanthurus, and P. dentatus were determined to be 3.04, 2.77, 2.55, and 2.51, respectively, based on their δ15N values. The standard ellipse areas estimated for the species are presented in Table 5 and Figure 5. The SEA and SEAc values for the species are similar. L. xanthurus had the largest SEA/SEAc values compared to the other fish species, while A. mitchilli had the smallest SEA/SEAc values.
The trophic niche overlap between species based on δ13C and nitrogen δ15N ranged from 20.1 to 57.2% (P. dentatus), 22.2 to 76.4% (A. mitchilli), 22.7 to 33.6% (L. xanthurus), and 46.1 to 89.1% (B. chrysoura) (Table 6). The percentage of the B. chrysoura ellipse that overlapped L. xanthurus was the highest (89.1%), while the ellipse of P. dentatus that overlapped A. mitchilli was the lowest percentage (20.1%).

4. Discussion

4.1. Interspecific Differences in Stable Isotope Composition of the Four MCB Fish Species

There were significant differences between species in the δ13C and δ15N mean values of the muscle tissue. In 2017, the fish were most enriched to most depleted in δ13C as follows: L. xanthurus, B. chrysoura, P. dentatus, and then A. mitchilli, which was similar to the pattern observed in 2018. The higher enrichment of δ13C in L. xanthurus than in the pelagic species such as A. mitchilli is probably related to a more benthic feeding that might have caused the addition of a benthic microalgal carbon source, which has δ13C values around −17.0‰ [40,41]. Nevertheless, the δ13C values overlapped between fish species and indicate that the fish species were dependent on a similar organic matter source [42]. The mean ± SE value of δ13C ranged from −18.9 ± 0.5‰ to −17.2 ± 0.3‰ in 2017 and −19.5 ± 0.2‰ to −18.8 ± 0.5‰ in 2018 and suggest that the carbon source for the fish were mainly of marine phytoplankton, which ranges from −24‰ to −18‰ [5,40].
In 2017, the fish were most enriched to most depleted in δ15N as follows: A. mitchilli, B. chrysoura, P. dentatus, and then L. xanthurus, which is slightly different from what was observed in 2018, when the most enriched to most depleted δ15N values were A. mitchilli, L. xanthurus, B. chrysoura, and then P. dentatus. A. mitchilli had the highest δ15N values (13.0 ± 0.2‰ in 2017 and 12.5 ± 0.2‰ in 2018) in both years compared to the other species. In another study, Winemiller et al. [8], found that A. mitchilli had the lowest δ15N value (12.8 ± 0.8‰) compared to L. xanthurus (13.3 ± 2.0‰) and B. chrysoura (14.7 ± 2.0‰), though the δ15N value they observed in A mitchilli was comparable to the value we observed in our study in the MCBs. The A. mitchilli used for stable isotope analysis were approximately age-2 fish based on the length values, while the other fish species were age-0 [28,29,30,31]. It is known that δ15N increases with the size and age of a species [5,42,43].
It was found that in 2017, A. mitchilli was the most enriched in δ15N and most depleted in δ13C compared to the other fish species; L. xanthurus was the most depleted in δ15N and the most enriched in δ13C, while P. dentatus and B. chrysoura had intermediate levels of δ15N and δ13C compared to the other two fish species. In 2018, A. mitchilli, B. chrysoura, and L. xanthurus had enriched δ15N values and depleted δ13C values, and P. dentatus had depleted δ15N and an intermediate δ13C level. When fish have relatively enriched δ13C values and depleted δ15N values, this indicates that they were feeding on a more benthic-based prey; depleted δ13C values and enriched δ15N values indicate that the fish were feeding on more of a planktonic- or pelagic-based prey [6,41]. This suggests that L. xanthurus in 2017 and P. dentatus in 2018 had a more benthic influence in their diet, while A. mitchilli in 2017 and 2018 and B. chrysoura in 2018 had a more planktonic influence on their diet, which is consistent with what is known about their feeding habits [10].

4.2. Temporal Variations in Stable Isotope Composition of the Four MCB Fish Species

The δ13C values of the fish were more enriched in 2017 than in 2018. In 2017, L. xanthurus mean δ13C value was slightly more enriched and might have had a benthic microalgal carbon source, which has δ13C values around −17.0‰ [40,41]. MacKenzie et al. [44] attributed annual variations in δ13C to the feeding areas of salmon (Salmo salar) being subjected to interannual variability in primary production. It has also been shown that δ13C can be more depleted in wet years compared to dry years because more terrestrially derived carbon is carried by rivers into an estuary in the wet years [45]. There was more precipitation in the year 2018 compared to 2017 in Maryland. The average annual rainfall values in 2017 and 2018 were 104.7cm and 164.1cm, respectively [22]. Since 2018 had more depleted δ13C, especially in the northern bays, it is possible that the higher rainfall increased freshwater inputs into the MCBs and affected the carbon signatures of organisms at the base of the food web [33,46] which, in turn, resulted in variations in the fish species’ δ13C [32,33,47,48,49,50].

4.3. Spatial Variations in Stable Isotopes of the Four MCB Fish Species

The δ13C values in P. dentatus and B. chrysoura collected from the southern bays in both 2017 and 2018 were enriched compared to the individuals collected from the northern bays. In contrast, δ15N values in P. dentatus, B. chrysoura, and L. xanthurus collected from the northern bays in 2017 were more enriched compared to the individuals collected from the southern bays, whereas only P. dentatus had significantly higher δ15N in the northern than southern bays in 2018. Thus, the fish that displayed significant differences were more depleted in δ13C and enriched in δ15N when collected from the northern MCBs but enriched in δ13C and depleted in δ15N when collected from the southern MCBs. This spatial difference reflects the differences in the amount of freshwater inflow from MCB tributaries in the northern and southern bays and the extent of anthropogenic impact. St. Martin River, the main tributary that transports water directly into the MCBs, is located in the northern bays and thus carries organic materials from land and river into the bays, thereby influencing the δ13C values in the fish. It has been determined that increased anthropogenic nutrients influences productivity, causing increases in isotopic values [51]. The northern MCBs have more anthropogenic eutrophication from residential and urban development compared to the southern MCBs [13,52]. It is also plausible that the observed difference between the northern and southern MCBs was due to different prey assemblages that influenced the diet of the species in the areas. Estrada et al. [53] found isotopic variations in bluefin tuna (Thunnus thynnus), suggesting that the diets of individual bluefin tuna differed and explained by the fact that the bluefin tuna came from areas with different prey assemblages.
In a study on stable isotopes of juvenile fish in MCBs, O’Brien [54] found that A. mitchilli collected in the northern MCBs had δ13C values around −20‰, indicating the presence of a more pelagic carbon source. The δ13C values (−19.8 ± 0.2‰ to −17.4 ± 0.6‰) for the fish collected from the northern and southern bays in this study are similar to the values reported by O’Brien [54].

4.4. Trophic Levels and Niche Overlap of the Four MCB Fish Species

The trophic levels estimated for A. mitchilli, B. chrysoura, L. xanthurus, and P. dentatus were 3.04, 2.77, 2.55, and 2.51, respectively. The higher trophic level of A. mitchilli relative to the other species may be because they were older and likely included more fish in their diets. Fish size/age has a positive relationship with trophic level [55,56].
The isotopic niche breadth differed between the species, with L. xanthurus having a higher SEA/SEAc than the other fish species, indicating a larger niche, and A. mitchilli having the lowest SEA/SEAc, indicating a smaller niche. The broader niche width of L. xanthurus reveals a wider use of MCBs’ habitat and/or prey sources [57]. The variation in niche widths could be related to species with smaller niche widths having a trophic behavior that is more flexible compared to species with larger niche widths, which include individuals with specialized trophic behavior [58]. Generalist species are believed to have a narrower isotopic niche width than specialist species due to generalists having similar isotopic signatures because they are sampling the same prey items in similar proportions and thus integrate their diet [59,60]. The niche width data from this study suggest a higher variability in the diets among L. xanthurus individuals, resulting in specialized diets [61], compared to individuals belonging to other fish species that were thus, relatively, generalists.
The percentage of the B. chrysoura ellipse that overlapped L. xanthurus, as well as the A. mitchilli ellipse that overlapped L. xanthurus, was >60%, meaning they had significant niche overlaps [38,39]. Greater niche overlaps suggest that the species are feeding on similar prey resources [62,63]. This high dietary overlap between the species can increase resource competition [64].

5. Conclusions

The δ13C values of the fish species in both years indicate marine phytoplankton as the dominant source of carbon and that interannual variations in δ13C in some species were likely associated with interannual variability in the amount of precipitation and terrestrially derived organic carbon transported via freshwater discharge into the bays. A. mitchilli had the highest δ15N in both years, probably because the individuals used in the study were ages-1 to 2 fish, while the other fish species were juveniles. Overall, the species were more δ15N enriched when collected from the northern MCBs than when collected from the southern MCBs, especially in 2017. This was probably due to a higher anthropogenic influence in the northern MCBs and different prey assemblages in the two locations. L. xanthurus had a broader niche breadth than the other fish species, whereas B. chrysoura and A. mitchilli had the highest niche overlap with L. xanthurus; thus, there is a potential for competition between the two species and L. xanthurus. Our results are useful for interpreting food web dynamics in estuaries and underscore the need to take into account spatial and temporal variability of δ13C and δ15N when examining trophic relationships of fishes.

Author Contributions

Conceptualization, C.R., P.C. and A.I.; methodology, C.R.; software, C.R.; validation, C.R., P.C. and A.I.; formal analysis, C.R.; investigation, C.R.; resources, P.C. and A.I.; data curation, C.R.; writing—original draft preparation, C.R.; writing—review and editing, P.C. and A.I.; visualization, C.R., P.C. and A.I.; supervision, P.C. and A.I.; project administration, P.C. and A.I.; funding acquisition, P.C. and A.I. All authors have read and agreed to the published version of the manuscript.

Funding

This project was funded by the US National Science Foundation award (grant number: 1547821), in part by the NOAA Educational Partnership Program (grant number: NA16SEC4810007) to the University of Maryland Eastern Shore, and by Title III HGBI.

Institutional Review Board Statement

Not applicable.

Data Availability Statement

Data available upon request from authors.

Conflicts of Interest

The authors declare no conflicts of interest.

References

  1. Layman, C.A.; Araujo, M.S.; Boucek, R.; Hammerschlag-Peyer, C.M.; Harrison, E.; Jud, Z.R.; Matich, P.; Rosenblatt, A.E.; Vaudo, J.J.; Yeager, L.A.; et al. Applying stable isotopes to examine food-web structure: An overview of analytical tools. Biol. Rev. 2012, 87, 545–562. [Google Scholar] [CrossRef] [PubMed]
  2. Michener, R.H.; Kaufman, L. Stable isotope ratios as tracers in marine food webs: An update. Stable Isot. Ecol. Environ. Sci. 2007, 2, 238–282. [Google Scholar]
  3. Post, D.M. Using stable isotopes to estimate trophic position: Models, methods, and assumptions. Ecology 2002, 83, 703–718. [Google Scholar] [CrossRef]
  4. Gannes, L.Z.; Del Rio, C.M.; Koch, P. Natural abundance variations in stable isotopes and their potential uses in animal physiological ecology. Comp. Biochem. Physiol. Part A Mol. Integr. Physiol. 1998, 119, 725–737. [Google Scholar] [CrossRef] [PubMed]
  5. Davenport, S.R.; Bax, N.J. A trophic study of a marine ecosystem off southeastern Australia using stable isotopes of carbon and nitrogen. Can. J. Fish. Aquat. Sci. 2002, 59, 514–530. [Google Scholar] [CrossRef]
  6. Peterson, B.J.; Fry, B. Stable isotopes in ecosystem studies. Annu. Rev. Ecol. Syst. 1987, 18, 293–320. [Google Scholar] [CrossRef]
  7. Buchheister, A.; Latour, R.J. Trophic ecology of summer flounder in lower Chesapeake Bay inferred from stomach content and stable isotope analyses. Trans. Am. Fish. Soc. 2011, 140, 1240–1254. [Google Scholar] [CrossRef]
  8. Winemiller, K.O.; Akin, S.; Zeug, S.C. Production sources and food web structure of a temperate tidal estuary: Integration of dietary and stable isotope data. Mar. Ecol. Prog. Ser. 2007, 343, 63–76. [Google Scholar] [CrossRef]
  9. Black, R.B. Dietary Habits of Selected Species of Fish Resident or Transitory to the MCBs and Their Importance to Understanding Food Webs. Master's Thesis, University of Maryland Eastern Shore, Princess Anne, MD, USA, 2009. [Google Scholar]
  10. Mayor, E.D. Population dynamics of mysids and their role in the trophic ecology of fishes in Maryland Coastal Bays. Doctoral Dissertation, University of Maryland Eastern Shore, Princess Anne, MD, USA, 2015. [Google Scholar]
  11. Casey, J.D.; Doctor, S. Status of finfish populations in the Maryland coastal bays. In Maryland’s Coastal Bays: Ecosystem Health Assessment; Document Number DNR-12-1202-0009; Maryland Department of Natural Resources: Annapolis, MD, USA, 2004; pp. 8–34. [Google Scholar]
  12. Bolinger, A.; Doctor, S.; Luettel, A.; Luisi, M.; Tyler, G. Investigation of Maryland’s Coastal Bays and Atlantic Ocean Finfish Stocks 2007 Report; Document Number F-50-R-30; Maryland Department of Natural Resources: Annapolis, MD, USA, 2007. [Google Scholar]
  13. Pincin, J.; Wilberg, M.J.; Harris, L.; Willey, A. Trends in abundance indices of fishes in Maryland’s Coastal Bays during 1972–2009. Estuaries Coasts 2014, 37, 791–800. [Google Scholar] [CrossRef]
  14. Doctor, S.; Tyler, G.; Weedon, C.; Willey, A. Investigation of Maryland’s Coastal Bays and Atlantic Ocean Finfish Stocks Report; Document Number F-50-R-27; Maryland Department of Natural Resources: Annapolis, MD, USA, 2018. [Google Scholar]
  15. Luo, J. Life History of the Bay Anchovy, Anchoa Mitchilli, in Chesapeake Bay; The College of William and Mary: Williamsburg, VA, USA, 1991. [Google Scholar]
  16. Chao, L.N.; Musick, J.A. Life-history, feeding-habits, and functional-morphology of juvenile Sciaenid fishes in York River Estuary, Virginia. Fish. Bull. 1977, 75, 657. [Google Scholar]
  17. Waggy, G.L.; Peterson, M.S.; Comyns, B.H. Feeding habits and mouth morphology of young Silver Perch (Bairdiella chrysoura) from the north-central Gulf of Mexico. Southeast. Nat. 2007, 6, 743–751. [Google Scholar] [CrossRef]
  18. Hales, L.S.; Van Den Avyle, M.J. Species Profile: Life Histories and Environmental Requirements of Coastal Fishes and Invertebrates (South Atlantic): Spot; U.S. Fish and Wildlife Service Biological Report Biological Report U.S. Army Corps of Engineers TR EL-82-4; Fish and Wildlife Service, US Department of the Interior: Washington, DC, USA, 1989; Volume 82, 24p. [Google Scholar]
  19. Grimes, B.H. Summer and Winter Flounder; Fish and Wildlife Service, US Department of the Interior: Washington, DC, USA, 1989. [Google Scholar]
  20. Packer, D.B.; Hoff, T. Life history, habitat parameters, and essential habitat of mid-Atlantic summer flounder. Am. Fish. Soc. Symp. 1999, 22, 76–92. [Google Scholar]
  21. Rogers, S.G.; Van Den Avyle, M.J. Species Profiles: Life Histories and Environmental Requirements of Coastal Fishes and Invertebrates (South Atlantic): Summer flounder; United States Fish and Wildlife Service FWS/OBS-82/11.15; U.S. Army Corps of Engineers, TR EL-82-4; Fish and Wildlife Service, US Department of the Interior: Washington, DC, USA, 1983; 14p. [Google Scholar]
  22. NOAA National Centers for Environmental information, Climate at a Glance: Statewide Time Series, Published November 2021. Available online: https://www.ncdc.noaa.gov/cag/ (accessed on 1 December 2021).
  23. Wazniak, C.; Wells, D.; Hall, M. The Maryland coastal bays ecosystem. In Maryland’s Coastal Bays: Ecosystem Health Assessment; Maryland Department of Natural Resources: Annapolis, MD, USA, 2004; pp. 1–9. [Google Scholar]
  24. Boynton, W.R.; Murray, L.; Hagy, J.D.; Stokes, C.; Kemp, W.M. A comparative analysis of eutrophication patterns in a temperate coastal lagoon. Estuaries 1996, 19, 408–421. [Google Scholar] [CrossRef]
  25. Aighewi, I.T.; Nosakhare, O.K.; Ishaque, A.B. Land use–Land cover changes and sewage loading in the lower eastern shore watersheds and coastal bays of Maryland: Implications for surface water quality. J. Coast. Res. 2013, 29, 1073–1082. [Google Scholar] [CrossRef]
  26. Oseji, O.F.; Fan, C.; Chigbu, P. Composition and dynamics of phytoplankton in the Coastal Bays of Maryland revealed by microscopic counts and diagnostic pigments. Water 2019, 11, 368. [Google Scholar] [CrossRef]
  27. Morales-Núñez, A.G.; Chigbu, P. Abundance, distribution, and species composition of amphipods associated with macroalgae from shallow waters of the Maryland Coastal Bays, USA. Mar. Biodivers. 2019, 49, 175–191. [Google Scholar] [CrossRef]
  28. Wyanski, D.M. Patterns of Habitat Utilization in 0-Age Summer Flounder (Paralichthys dentatus). Master’s Thesis, William & Mary, Williamsburg, VA, USA, 1990. [Google Scholar] [CrossRef]
  29. Pacheco, A.L. Age and growth of spot in lower Chesapeake Bay, with notes on distribution and abundance of juveniles in the York River system. Chesap. Sci. 1962, 3, 18–28. [Google Scholar] [CrossRef]
  30. Grammer, G.L.; Brown-Peterson, N.J.; Peterson, M.S.; Comyns, B.H. Life history of silver perch Bairdiella chrysoura (Lacepede, 1803) in north-central Gulf of Mexico estuaries. Gulf Mex. Sci. 2009, 27, 7. [Google Scholar] [CrossRef]
  31. Bassista, T.P.; Hartman, K.J. Reproductive biology and egg mortality of bay anchovy, Anchoa mitchilli, in the Hudson River estuary. Environ. Biol. Fishes 2005, 73, 49–59. [Google Scholar] [CrossRef]
  32. Sulzman, E.W. Stable isotope chemistry and measurement: A primer. Stable Isot. Ecol. Environ. Sci. 2007, 2, 1–21. [Google Scholar]
  33. Edje, B.O.; Chigbu, P. Carbon and nitrogen stable isotopes of copepods in a tidal estuarine system in Maryland, USA. Reg. Stud. Mar. Sci. 2021, 42, 101620. [Google Scholar] [CrossRef]
  34. Minagawa, M.; Wada, E. Stepwise enrichment of 15N along food chains: Further evidence and the relation between δ15N and animal age. Geochim. Cosmochim. Acta 1984, 48, 1135–1140. [Google Scholar] [CrossRef]
  35. Mill, A.C. Stable isotope data as reef food-web descriptors in a dynamic tropical environment. Doctoral Dissertation, Newcastle University, Newcastle upon Tyne, UK, 2007. [Google Scholar]
  36. Skinner, M.M.; Martin, A.A.; Moore, B.C. Is lipid correction necessary in the stable isotope analysis of fish tissues? Rapid Commun. Mass Spectrom. 2016, 30, 881–889. [Google Scholar] [CrossRef] [PubMed]
  37. D’Ambra, I.; Graham, W.M.; Carmichael, R.H.; Hernandez, F.J., Jr. Dietary overlap between jellyfish and forage fish in the northern Gulf of Mexico. Mar. Ecol. Prog. Ser. 2018, 587, 31–40. [Google Scholar] [CrossRef]
  38. Matley, J.K.; Tobin, A.J.; Simpfendorfer, C.A.; Fisk, A.T.; Heupel, M.R. Trophic niche and spatio-temporal changes in the feeding ecology of two sympatric species of coral trout (Plectropomus leopardus and P. laevis). Mar. Ecol. Prog. Ser. 2017, 563, 197–210. [Google Scholar] [CrossRef]
  39. Cybulski, J.D.; Skinner, C.; Wan, Z.; Wong, C.K.; Toonen, R.J.; Gaither, M.R.; Soong, K.; Wyatt, A.S.; Baker, D.M. Improving stable isotope assessments of inter-and intra-species variation in coral reef fish trophic strategies. Ecol. Evol. 2022, 12, e9221. [Google Scholar] [CrossRef] [PubMed]
  40. France, R.L. Carbon-13 enrichment in benthic compared to planktonic algae: Food web implications. Mar. Ecol. Prog. Ser. 1995, 124, 307–312. [Google Scholar] [CrossRef]
  41. Adams, D.H.; Paperno, R. Stable isotopes and mercury in a model estuarine fish: Multibasin comparisons with water quality, community structure, and available prey base. Sci. Total Environ. 2012, 414, 445–455. [Google Scholar] [CrossRef] [PubMed]
  42. Buchheister, A. Stable isotope dynamics in summer flounder tissues, with application to dietary assessments in Chesapeake Bay. Master’s Thesis, William & Mary, Williamsburg, VA, USA, 2008. [Google Scholar]
  43. Chouvelon, T.; Caurant, F.; Cherel, Y.; Simon-Bouhet, B.; Spitz, J.; Bustamante, P. Species-and size-related patterns in stable isotopes and mercury concentrations in fish help refine marine ecosystem indicators and provide evidence for distinct management units for hake in the Northeast Atlantic. ICES J. Mar. Sci. 2014, 7, 1073–1087. [Google Scholar] [CrossRef]
  44. MacKenzie, K.M.; Trueman, C.N.; Palmer, M.R.; Moore, A.; Ibbotson, A.T.; Beaumont, W.R.; Davidson, I.C. Stable isotopes reveal age-dependent trophic level and spatial segregation during adult marine feeding in populations of salmon. ICES J. Mar. Sci. 2012, 69, 1637–1645. [Google Scholar] [CrossRef]
  45. Kostecki, C.; Le Loc’h, F.; Roussel, J.M.; Desroy, N.; Huteau, D.; Riera, P.; Le Bris, H.; Le Pape, O. Dynamics of an estuarine nursery ground: The spatio-temporal relationship between the river flow and the food web of the juvenile common sole (Solea solea, L.) as revealed by stable isotopes analysis. J. Sea Res. 2010, 64, 54–60. [Google Scholar] [CrossRef]
  46. Edje, B.O.; Ishaque, A.B.; Chigbu, P. Spatial and Temporal Patterns of δ13C and δ15N of Suspended Particulate Organic Matter in Maryland Coastal Bays, USA. Water 2020, 12, 2345. [Google Scholar] [CrossRef]
  47. Brush, J.M.; Fisk, A.T.; Hussey, N.E.; Johnson, T.B. Spatial and seasonal variability in the diet of round goby (Neogobius melanostomus): Stable isotopes indicate that stomach contents overestimate the importance of dreissenids. Can. J. Fish. Aquat. Sci. 2012, 69, 573–586. [Google Scholar] [CrossRef]
  48. Kang, S.; Kim, J.H.; Kim, D.; Song, H.; Ryu, J.S.; Ock, G.; Shin, K.H. Temporal variation in riverine organic carbon concentrations and fluxes in two contrasting estuary systems: Geum and Seomjin, South Korea. Environ. Int. 2019, 133, 105126. [Google Scholar] [CrossRef] [PubMed]
  49. Sacco, M.; Blyth, A.J.; Humphreys, W.F.; Cooper, S.J.B.; White, N.E.; Campbell, M.; Mousavi-Derazmahalleh, M.; Hua, Q.; Mazumder, D.; Smith, C.; et al. Rainfall as a trigger of ecological cascade effects in an Australian groundwater ecosystem. Sci. Rep. 2021, 11, 3694. [Google Scholar] [CrossRef] [PubMed]
  50. Kim, D.; Won, E.J.; Cho, H.E.; Lee, J.; Shin, K.H. New insight into biomagnification factor of mercury based on food web structure using stable isotopes of amino acids. Water Res. 2023, 245, 120591. [Google Scholar] [CrossRef]
  51. St. John Glew, K.; Graham, L.J.; McGill, R.A.; Trueman, C.N. Spatial models of carbon, nitrogen and sulphur stable isotope distributions (isoscapes) across a shelf sea: An INLA approach. Methods Ecol. Evol. 2019, 10, 518–531. [Google Scholar] [CrossRef]
  52. Oseji, O.F.; Chigbu, P.; Oghenekaro, E.; Waguespack, Y.; Chen, N. Spatial and temporal patterns of phytoplankton composition and abundance in the Maryland Coastal Bays: The influence of freshwater discharge and anthropogenic activities. Estuar. Coast. Shelf Sci. 2018, 207, 119–131. [Google Scholar] [CrossRef]
  53. Estrada, J.A.; Lutcavage, M.; Thorrold, S.R. Diet and trophic position of Atlantic bluefin tuna (Thunnus thynnus) inferred from stable carbon and nitrogen isotope analysis. Mar. Biol. 2005, 147, 37–45. [Google Scholar] [CrossRef]
  54. O’Brien, M.H.P. Marine influence on juvenile fish trophic ecology and community dynamics in Maryland’s northern coastal lagoons. Master’s Thesis, University of Maryland, College Park, MD, USA, 2013. [Google Scholar]
  55. Mancinelli, G.; Glamuzina, B.; Petrić, M.; Carrozzo, L.; Glamuzina, L.; Zotti, M.; Raho, D.; Vizzini, S. The trophic position of the Atlantic blue crab Callinectes sapidus Rathbun 1896 in the food web of Parila Lagoon (South Eastern Adriatic, Croatia): A first assessment using stable isotopes. Mediterr. Mar. Sci. 2016, 17, 634–643. [Google Scholar] [CrossRef]
  56. Ou, C.; Montaña, C.G.; Winemiller, K.O. Body size–trophic position relationships among fishes of the lower Mekong basin. R. Soc. Open Sci. 2017, 4, 160645. [Google Scholar] [CrossRef] [PubMed]
  57. Cummings, D.O.; Buhl, J.; Lee, R.W.; Simpson, S.J.; Holmes, S.P. Estimating niche width using stable isotopes in the face of habitat variability: A modelling case study in the marine environment. PLoS ONE 2012, 7, e40539. [Google Scholar] [CrossRef]
  58. Gaspar, C.; Giménez, J.; Andonegi, E.; Astarloa, A.; Chouvelon, T.; Franco, J.; Goñi, N.; Corrales, X.; Spitz, J.; Bustamante, P.; et al. Trophic ecology of northern gannets Morus bassanus highlights the extent of isotopic niche overlap with other apex predators within the Bay of Biscay. Mar. Biol. 2022, 169, 105. [Google Scholar] [CrossRef]
  59. Flaherty, E.A.; Ben-David, M. Overlap and partitioning of the ecological and isotopic niches. Oikos 2010, 119, 1409–1416. [Google Scholar] [CrossRef]
  60. Shaw, A. Dietary niche overlap of an estuarine predatory fish community in South Carolina assessed by stable isotope analysis. Master’s Thesis, College of Charleston, Charleston, SC, USA, 2013. [Google Scholar]
  61. Pelage, L.; Lucena-Fredou, F.; Eduardo, L.N.; Le Loc’h, F.; Bertrand, A.; Lira, A.S.; Fredou, T. Competing with each other: Fish isotopic niche in two resource availability contexts. Front. Mar. Sci. 2022, 9, 975091. [Google Scholar] [CrossRef]
  62. Gonzalez, J.G.; Ménard, F.; Le Loc’h, F.; De Andrade, H.A.; Viana, A.P.; Ferreira, V.; Frédou, F.L.; Lira, A.S.; Munaron, J.M.; Frédou, T. Trophic resource partitioning of two snook fish species (Centropomidae) in tropical estuaries in Brazil as evidenced by stable isotope analysis. Estuar. Coast. Shelf Sci. 2019, 226, 106287. [Google Scholar] [CrossRef]
  63. Wang, Y.; Huan, Z.; YuWei, C.; Lu, Z.; Guangchun, L. Trophic niche width and overlap of three benthic living fish species in Poyang Lake: A stable isotope approach. Wetlands 2019, 39, 17–23. [Google Scholar] [CrossRef]
  64. Parra, G.J.; Wojtkowiak, Z.; Peters, K.J.; Cagnazzi, D. Isotopic niche overlap between sympatric Australian snubfin and humpback dolphins. Ecol. Evol. 2022, 12, e8937. [Google Scholar] [CrossRef]
Figure 1. Map of Maryland’s coastal bays showing sampling sites 1–13.
Diversity 16 00331 g001
Figure 2. Annual biplots of δ13C and δ15N of fish species in 2017 (a) and 2018 (b). PD—P. dentatus (2017, n = 140; 2018, n = 90), AM—A. mitchilli (2017, n = 16; 2018, n = 44), LX—L. xanthurus (2017, n = 41; 2018, n = 21), and BC—B. chrysoura (2017, n = 53; 2018, n = 50).
Diversity 16 00331 g002
Figure 3. Seasonal biplots of δ13C and δ15N for the fish in 2017 (a) and 2018 (b,c). PD—P. dentatus (summer 2017, n = 83; summer 2018, n = 67; fall 2018 n = 21), AM—A. mitchilli (summer 2018, n = 16; fall 2018, n = 28), LX—L. xanthurus (summer 2018, n = 13; fall 2018, n = 7), and BC—B. chrysoura (summer 2017, n = 49; summer 2018, n = 27; fall 2018, n = 23).
Diversity 16 00331 g003
Figure 4. Spatial biplots of δ13C and δ15N for the fish in 2017 (a,b) and 2018 (c,d). PD—P. dentatus (2017 north, n = 51; 2017 south, n = 89; 2018 north, n = 21; 2018 south, n = 67), AM—A. mitchilli (2018 north, n = 20; 2018 south, n = 24), LX—L. xanthurus (2017 north, n = 13; 2017 south, n = 28; 2018 north, n = 11; 2018 south, n = 9), and BC—B. chrysoura (2017 north, n = 20; 2017 south, n = 29; 2018 north, n = 41; 2018 south, n = 9). Trophic levels and isotopic niches of the four MCB fish species.
Diversity 16 00331 g004
Figure 5. Isotopic niche width based on carbon (δ13C) and (δ15N) values of the four MCB fish species (Group 1—P. dentatus, Group 2—A. mitchilli, Group 3—L. xanthurus, and Group 4—B. chrysoura).
Diversity 16 00331 g005
Table 1. A summary of the number (n) and total length (mean, minimum, maximum) of each fish species used in the stable isotope analyses of diet of fishes in Maryland coastal bays (a dash indicates there were either no length data or not enough data for that year and/or location).
2017 (April–October)2018 (June–October)
Mean ± SE (n); Range (cm)Mean ± SE (n); Range (cm)
P. dentatus11.9 ± 0.5 (141); 5.5–39.511.7 ± 0.4 (90); 7.2–33.0
A. mitchilli7.3 ± 0.3 (16); 6.1–12.16.2 ± 0.2 (44); 4.0–9.9
L. xanthurus11.4 ± 0.4 (41); 7.1–16.513.7 ± 0.5 (21); 8.5–18.3
B. chrysoura8.4 ± 0.2 (53); 5.5–11.28.7 ± 0.2 (50); 4.5–15.0
2017 (North MCBs)2017 (South MCBs)
Mean ± SE (n); Range (cm)Mean ± SE (n); Range (cm)
P. dentatus12.0 ± 0.8 (51); 7.7–39.511.9 ± 0.6 (90); 5.5–35.0
A. mitchilli-7.3 ± 0.3 (16); 6.1–12.1
L. xanthurus13.6 ± 0.4 (13); 12.0–16.510.4 ± 0.4 (28); 7.1–16.3
B. chrysoura8.5 ± 0.3 (24); 5.9–11.28.3 ± 0.2 (29); 5.5–10.5
2018 (North MCBs)2018 (South MCBs)
Mean ± SE (n); Range (cm)Mean ± SE (n); Range (cm)
P. dentatus12.0 ± 1.2 (21); 7.6–33.011.5 ± 0.4 (69); 7.2–32.4
A. mitchilli6.5 ± 0.2 (20); 4.0–8.35.9 ± 0.3 (24); 4.0–9.9
L. xanthurus13.4 ± 0.7 (11); 11.5–18.313.9 ± 0.7 (10); 8.5–15.7
B. chrysoura8.6 ± 0.3 (41); 4.5–15.09.3 ± 0.8 (9); 6.0–13.9
Table 2. Mean values ± standard error of δ13C and δ15N values in fish species from MCBs collected in 2017 and 2018. δ13C and δ15N isotopic values of fish species with similar letters within each year are not significantly different (p > 0.05).
2017201720182018
δ13Cδ15Nδ13Cδ15N
P. dentatus−18.7 ± 0.1 a10.9 ± 0.1 c−19.1 ± 0.1 a10.7 ± 0.1 b
A. mitchilli−18.9 ± 0.3 a13.0 ± 0.2 a−19.5 ± 0.2 c12.5 ± 0.2 a
L. xanthurus−17.2 ± 0.3 b10.2 ± 0.2 d−18.8 ± 0.5 c12.4 ± 0.2 a
B. chrysoura−18.0 ± 0.2 a11.5 ± 0.1 b−19.4 ± 0.2 b12.0 ± 0.1 a
p-value<0.001<0.0010.013<0.001
Table 3. Mean values ± standard error of δ13C and δ15N in fish species from MCBs collected in 2017 and 2018. δ13C and δ15N isotopic values of fish species with similar letters between years are not significantly different (p > 0.05) as in Table 2.
20172018 20172018
δ13Cδ13Cp-Valueδ15Nδ15Np-Value
P. dentatus−18.7 ± 0.1 a−19.1 ± 0.1 b<0.0510.9 ± 0.1 a10.7 ± 0.1 a>0.05
A. mitchilli−18.9 ± 0.3 a−19.5 ± 0.2 b<0.0513.0 ± 0.2 a12.5 ± 0.2 b<0.05
L. xanthurus−17.2 ± 0.3 a−18.8 ± 0.5 b<0.0510.2 ± 0.2 a12.4 ± 0.2 b<0.05
B. chrysoura−18.0 ± 0.2 a−19.5 ± 0.2 b<0.0511.5 ± 0.1 a12.0 ± 0.1 b<0.05
Table 4. Mean ± standard error of δ13C and δ15N values of fish species collected in the northern and southern MCBs in 2017 and 2018 (a dash indicates there were either no isotopic data or not enough data for that location). For each species and year, values in the north and south bays with similar letters were not significantly different.
20172018
δ13Cδ13C
NorthSouthp-ValueNorthSouthp-Value
P. dentatus−19.1 ± 0.1 a−18.4 ± 0.1 b<0.05−19.6 ± 0.1 a−18.9 ± 0.1 b<0.001
A. mitchilli-−18.9 ± 0.3-−19.4 ± 0.4 a−19.6 ± 0.2 a>0.05
L. xanthurus−17.4 ± 0.6 a−17.0 ± 0.3 a>0.05−19.3 ± 0.8 a−18.3 ± 0.7 a>0.05
B. chrysoura−18.5 ± 0.3 a−17.6 ± 0.2 b<0.05−19.8 ± 0.2 a−17.8 ± 0.3 b<0.001
δ15Nδ15N
NorthSouthp-valueNorthSouthp-value
P. dentatus11.4 ± 0.2 a10.6 ± 0.1 b<0.0511.9 ± 0.2 a10.4 ± 0.1 b<0.05
A. mitchilli-13.0 ± 0.2 12.7 ± 0.3 a12.3 ± 0.2 a>0.05
L. xanthurus11.3 ± 0.2 a9.7 ± 0.3 b<0.0512.9 ± 0.2 a11.9 ± 0.3 a>0.05
B. chrysoura11.8 ± 0.1 a11.2 ± 0.2 b<0.0512.1 ± 0.1 a11.7 ± 0.1 a>0.05
Table 5. Standard ellipse area (SEA) and standard ellipse corrected area (SEAc) for the four MCB fish species.
SpeciesSEA (δ2)SEAc (δ2)
P. dentatus4.24.3
A. mitchilli3.83.8
L. xanthurus10.610.8
B. chrysoura44
Table 6. Percentage area overlap between the SEA of the four MCB fish species. (The table should be read horizontally. For example, the ellipse for P. dentatus overlaps the ellipse for A. mitchilli by 20.1%, whereas the ellipse of A. mitchilli overlaps the ellipse of P. dentatus by 22.2%.)
P. dentatusA. mitchilliL. xanthurusB. chrysoura
P. dentatus 20.157.249.8
A. mitchilli22.2 76.448.5
L. xanthurus22.727.4 33.6
B. chrysoura52.346.189.1
Disclaimer/Publisher’s Note: The statements, opinions and data contained in all publications are solely those of the individual author(s) and contributor(s) and not of MDPI and/or the editor(s). MDPI and/or the editor(s) disclaim responsibility for any injury to people or property resulting from any ideas, methods, instructions or products referred to in the content.